
Last updated: November 10, 2026
Overview
Export (.pptx) turns a Reporting Dashboard into a PowerPoint deck you can present, edit and send on. The deck opens with a title slide and gives every widget its own slide, with the widget's time range and site under its title. Charts arrive as real PowerPoint charts, numbers as text, and tables as PowerPoint tables, so you can change a colour, fix a label or add a comment in PowerPoint instead of rebuilding the slide from a screenshot.
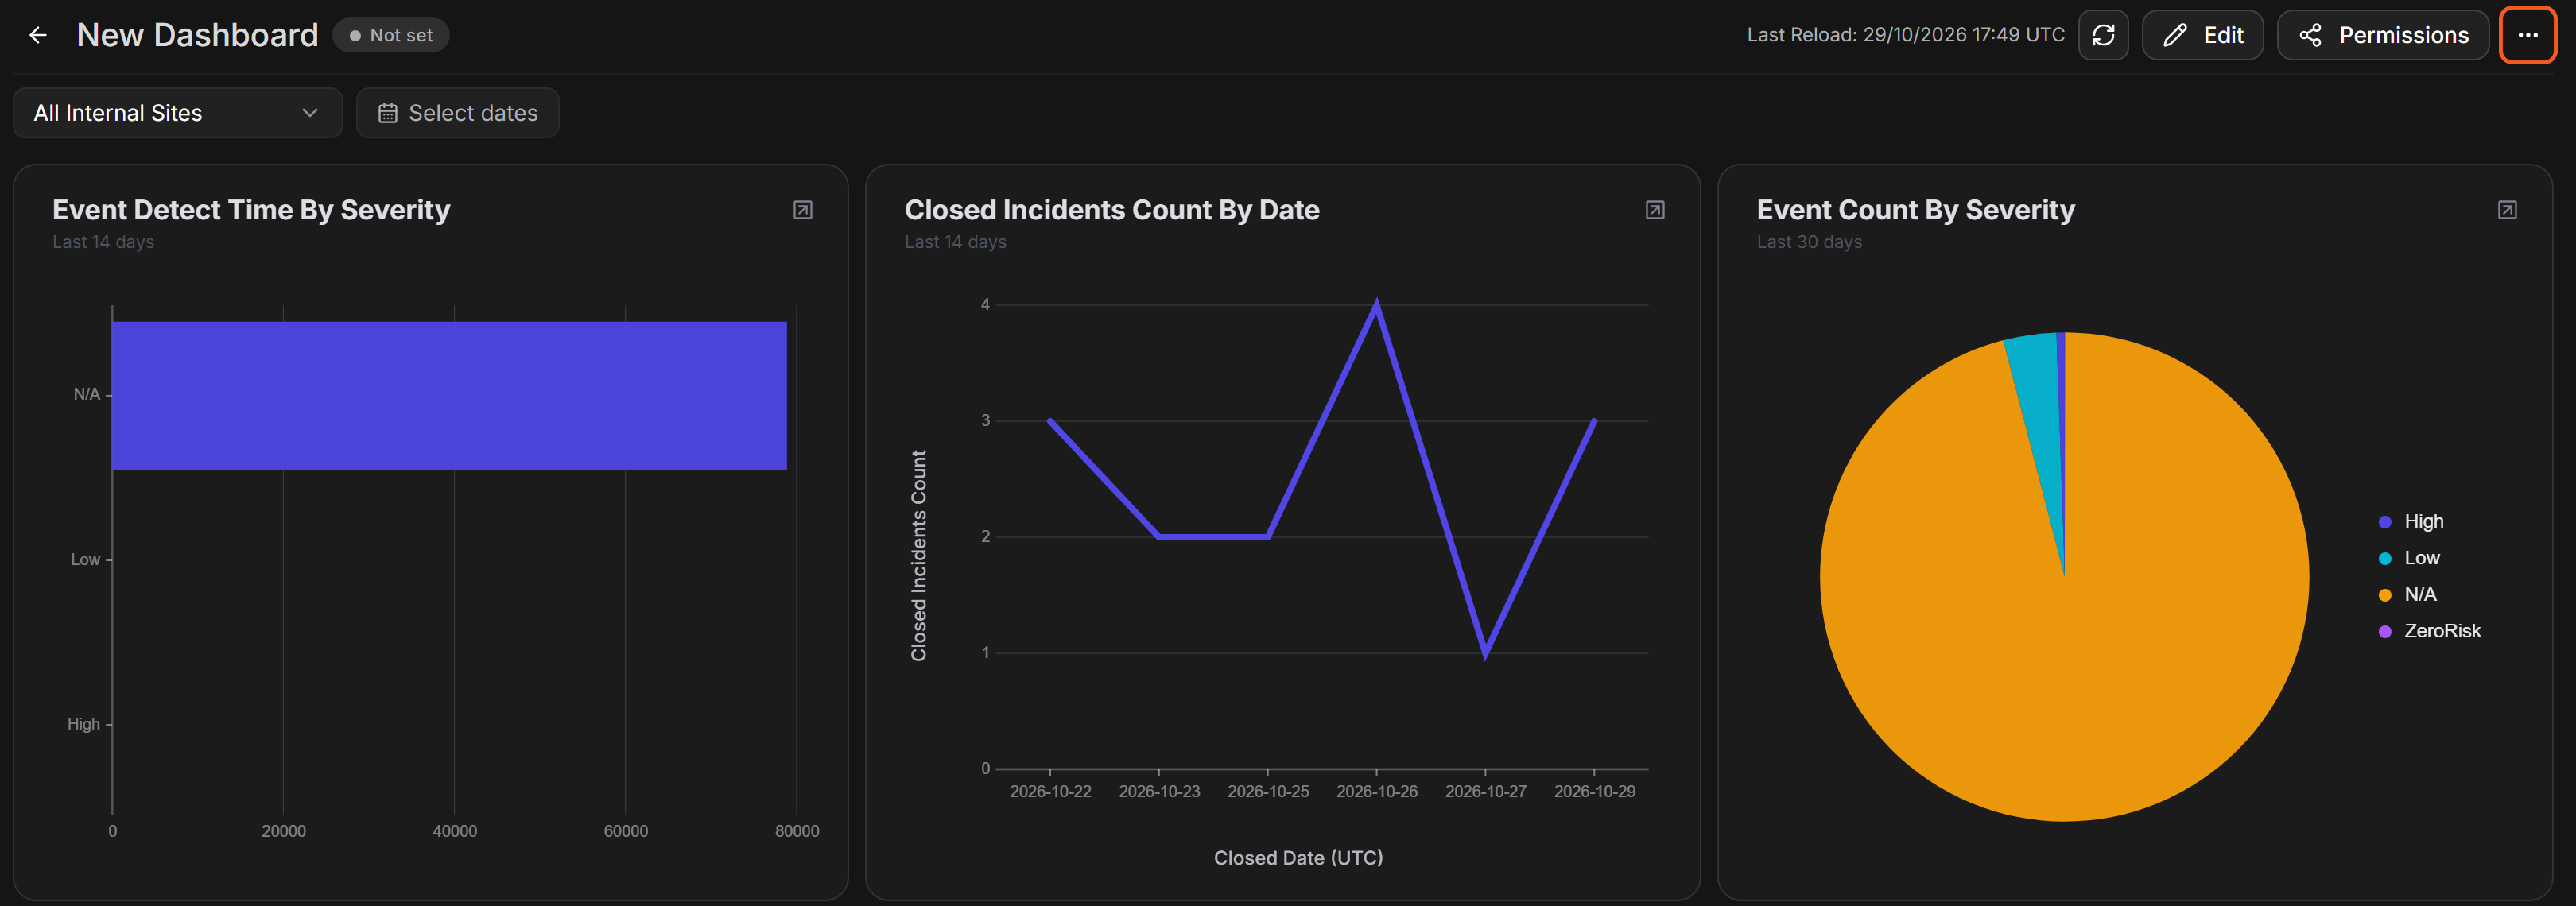
A dashboard and its More actions button
In short
|
Stage |
Where it happens |
|---|---|
|
Open the dashboard |
Configuration > Reporting Dashboard > Dashboards > a dashboard |
|
Start the export |
More actions (...) > Export (.pptx), or Export > Export (.pptx) on a dashboard you can only view |
|
Check what will be editable, and name the report |
The Export (.pptx) window |
|
Get the file |
Your browser's downloads, named after the report |
Who Can Export
Anyone who can open a dashboard can export it. Where the command sits depends on whether you can edit the dashboard:
|
Your access to the dashboard |
Where Export (.pptx) is |
|---|---|
|
You can edit it |
More actions (...) at the top right, next to Export (.png) and Export (.pdf) |
|
You can only view it |
The Export button at the top right |
Exporting needs no permission of its own: anyone who can open the dashboard can export it. Only where the command sits changes with your access.
Exporting a Dashboard
Exporting takes the dashboard as it is on screen, with the site and dates currently selected, and saves it as a .pptx file you can open in PowerPoint.
Exporting a dashboard, step by step
-
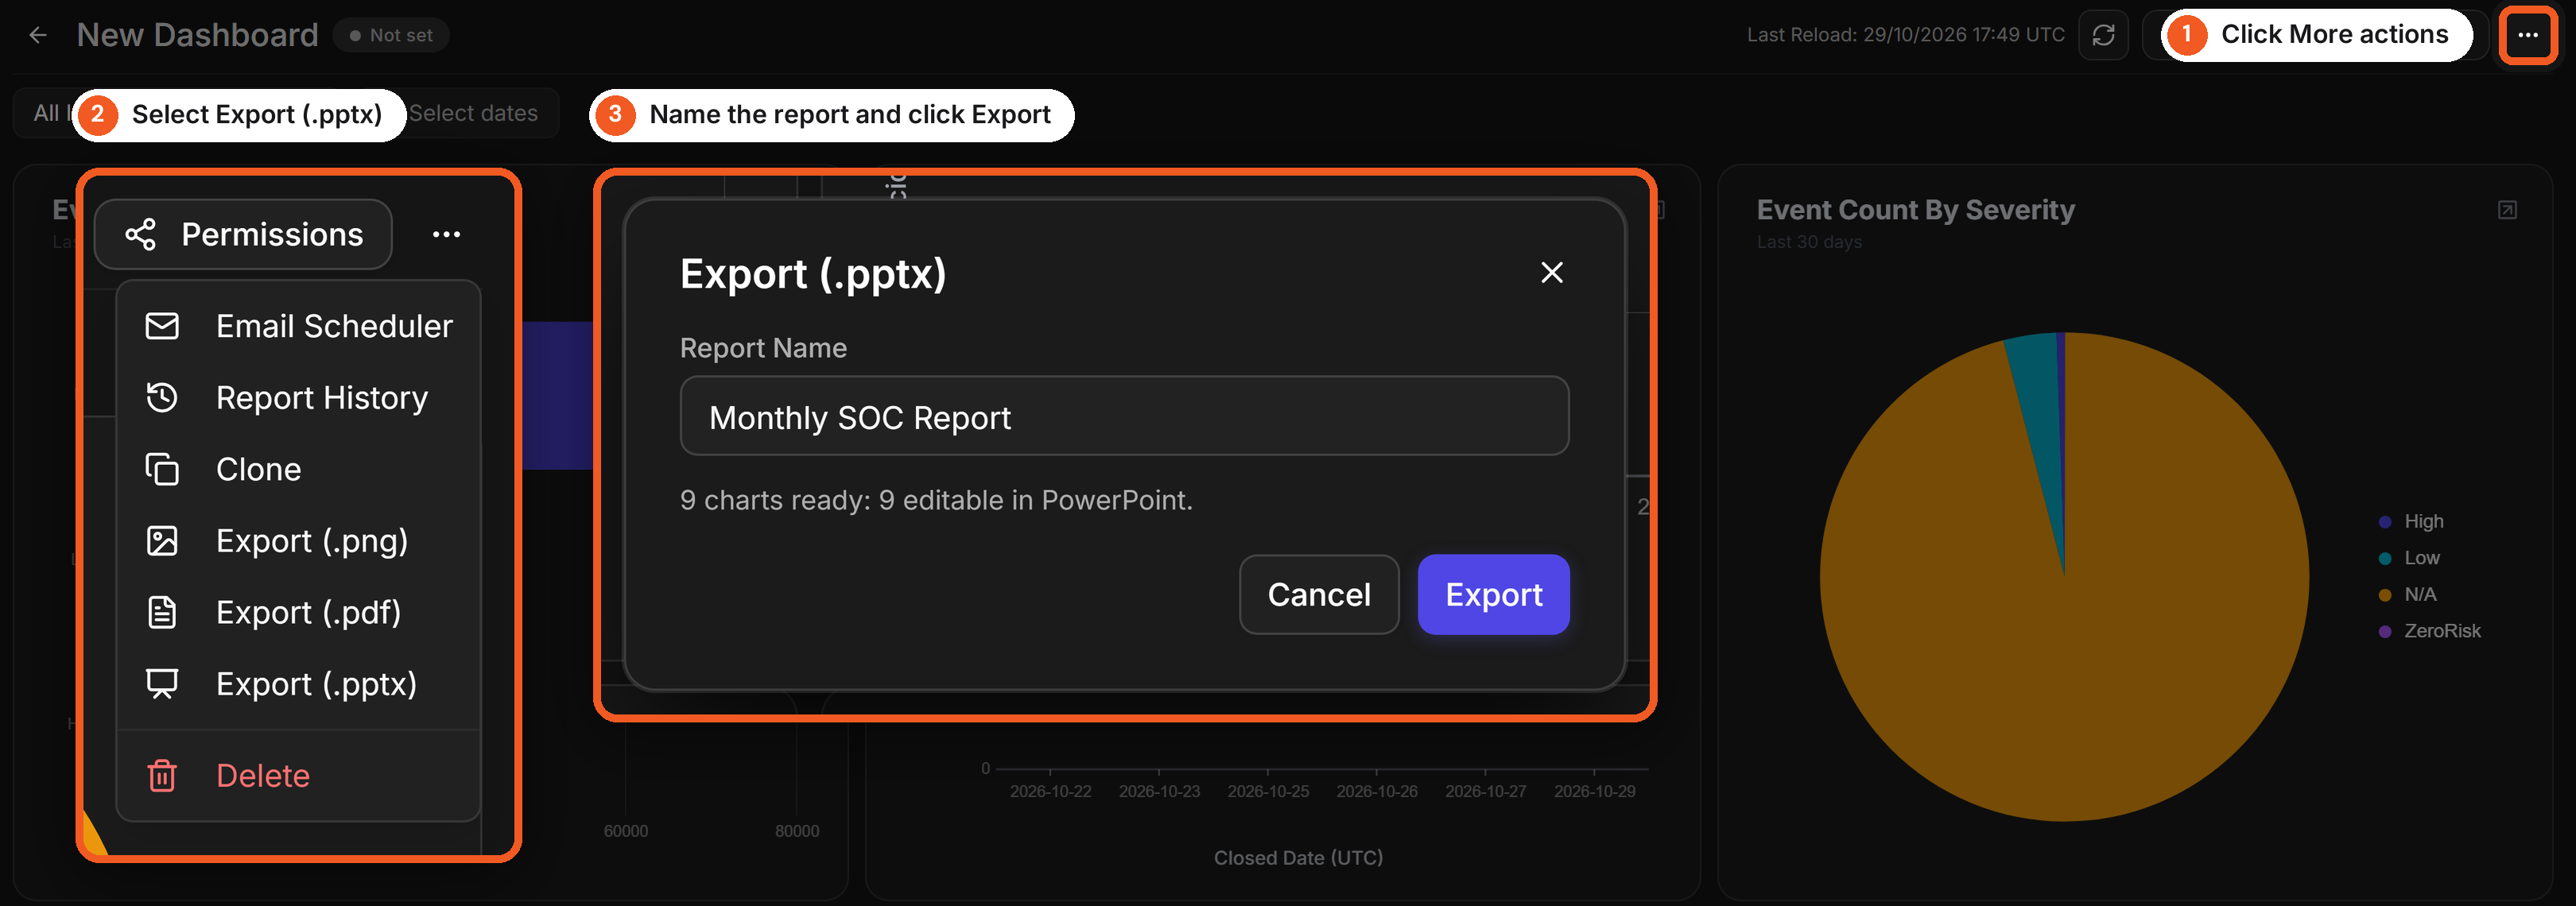
Go to Configuration > Reporting Dashboard > Dashboards, and open the dashboard.
-
Select the site and the dates you want the report to cover.
-
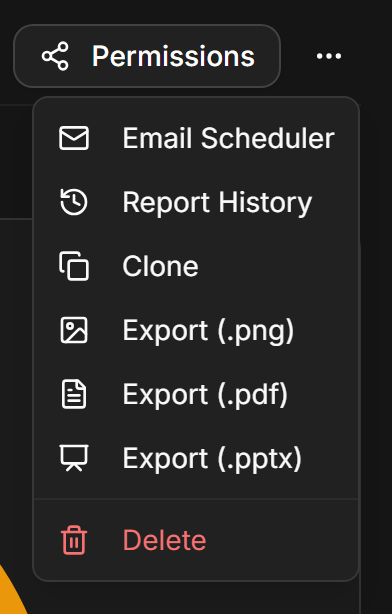
Select More actions (...) > Export (.pptx). On a dashboard you can only view, select Export > Export (.pptx).
Export (.pptx) in More actions
-
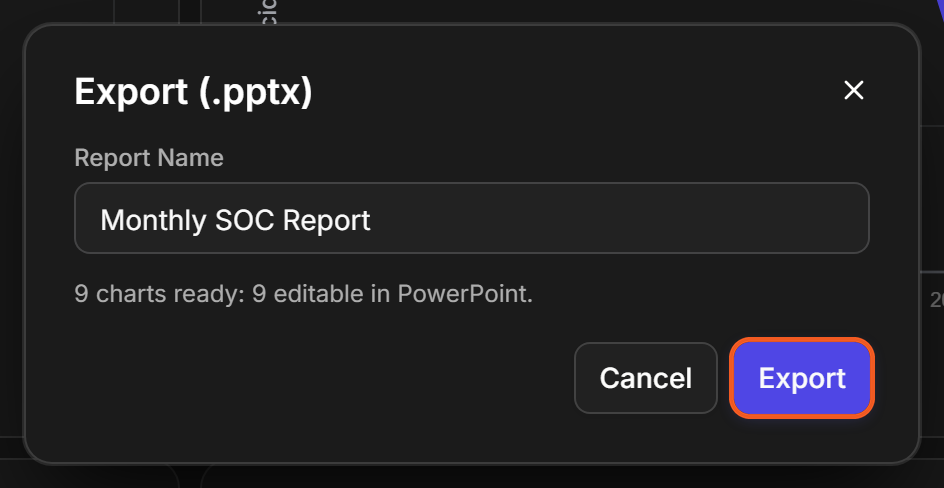
Wait for the line under Report Name to say how many charts are ready. While it reads Preparing charts..., Export is unavailable.
-
In Report Name, enter the name for the title slide and the file. It starts as the dashboard's name and takes up to 120 characters.
-
Select Export.
The Export (.pptx) window
RESULT
The file downloads as Report Name_date_time.pptx, and a Download Complete message names it.
Download Complete

READER NOTE
Keep the browser tab in front while the window prepares the charts. Preparation pauses while the tab is hidden and carries on when you come back to it.
Reading the Export Window
The line under Report Name tells you, before you export, how each widget will arrive in PowerPoint:
|
The line says |
What you get in PowerPoint |
|---|---|
|
editable in PowerPoint |
A chart, text or table you can edit |
|
as pictures (not editable in PowerPoint) |
A picture of the widget, for the few chart types PowerPoint cannot draw |
|
with no data for the period |
A slide that says No data for this period instead of an empty chart |
When a site in a multi-site dashboard does not answer in time, the window adds a line naming it, for example Partial data: (site) did not respond. The deck itself never mentions this, so check the line before you send the file on.
The deck is still complete for every site that did answer, so you can send it on once you have said which sites are missing. To get the full picture, export again when the site is reachable; if it keeps missing, it is the site's connection that needs looking at, not the export.
What the Deck Contains
Every deck follows the same order: one title slide, then one slide per widget, in the order the dashboard shows them. Each widget slide has the widget's title, a line with its time range and site, and the page number.
The Title Slide
The title slide shows Reporting Dashboard, the report name, the Site, when it was Exported, and the number of Tiles. A long report name is set smaller and wraps onto more lines, so it always fits on the slide.
The title slide

Chart Slides
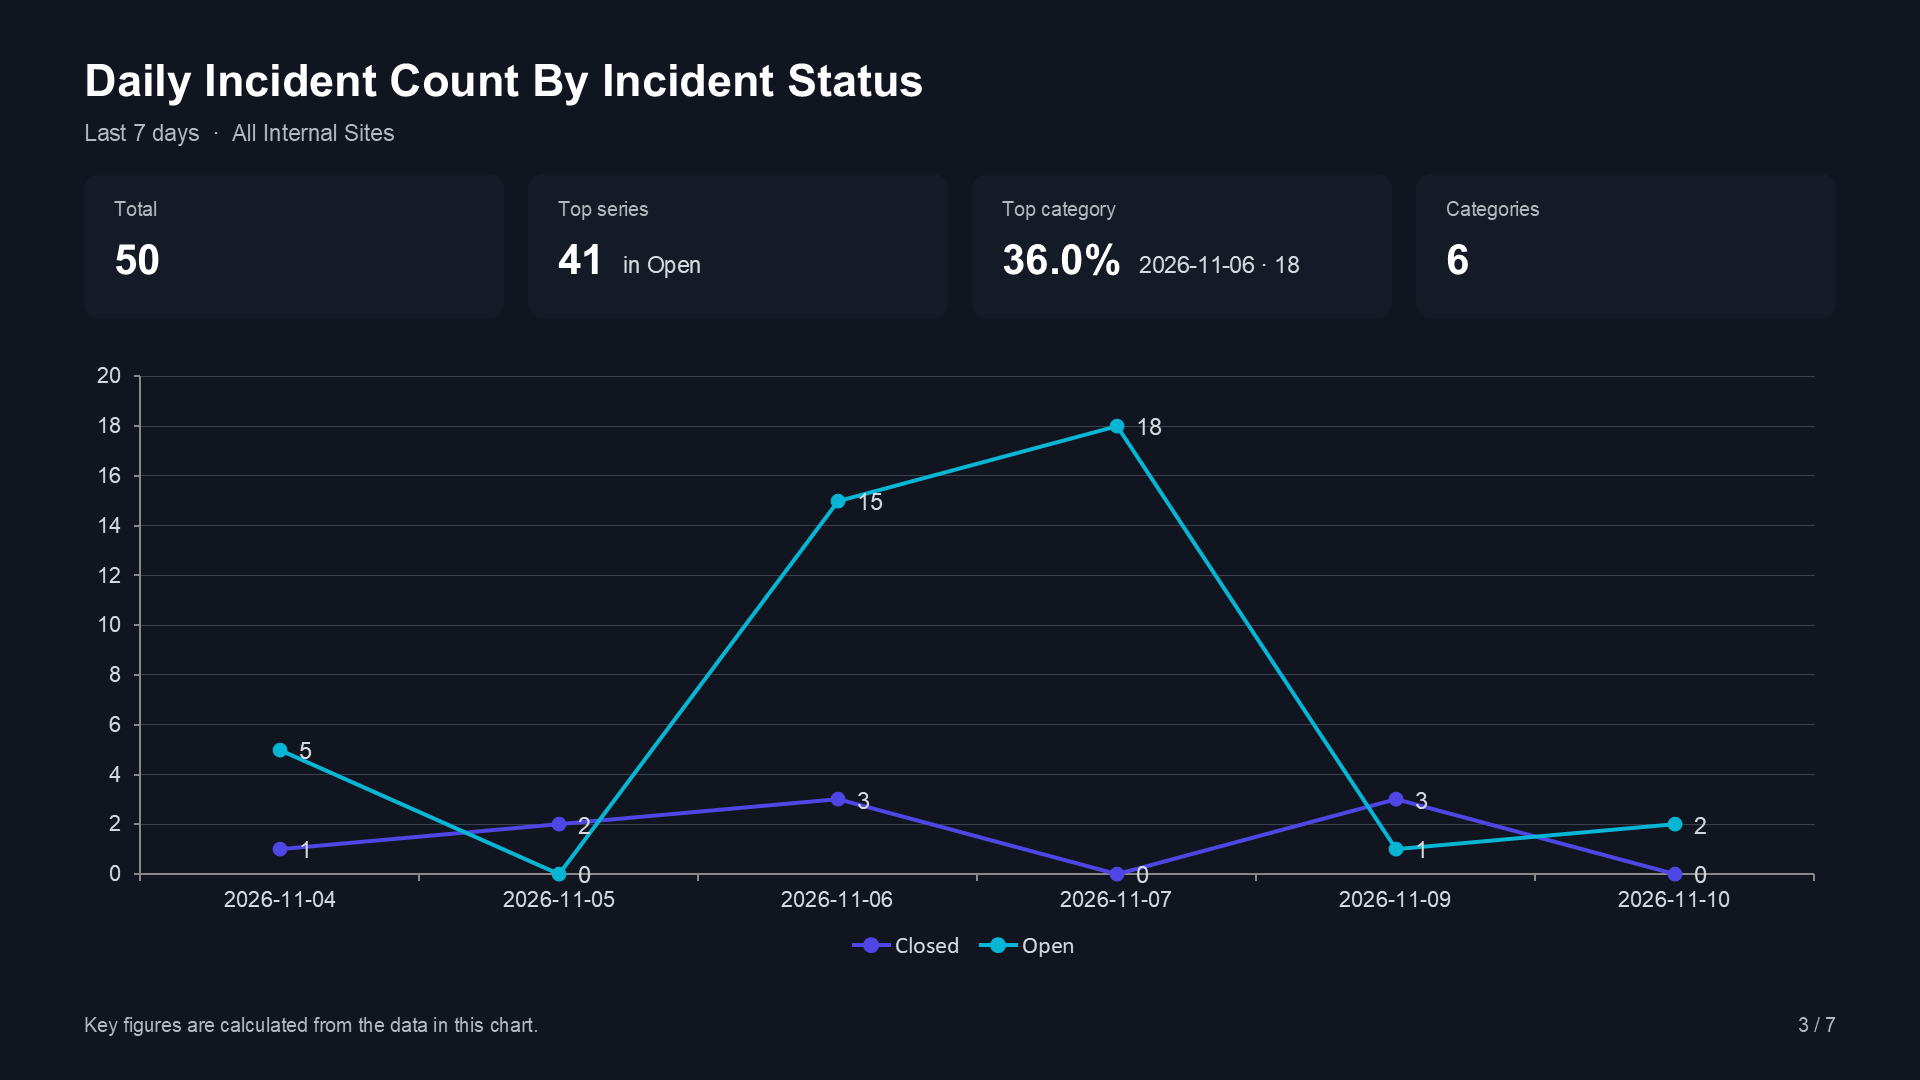
Bar, column, line, area, pie, doughnut and radar charts arrive as PowerPoint charts. Above each chart, up to four key figures sum it up. They are worked out only from the numbers in that chart, so they always agree with it:
|
Chart |
Key figures you can expect |
|---|---|
|
Line or area over time |
Total, Peak with its date, Average a day, Days with data |
|
Pie or doughnut |
Total (counts and sums only), Largest and Next with their share, Smallest |
|
Column or bar |
Total, the top series and the top category, the number of Categories |
A Total appears only where adding the values up makes sense, on a widget that counts or sums. A widget that averages shows Highest and Lowest instead. Empty bars carry no 0 label, and a category with no name reads (blank).
A chart slide with its key figures
Number Slides
Number widgets arrive as large text, up to four on one slide, with thousands separators. A count over a range of days also shows its average per day.
Number widgets on one slide
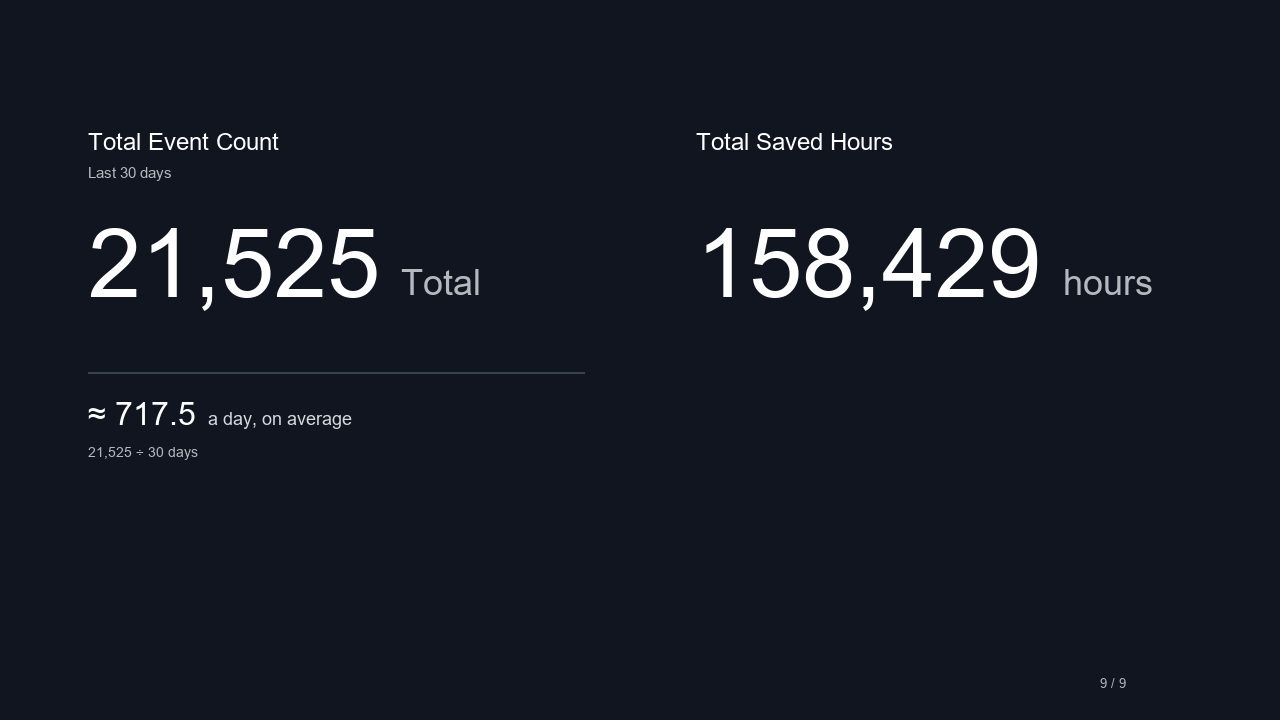
Table Slides
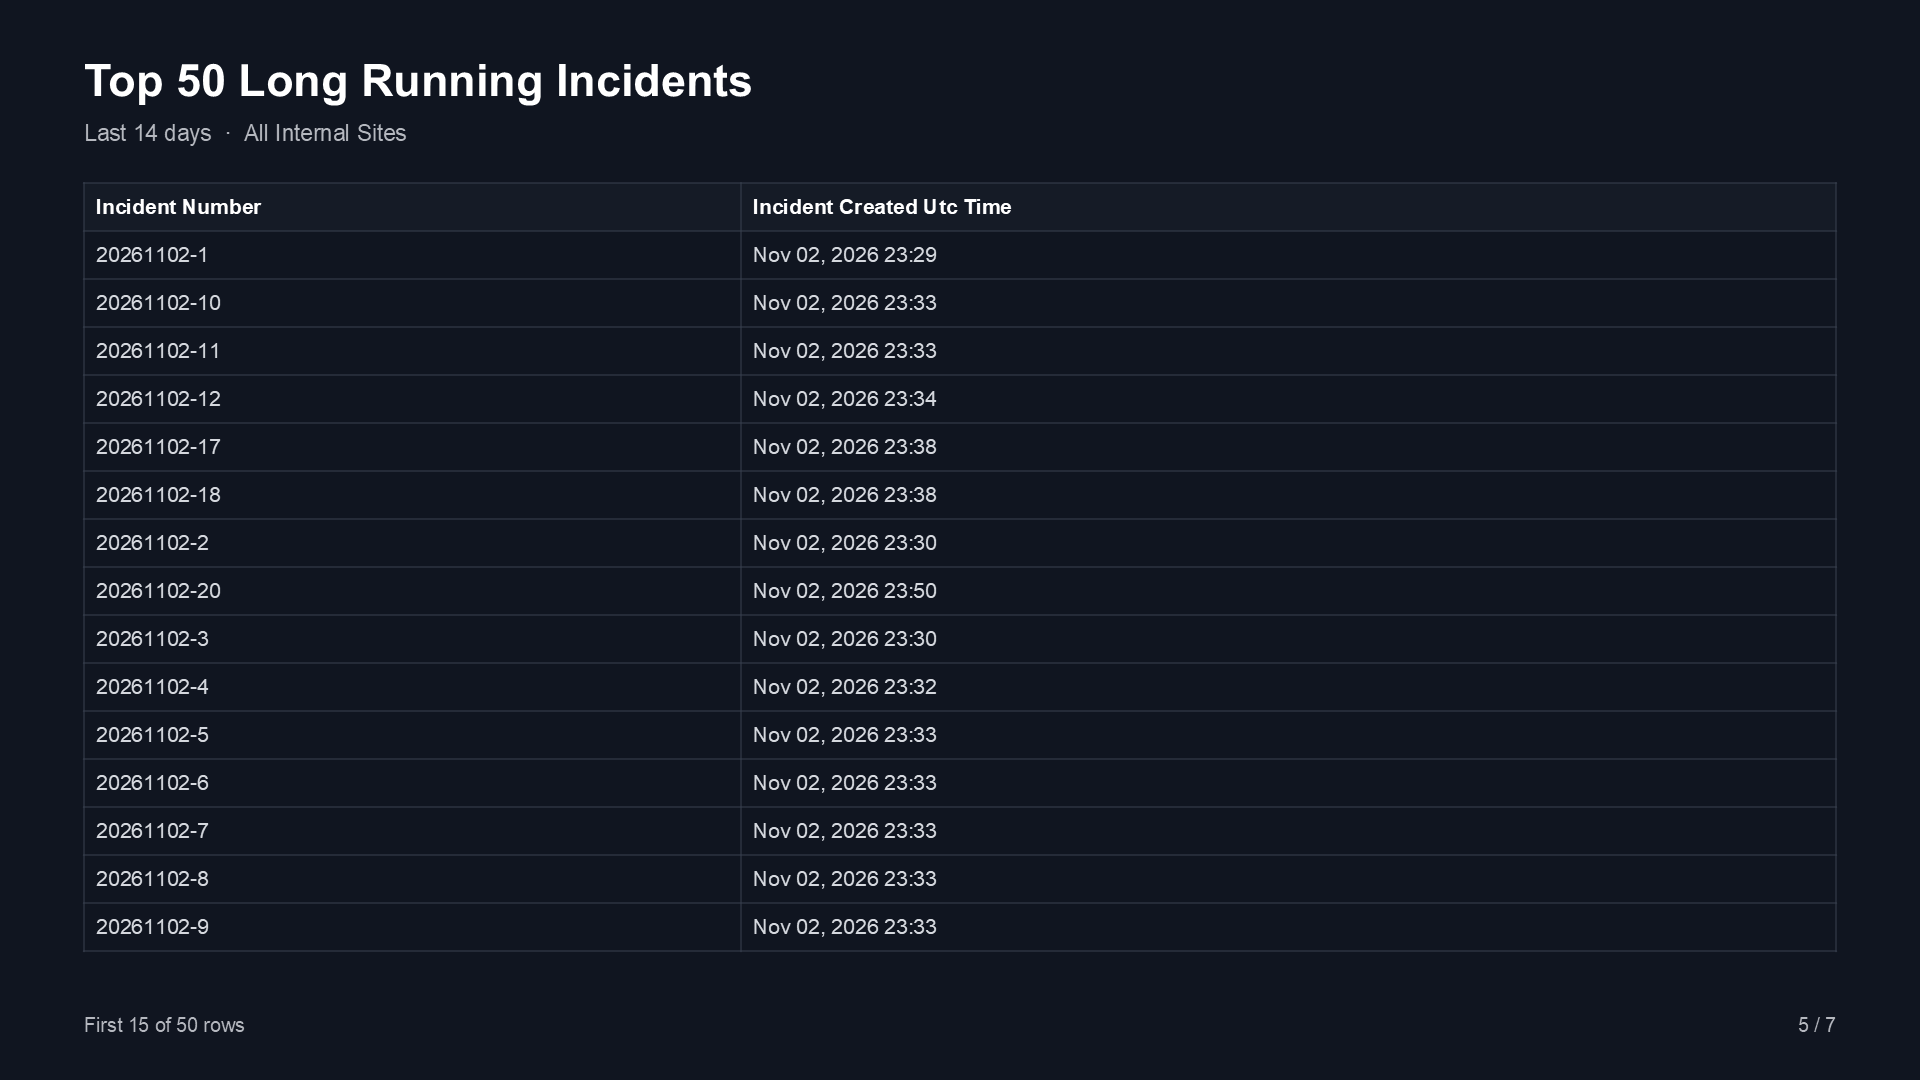
Table widgets, and summary widgets that list records, arrive as PowerPoint tables. When a table has more rows than fit on a slide, the slide shows the rows you had on screen and says which ones: First 15 of 18 rows from the first page, or Rows 49-63 of 500 if you had paged further before exporting.
A table slide showing the first 15 rows
AI Chart Slides
AI Chart widgets are rebuilt from what the AI produced, not photographed: the title, when it was generated, the summary, the key numbers with their change, and the insights, all as text you can edit. Their charts become PowerPoint charts where PowerPoint has a matching type; a heatmap, radial, gauge, map or scatter chart arrives as a picture of that chart alone. An AI widget with several charts or tables gets a slide for each, and text that would crowd the chart moves into the slide's speaker notes.
Light and Dark Decks
The deck follows the theme you are using in D3 when you export: a dark deck from the dark theme, a white deck from the light theme. To send a white deck, switch to the light theme before you export. Text is set in Arial so it looks the same on any computer.
Frequently Asked Questions
Why did one of my widgets arrive as a picture? PowerPoint has no chart type for it. The export window counts these as as pictures before you export.
Why does a slide say "No data for this period"? The widget found nothing for the dates you selected. Widen the dates on the dashboard and export again. Text (HTML) widgets never say this: they show their own content, whether or not they run a query.
Can I change the numbers in a chart? Yes. Select the chart in PowerPoint and edit its data. The key figures above it are text, so update them by hand if you change the data.