
Last updated: November 16, 2026
Overview
Measures are the figures a Numbers or HTML widget shows: each one is a count or a summary of the records that one or more saved queries return, or a percentage or a change worked out from two other measures. With several measures and several queries in one widget, a single tile can answer a question such as "what share of this month's incidents are closed?" without a custom report.
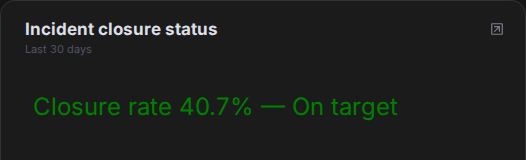
An HTML widget can also carry template logic: small calculations and conditions in its HTML that pick the words or the color to show from the widget's own numbers—for example, a green "On target" line when the closure rate is 30% or more, and a red "Below target" line when it is not.
A dashboard with a measures widget and a templated HTML widget
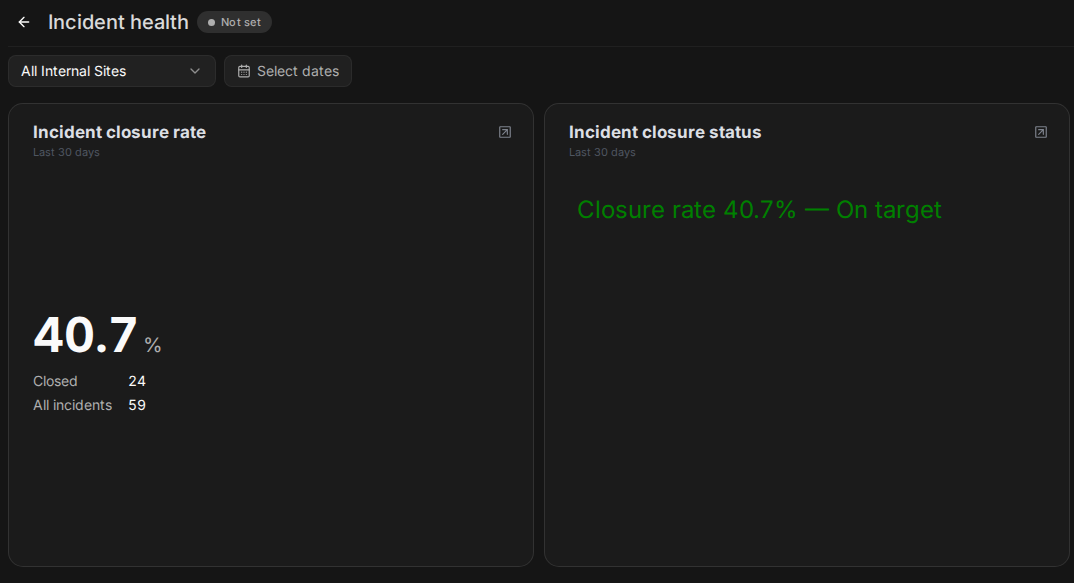
The figures in this article's screenshots come from a demonstration site. Your widgets show your own records.
In short
|
# |
Stage |
Where it happens |
|---|---|---|
|
1 |
Save the queries the widget reads |
Configuration > Reporting Dashboard > Queries |
|
2 |
Create a Numbers or HTML widget |
Configuration > Reporting Dashboard > Widgets > New Widget |
|
3 |
Add queries B to E beside query A |
The widget's Queries row |
|
4 |
Add measures, each reading one query or several combined |
The widget's Measures row |
|
5 |
(HTML only) Write the template that shows the measures |
The widget's HTML Template row |
|
6 |
Place the widget on a dashboard |
Configuration > Reporting Dashboard > Dashboards |
READER NOTE
Measures are available on Numbers and HTML widgets only. Other widget types keep their single aggregation.
Queries in a Widget
A widget's queries are the saved queries it reads, lettered A to E, so that one widget can compare groups of records—all incidents against closed incidents, for example—instead of showing a single total. A is the widget's own query, chosen as before with Select a query. Add query adds B, then C, and so on, up to five. In an HTML widget, the Measures row appears once query A is chosen.
Each added query shows its name, its kind of data and the note Date range: the dashboard's, else query A's. Every query in a widget reads the same dates:
-
the dashboard's date range, when the widget is on a dashboard that sets one—unless the widget is set on that dashboard to Use widget's own time range (the clock on the widget, Widget time range);
-
otherwise the widget's own date range: the Override range, if Override is turned on in the widget's Date range row, or else query A's saved date range.
A date range saved on query B, C, D or E is not used, so the queries are always compared over the same period. Override changes the one date range that all of the widget's queries share; it does not give query B, C, D or E dates of their own.
The Queries row with two queries

The buttons beside an added query are:
-
Edit: opens the query in the query editor. What you save there comes back to the same letter.
-
Change: replaces the query with another saved query, keeping its letter.
-
The X removes the query. A query that a measure still reads is not removed; the message names the measures to change first.
Combining Queries
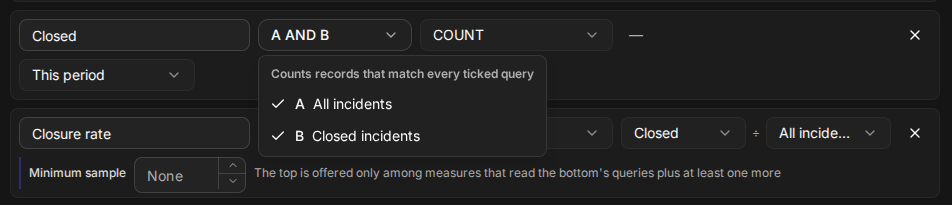
A measure that reads several queries counts only the records that match all of them. Reading A AND B, where A is all incidents and B is closed incidents, counts the closed incidents. The line under the queries—Combined as A AND B: a record counts only if it matches every query.—lists each combination your measures use.
Only queries of the same kind of data can be combined. An Incident query and an Event query may sit in the same widget side by side, each read by its own measures, but one measure cannot read both. Artifact queries cannot be combined yet, and a global list query cannot be used in a widget alongside other queries.
Measures
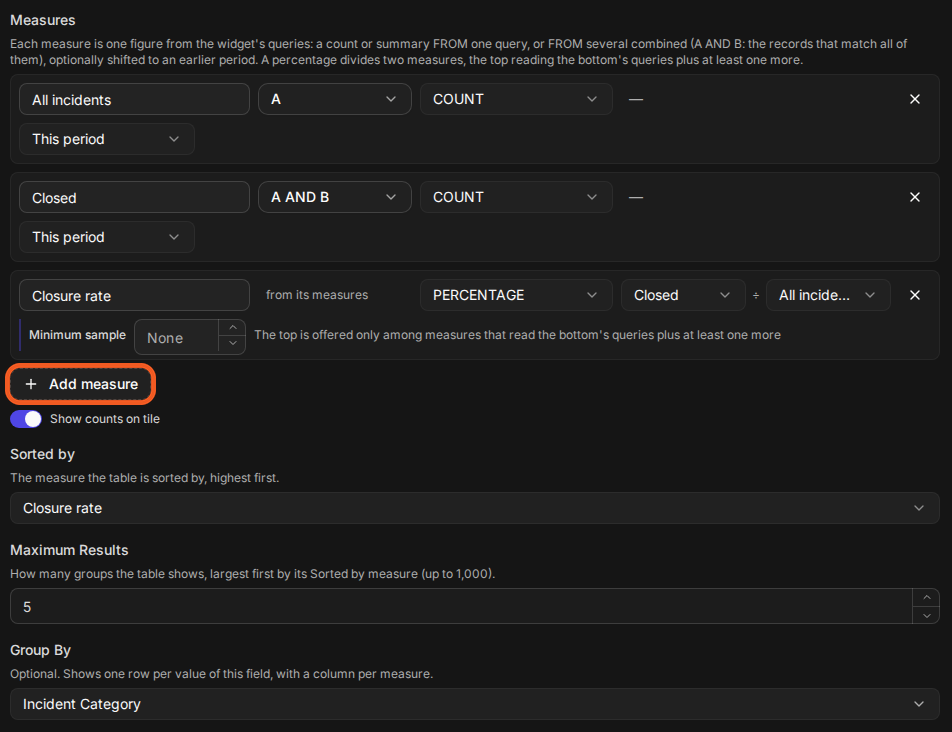
A measure is one figure from the widget's queries. Each row of the Measures list has a name, the queries it reads (FROM), a function, and a field or the measures it is worked out from.
The Measures list
|
Function |
What it shows |
What it needs |
|---|---|---|
|
COUNT |
How many records the measure's queries return |
Queries in FROM |
|
SUM, AVERAGE, MAXIMUM, MINIMUM |
The total, mean, highest or lowest value of a number field. MAXIMUM and MINIMUM also take a date field and show the latest or earliest date |
Queries in FROM, and a field |
|
PERCENTAGE |
One measure as a share of another, from 0 to 100 |
A Numerator and a Denominator: two COUNT measures, or two SUM measures over the same field |
|
CHANGE |
How much a measure rose or fell against an earlier period |
A Current and a Previous measure: two COUNT or two SUM measures of the same figure over the same queries, the previous one shifted back with the offset |
FROM lists the widget's queries with a checkbox each. Tick one query, or several to combine them. Ticking a query of another kind of data replaces the selection instead of adding to it; the menu marks such a query other kind: replaces. A measure that reads a query of another kind of data offers that query's fields. A PERCENTAGE or CHANGE row shows from its measures instead of FROM.
READER NOTE
SUM, AVERAGE, MAXIMUM and MINIMUM of a field from an Artifact query are offered but show — with Not available for this measure yet. A COUNT of an Artifact query works.
Choosing the queries a measure reads
Naming Measures
Each measure needs a name of up to 60 characters that no other measure in the widget uses, ignoring upper and lower case. The name is what the tile, the drill-down and the editor show. An HTML template refers to the measure by a separate template name, described in Writing a Template.
Percentages
A PERCENTAGE shows how much of one group falls into a narrower group—closed incidents out of all incidents, for example. Its Numerator must read the Denominator's queries plus at least one more, so the rate can never pass 100%: Closed (A AND B) ÷ All incidents (A) is accepted. The editor offers only the measures that qualify as the numerator. Both measures must also be over the same period.
Minimum sample (optional) hides a rate that rests on too few records. When the denominator is below the number you enter, the tile shows — instead of a percentage, so a "100%" from a single record never stands out as a result.
With Show counts on tile on (the default), the numerator's and the denominator's counts are listed first under the percentage, labeled with their measure names. Either way, every measure other than the large figure is listed under it.
READER NOTE
A percentage whose denominator is zero shows —, not 0%.
Comparing with an Earlier Period
The offset control under a measure shifts it back by whole periods of the widget's date range—Previous period, or 2 periods back up to 12 periods back; This period is no shift—so one widget can show this month beside last month. A rolling range such as Last 30 days moves back by its own length. A calendar range such as Last full month moves back by whole calendar months, so the previous period of last month is the month before it.
A CHANGE compares a measure with no offset (Current) to the same measure with an offset (Previous)—two COUNT or two SUM measures over the same queries—and shows the difference as a signed percentage of the previous value: from 40 to 50 is +25.0%, and from 50 to 40 is −20.0%. When the previous value is 0, the change shows —.
READER NOTE
An offset needs a query with a time range. Without one, the control is unavailable and reads Offset needs a query with a time range.
What the Tile Shows
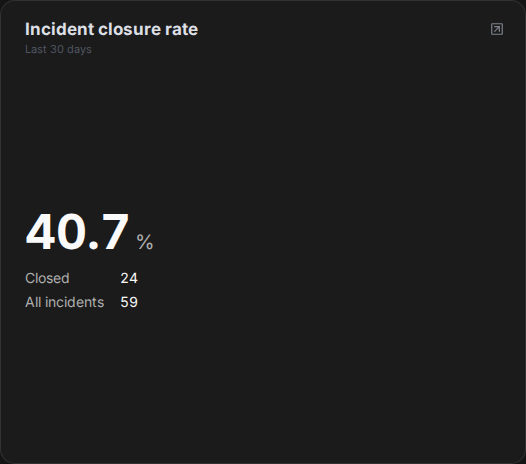
A Numbers widget shows one measure as its large figure and lists the others beneath it. With two or more measures, Shown on the tile chooses which one is the large figure. A percentage or change is shown to one decimal place; the classic interface and exported reports show two, as the earlier rate widgets did.
A Numbers widget with three measures
Group By (optional) turns the tile into a table: one row per value of the chosen field, one column per measure. Shown on the tile then becomes Sorted by, the column the table is sorted by, highest first. Maximum Results, under it, sets how many groups the table shows, largest first by its Sorted by measure, up to 1,000. It starts at 5, as on other charts. When groups are left out, a line above the table says so—for example, Top 5 of 20 groups, by Error rate. On a multi-tenant widget the total row still adds up every group, and is then labeled Total (all 20). A grouped widget can only use queries of one kind of data. Selecting a row opens the records of that row's group; on a multi-tenant widget grouped by Tenant, the records of that tenant. The total row opens none.
Selecting the tile opens the records behind its large figure. For a percentage, the window first lists the denominator's records; the toggle at the top, labeled with the two measures' names, switches to the numerator's records. For a change, the toggle switches from the current period's records to the earlier period's. The window title names the measure listed and the queries it reads—for example, All incidents — A, then Closed — A AND B. If a query the measure reads has been deleted or you cannot read it, the window lists no records. Download saves the records the window lists; on a multi-tenant widget it saves only the main site's own records.
The records behind a percentage

When a measure cannot be worked out, it shows — and the tile says why—for example, A query this measure reads was deleted. Open the widget and choose another. A percentage or change whose part could not be worked out names that part, for example Uses "Closed", which couldn't be calculated. followed by the reason.
READER NOTE
A filter set on the dashboard or on the tile applies to a measure only when that measure's queries have the filtered field. A measure over another kind of data keeps its figure, counted without that filter, and the tile says so—for example, Not filtered by Event Type: this measure reads Incident data. under that measure's figure or column heading. In an HTML widget the line appears under the template and names the measure: Incidents is not filtered by Event Type: it reads Incident data.
Creating a Widget with Measures
Use this procedure to build a closure-rate widget: all incidents, the closed ones, and the share that is closed.
Building a rate at a glance
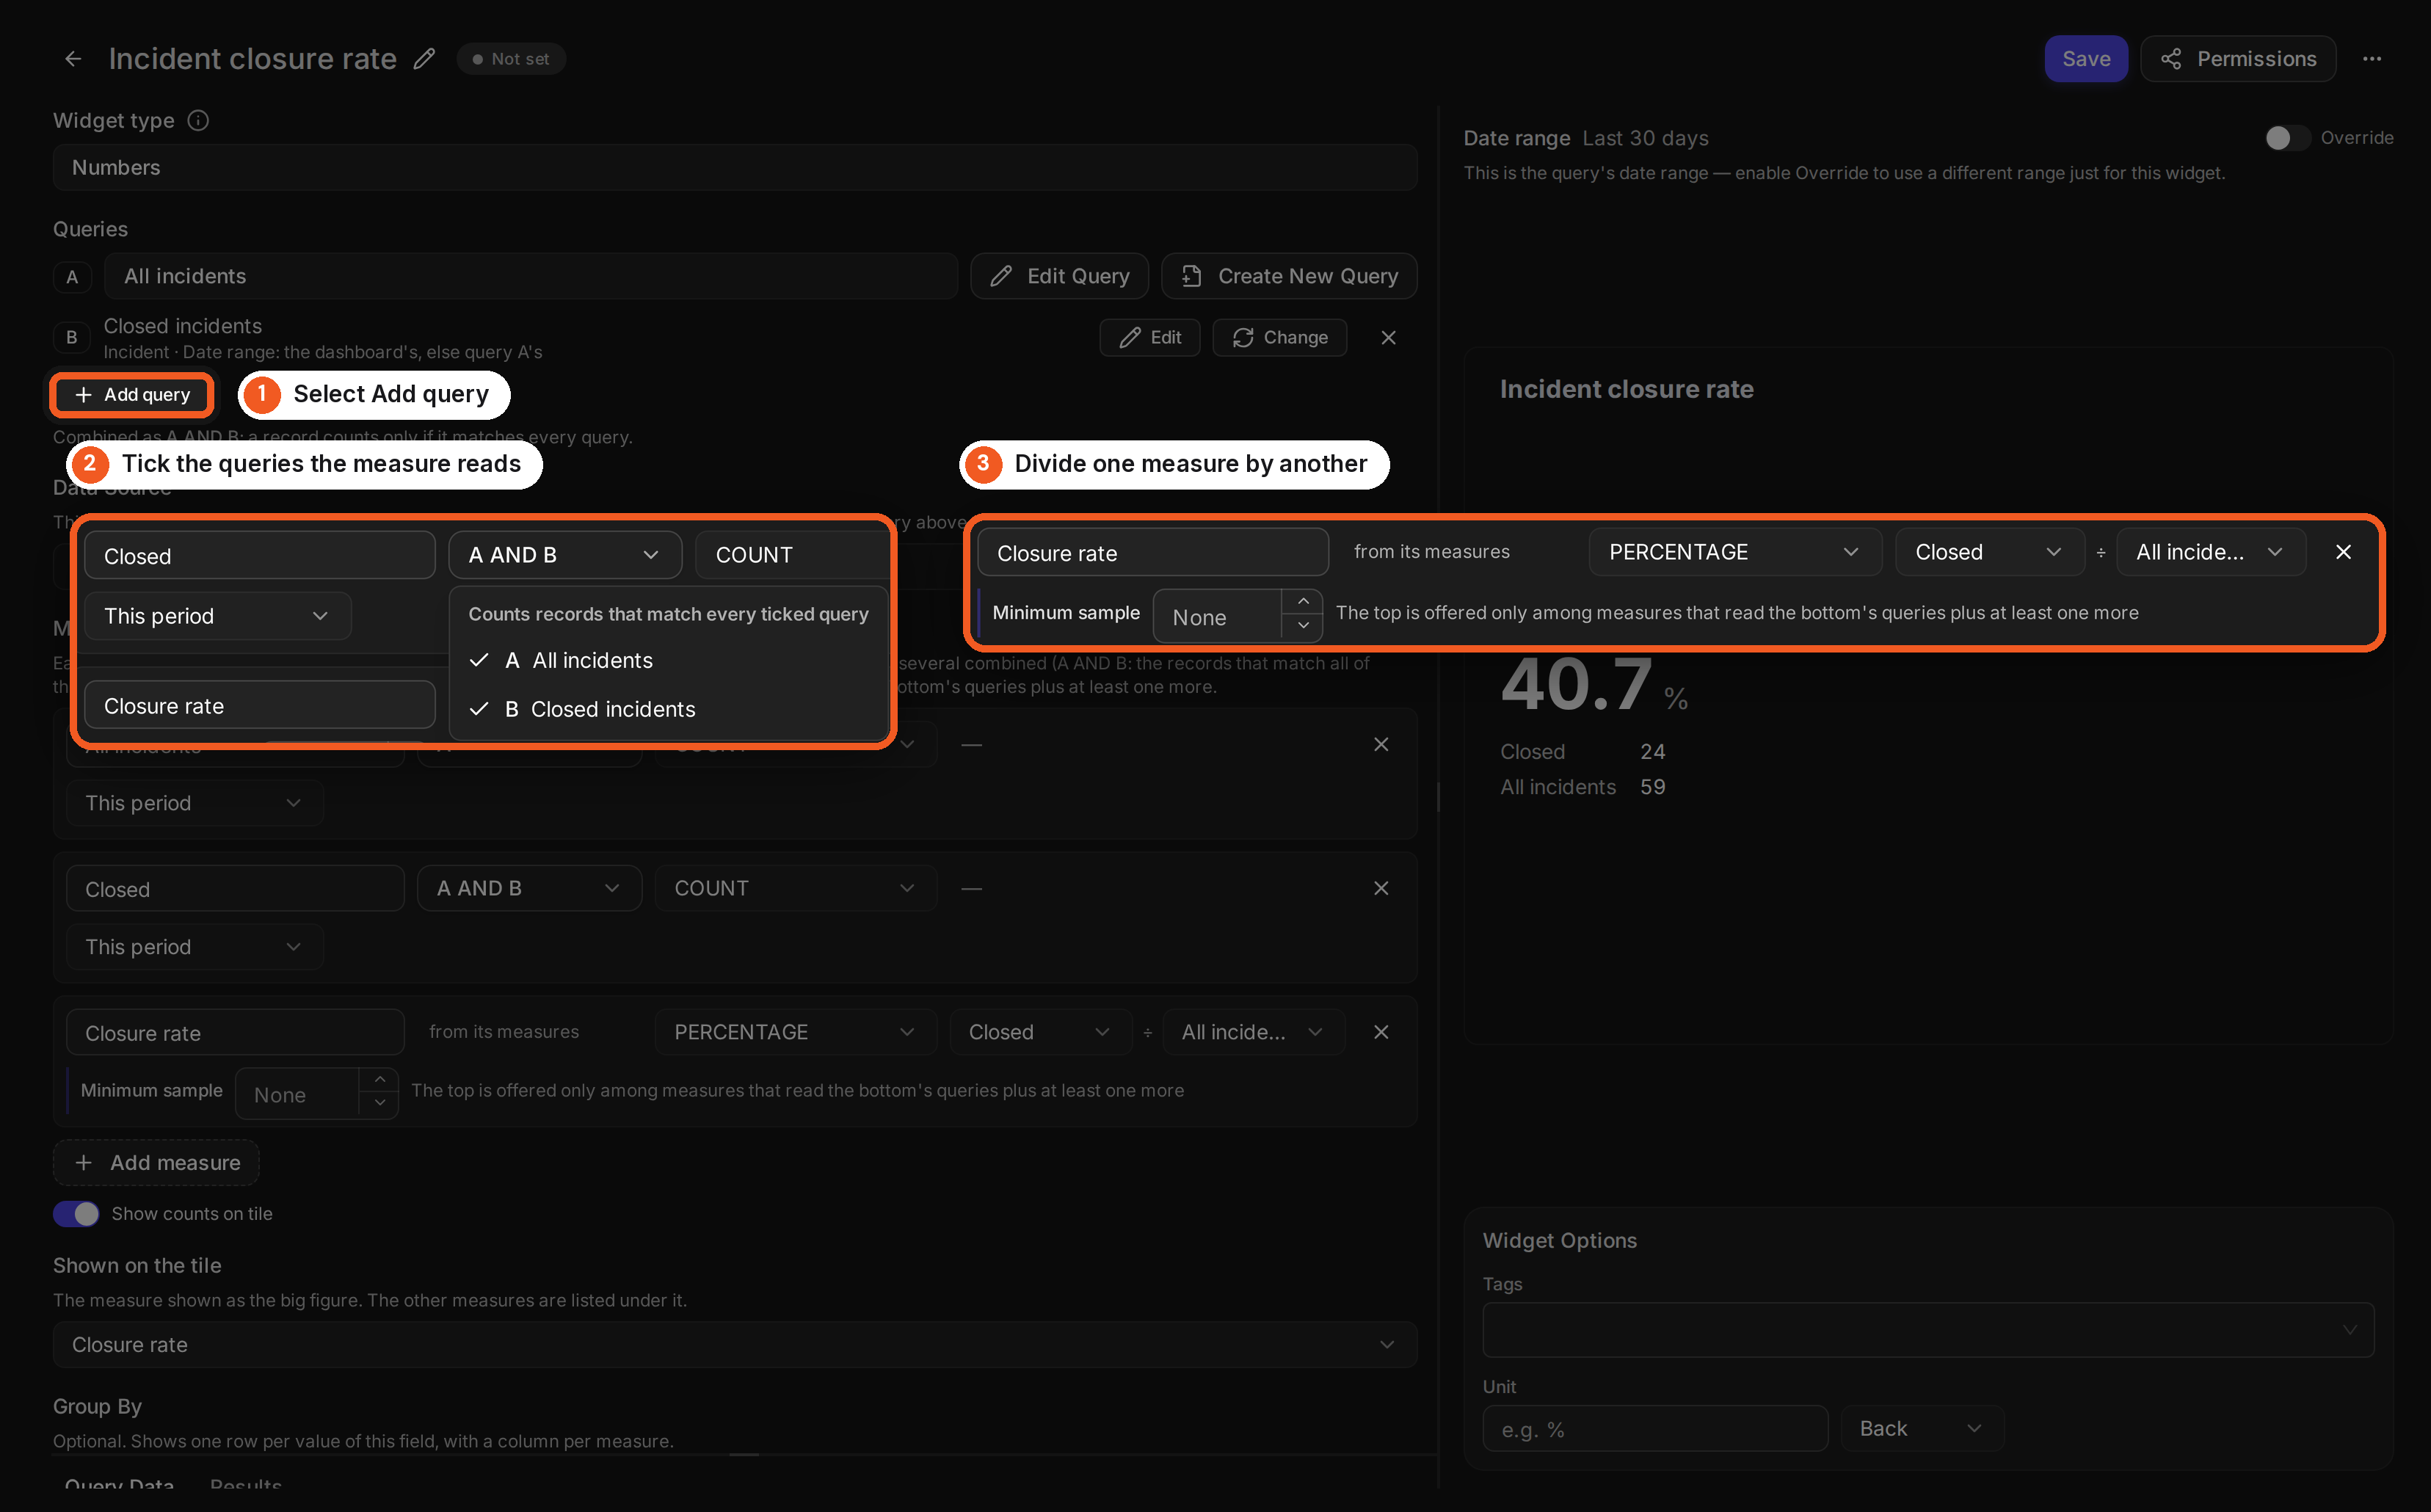
The same steps, animated
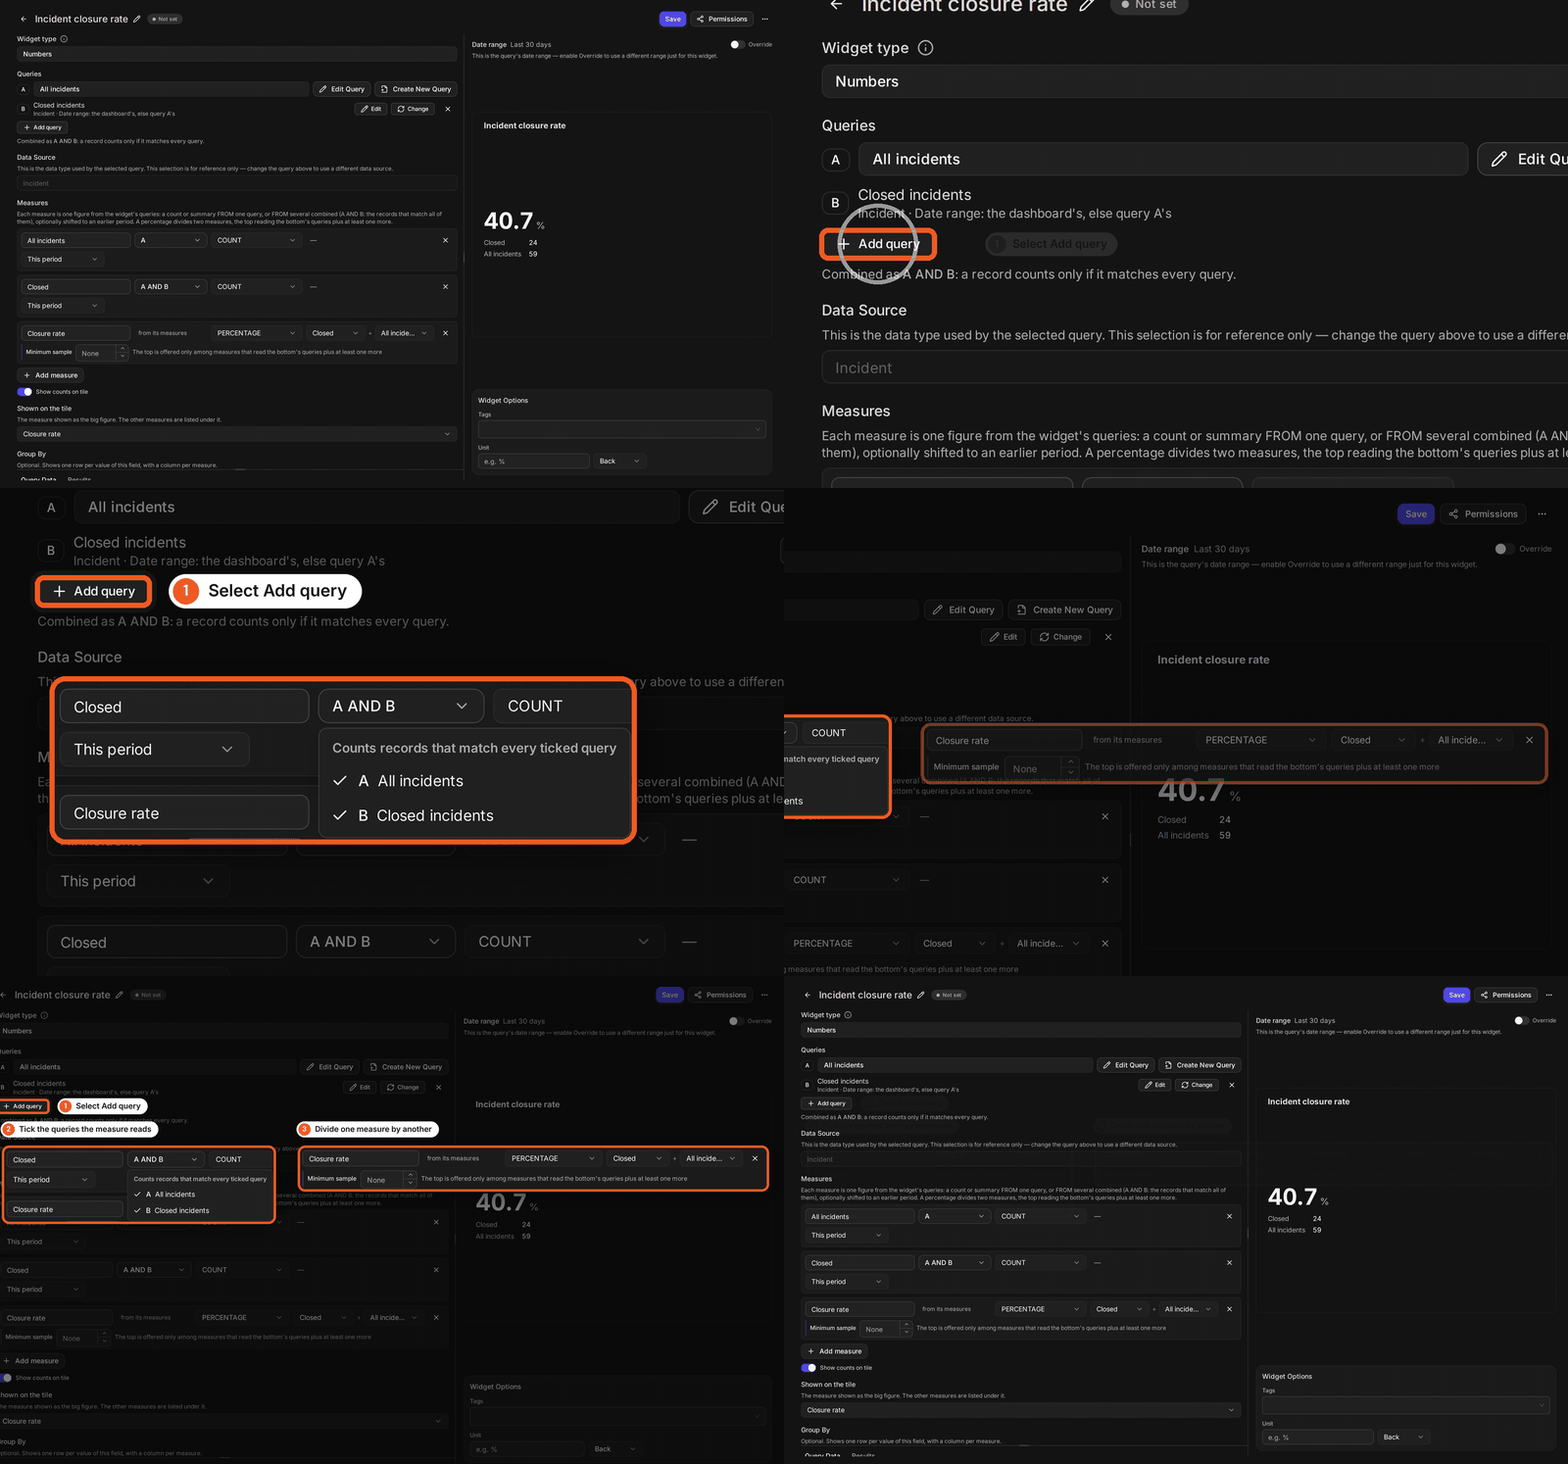
READER NOTE
Save the queries first. This example uses two saved incident queries: All incidents, and Closed incidents (status is Closed).
-
Go to Configuration > Reporting Dashboard > Widgets and select New Widget.
-
Under Widget type, select Select a chart type and choose Numbers.
-
Under Queries, select Select a query and choose All incidents in Use a Saved Query. It becomes query A.
-
Select Add query and choose Closed incidents. It becomes query B.
-
Under Measures, rename the first measure from Value to All incidents, and keep A and COUNT.
-
Select Add measure. Name it Closed, open FROM, tick B as well as A, and keep COUNT.
-
Select Add measure again. Name it Closure rate, choose PERCENTAGE, then choose All incidents as the Denominator and Closed as the Numerator. The Numerator list narrows to the measures that qualify once the Denominator is chosen.
-
Under Shown on the tile, check that Closure rate is selected.
-
Select the pencil beside New Widget, enter a widget name, then select Save.
RESULT
The widget is saved, and its preview shows the closure rate as the large figure, with Closed and All incidents listed under it.
COMMON ERROR
The top must use the bottom's queries plus at least one more (for example, A AND B divided by A). The numerator reads the same queries as the denominator. Tick another query in the numerator's FROM.
Template Logic in HTML Widgets
Template logic lets an HTML widget decide what to show from its own numbers: work out a value, compare it with a target, and pick the words or the color to match. One widget can then say "On target" in green or "Below target" in red, so a reader does not have to judge a bare number for themselves.
A template that colors its result
Writing a Template
An HTML widget opens its HTML Template in a source editor with line numbers when the widget is new or has measures, so what you type is saved exactly as written. The switch above it reads Source (a template is edited as source only).
-
Values:
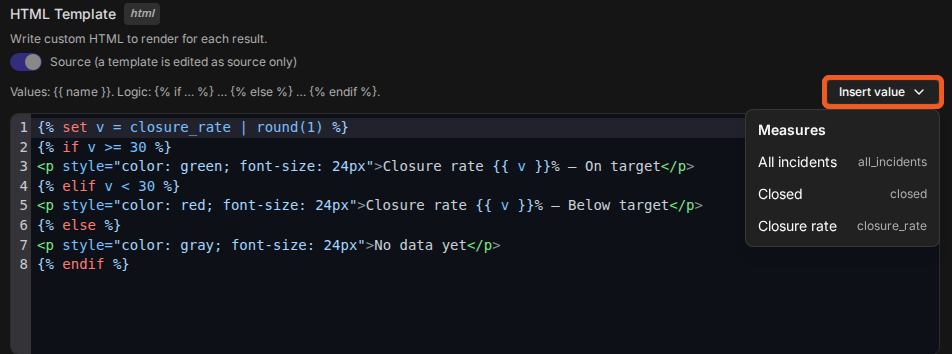
{{ name }}prints a number. Insert value lists the measures with their template names and writes the value at the cursor. -
Logic:
{% set name = … %}keeps a calculated value under a name of your own, and{% if %},{% elif %},{% else %}and{% endif %}choose which part of the HTML to show.
A template refers to a measure by its template name, never by its display name. The template name is made from the measure's name—Closure rate becomes closure_rate, and a % becomes pct, so Breach % becomes breach_pct. Until the widget is first saved, the template name follows the measure's name as you type it. From the first save it is fixed: renaming the measure afterwards does not change it, so a template that uses it keeps working. Insert value shows each measure's template name beside its name.
READER NOTE
Name your measures before you insert them into a template. A value inserted and then renamed before the widget's first save no longer matches, and Save refuses the template.
The template editor
A Simple Example
This template shows the closure rate to one decimal place, in green with On target when it is 30 or more, in red with Below target when it is under 30, and No data yet when there is no rate to show:
{% set v = closure_rate | round(1) %} {% if v >= 30 %} <p style="color: green; font-size: 24px">Closure rate {{ v }}% — On target</p> {% elif v < 30 %} <p style="color: red; font-size: 24px">Closure rate {{ v }}% — Below target</p> {% else %} <p style="color: gray; font-size: 24px">No data yet</p> {% endif %}
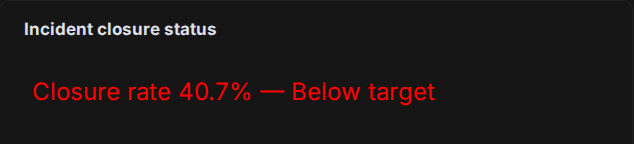
The words and the color are written as plain HTML inside each branch; the condition chooses which branch is shown. The last branch matters: when a rate has no value—no records in its denominator, or fewer than its Minimum sample—every comparison with it is false, so a template whose last branch is "Below target" would show it in red during a quiet period. With a target of 50 instead of 30, the widget shows the red branch:
The same template below its target
A Service-Level Example
A common use is a service-level summary. Suppose a widget has a measure Breach %—the share of closed incidents that missed their SLA, built as a PERCENTAGE as in Creating a Widget with Measures—whose template name is breach_pct. This template shows Within SLA in green while the breach rate is 30% or less, Missed SLA in red above that, and No closed incidents yet when there is no rate:
{% set breach = breach_pct | round(1) %} {% if breach <= 30 %} <p style="color: green">Within SLA: {{ breach }}% of closed incidents breached</p> {% elif breach > 30 %} <p style="color: red">Missed SLA: {{ breach }}% of closed incidents breached</p> {% else %} <p style="color: gray">No closed incidents yet</p> {% endif %}
For a template that turns a count into an estimate, see the FTE Gained example in SLA and ROI Widgets.
What a Template Can Use
|
You can use |
For example |
|---|---|
|
Numbers and template names |
|
|
Arithmetic, with brackets |
|
|
Comparisons |
|
|
Joining conditions |
|
|
|
`{{ closure_rate |
|
|
Accepted for compatibility with templates written for other tools; it leaves the number unchanged |
AggregatedResult also works. In an HTML widget it stands for one measure. With two or more measures, Shown as {{AggregatedResult}} under the Measures list chooses which one. Until you choose, it is the one that was last in the Measures list the first time the widget was saved with more than a single simple measure of query A—that is, with two or more measures, a second query, template logic, or a measure with an offset. A widget first built as a Numbers widget keeps the measure chosen there under Shown on the tile. Adding measures later does not change it. If you remove that measure, the measure last in the list at your next save takes its place. An HTML widget with measures whose HTML holds only the plain {{AggregatedResult}}, with no other template logic, shows the same value, printed the same way.
A value is printed with all its decimals unless you round it: {{ closure_rate }} can print a number such as 40.6779661016949, while {{ closure_rate | round(1) }} prints 40.7. Use round(1) for rates. Numbers in a template always use a period as the decimal point and no thousands separator. A value that is not available prints —, and so does a MAXIMUM or MINIMUM of a date, which is not a number (the plain {{AggregatedResult}} without template logic shows the date). Any comparison with such a value is false, which is why the examples end with an {% else %} branch for "no data".
READER NOTE
A template prints numbers only. It has no text values, quoted strings, loops or comments, so text and colors are chosen by putting HTML inside {% if %} branches. The HTML a template produces is limited to text, lists and tables, with inline styles such as color, background color, font, border, padding and alignment. Links, images, and the form tags <form>, <input> and <button> are removed before the widget is shown, together with anything inside them (a link's or a button's text, for example), and so are classes and HTML comments. The rest of the template still shows, and it stays inside its tile. HTML that holds a script, a style sheet, a <title>, a frame, SVG or MathML, a <textarea> or a <select> list is not shown at all: the editor's preview shows the same message as for a template that is too large, and viewers see This widget's template has an error.
Previewing and Saving
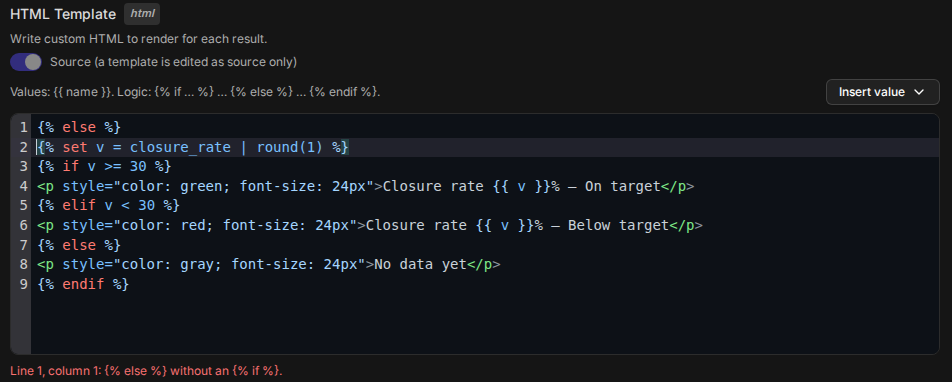
The editor's preview shows the template exactly as a viewer will see it, and refreshes shortly after you stop typing. A mistake appears in red under the editor with its line and column, and a template with a mistake is not saved when you select Save.
A mistake in a template
Viewers never see your template text or the error details. While a template has a mistake, the editor's preview shows This widget's template has an error., and a saved widget whose template stops working shows viewers the same message.
The preview while a template has a mistake

Existing HTML Widgets
HTML widgets created before this release keep working exactly as they did, in the rich-text editor, including any text that looks like template syntax. To use template logic in one of them, turn on Source (edit as a template; this cannot be undone). From the next save, the widget's HTML is treated as a template.
WARNING
Switching an existing widget to source editing cannot be undone. Any {{ or {% already in its text is then read as a template, and the widget is not saved until the template is valid.
Limits
|
Item |
Limit |
|---|---|
|
Queries in one widget |
5 (A to E) |
|
Measures in one widget |
10 |
|
Measure name |
60 characters, unique in the widget |
|
Rows in a grouped table |
Maximum Results, 1 to 1,000 (5 to start) |
|
Offset |
1 to 12 periods back |
|
Minimum sample |
1 to 1,000,000 |
|
Template length |
20,000 characters |
|
HTML a template produces |
2,000 tags (end tags are not counted) |
|
Tags with a |
900, including the copies made of formatting tags left open |
|
HTML a template produces and shows, in characters |
100,000, tags included |
|
|
16 deep |
|
|
0 to 10 digits |
A template that goes over the 2,000-tag, the 900-styled-tag or the 100,000-character limit, or that holds one of the elements that are not shown, is still saved. The editor's preview shows the reason under the editor, and viewers see This widget's template has an error. For the tag limit the editor asks for at most 2,000 tags and shorter attributes, formatting tags such as bold closed right after their text, and no <textarea>, <style> or <title> tags. The editor shows the same message for the styled-tag limit, and when formatting tags left open would be copied many times over. A report table of 90 rows and 10 columns fits, and so does a table of 66 rows and 10 columns with a short style such as color:#333 on every cell.
Other Places Measures Appear
-
Multi-tenant widgets can use measures; the figures from each tenant site are added up before percentages and changes are worked out, so a rate covers all of them.
-
The classic interface shows widgets with measures and templated HTML widgets on its dashboards and in exported reports. Their editor there opens read-only with the note This widget was built in the new UI. Edit it there., and does not offer cloning. Selecting a measures tile there, or a row of a grouped one, lists the records of the widget's query A—for a row, those in its group; open the dashboard in the new interface to list a measure's own records.
-
Built-in event rates: the built-in Event Auto-Dismissal Rate and Event Escalation Rate widgets are now measures widgets, and stay on the dashboards that show them. Their figures can differ from before: an escalated event now counts once however many incidents it is linked to, so the escalation rate never passes 100% and can read lower than before where events are linked to several incidents, and an event falls in a period by when D3 received it, as in other event widgets. As before, an event counts as escalated when it was linked to an incident by hand, by an event automation rule, by a playbook run or by Attack Path Discovery (APD). Other links do not count, for example a link that comes from an incident fetched from another system or a playbook command that correlates, finds or updates events. Open one to see how a rate is built from Events queries, and clone it to make your own.
Who Can Use Measures
Anyone who can create or edit a widget under Configuration > Reporting Dashboard > Widgets can add queries, measures and template logic. A widget you can only view opens in View Only: you can read its queries and measures but not change them. To build on a built-in widget, clone it first.
To save a widget, you must be able to read every query it uses. People who view the widget on a dashboard then see all of its figures.