
LAST UPDATED: SEP 17, 2026
Overview
Claroty xDome is an industrial cybersecurity platform that provides comprehensive visibility, threat detection, and vulnerability management for OT, IoT, and IIoT environments. It continuously monitors network assets, detects anomalies and threats, and delivers risk-based vulnerability prioritization across industrial and healthcare networks.
Claroty xDome is available for use in:
|
D3 ASOC |
V18.0.7+ |
|
Category |
Network Security |
|
Deployment Options |
Option I, Option II, Option III, Option IV |
Connection
Gather the following information to connect D3 to Claroty xDome.
|
Parameter |
Description |
Example |
|---|---|---|
|
Server URL |
The base URL of the Claroty xDome API instance. The API URL follows the format https://{tenant}-api.claroty.com. This URL is different from the dashboard URL. |
|
|
API Token |
The Bearer token used to authenticate API requests. Generate an API token from the Claroty xDome portal under Admin Settings > User Management by creating an API User. |
**** |
|
API Version |
Specifies the Claroty xDome API version. The default version is v1. Supported versions: v1. |
v1 |
Permission Requirements
Each endpoint in the Claroty xDome API requires a certain permission scope. The following are required scopes for the commands in this integration:
|
Command |
Required Permissions |
|---|---|
|
Test Connection |
API user with read access to alerts |
|
List Devices |
API user with read access to devices |
|
List Alerts |
API user with read access to alerts |
|
List Vulnerabilities |
API user with read access to vulnerabilities |
|
Fetch Event |
API user with read access to alerts |
|
Get Alert Devices |
API user with read access to alerts and devices |
|
Resolve Alerts |
API user with write access to alerts |
|
Get Device Communication Map |
API user with read access to devices |
|
Get Vulnerability Devices |
API user with read access to vulnerabilities and devices |
|
List OT Activity Events |
API user with read access to OT activity events |
|
Update Notes |
API user with write access to the selected target type |
|
List Device Alert Relations |
API user with read access to alerts and devices |
|
List Device Vulnerability Relations |
API user with read access to devices and vulnerabilities |
Configuring Claroty xDome to Work with D3
Complete the following steps in the vendor environment before configuring the D3 connection:
-
Log in to the Claroty xDome portal as an administrator.
-
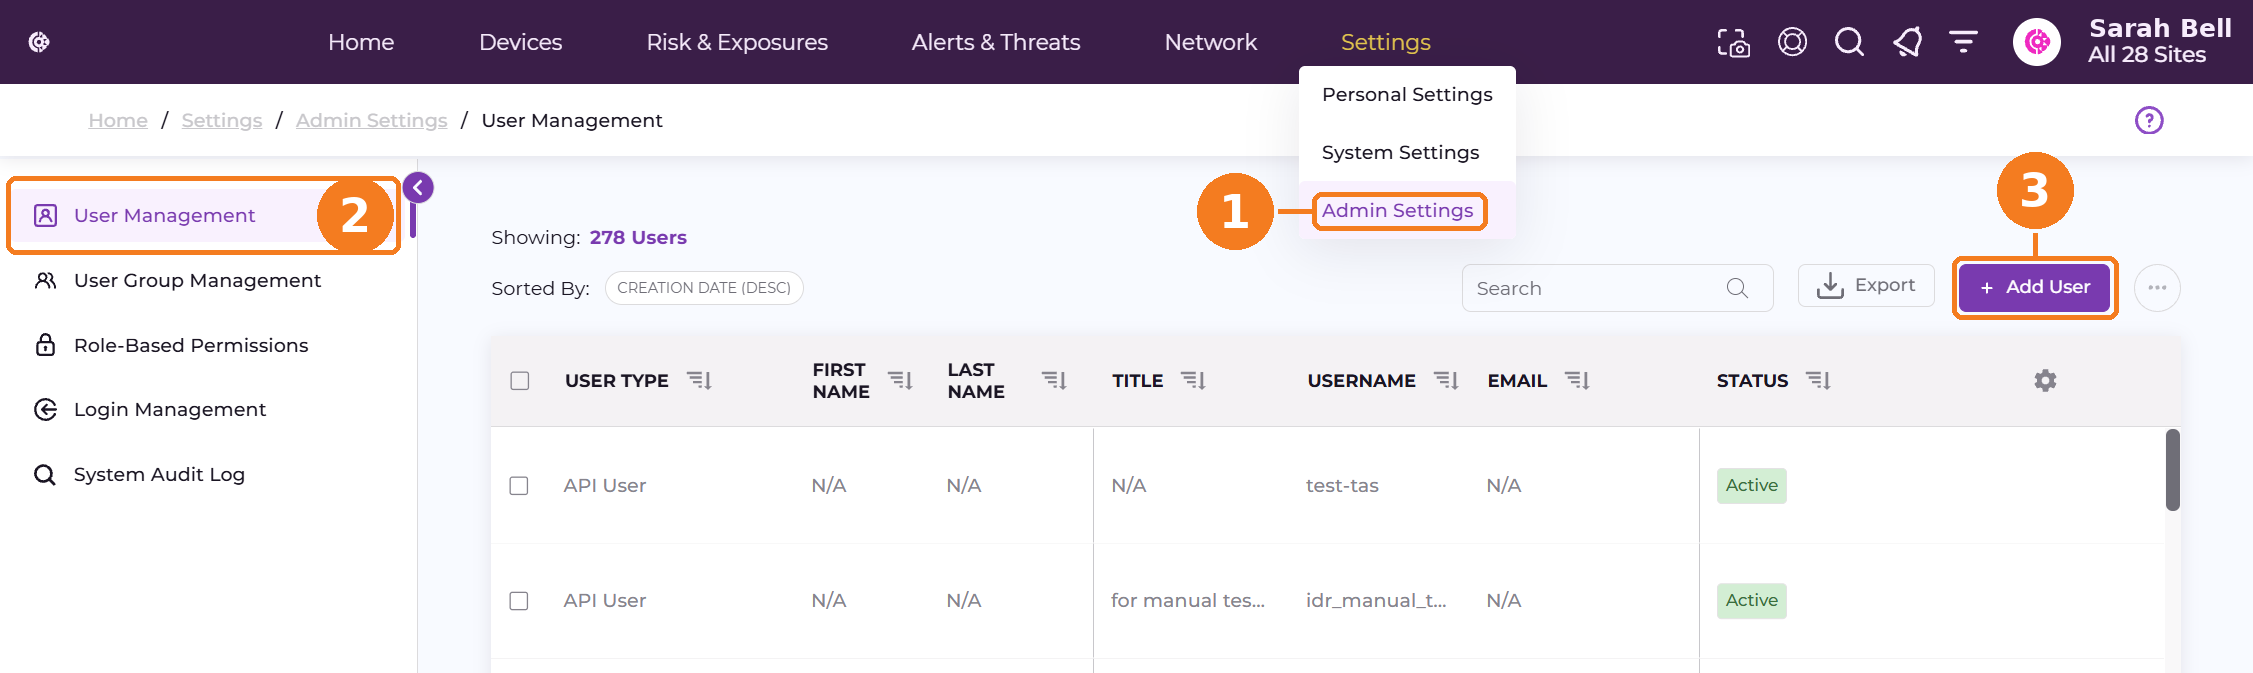
Navigate to Admin Settings > User Management, then click + Add User.
-
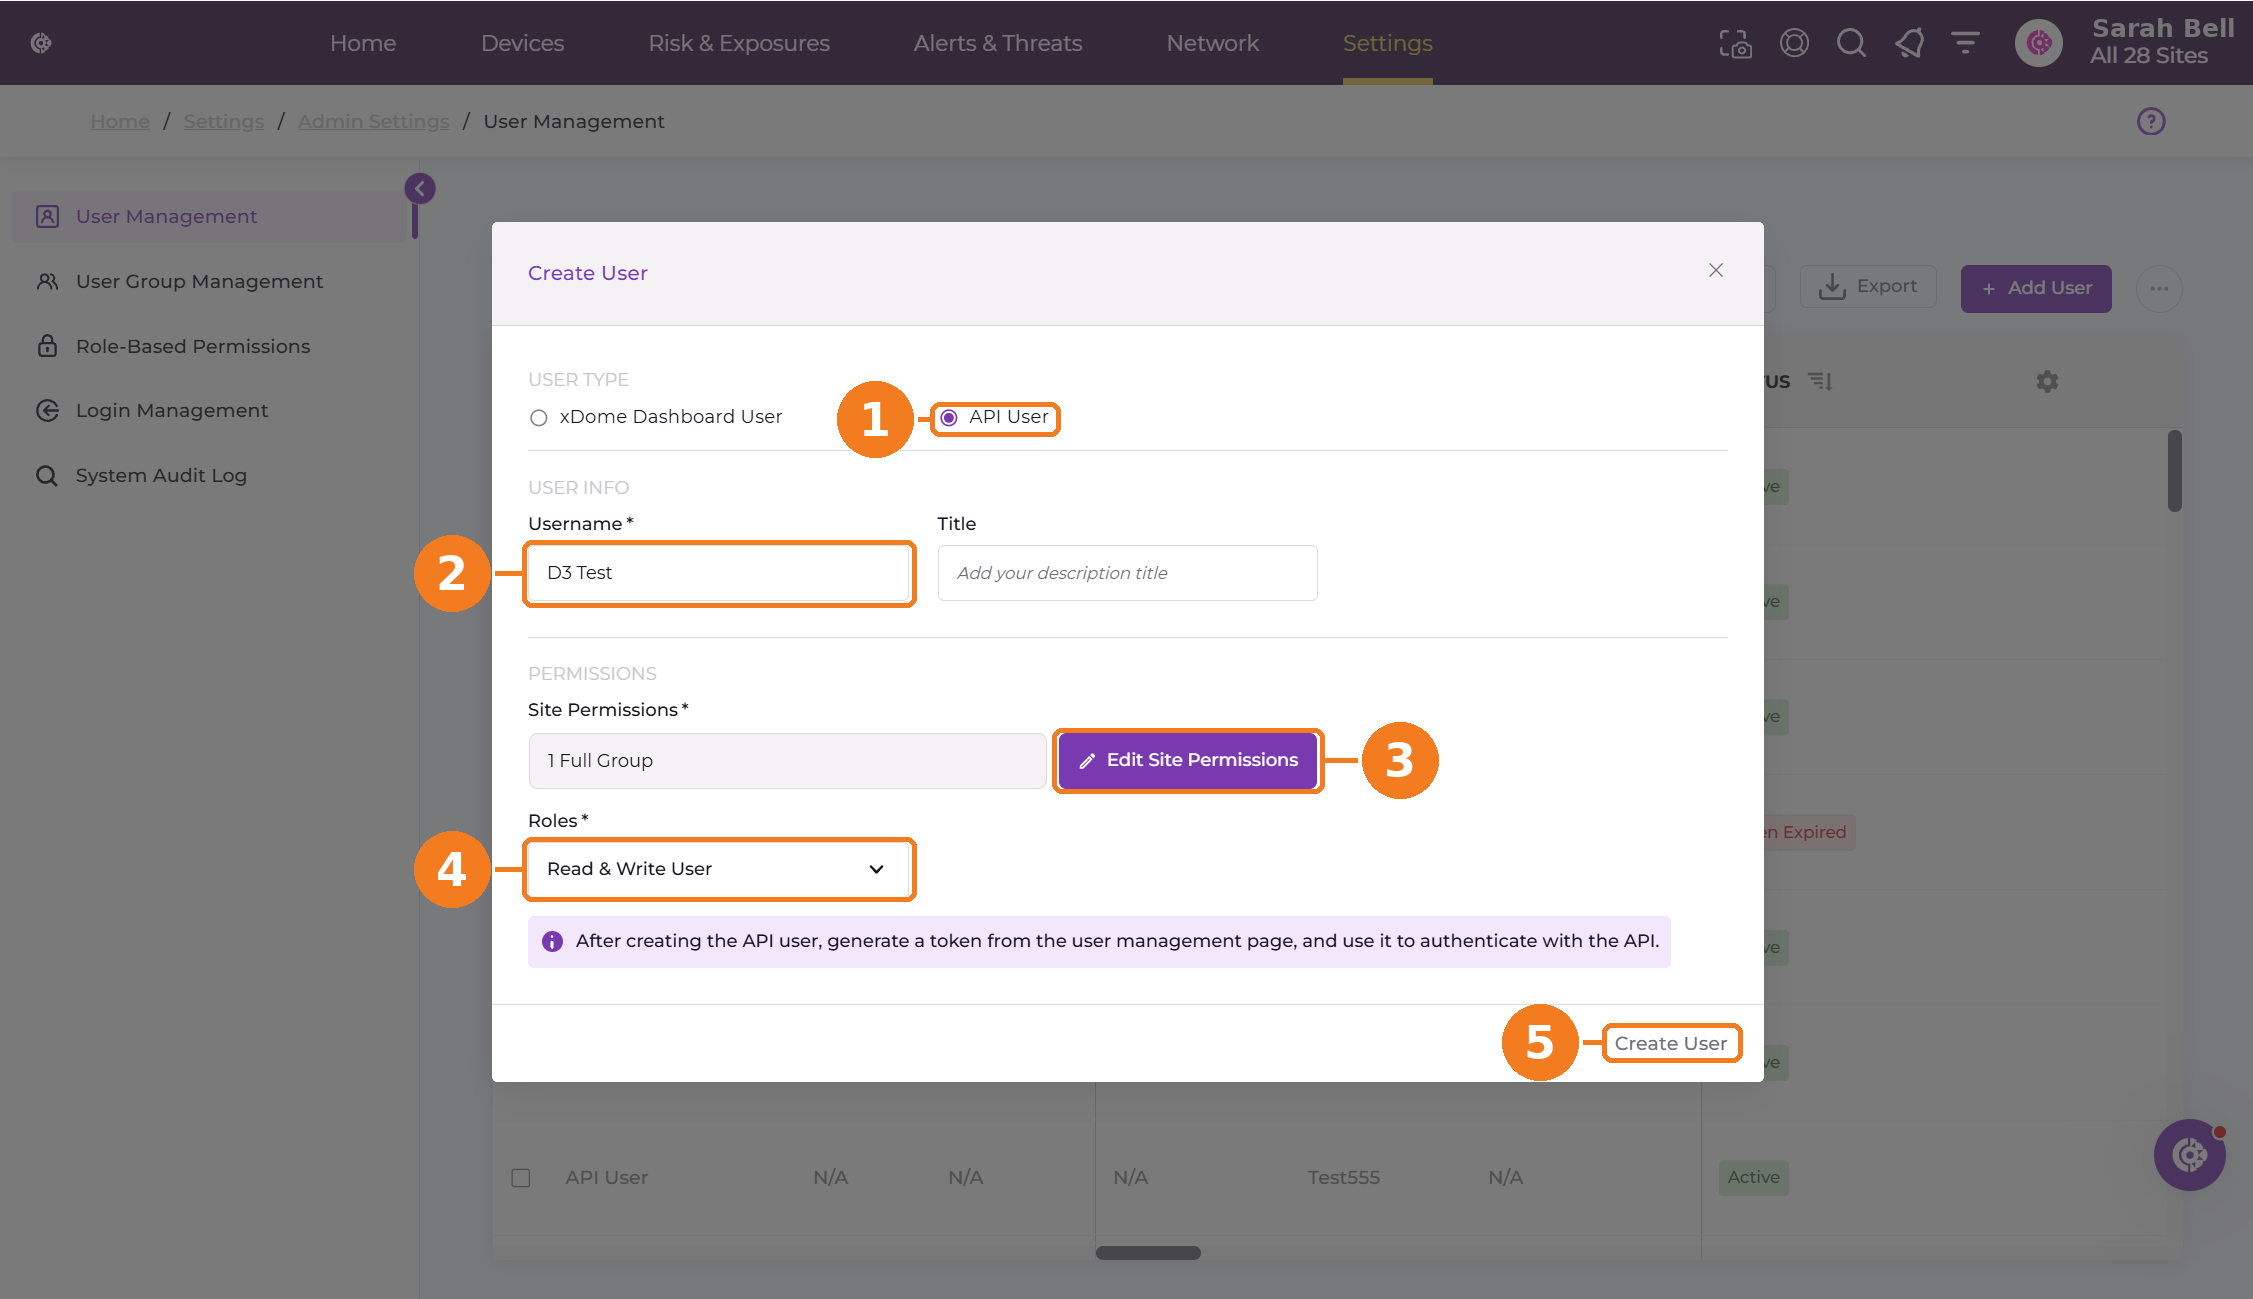
Select API User as the user type.
-
Enter a username and description for the API user.
-
Assign the appropriate site permissions and role, and click Create User.
-
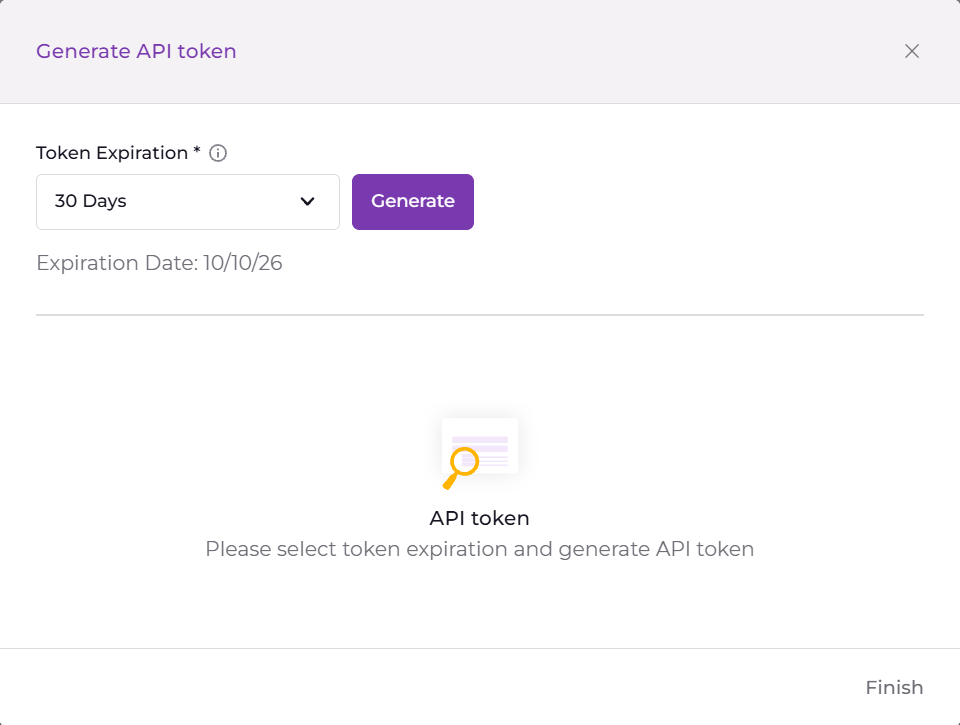
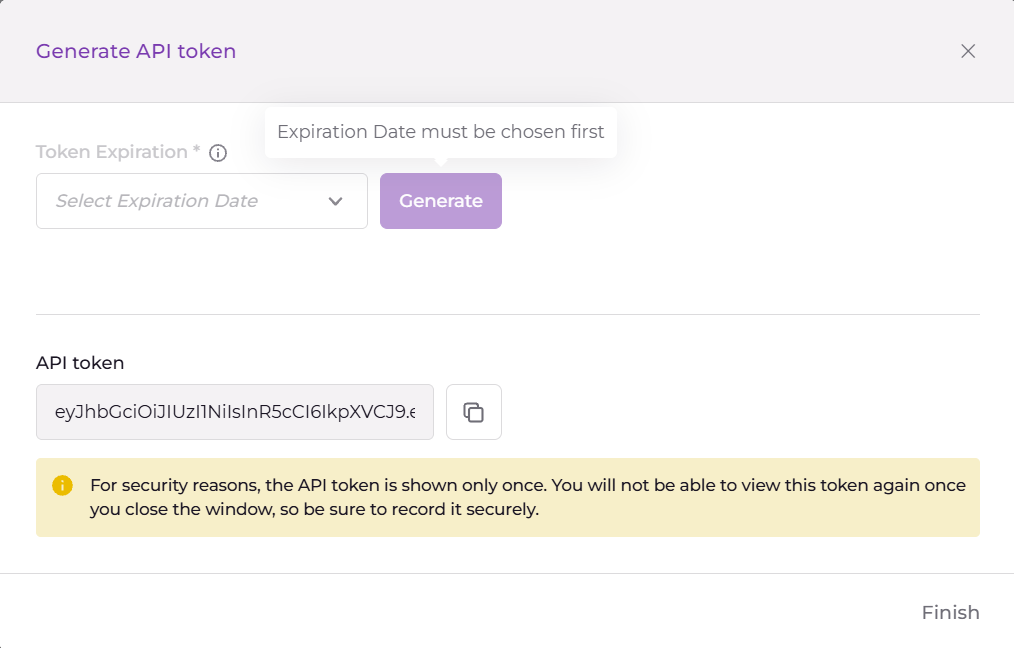
After you create the user, click Generate Token next to the user in the list.

-
Select a Token Expiration date from the dropdown.
-
Click Generate and immediately copy the token. The token cannot be viewed again after this step.
-
The API base URL follows the pattern: https://{tenant}-api.claroty.com where {tenant} is your organization identifier. This is different from the dashboard URL (https://{tenant}.dashboard.claroty.com).
Configuring D3 to Work with Claroty xDome
-
Log in to D3.
-
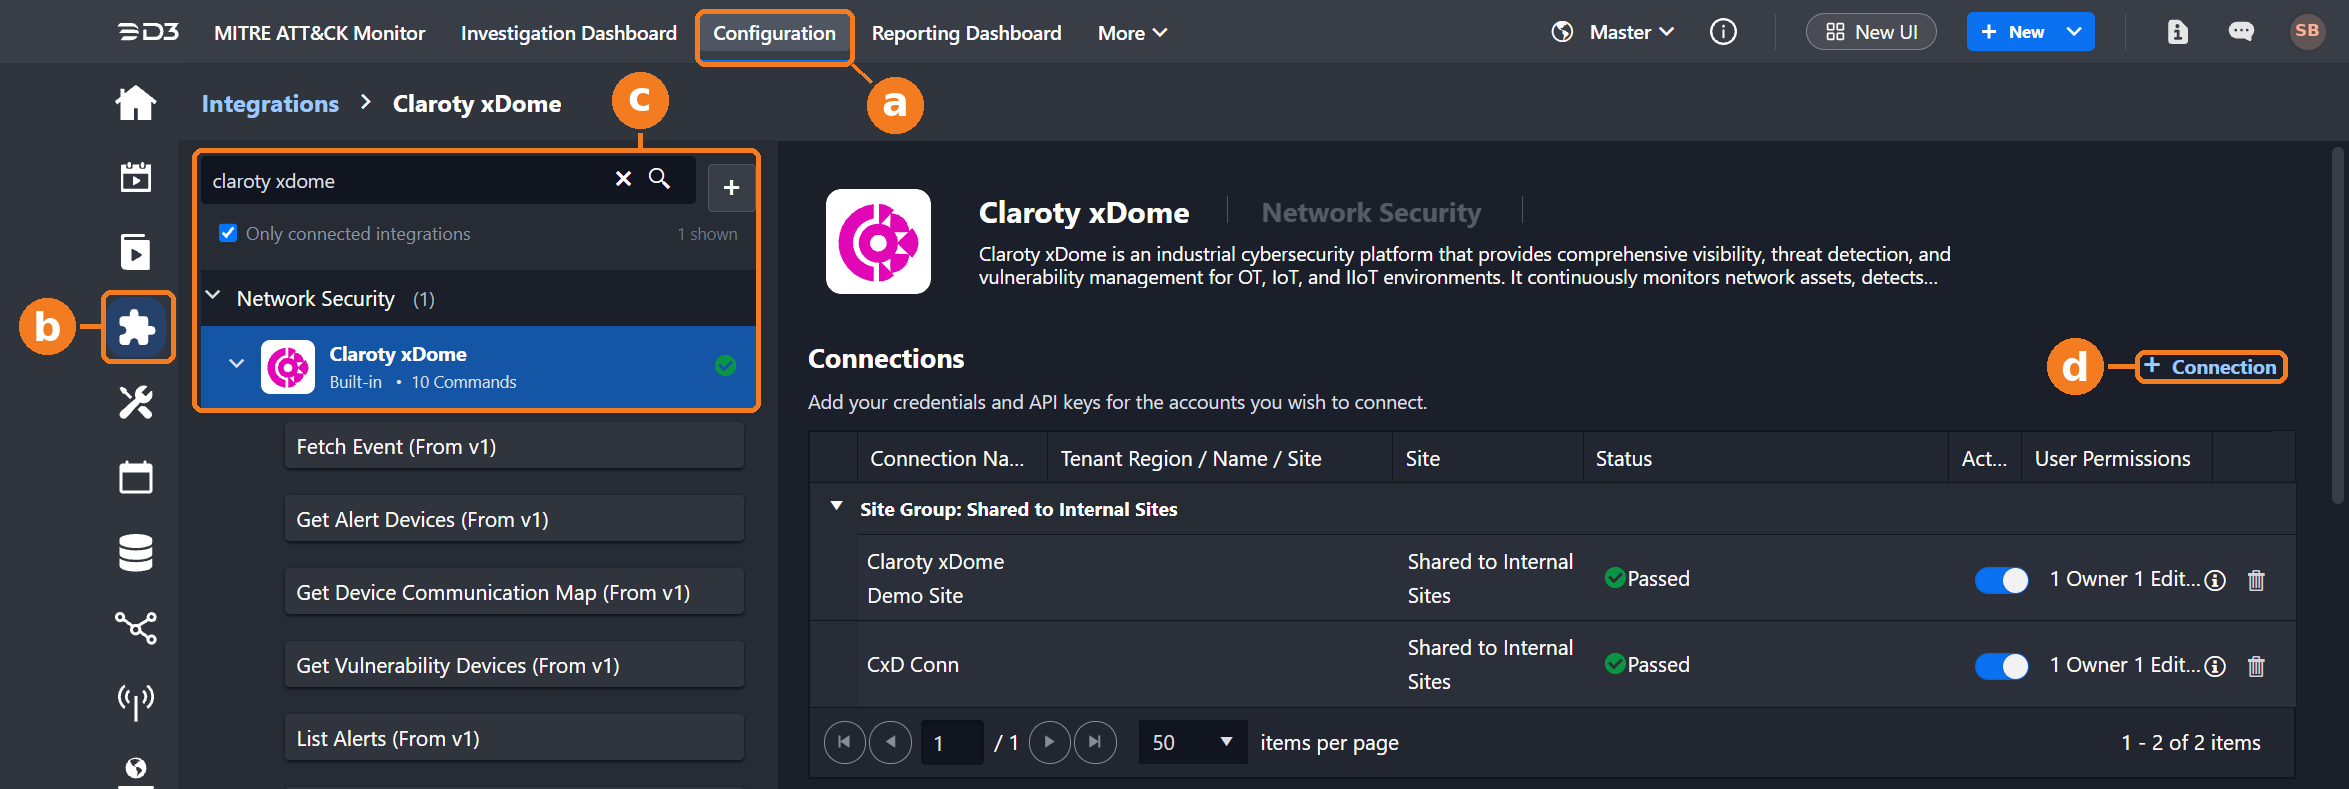
Find the Claroty xDome integration.
-
Navigate to Configuration on the top header menu.
-
Click on the Integration icon on the left sidebar.
-
Type Claroty xDome in the search box to find the integration, then click it to select it.
-
Click on the + Connection button on the right side of the Connections section. A new connection window will appear.
-
-
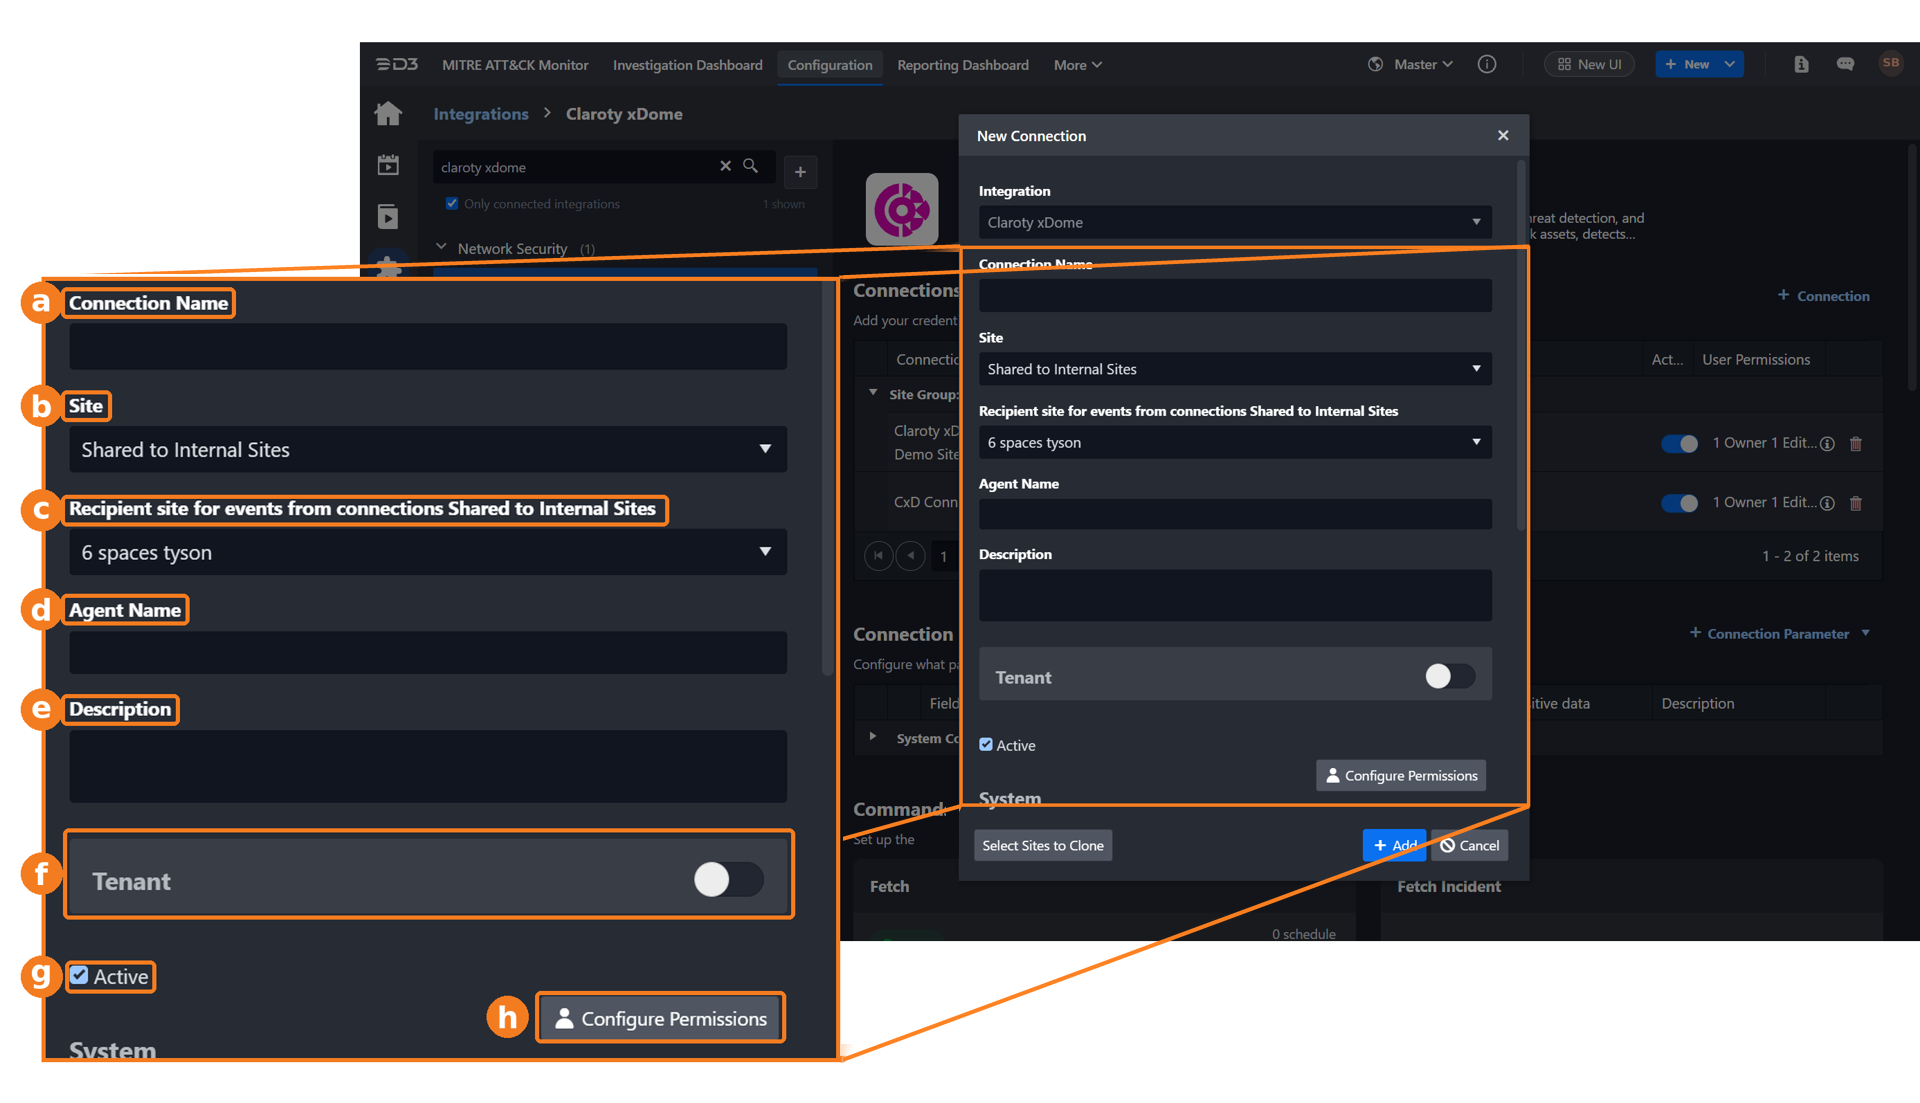
Configure the following fields to create a connection to Claroty xDome.
-
Connection Name: The desired name for the connection.
-
Site: The site on which to use the integration connection. Use the drop-down menu to select the site. The Share to Internal Sites option enables all internal sites to use the connection. Selecting a specific site will only enable that site to use the connection.
-
Recipient site for events from connections Shared to Internal Sites: This field is displayed when Share to Internal Sites is selected for the Site field, allowing selection of the internal site for deploying the integration connection.
-
Agent Name (Optional): The proxy agent required to build the connection. Use the dropdown menu to select the proxy agent from a list of previously configured proxy agents.
-
Description (Optional): The description for the connection.
-
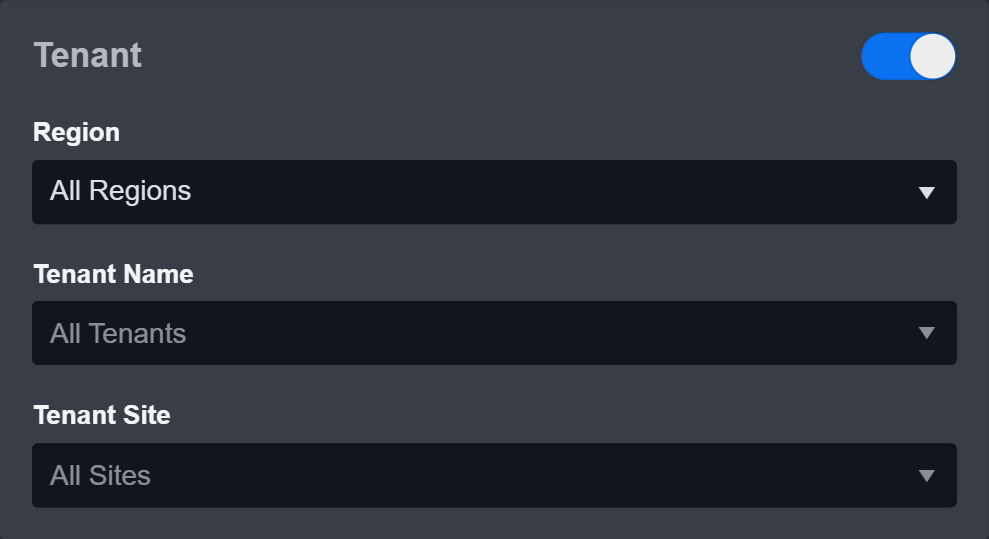
Tenant (Optional): When configuring the connection from a master tenant site, users can choose the specific tenant sites with which to share the connection. Once this setting is enabled, users can filter and select the desired tenant sites from the dropdowns to share the connection.
-
Active: The checkbox that enables the connection to be used when selected.
-
Configure User Permissions: Defines which users have access to the connection.
-
System: This section contains the parameters defined specifically for the integration. These parameters must be configured to create the integration connection.
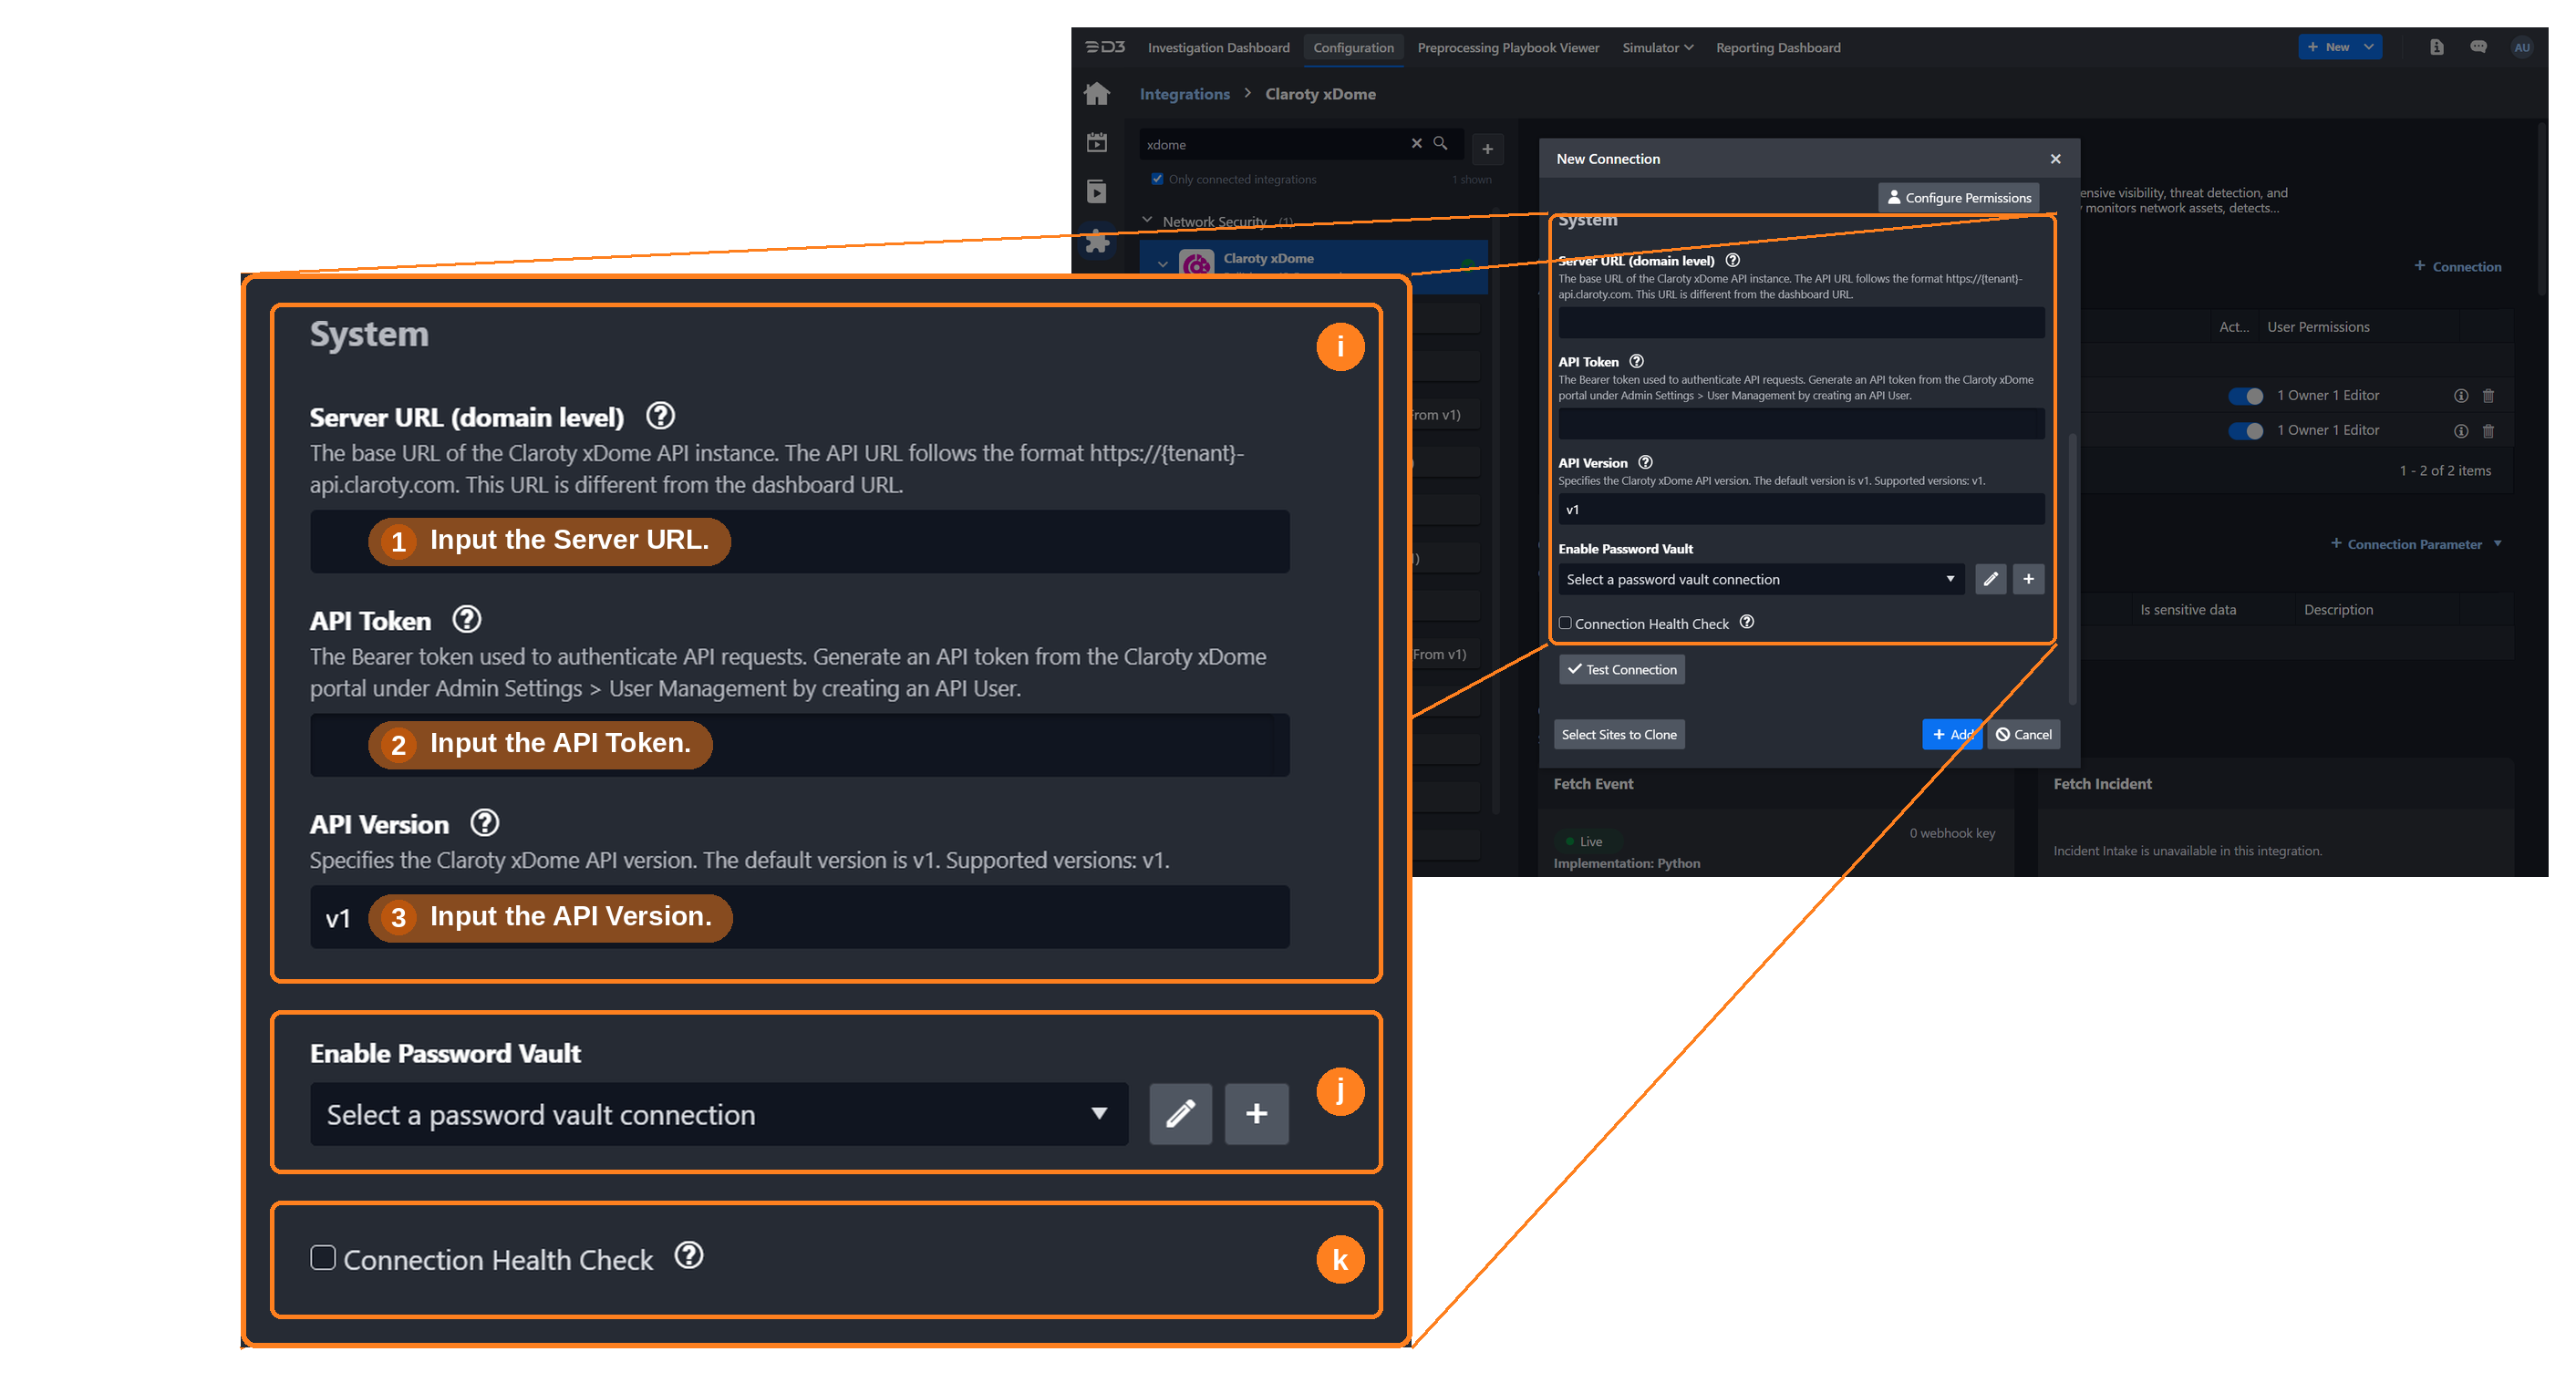
1. Input the Server URL.
2. Input the API Token.
3. Input the API Version. The default value is v1.
-
Enable Password Vault: An optional feature that allows users to take the stored credentials from their own password vault. Refer to the password vault connection guide if needed.
-
Connection Health Check: Periodically checks the connection status by scheduling the Test Connection command at the specified interval (in minutes). Available only for active connections, this feature also allows configuring email notifications for failed attempts.
-
-
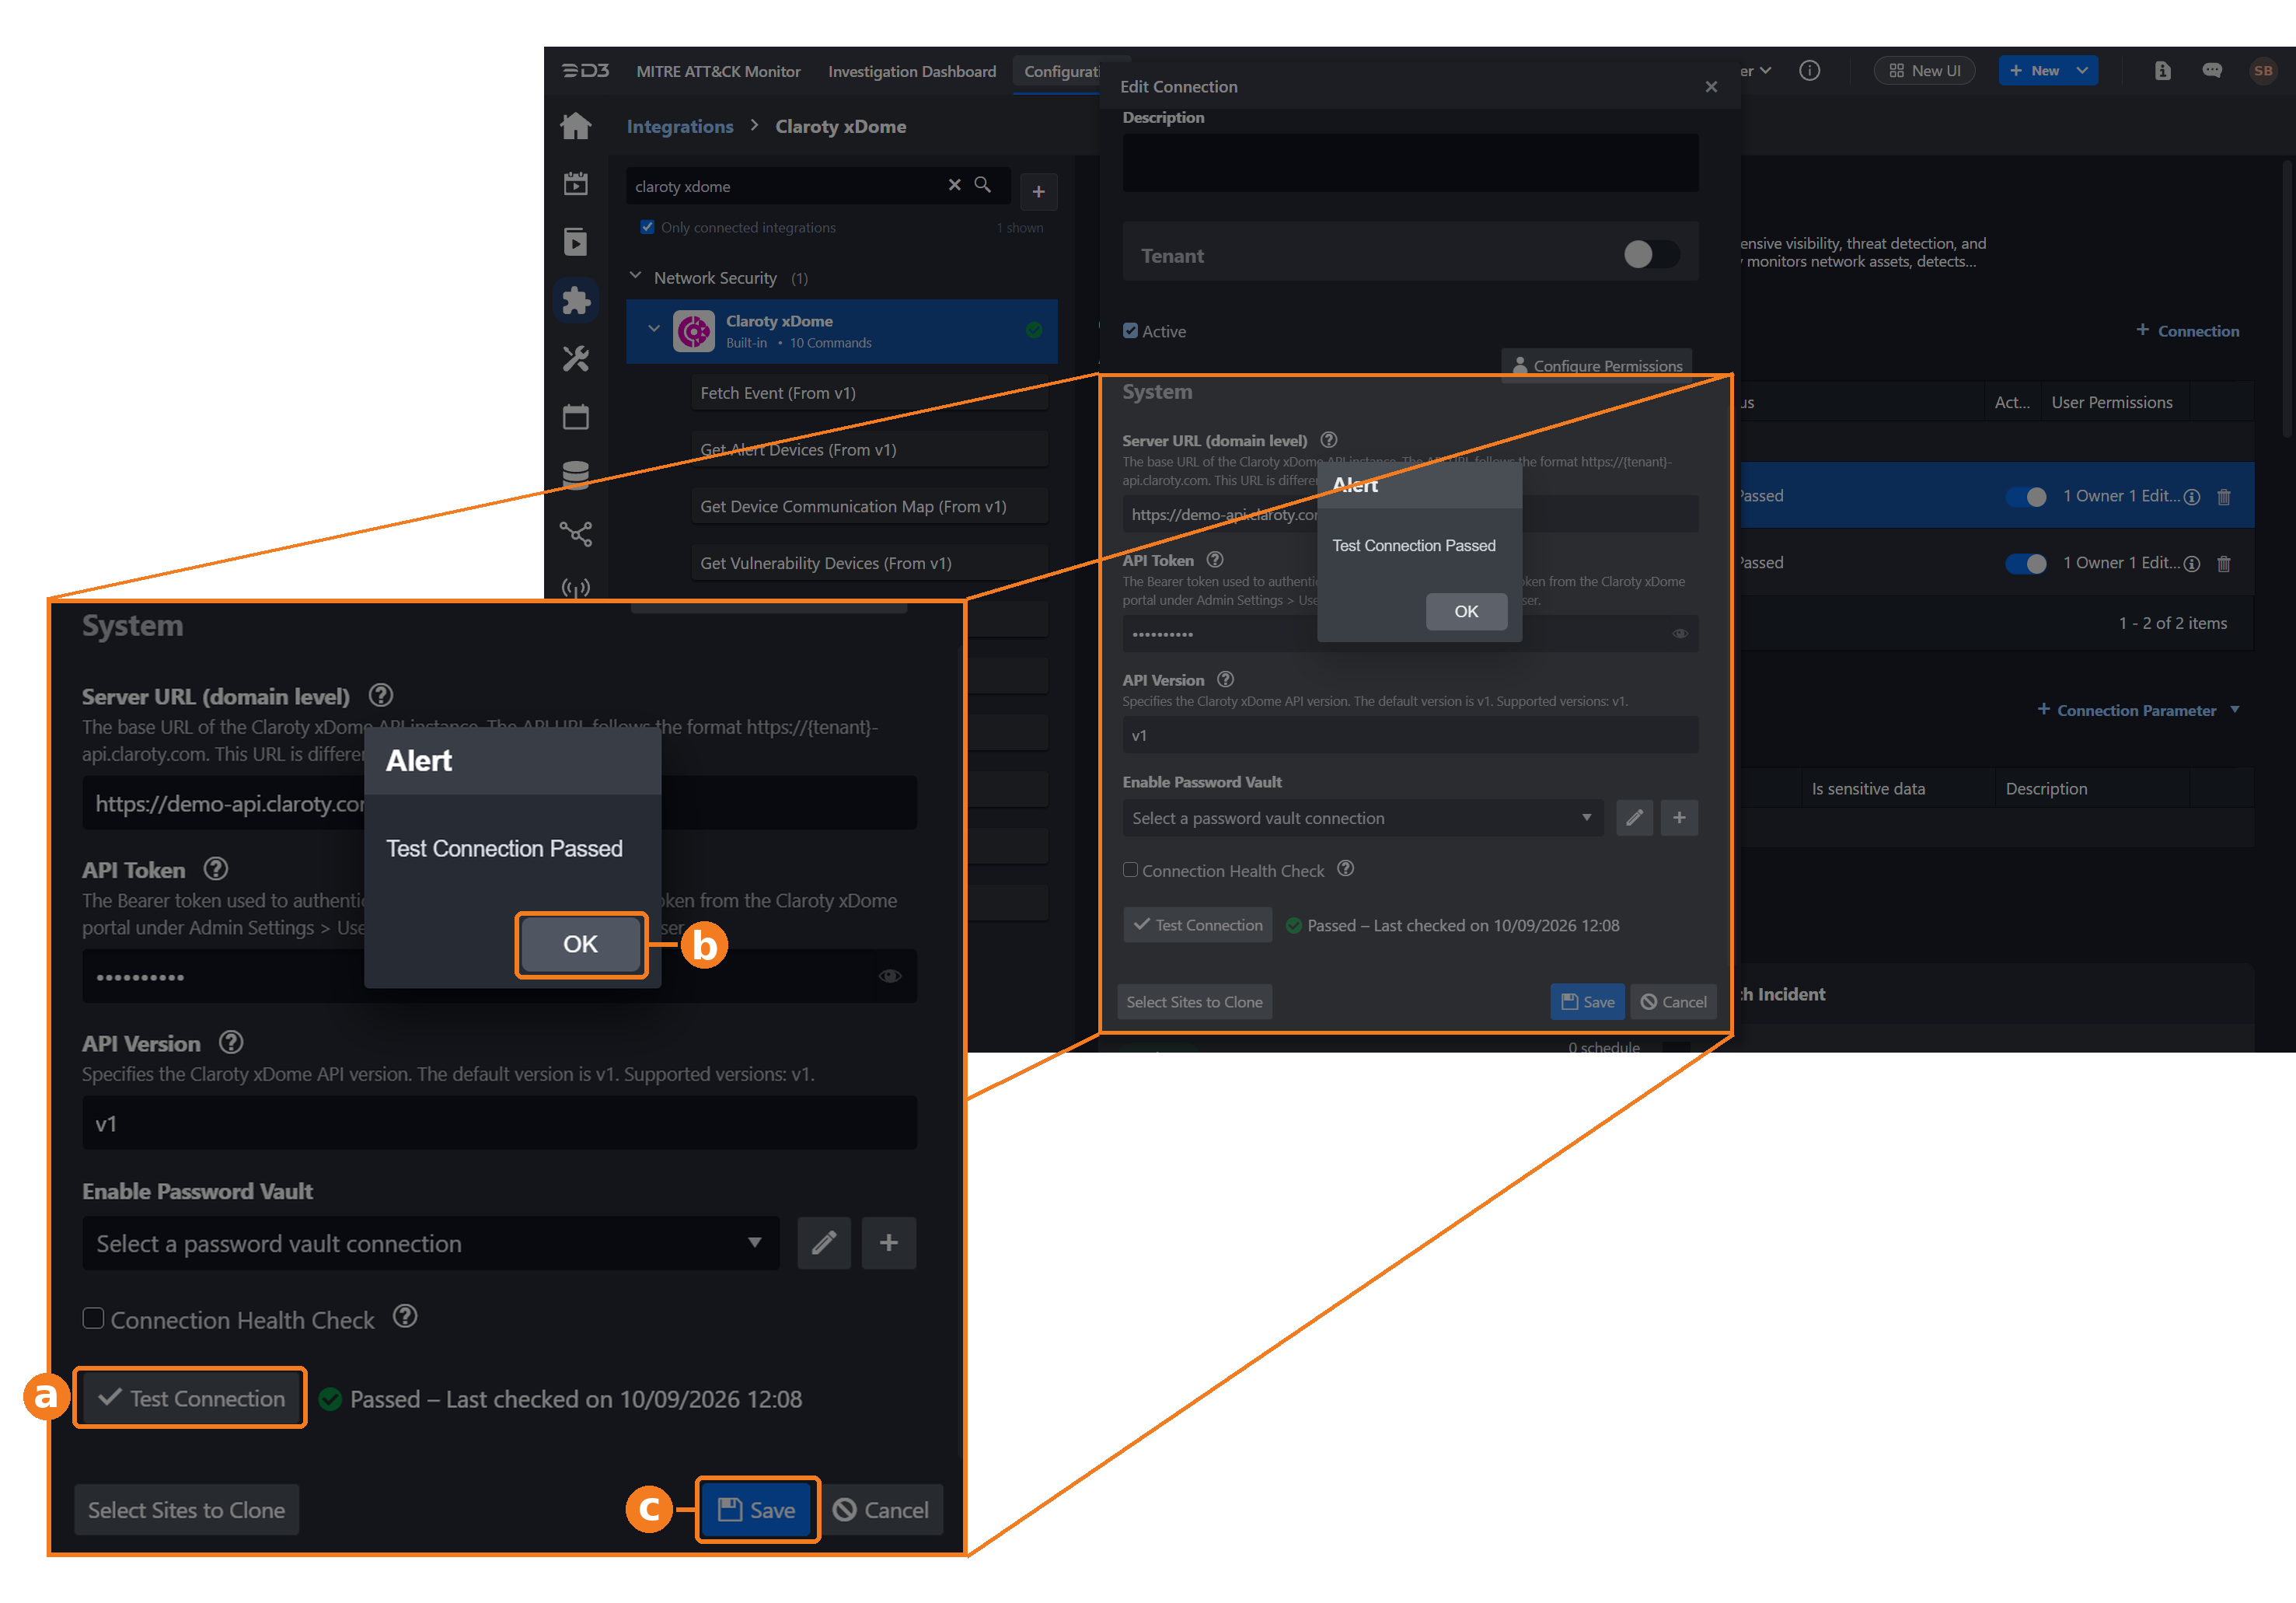
Test the connection.
-
Click on the Test Connection button to verify credentials and connectivity. A success alert displays Passed with a green checkmark. If the connection fails, review the parameters and retry.
-
Click OK to close the alert window.
-
Click Save to create and add the configured connection.
-
API Rate Limits
API calls are rate limited to 2000 calls per minute, applied per endpoint. All tokens generated in the same dashboard share a call quota. Any requests made that are over the quota will return a 429 - Too Many Requests error, which will include a Retry-After field, indicating when additional calls can be made, in number of seconds.
Filters
The endpoints in this API accept a filter_by argument to filter the results returned by the endpoint. Filters can be simple filters over a single field, or compound filters made up of other filters. Commands that support this expose it through their Filters input parameter; see the examples in the command sections below.
Simple Filters
Filters a single field of the result set. The operation may be one of:
|
Operation |
Description |
Value Type |
|---|---|---|
|
|
Checks for equality/inequality of any of the values |
Array of values |
|
|
Checks if the string in value is contained in the field |
String |
|
|
Checks if an IP field is in the subnet in value |
String or list of strings specifying an IP subnet in CIDR notation, such as 192.168.1.0/24 |
|
|
Checks if the field has null value |
None |
|
|
Compares with value |
A number or timestamp (ISO format) to compare with |
|
|
Compares the field with a timestamp relative to the current date and time |
Number of seconds |
Compound Filters
Simple filters can be combined with compound filters. The supported operations are:
-
not— takes a single filter inoperands, and negates the filter's condition -
and,or— take multiple filters inoperands, and combine them with the appropriate boolean operation
Commands
Claroty xDome includes the following executable commands for users to set up schedules or create playbook workflows. With the Test Command function, users can execute these commands independently for playbook troubleshooting.
Integration API Note
For more information about the Claroty xDome API, refer to the Claroty xDome API reference provided with the tenant. The specification is also served by the tenant API host configured in the Server URL connection parameter.
|
READER NOTE
|
Note for Time-related parameters
The input format of time-related parameters may vary based on user account settings, which may cause the sample data in commands to differ from what is displayed. To adjust the time format, follow these steps:
-
Navigate to Configuration > Application Settings. Select Date/Time Format.
-
Choose the desired date and time format, then click on the Save button.
The selected time format will now be visible when configuring Date/Time command input parameters.
List Devices
Retrieves a list of devices from the Claroty xDome platform, including the device category, type, IP and MAC addresses, manufacturer, model, operating system, hostnames, switch and access point connectivity, risk score, and site.
Input
|
Input Parameter |
Required/Optional |
Description |
Example |
|---|---|---|---|
|
Device Category |
Optional |
Filters the devices by category. Valid values are OT, IoT, or IT. By default, devices of all categories are returned. |
|
|
Risk Score |
Optional |
Filters the devices by risk score level. Valid values are Critical, High, Medium, Low, or Very Low. By default, devices of all risk score levels are returned. |
|
|
Site Name |
Optional |
Filters the devices by the name of the site within the organization the device is associated with. By default, devices from all sites are returned. |
|
|
Filters |
Optional |
Additional filter conditions in JSON format using the xDome filter syntax. Simple filter format: {"field": "<field_name>", "operation": "<op>", "value": "<val>"}. Compound filter format: {"operation": "and|or|not", "operands": [{"field": "<field_name>", "operation": "<op>", "value": "<val>"}, {"field": "<field_name>", "operation": "<op>", "value": "<val>"}]}. Supported filter fields include: device_category, risk_score, site_name, device_type, ip_list, purdue_level, manufacturer. Any other device field the command returns can also be used. By default, all devices matching the other parameters are returned. |
{"field": "ip_list", "operation": "in_subnet", "value": ["10.26.0.0/16"]} |
|
Limit |
Optional |
The maximum number of devices returned in a single request. By default, the value is 100. When the value is negative, all devices matching the selected filtering conditions from the Offset position onward are returned. |
|
|
Offset |
Optional |
The number of records to skip before returning results. By default, the value is 0. A negative value is treated as 0. |
|
|
Fields |
Optional |
The device fields returned for each device. When specified, this list replaces the default set, except that uid, asset_id, device_type, and ip_list are always included because the key fields are built from them. Use it to narrow the response, or to request a per-tenant field that is not part of the documented schema, such as a custom attribute named custom_attribute_<api name> or a device purpose named device_purpose_<api name>. By default, the full requestable device schema is returned. |
["uid", "asset_id", "device_name", "os_version", "end_of_life_state"] |
Output
To view the sample output data for all commands, refer to this article.
Error Handling
If the Return Data displays Partially Successful or Failed, an Error tab will appear in the Test Result window.
The error tab contains the details responded from D3 or third-party API calls, including Failure Indicator, Status Code, and Message. This can help locate the root cause of a command failure.
|
Parts in Error |
Description |
Example |
|---|---|---|
|
Failure Indicator |
Indicates the command failure that happened at a specific input and/or API call. |
List Devices failed. |
|
Status Code |
The response code issued by the third-party API server or the D3 system that can be used to locate the corresponding error category. For example, if the returned status code is 401, the selected connection is unauthorized to run the command. The user or system support would need to check the permission setting in the Claroty xDome portal. Refer to the HTTP Status Code Registry for details. |
Status Code: 403. |
|
Message |
The raw data or captured key error message from the integration API server about the API request failure. |
Message: Invalid request — missing required parameter. |
|
Error Sample Data
|
List Alerts
Retrieves a list of alerts from the Claroty xDome platform. Filtering by alert category, status, detection time, and other criteria is supported.
Input
|
Input Parameter |
Required/Optional |
Description |
Example |
|---|---|---|---|
|
Alert IDs |
Optional |
The IDs of the alerts for which to retrieve details. When this parameter is specified, all other filter parameters are ignored. By default, the alerts are not filtered by ID. |
["1", "2"] |
|
Start Time |
Optional |
The start of the alert detection time range, in UTC format (yyyy-MM-dd HH:mm:ss). When the value is empty, the alerts are not filtered by a start time. Ignored when Alert IDs are specified. |
2026-04-01 00:00:00 |
|
End Time |
Optional |
The end of the alert detection time range, in UTC format (yyyy-MM-dd HH:mm:ss). When the value is empty, the alerts are not filtered by an end time. Ignored when Alert IDs are specified. |
2026-04-08 23:59:59 |
|
Category |
Optional |
Filters the alerts by category. Valid values are Risk, Threat, Custom, Segmentation, Policy Deviation, OT Activity, and Device Changes. By default, alerts of all categories are returned. |
["Risk", "Threat"] |
|
Status |
Optional |
Filters the alerts by resolution status. Valid values are Resolved or Unresolved. By default, alerts of both statuses are returned. |
Unresolved |
|
Filters |
Optional |
Additional filter conditions in JSON format using the xDome filter syntax. Simple filter format: {"field": "<field_name>", "operation": "<op>", "value": "<val>"}. Compound filter format: {"operation": "and|or|not", "operands": [{"field": "<field_name>", "operation": "<op>", "value": "<val>"}, {"field": "<field_name>", "operation": "<op>", "value": "<val>"}]}. Supported filter fields include: alert_name, alert_type_name, updated_time, devices_count, unresolved_devices_count. This parameter is ignored when Alert IDs is specified. By default, all alerts matching the other parameters are returned. |
{"field": "alert_type_name", "operation": "in", "value": ["Device End-of-Life"]} |
|
Limit |
Optional |
The maximum number of alerts returned in a single request. By default, the value is 100. When the value is -1, all alerts matching the selected filtering conditions from the Offset position onward are returned. |
2 |
|
Offset |
Optional |
The number of records to skip before returning results. By default, the value is 0. |
0 |
Output
To view the sample output data for all commands, refer to this article.
Error Handling
If the Return Data displays Partially Successful or Failed, an Error tab will appear in the Test Result window.
The error tab contains the details responded from D3 or third-party API calls, including Failure Indicator, Status Code, and Message. This can help locate the root cause of a command failure.
|
Parts in Error |
Description |
Example |
|---|---|---|
|
Failure Indicator |
Indicates the command failure that happened at a specific input and/or API call. |
List Alerts failed. |
|
Status Code |
The response code issued by the third-party API server or the D3 system that can be used to locate the corresponding error category. For example, if the returned status code is 401, the selected connection is unauthorized to run the command. The user or system support would need to check the permission setting in the Claroty xDome portal. Refer to the HTTP Status Code Registry for details. |
Status Code: 403. |
|
Message |
The raw data or captured key error message from the integration API server about the API request failure. |
Message: Invalid request — missing required parameter. |
|
Error Sample Data
|
List Vulnerabilities
Retrieves a list of vulnerabilities from the Claroty xDome platform, including CVE IDs, CVSS scores, EPSS scores, affected device counts, and known exploit indicators.
Input
|
Input Parameter |
Required/Optional |
Description |
Example |
|---|---|---|---|
|
Is Known Exploited |
Optional |
Filters the vulnerabilities by known exploited status. Valid values are True or False. By default, vulnerabilities of both statuses are returned. |
True |
|
Vulnerability Type |
Optional |
Filters the vulnerabilities by type. Valid values are Platform, Application, Clinical, IoT, and OT. By default, vulnerabilities of all types are returned. |
|
|
Filters |
Optional |
Additional filter conditions in JSON format using the xDome filter syntax. Simple filter format: {"field": "<field_name>", "operation": "<op>", "value": "<val>"}. Compound filter format: {"operation": "and|or|not", "operands": [{"field": "<field_name>", "operation": "<op>", "value": "<val>"}, {"field": "<field_name>", "operation": "<op>", "value": "<val>"}]}. Supported filter fields include: name, vulnerability_type, cve_ids, cvss_v2_score, cvss_v3_score, affected_devices_count, is_known_exploited, published_date, adjusted_vulnerability_score_level, epss_score. By default, all vulnerabilities matching the other parameters are returned. |
{"field": "affected_devices_count", "operation": "greater", "value": 0} |
|
Limit |
Optional |
The maximum number of vulnerabilities returned in a single request. By default, the value is 100. When the value is -1, all vulnerabilities matching the selected filtering conditions from the Offset position onward are returned. |
|
|
Offset |
Optional |
The number of records to skip before returning results. By default, the value is 0. |
|
Output
To view the sample output data for all commands, refer to this article.
Error Handling
If the Return Data displays Partially Successful or Failed, an Error tab will appear in the Test Result window.
The error tab contains the details responded from D3 or third-party API calls, including Failure Indicator, Status Code, and Message. This can help locate the root cause of a command failure.
|
Parts in Error |
Description |
Example |
|---|---|---|
|
Failure Indicator |
Indicates the command failure that happened at a specific input and/or API call. |
List Vulnerabilities failed. |
|
Status Code |
The response code issued by the third-party API server or the D3 system that can be used to locate the corresponding error category. For example, if the returned status code is 401, the selected connection is unauthorized to run the command. The user or system support would need to check the permission setting in the Claroty xDome portal. Refer to the HTTP Status Code Registry for details. |
Status Code: 403. |
|
Message |
The raw data or captured key error message from the integration API server about the API request failure. |
Message: Invalid request — missing required parameter. |
|
Error Sample Data
|
Fetch Event
Return Event(s) from the Claroty xDome platform based on specified criteria(s). Ingests alerts as events in descending order of detection time. Ingestion volume is controlled by the Start Time window and the ingestion schedule interval rather than by the Number of Event(s) Fetched value.
Input
|
Input Parameter |
Required/Optional |
Description |
Example |
|---|---|---|---|
|
Start Time |
Optional |
The start of the time range for fetching events (in UTC). By default, the value is one hour before the End Time. |
|
|
End Time |
Optional |
The end of the time range for fetching events (in UTC). By default, the value is the current time. |
|
|
Number of Event(s) Fetched |
Optional |
The maximum number of events to return. By default, the value is empty, and all events in the given time range are returned. A positive value caps the run, and because events are returned in descending order of detection time, the oldest events in the range are dropped. |
|
|
Category |
Optional |
Filters the events by category. Valid values are Risk, Threat, Custom, and Segmentation. By default, events of all categories are returned. |
|
|
Status |
Optional |
Filters the events by resolution status. Valid values are Resolved or Unresolved. By default, events of both statuses are returned. |
|
|
Search Condition |
Optional |
Additional filter conditions in JSON format using the xDome filter syntax. Simple filter format: {"field": "<field_name>", "operation": "<op>", "value": "<val>"}. Compound filter format: {"operation": "and|or|not", "operands": [{"field": "<field_name>", "operation": "<op>", "value": "<val>"}, {"field": "<field_name>", "operation": "<op>", "value": "<val>"}]}. Supported filter fields include: alert_name, alert_type_name, updated_time, devices_count, unresolved_devices_count. |
|
Fetch Event Field Mapping
Event and Incident Intake Field Mapping
See Field Mappings.
The Claroty xDome integration includes pre-configured field mappings for the default event source. The pre-configured field mappings are detailed below:
Main Event JSON Path: $.alerts
|
Field Name |
Source Field |
|---|---|
|
Start Time |
$.detected_time |
|
Unique Event Key |
$.id |
|
Event name |
$.alert_name |
|
Description |
$.description |
|
Alert type |
$.alert_type_name |
|
Status |
$.status |
|
Event category |
$.category |
|
Techniques |
$.mitre_technique_enterprise_names |
|
Alert Class |
$.alert_class |
|
Devices Count |
$.devices_count |
|
Unresolved Devices Count |
$.unresolved_devices_count |
|
OT Devices Count |
$.ot_devices_count |
|
IoT Devices Count |
$.iot_devices_count |
|
IT Devices Count |
$.it_devices_count |
Output
To view the sample output data for all commands, refer to this article.
Error Handling
If the Return Data displays Failed, an Error tab will appear in the Test Result window.
The error tab contains the details responded from D3 or third-party API calls, including Failure Indicator, Status Code, and Message. This can help locate the root cause of a command failure.
|
Parts in Error |
Description |
Example |
|---|---|---|
|
Failure Indicator |
Indicates the command failure that happened at a specific input and/or API call. |
Fetch Event failed. |
|
Status Code |
The response code issued by the third-party API server or the D3 system that can be used to locate the corresponding error category. For example, if the returned status code is 401, the selected connection is unauthorized to run the command. The user or system support would need to check the permission setting in the Claroty xDome portal. Refer to the HTTP Status Code Registry for details. |
Status Code: 403. |
|
Message |
The raw data or captured key error message from the integration API server about the API request failure. |
Message: Invalid request — missing required parameter. |
|
Error Sample Data
|
Get Alert Devices
Retrieves the list of devices affected by a specified alert, including device UID, IP address, category, type, risk score, and resolution status.
|
READER NOTE
|
Input
|
Input Parameter |
Required/Optional |
Description |
Example |
|---|---|---|---|
|
Alert ID |
Required |
The ID of the alert for which to retrieve affected devices. Alert ID can be obtained using the List Alerts command. |
119 |
|
Limit |
Optional |
The maximum number of devices returned in a single request. By default, the value is 100. When the value is -1, all devices affected by the alert from the Offset position onward are returned. |
2 |
|
Offset |
Optional |
The number of records to skip before returning results. By default, the value is 0. |
0 |
Output
To view the sample output data for all commands, refer to this article.
Error Handling
If the Return Data displays Partially Successful or Failed, an Error tab will appear in the Test Result window.
The error tab contains the details responded from D3 or third-party API calls, including Failure Indicator, Status Code, and Message. This can help locate the root cause of a command failure.
|
Parts in Error |
Description |
Example |
|---|---|---|
|
Failure Indicator |
Indicates the command failure that happened at a specific input and/or API call. |
Get Alert Devices failed. |
|
Status Code |
The response code issued by the third-party API server or the D3 system that can be used to locate the corresponding error category. For example, if the returned status code is 401, the selected connection is unauthorized to run the command. The user or system support would need to check the permission setting in the Claroty xDome portal. Refer to the HTTP Status Code Registry for details. |
Status Code: 403. |
|
Message |
The raw data or captured key error message from the integration API server about the API request failure. |
Message: Invalid request — missing required parameter. |
|
Error Sample Data
|
Resolve Alerts
Marks selected alerts as resolved or unresolved in the Claroty xDome platform. The status change can apply to all affected devices or be scoped to specific devices.
|
READER NOTE
|
Input
|
Input Parameter |
Required/Optional |
Description |
Example |
|---|---|---|---|
|
Alert IDs |
Required |
The IDs of the alerts to resolve or unresolve. Alert IDs can be obtained using the List Alerts command. |
["1", "2"] |
|
Status |
Required |
The resolution status to set for the specified alerts. Valid values are Resolved or Unresolved. |
Resolved |
|
Device UIDs |
Optional |
The device UIDs to which the status change is scoped. Device UIDs can be obtained using the Get Alert Devices command. By default, the status change applies to all devices associated with the specified alerts. |
["01e04355-94f2-4c4a-bbb1-f4a307830d5f", "11986eb6-2323-424e-ac65-e412be65fa85"] |
Output
To view the sample output data for all commands, refer to this article.
Error Handling
If the Return Data displays Failed, an Error tab will appear in the Test Result window.
The error tab contains the details responded from D3 or third-party API calls, including Failure Indicator, Status Code, and Message. This can help locate the root cause of a command failure.
|
Parts in Error |
Description |
Example |
|---|---|---|
|
Failure Indicator |
Indicates the command failure that happened at a specific input and/or API call. |
Resolve Alerts failed. |
|
Status Code |
The response code issued by the third-party API server or the D3 system that can be used to locate the corresponding error category. For example, if the returned status code is 401, the selected connection is unauthorized to run the command. The user or system support would need to check the permission setting in the Claroty xDome portal. Refer to the HTTP Status Code Registry for details. |
Status Code: 403. |
|
Message |
The raw data or captured key error message from the integration API server about the API request failure. |
Message: Invalid request — missing required parameter. |
|
Error Sample Data
|
Get Device Communication Map
Retrieves the communication map of a device from the Claroty xDome platform, including the peer device, communication type, protocol, port, direction, data volume, and first and last communication times of each connection. The response covers communications from the past 90 days.
|
READER NOTE
|
Input
|
Input Parameter |
Required/Optional |
Description |
Example |
|---|---|---|---|
|
Asset ID |
Optional |
The asset ID of the device for which the communication map is retrieved. Either Asset ID or Device UID is required. When both are provided, Asset ID takes precedence and Device UID is ignored. Asset ID can be obtained using the List Devices command. |
|
|
Device UID |
Optional |
The unique identifier of the device for which the communication map is retrieved. Either Asset ID or Device UID is required. When both are provided, Asset ID takes precedence and Device UID is ignored. Device UID can be obtained using the List Devices command. |
00023e71-72b6-4824-9063-b63785e7d494 |
|
Filters |
Optional |
Filter conditions in JSON format using the xDome filter syntax. Simple filter format: {"field": "<field_name>", "operation": "<op>", "value": "<val>"}. Compound filter format: {"operation": "and|or|not", "operands": [{"field": "<field_name>", "operation": "<op>", "value": "<val>"}, {"field": "<field_name>", "operation": "<op>", "value": "<val>"}]}. Supported filter fields are comm_type, protocol, ip_protocol, port, direction, first_comm, last_comm, comm_device_role, comm_side_b_ip, and side_b_asset_id. All other returned fields are not filterable. By default, all communication records for the device are returned. |
{"field": "comm_type", "operation": "in", "value": ["Internet"]} |
Output
To view the sample output data for all commands, refer to this article.
Error Handling
If the Return Data displays Partially Successful or Failed, an Error tab will appear in the Test Result window.
The error tab contains the details responded from D3 or third-party API calls, including Failure Indicator, Status Code, and Message. This can help locate the root cause of a command failure.
|
Parts in Error |
Description |
Example |
|---|---|---|
|
Failure Indicator |
Indicates the command failure that happened at a specific input and/or API call. |
Get Device Communication Map failed. |
|
Status Code |
The response code issued by the third-party API server or the D3 system that can be used to locate the corresponding error category. For example, if the returned status code is 401, the selected connection is unauthorized to run the command. The user or system support would need to check the permission setting in the Claroty xDome portal. Refer to the HTTP Status Code Registry for details. |
Status Code: 403. |
|
Message |
The raw data or captured key error message from the integration API server about the API request failure. |
Message: Invalid request — missing required parameter. |
|
Error Sample Data
|
Get Vulnerability Devices
Retrieves the devices affected by a vulnerability from the Claroty xDome platform, including the device identifiers, IP and MAC addresses, category, type, manufacturer, model, site, Purdue level, and risk score.
|
READER NOTE
|
Input
|
Input Parameter |
Required/Optional |
Description |
Example |
|---|---|---|---|
|
Vulnerability ID |
Required |
The identifier of the vulnerability for which affected devices are retrieved. The value is the Claroty xDome vulnerability identifier, not the CVE identifier. Vulnerability ID can be obtained using the List Vulnerabilities command. |
|
|
Filters |
Optional |
Filter conditions in JSON format using the xDome filter syntax. Simple filter format: {"field": "<field_name>", "operation": "<op>", "value": "<val>"}. Compound filter format: {"operation": "and|or|not", "operands": [{"field": "<field_name>", "operation": "<op>", "value": "<val>"}, {"field": "<field_name>", "operation": "<op>", "value": "<val>"}]}. Supported filter fields include: risk_score, device_category, device_type, site_name, purdue_level, manufacturer. Any other device field the command returns can also be used. By default, all devices affected by the vulnerability are returned. |
{"field": "risk_score", "operation": "in", "value": ["Critical"]} |
|
Limit |
Optional |
The maximum number of affected devices returned in a single request. By default, the value is 500. When the value is -1, all affected devices from the Offset position onward are returned. |
|
|
Offset |
Optional |
The number of records to skip before returning results. By default, the value is 0. |
|
Output
To view the sample output data for all commands, refer to this article.
Error Handling
If the Return Data displays Partially Successful or Failed, an Error tab will appear in the Test Result window.
The error tab contains the details responded from D3 or third-party API calls, including Failure Indicator, Status Code, and Message. This can help locate the root cause of a command failure.
|
Parts in Error |
Description |
Example |
|---|---|---|
|
Failure Indicator |
Indicates the command failure that happened at a specific input and/or API call. |
Get Vulnerability Devices failed. |
|
Status Code |
The response code issued by the third-party API server or the D3 system that can be used to locate the corresponding error category. For example, if the returned status code is 401, the selected connection is unauthorized to run the command. The user or system support would need to check the permission setting in the Claroty xDome portal. Refer to the HTTP Status Code Registry for details. |
Status Code: 403. |
|
Message |
The raw data or captured key error message from the integration API server about the API request failure. |
Message: Invalid request — missing required parameter. |
|
Error Sample Data
|
List OT Activity Events
Retrieves OT activity events from the Claroty xDome platform, including the event type, source and destination device, IP address, port, protocol, and the user who performed the operation. Results are returned in descending order of detection time.
Input
|
Input Parameter |
Required/Optional |
Description |
Example |
|---|---|---|---|
|
Alert IDs |
Optional |
Returns only the OT activity events associated with the specified alerts, which resolves an ingested alert to the individual operations behind it. Alert IDs can be obtained using the Fetch Event command. By default, events are returned regardless of the alert they are associated with. |
["1000039"] |
|
Start Time |
Optional |
The start of the time range for retrieving OT activity events, in UTC format (yyyy-MM-dd HH:mm:ss). By default, events are not filtered by a start time. |
|
|
End Time |
Optional |
The end of the time range for retrieving OT activity events, in UTC format (yyyy-MM-dd HH:mm:ss). By default, events are not filtered by an end time. |
|
|
Event Types |
Optional |
Filters the events by operation type. Common values are Configuration Upload, Configuration Download, File System Change, Mode Change, Online Edit, Monitor Mode, Memory Reset, Firmware Download, Settings Change, and DCS Configuration Change. The API does not restrict this field to a fixed list, so a value specific to the environment is also accepted. By default, events of all types are returned. |
["Configuration Upload", "Firmware Download"] |
|
Source Asset ID |
Optional |
Returns only the events originating from the specified device. Source Asset ID can be obtained using the List Devices command. By default, events from all source devices are returned. |
|
|
Destination Asset ID |
Optional |
Returns only the events targeting the specified device. Destination Asset ID can be obtained using the List Devices command. By default, events to all destination devices are returned. |
|
|
Filters |
Optional |
Additional filter conditions in JSON format using the xDome filter syntax. Simple filter format: {"field": "<field_name>", "operation": "<op>", "value": "<val>"}. Compound filter format: {"operation": "and|or|not", "operands": [{"field": "<field_name>", "operation": "<op>", "value": "<val>"}, {"field": "<field_name>", "operation": "<op>", "value": "<val>"}]}. Supported filter fields include: event_id, event_type, detection_time, related_alert_ids, source_asset_id, source_ip, source_username, dest_asset_id, dest_ip, protocol, mode. On detection_time only the greater_or_equal and less_or_equal operations are accepted. By default, all events matching the other parameters are returned. |
{"field": "protocol", "operation": "in", "value": ["CIP"]} |
|
Limit |
Optional |
The maximum number of OT activity events returned in a single request. By default, the value is 500. When the value is -1, all events matching the selected filtering conditions from the Offset position onward are returned. |
|
|
Offset |
Optional |
The number of records to skip before returning results. By default, the value is 0. |
|
Output
To view the sample output data for all commands, refer to this article.
Error Handling
If the Return Data displays Partially Successful or Failed, an Error tab will appear in the Test Result window.
The error tab contains the details responded from D3 or third-party API calls, including Failure Indicator, Status Code, and Message. This can help locate the root cause of a command failure.
|
Parts in Error |
Description |
Example |
|---|---|---|
|
Failure Indicator |
Indicates the command failure that happened at a specific input and/or API call. |
List OT Activity Events failed. |
|
Status Code |
The response code issued by the third-party API server or the D3 system that can be used to locate the corresponding error category. For example, if the returned status code is 401, the selected connection is unauthorized to run the command. The user or system support would need to check the permission setting in the Claroty xDome portal. Refer to the HTTP Status Code Registry for details. |
Status Code: 403. |
|
Message |
The raw data or captured key error message from the integration API server about the API request failure. |
Message: Invalid request — missing required parameter. |
|
Error Sample Data
|
Update Notes
Adds or replaces the note on the specified alerts, devices, vulnerabilities, or device-vulnerability pairs in Claroty xDome. By default, the text is appended to any existing note; it can also overwrite the note entirely.
Input
|
Input Parameter |
Required/Optional |
Description |
Example |
|---|---|---|---|
|
Target Type |
Required |
The type of record to annotate. Supported values: Alert, Device, Vulnerability, Device Vulnerability. |
Alert |
|
Target IDs |
Optional |
The IDs of the records to annotate. The meaning follows Target Type: alert IDs for Alert, device UIDs for Device, and vulnerability IDs for both Vulnerability and Device Vulnerability. For Device Vulnerability the note is applied to every device paired with the specified vulnerabilities, unless Filters narrows the selection further. Alert IDs can be obtained using the List Alerts command, device UIDs using the List Devices command, and vulnerability IDs using the List Vulnerabilities command. Either this parameter or Filters must be specified. Note: Target IDs is required for the Alert target type, which does not support Filters. |
[ "165", "164" ] |
|
Filters |
Optional |
A JSON object selecting the devices, vulnerabilities, or device-vulnerability pairs to annotate, for selections that cannot be expressed as a list of IDs. For the Device Vulnerability target type the filter is evaluated against the device-vulnerability relation fields, the same fields returned by the List Device Vulnerability Relations command, so the device side can be named with device_uid or device_asset_id. When Target IDs is also specified, both conditions apply and only the records matching them together are annotated. Either this parameter or Target IDs must be specified. Note: Filters is ignored for the Alert target type, which is selected by Target IDs only. |
{ "field": "risk_score", "operation": "in", "value": [ "Critical" ] } |
|
Note |
Required |
The note text to record against the selected records. |
Escalated to the OT security team for review. |
|
Action |
Optional |
Whether to add the text to the existing note or replace it. Supported values: Append, Overwrite. If not specified, the text is appended. Overwrite discards the existing note, which cannot be recovered afterwards. |
Append |
Output
To view the sample output data for all commands, refer to this article.
Error Handling
If the Return Data displays Failed, an Error tab will appear in the Test Result window.
The error tab contains the details responded from D3 or third-party API calls, including Failure Indicator, Status Code, and Message. This can help locate the root cause of a command failure.
|
Parts in Error |
Description |
Example |
|---|---|---|
|
Failure Indicator |
Indicates the command failure that happened at a specific input and/or API call. |
Update Notes failed. |
|
Status Code |
The response code issued by the third-party API server or the D3 system that can be used to locate the corresponding error category. For example, if the returned status code is 401, the selected connection is unauthorized to run the command. The user or system support would need to check the permission setting in the Claroty xDome portal. Refer to the HTTP Status Code Registry for details. |
Status Code: 403. |
|
Message |
The raw data or captured key error message from the integration API server about the API request failure. |
Message: Invalid request — missing required parameter. |
|
Error Sample Data
|
List Device Alert Relations
Retrieves the device-alert relations from the Claroty xDome platform, the data behind the Alerted Devices page, where each record pairs one alert with one affected device. Filtering by network threat signature, signature severity, alert ID, device asset ID, alert type, and detection time is supported. This is the only command that returns network threat signature details, which are not exposed by any other endpoint.
Input
|
Input Parameter |
Required/Optional |
Description |
Example |
|---|---|---|---|
|
Alert IDs |
Optional |
Filters the records to the specified alerts. Alert IDs can be obtained using the List Alerts command or from the Event ID of an ingested event. By default, records for all alerts are returned. |
[ "1000060", "1000062" ] |
|
Device Asset IDs |
Optional |
Filters the records to the specified devices. Device Asset IDs can be obtained using the List Devices command. By default, records for all devices are returned. |
[ "CRYPBVJ" ] |
|
Signature IDs |
Optional |
Filters the records by network threat signature identifier. The value is the signature rule identifier assigned by the signature provider, such as an Emerging Threats rule ID. Signature IDs can be obtained from the Signature IDs key field of this command, or from the name of a Network Threat Signature alert, which the platform formats as |
[ "2017583" ] |
|
Filters |
Optional |
Filter conditions in JSON format using the xDome filter syntax. Simple filter format: {"field": "<field_name>", "operation": "<op>", "value": "<val>"}. Compound filter format: {"operation": "and\ |
{ "operation": "and", "operands": [ { "field": "alert_category", "operation": "in", "value": [ "Threat" ] }, { "field": "network_signature_name", "operation": "contains", "value": "CryptoLocker" } ] } |
|
Fields |
Optional |
The device-alert relation fields to return for each record. By default, all fields in the device-alert relation schema are returned. Specify a list to return only the fields you need — alert_id, device_uid, device_asset_id, network_signature_name, network_signature_id, and alert_note are always returned in addition to your selection. Use this parameter to keep large result sets manageable, and to request only the fields your tenant is licensed for. Requesting a field your licence does not cover causes the command to fail. |
[ "alert_id", "device_uid", "alert_name", "alert_note" ] |
Output
To view the sample output data for all commands, refer to this article.
Error Handling
If the Return Data displays Partially Successful or Failed, an Error tab will appear in the Test Result window.
The error tab contains the details responded from D3 or third-party API calls, including Failure Indicator, Status Code, and Message. This can help locate the root cause of a command failure.
|
Parts in Error |
Description |
Example |
|---|---|---|
|
Failure Indicator |
Indicates the command failure that happened at a specific input and/or API call. |
List Device Alert Relations failed. |
|
Status Code |
The response code issued by the third-party API server or the D3 system that can be used to locate the corresponding error category. For example, if the returned status code is 401, the selected connection is unauthorized to run the command. The user or system support would need to check the permission setting in the Claroty xDome portal. Refer to the HTTP Status Code Registry for details. |
Status Code: 403. |
|
Message |
The raw data or captured key error message from the integration API server about the API request failure. |
Message: Invalid request — missing required parameter. |
|
Error Sample Data
|
List Device Vulnerability Relations
Retrieves the device-vulnerability relations from the Claroty xDome platform, the data behind the vulnerabilities table on the single device page, where each record pairs one vulnerability with one affected device. Filtering by vulnerability ID, device asset ID, and any other field the endpoint exposes is supported. Each record carries three separate notes — the note on the device, the note on the vulnerability, and the note on the pairing itself — and all three are returned as key fields, which makes this the read path for a note written by Update Notes against the Device Vulnerability target type.
Input
|
Input Parameter |
Required/Optional |
Description |
Example |
|---|---|---|---|
|
Vulnerability IDs |
Optional |
Filters the records to the specified vulnerabilities. The value is the Claroty xDome vulnerability identifier, not the CVE identifier. Vulnerability IDs can be obtained using the List Vulnerabilities command. By default, records for all vulnerabilities are returned. |
[ "ANEHUJVR" ] |
|
Device Asset IDs |
Optional |
Filters the records to the specified devices. Device Asset IDs can be obtained using the List Devices command. By default, records for all devices are returned. |
[ "DYOHZKA" ] |
|
Filters |
Optional |
Filter conditions in JSON format using the xDome filter syntax. Simple filter format: {"field": "<field_name>", "operation": "<op>", "value": "<val>"}. Compound filter format: {"operation": "and\ |
{ "operation": "and", "operands": [ { "field": "vulnerability_relevance", "operation": "in", "value": [ "Confirmed" ] }, { "field": "device_risk_score", "operation": "in", "value": [ "Critical" ] } ] } |
|
Limit |
Optional |
The maximum number of records to return. The default value is 100. If set to -1, returns all records that satisfy the selected filtering conditions from the Offset position onward. Note: This command returns one record for each vulnerability and device pair, so the total number of records is typically much larger than the number of vulnerabilities or devices on the platform. Narrowing the results with the other parameters before removing the limit is recommended. |
2 |
|
Offset |
Optional |
The number of records to skip before returning results. The default value is 0. |
0 |
|
Fields |
Optional |
The device-vulnerability relation fields to return for each record. By default, all fields in the device-vulnerability relation schema are returned. Specify a list to return only the fields you need — vulnerability_id, device_uid, device_asset_id, device_vulnerability_note, device_note, and vulnerability_note are always returned in addition to your selection. Use this parameter to keep large result sets manageable, and to request only the fields your tenant is licensed for. Requesting a field your licence does not cover makes the API reject the whole request; this command drops the fields it names and retries once, so the call still succeeds, but naming only licensed fields avoids the extra round trip. |
[ "vulnerability_id", "device_uid", "device_asset_id", "device_risk_score" ] |
Output
To view the sample output data for all commands, refer to this article.
Error Handling
If the Return Data displays Partially Successful or Failed, an Error tab will appear in the Test Result window.
The error tab contains the details responded from D3 or third-party API calls, including Failure Indicator, Status Code, and Message. This can help locate the root cause of a command failure.
|
Parts in Error |
Description |
Example |
|---|---|---|
|
Failure Indicator |
Indicates the command failure that happened at a specific input and/or API call. |
List Device Vulnerability Relations failed. |
|
Status Code |
The response code issued by the third-party API server or the D3 system that can be used to locate the corresponding error category. For example, if the returned status code is 401, the selected connection is unauthorized to run the command. The user or system support would need to check the permission setting in the Claroty xDome portal. Refer to the HTTP Status Code Registry for details. |
Status Code: 403. |
|
Message |
The raw data or captured key error message from the integration API server about the API request failure. |
Message: Invalid request — missing required parameter. |
|
Error Sample Data
|
Test Connection
Performs a health check on the integration connection. A periodic health check can be scheduled by selecting Connection Health Check when editing the integration connection.
Input
N/A
Output
|
Output Type |
Description |
Return Data Type |
|---|---|---|
|
Return Data |
Indicates one of the possible command execution states: Successful or Failed.
|
String |
Error Handling
If the Return Data displays Failed, an Error tab will appear in the Test Result window.
The error tab contains the details responded from D3 or third-party API calls, including Failure Indicator, Status Code, and Message. This can help locate the root cause of a command failure.
|
Parts in Error |
Description |
Example |
|---|---|---|
|
Failure Indicator |
Indicates the command failure that happened at a specific input and/or API call. |
Test Connection failed. Failed to check the connector. |
|
Status Code |
The response code issued by the third-party API server or the D3 system that can be used to locate the corresponding error category. For example, if the returned status code is 401, the selected connection is unauthorized to run the command. The user or system support would need to check the permission setting in the Claroty xDome portal. Refer to the HTTP Status Code Registry for details. |
Status Code: 403. |
|
Message |
The raw data or captured key error message from the integration API server about the API request failure. |
Message: You must have a valid support account to call this API. |
|
Error Sample Data
|