
Last Updated: November 10, 2026
Overview
The Investigation Dashboard is where analysts work through everything D3 Morpheus has ingested or created: events, incidents, pending tasks, artifacts and playbook errors. In 18.6 each of these is its own list under WORKSPACE in the sidebar:
|
List |
What it holds |
|---|---|
|
Events |
Every ingested event, to investigate, escalate or dismiss. |
|
Incidents |
Every incident, however it was created. |
|
Pending Tasks |
Playbook and ad hoc tasks waiting for someone's input. |
|
Artifacts |
The artifacts found in events and incidents. |
|
Playbook Errors |
Errors from playbook runs. |
There is no single page called Investigation Dashboard in 18.6. The name is still used for the role permissions that control these lists: Operational Modules > Investigation Dashboard, with Enable Pending Task List, Enable Wildcard Search, Enable Custom View and Manage Ongoing Surveillance.
Working with a List
Every list has the same controls at the top:
-
The site list, for example Security Operations, chooses which site's data to show. From the master site, tenant data is in views named like All Events (AMER Tenant).
-
The view list chooses a saved view, for example All Open or Investigated by Me. See Setting Up a Custom View to make your own.
-
Search, refresh and columns icons at the top right.
-
Sort or filter a column from its header.
The Events list
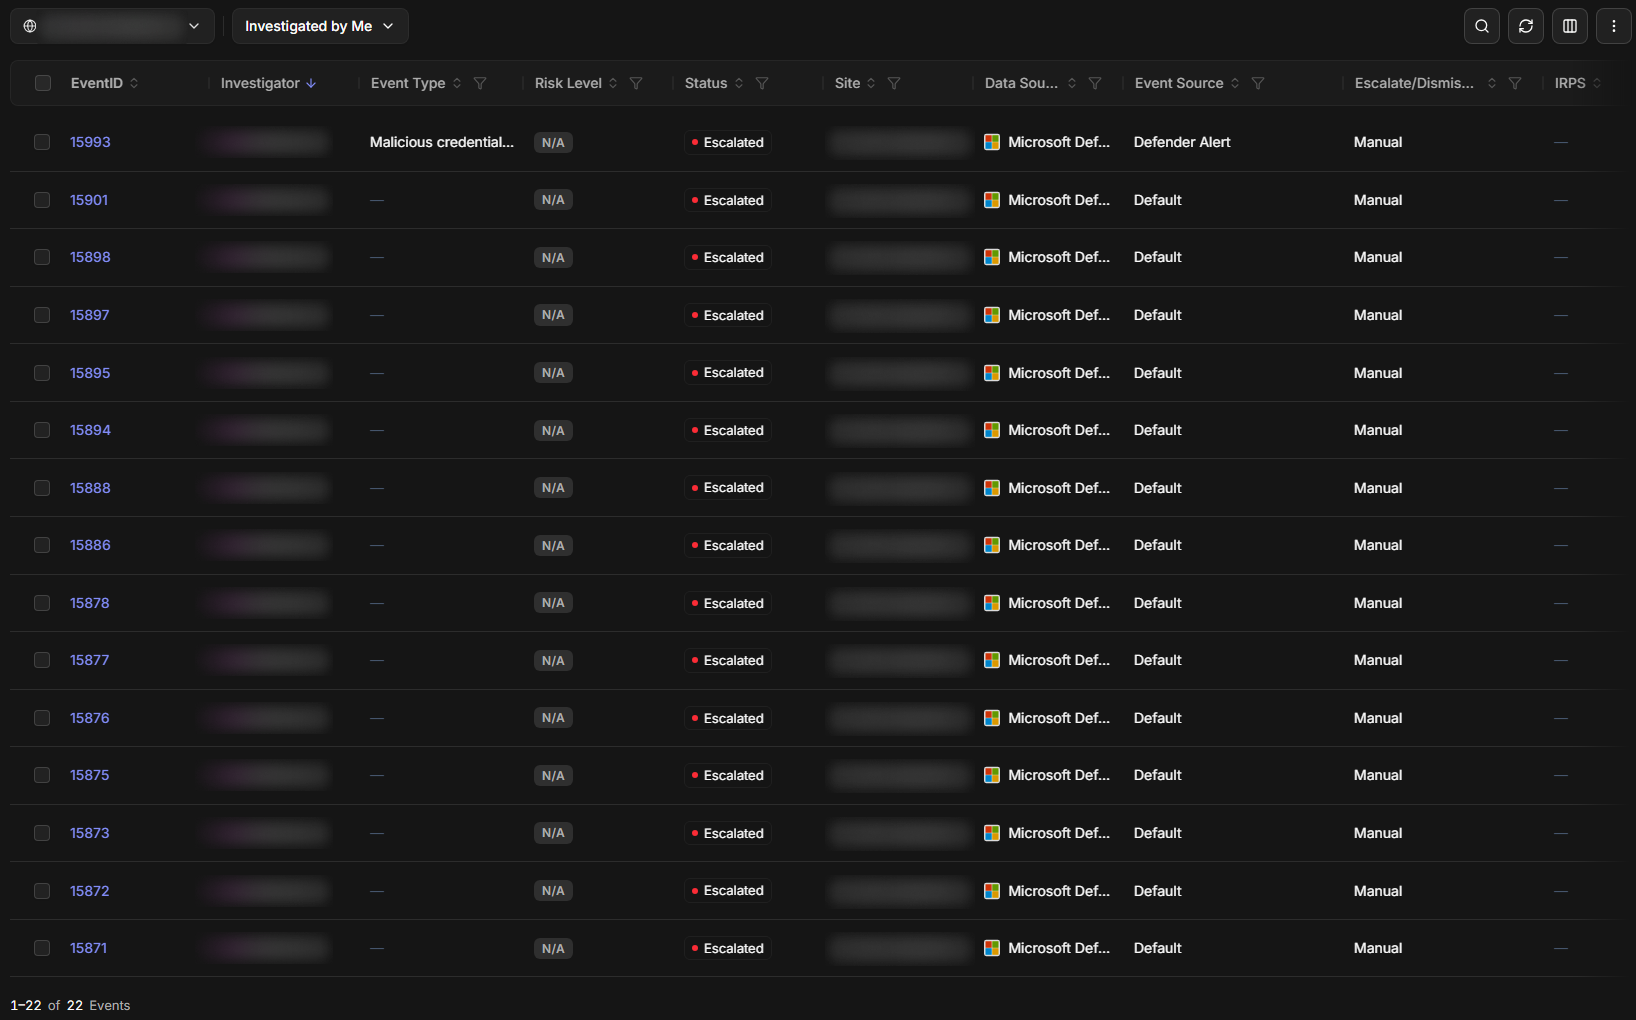
Customizing a List
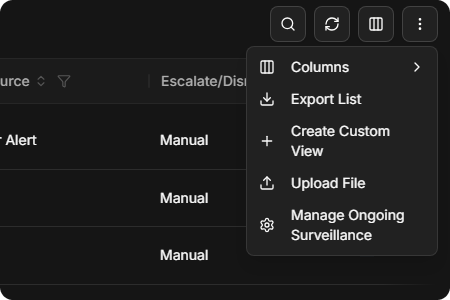
The more icon (⋮) at the top right has:
|
Item |
What it does |
|---|---|
|
Columns |
Shows, hides and orders columns. |
|
Export List |
Saves the list to a file. |
|
Create Custom View |
Saves the current filters and columns as a view. |
|
Upload File |
Uploads events or incidents from a JSON file (Events only). |
|
Manage Ongoing Surveillance |
Opens ongoing surveillance settings (Events only). |
The more menu
Upload File opens the Upload File window:
-
Drop a file on the upload area, or select it to browse. Only JSON files are accepted.
-
Choose the Site, the Action (Create Event or Create Incident) and the Integration.
-
Optionally, open Additional Settings to choose a Data Formatter and a Preprocessing Playbook, and to turn on Run MITRE TTP Search (maps tactics and techniques on the new events) and Run Event Automation Rules (runs the dismissal and escalation rules).
-
Select Upload.
Events
Select an event's ID to open its details. An unassigned event shows Assign To Me in the Investigator column; select it to take the event.
Event Details
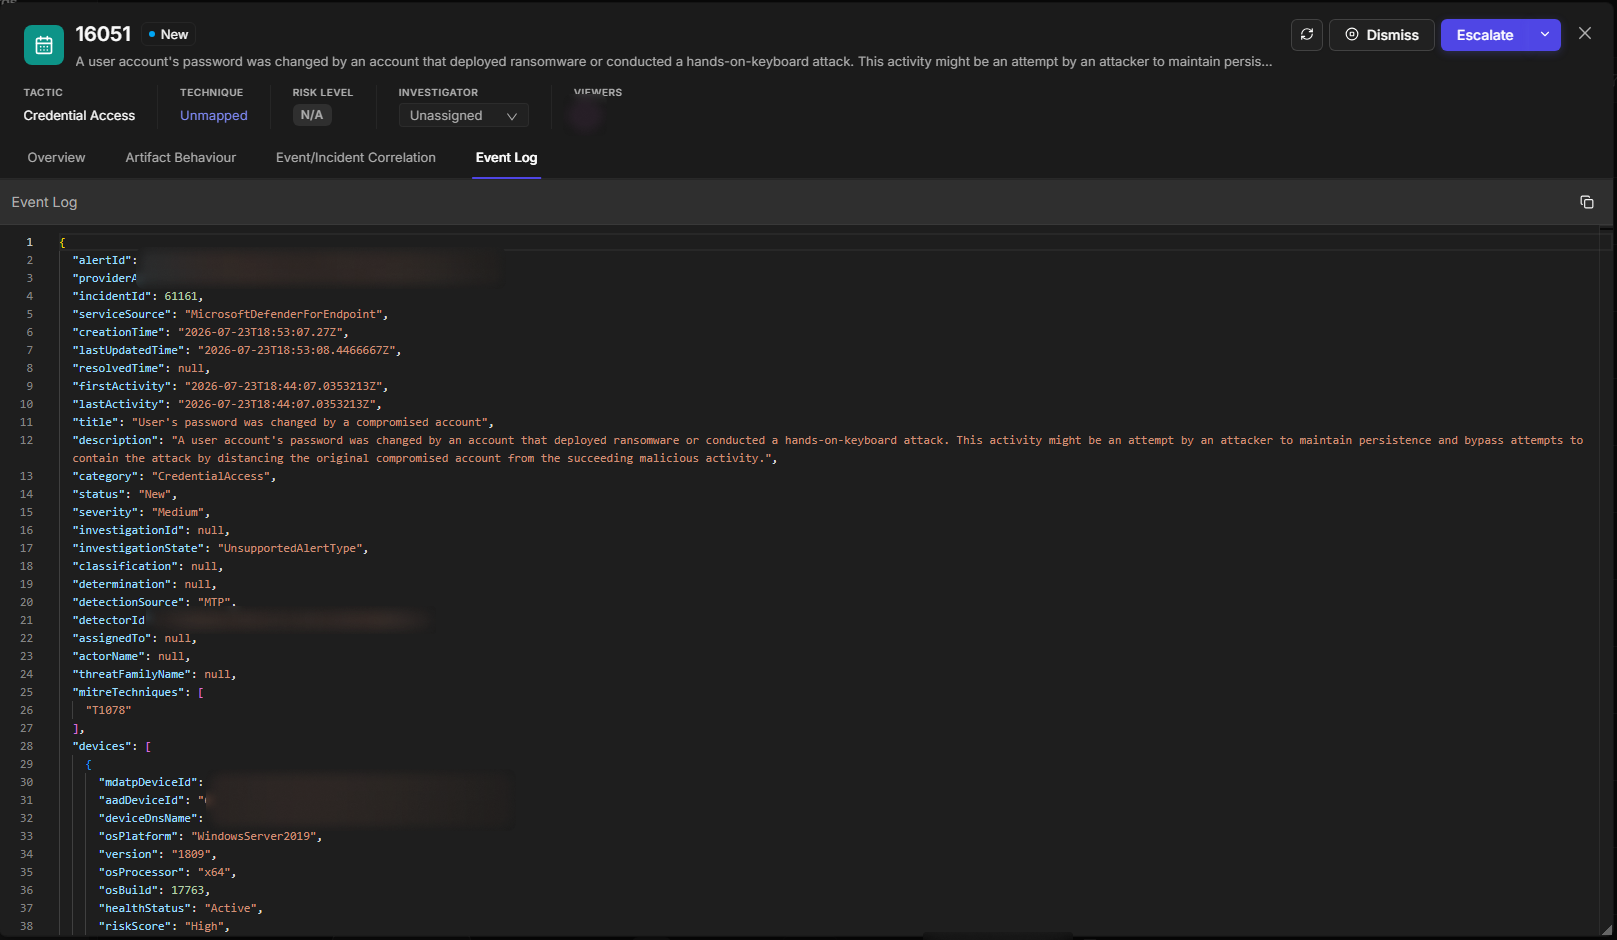
An event's details show its tactic, technique, risk level, investigator and viewers at the top, with Dismiss and Escalate at the top right. Change the investigator from the list at the top. The details have four tabs:
|
Tab |
What it shows |
|---|---|
|
Overview |
Event Summary and Event Details, with an Activity panel on the right for notes and assigning work to colleagues. |
|
Artifact Behaviour |
A graph of the event's artifacts. Select an artifact to see its details. High-risk artifacts are red. |
|
Event/Incident Correlation |
Related events and incidents. See Event-Incident Correlation. |
|
Event Log |
The raw event as the integration sent it. The Overview shows the same data after field mapping, so some values appear in both. |
The Event Log tab
Escalating and Dismissing an Event
-
Escalate creates an incident from the event. It opens the Escalate Event(s) to Incident window, which asks for the Incident Type and Title (both required), Description, Escalation Reason, Severity, Playbook, Incident Owner, Timezone and Due Date. Show Additional Settings adds the Site and a File. Select Escalate to confirm.
-
Dismiss closes the event without an incident. It opens the Dismiss Event(s) window. Choose a Reason Code, such as False Positive, Testing or Duplicated, add a Reason for Dismissal if needed, and confirm with Dismiss. Dismissed events are in the All Dismissed view. A dismissed event shows Reopen instead of Dismiss and Escalate.
Related events selected on the Event/Incident Correlation tab are escalated with the event. The Escalate window counts them, for example 2 events will be escalated to a new incident.
Acting on Several Events
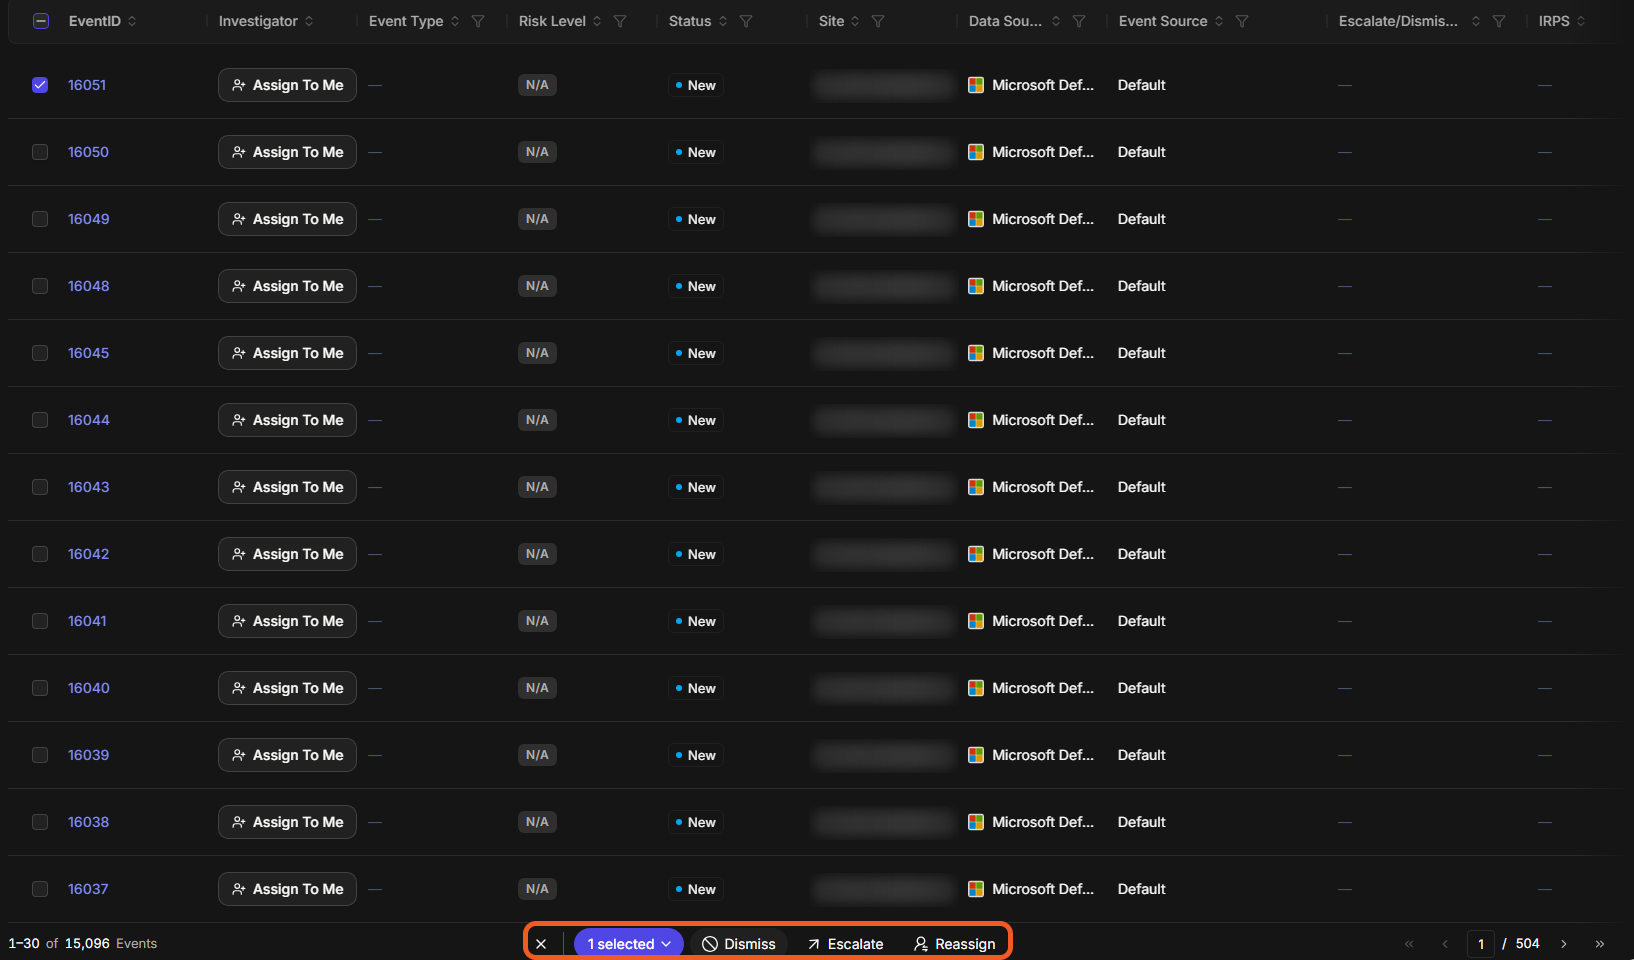
Tick the box beside each event. A bar appears at the bottom of the list with the number selected and Dismiss, Escalate and Reassign. Select × to clear the selection.
The bulk-action bar
Bulk actions apply only to open events. Events already escalated or dismissed are skipped.
Incidents
The Incidents list holds incidents created from events, ingested from integrations, or created with New Incident. Select an incident number to open it in the Incident Workspace.
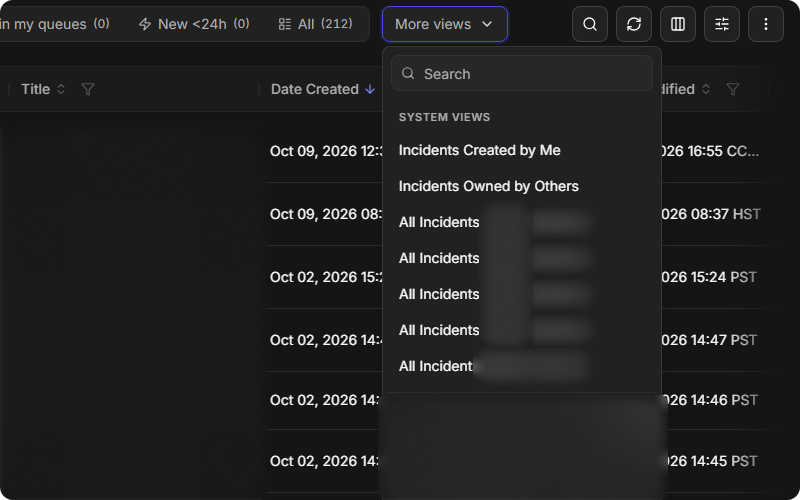
Views are buttons across the top, each with its count: Assigned to me, Unassigned, My Queue, Unclaimed in my queues, New <24h and All. More views lists the rest, such as Incidents Created by Me, Incidents Owned by Others, tenant views and your custom views.
The incident views

More views
Searching Incidents
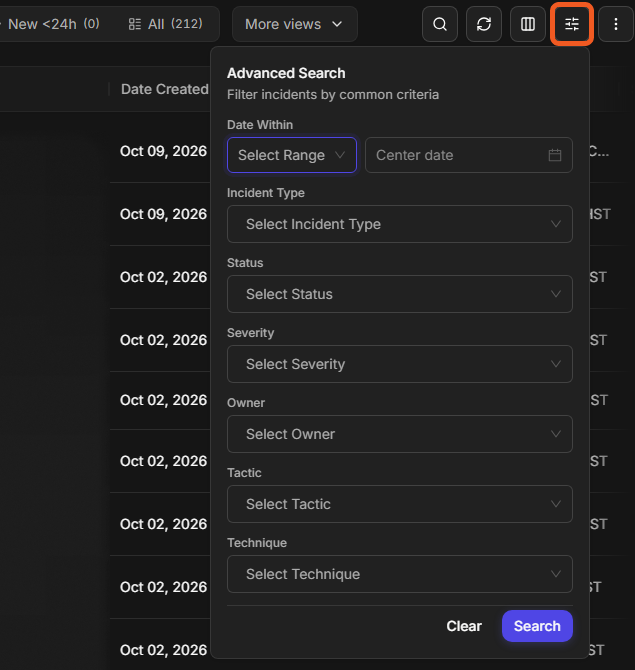
Select the search icon to search by title, ID or keyword. Select the filter icon beside it for Advanced Search: Date Within, Incident Type, Status, Severity, Owner, Tactic and Technique. Select Search to apply, or Clear to reset.
Advanced Search
Incidents can also be updated in bulk. Tick the box beside each incident. A bar appears at the bottom of the list with the number selected and Status, Owner, Severity, Disposition and Edit Fields. The first four each open a window to set one value — for example Change Status — then select Save. The number selected opens a menu with Select All, Deselect All, Copy Incident No. and Export Selected Incidents.
Changing Several Fields at Once
Edit Fields opens a window that sets many fields on every selected incident in one action. It names how many incidents it will change, and it has two tabs: Common fields, which applies to any incident, and Type-specific fields, which offers the fields defined for the selected incident type.
Fields shown at the top controls which fields the window displays. Remove one with its ×, or use the list to add more.
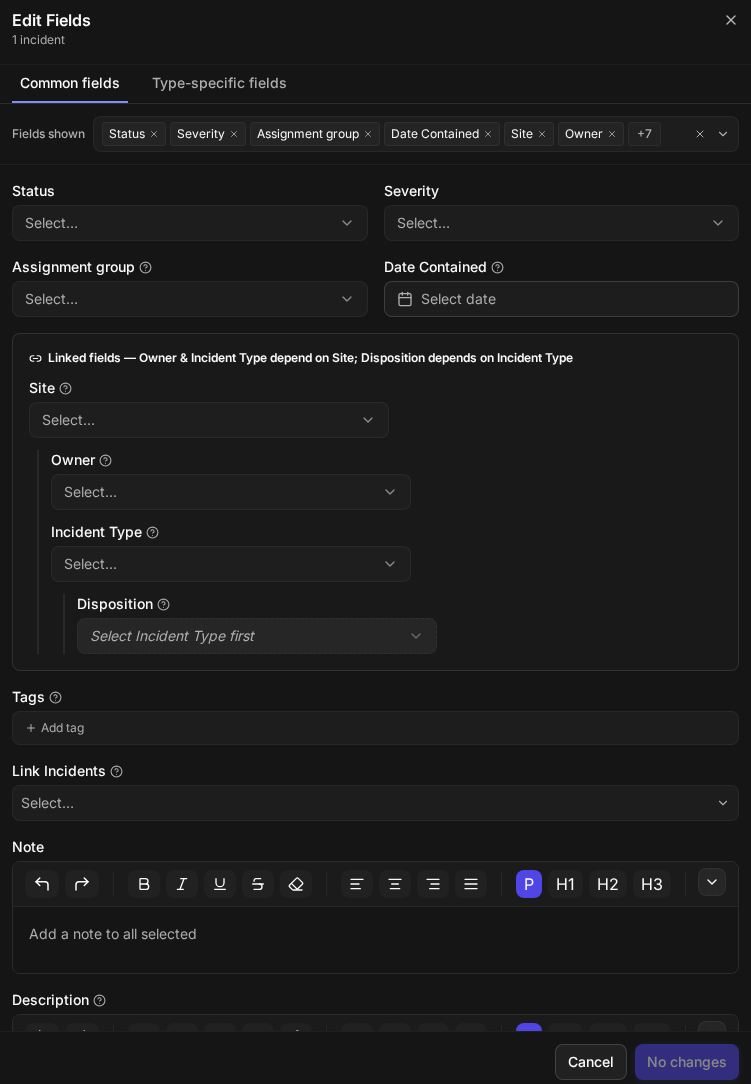
On Common fields you can set:
|
Field |
What it does |
|---|---|
|
Status |
The incident’s status. |
|
Severity |
The incident’s severity. |
|
Assignment group |
The group the incident is assigned to. |
|
Date Contained |
The date containment was achieved. |
|
Site |
The site the incident belongs to. |
|
Owner |
The incident’s owner. |
|
Incident Type |
The incident’s type. |
|
Disposition |
The incident’s disposition. |
|
Tags |
Tags to add. |
|
Link Incidents |
Links every selected incident to one master incident. |
|
Note |
A note added to all selected incidents. |
|
Description |
The incident description. |
|
Conclusion |
The incident conclusion. |
|
Add Playbook |
Adds one playbook to every selected incident and starts it running. |
Four of these depend on one another, and the window says so: Owner and Incident Type depend on Site, and Disposition depends on Incident Type. Set the field above before the one below it — until an incident type is chosen, Disposition reads Select Incident Type first.
Link Incidents is how several incidents are brought under one master incident: select the incidents, open Edit Fields, and choose the master in Link Incidents.
Note, Description and Conclusion are rich-text fields with their own formatting bar. A note is added to every selected incident; it does not replace notes already there.
The save button stays as No changes until you set a value, so it is clear nothing will be written by accident. Select Cancel to close without changing anything.
Adding a Playbook to Several Incidents
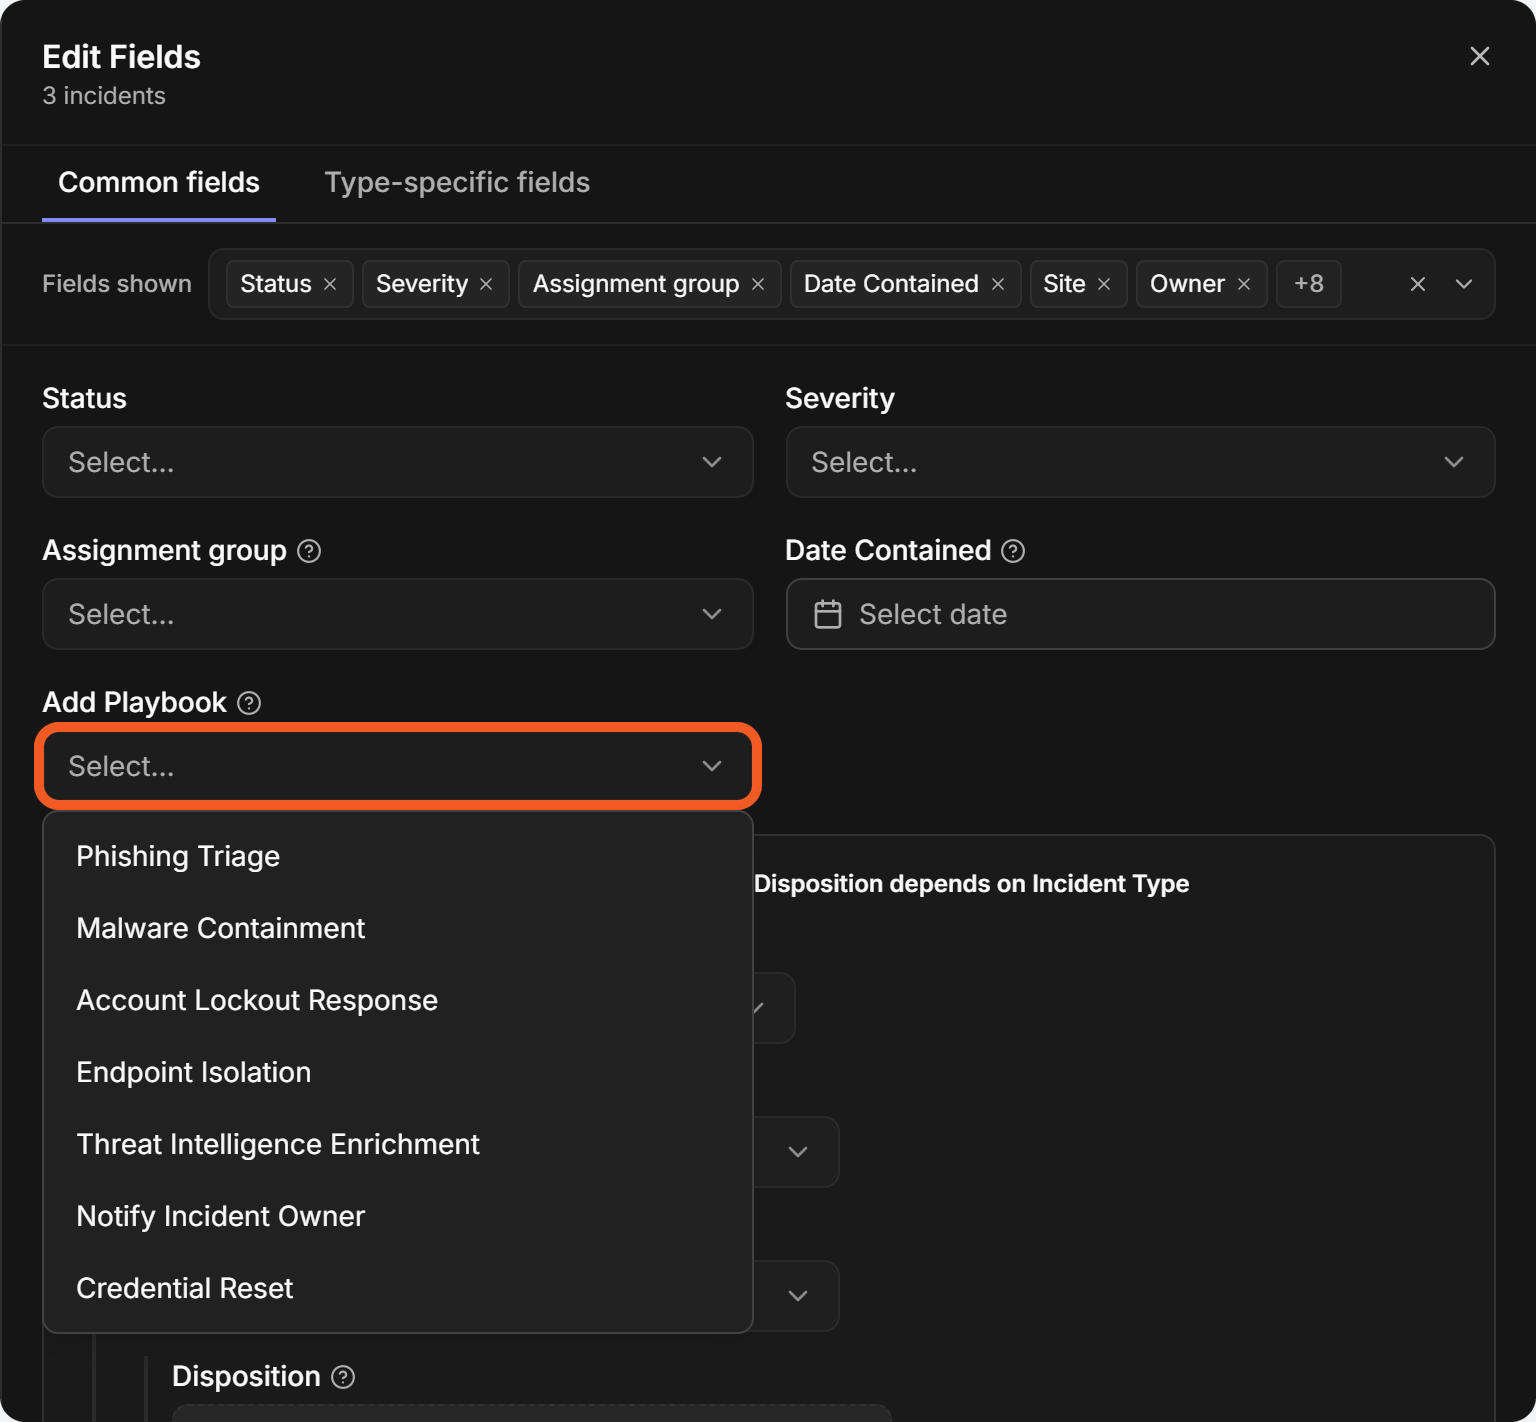
Add Playbook is a field in the Edit Fields window that adds one playbook to every selected incident and starts it running. Use it when a batch of incidents needs the same response, such as an enrichment or containment playbook, so you do not have to open each incident and add the playbook by hand.
The field is on the Common fields tab, in the top group of fields with Status and Severity. It is shown only to users whose role has the Incident and Access Playbook & Pending Task privileges, and not to Client Access users. Adding it to an incident also needs Edit Incident.
-
Tick the incidents, then select Edit Fields.
-
On Common fields, open Add Playbook and choose a playbook. If the field is not shown, add it from Fields shown.
-
Set any other fields you want to change, then select Review changes.
-
Check the review. It says how many incidents the playbook will run on, for example "The playbook will start running on each incident it's added to (up to 3 incidents)." Select Confirm · update 3.
The Add Playbook field
The review step
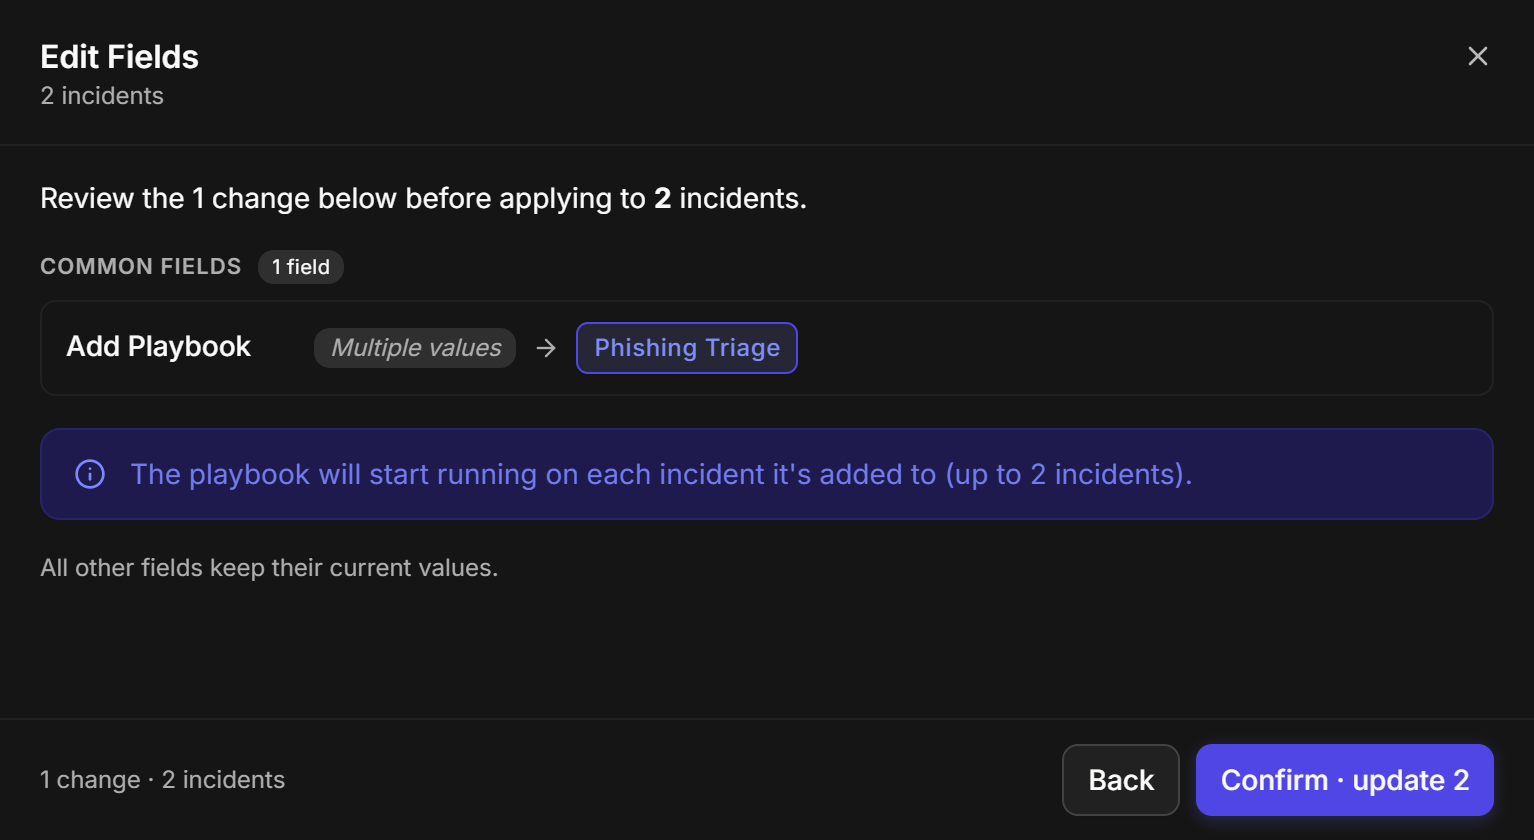
RESULT
When every incident is updated, the window closes and a message reads, for example, Updated 3 incidents · Add Playbook. The playbook appears on each incident and starts running.
Which playbooks are listed
A playbook belongs to a site, so the list holds every playbook that the sites of the selected incidents offer. A playbook that only some of the selected incidents can take names its site, for example "(Site A only)", and choosing it shows a warning such as "Only on Site A: 2 of 3 selected incidents will get it. The other 1 will be listed as failed after you apply." The review step lists the incidents that will not get it.
If you also change Site in the same edit, the list changes to that site's playbooks. The site change is applied first, so every incident can take the playbook.
READER NOTE
An incident whose site does not offer the playbook still gets your other changes. Only the playbook is left out. The window then opens as Edit Fields — partial result and lists the incident under Needs attention, with the reason "This playbook isn't available on this incident's site".
READER NOTE
Each apply starts a new run. An incident that already has the playbook gets a second run of it, so check the incident's playbooks first if a playbook should run only once. You can add one playbook per apply.
Previewing an Incident
Select anywhere on an incident's row except its number to open the quick view panel on the right, without leaving the list. The panel shows the incident's title and number, its AI Summary, its details (Created on, Last Modified, Severity, Status, Incident Type, Disposition, Site, Owner, Assignment group and Tags), and the Notes, Tasks, Linked Incidents and Linked Artifacts tabs.
The quick view panel
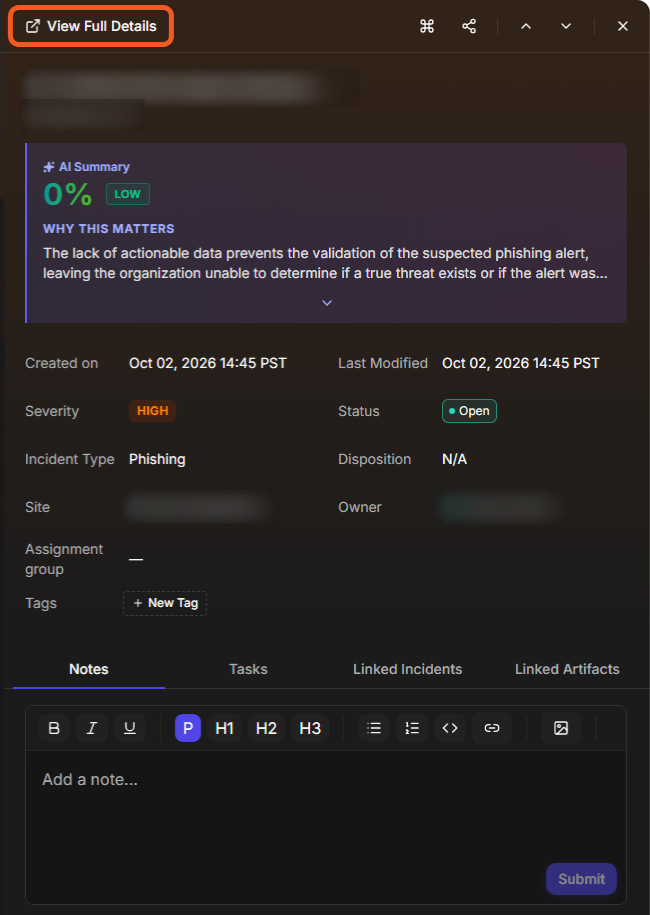
The icons at the top of the panel:
-
View Full Details opens the incident in the Incident Workspace. Ctrl+click opens it in a new tab.
-
Execute command (⌘) runs a command from the incident. See Running Commands from the Dashboard.
-
The share icon copies a link to the incident.
-
The up and down arrows move to the previous and the next incident in the list.
-
× closes the panel.
READER NOTE
Which sections, tabs and widgets the panel shows can differ by incident type, group and role. Administrators set this with quick view layouts. See Incident Quick View Layouts.
Running Commands
Execute Command (⌘), at the bottom right of the Incidents list, runs a utility or integration command on its own. Execute command in the quick view panel runs a command from the selected incident. See Running Commands from the Dashboard.
SLA Breached Count
The SLA Breached Count column shows how many SLA breaches each incident has. Scroll the list to the right to see it.
The SLA Breached Count column
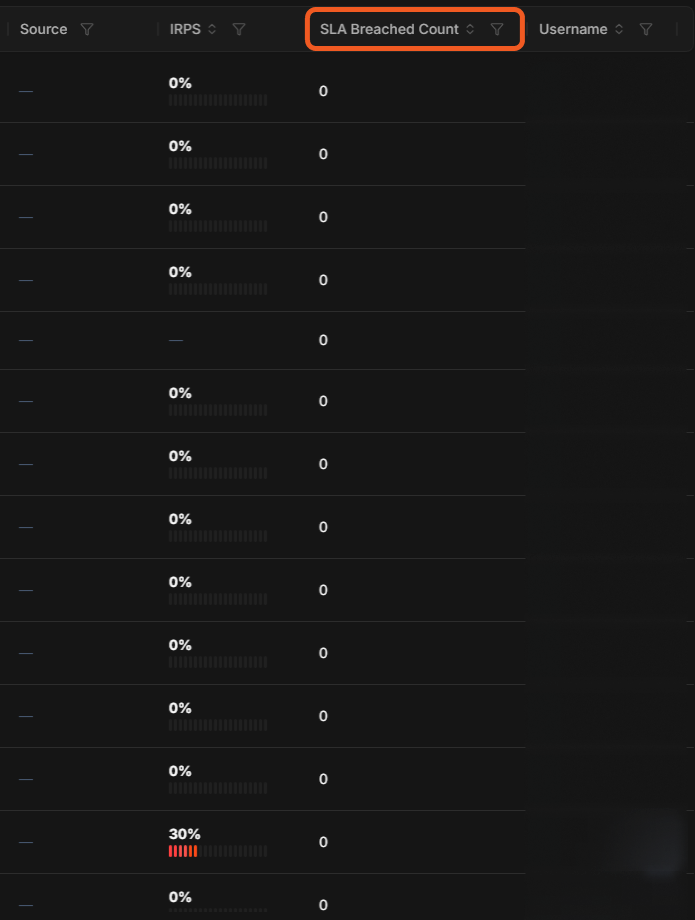
To show, hide or move a column, select the more icon (⋮) at the top right, then Columns. Tick or clear each column, then select Apply.
Adding the column
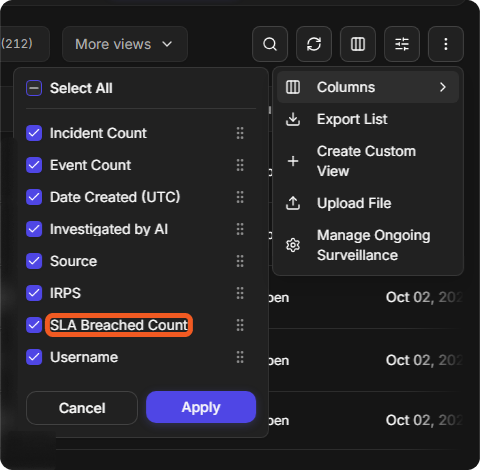
SLA rules are set up by an administrator under Configuration > AUTOMATION > SLA. See SLA Rules for setting up rules and their time goals, Office Hours for SLA for counting only working hours, SLA Rule Pause Conditions for pausing the clock, and SLA and ROI Widgets for SLA reporting.
Pending Tasks
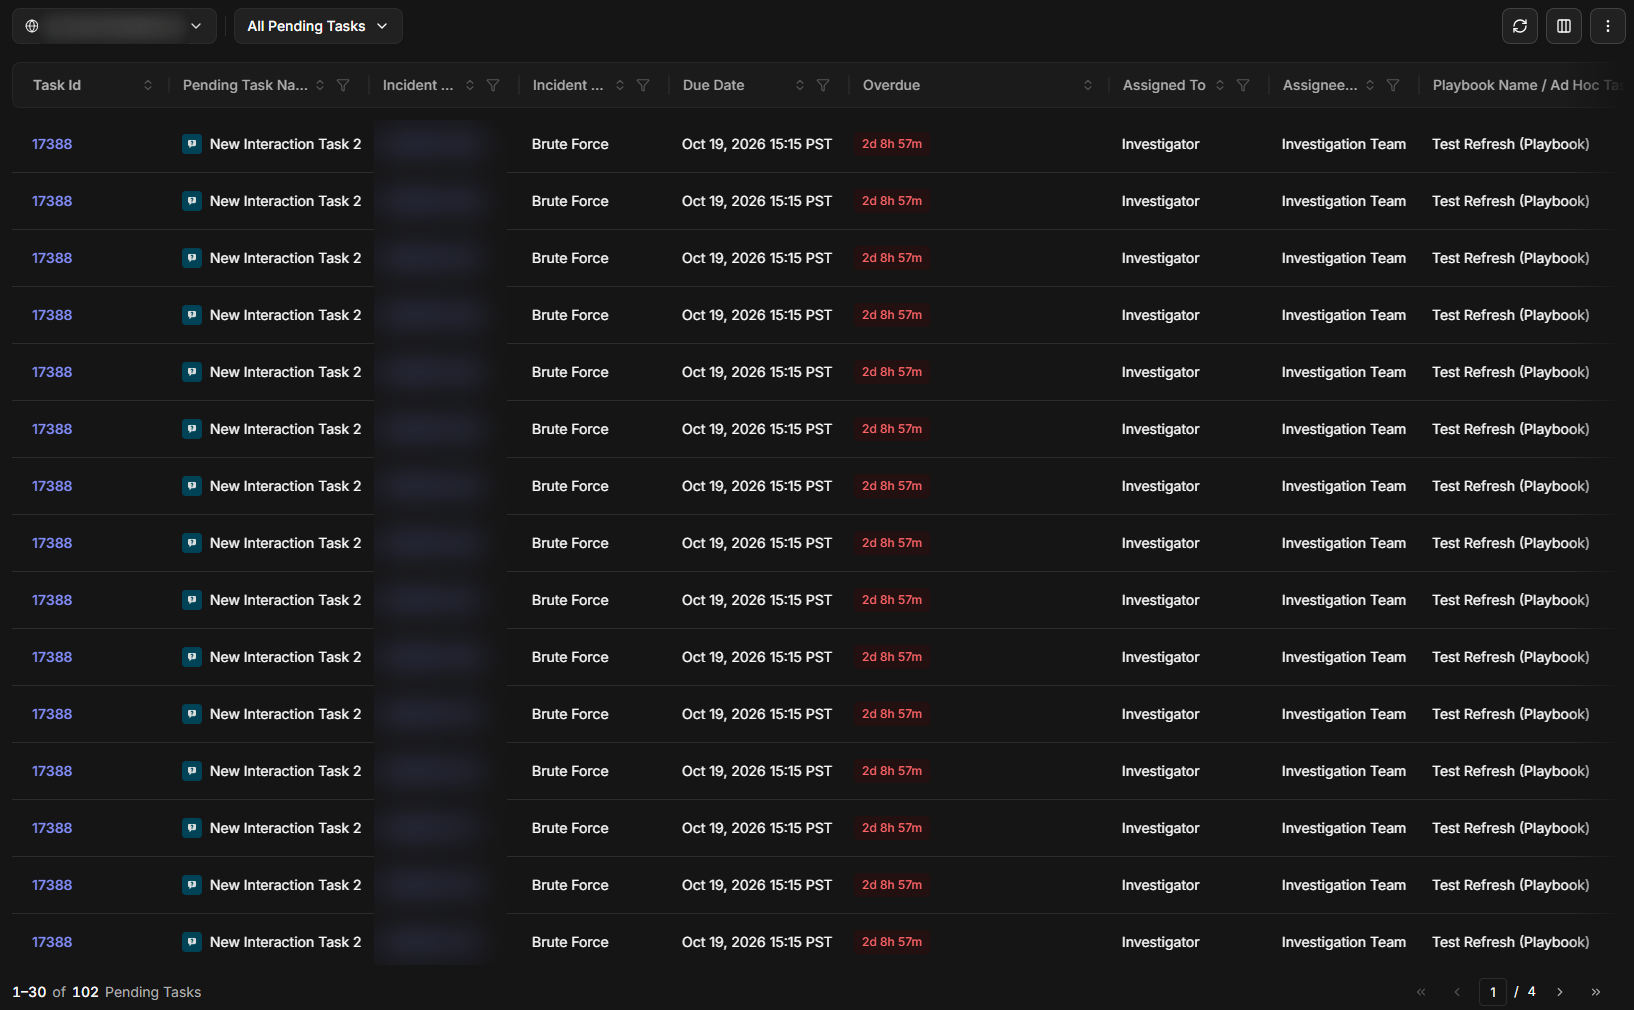
Pending Tasks lists playbook and ad hoc tasks waiting for input, across all incidents, with their Due Date, Overdue time in red, Assigned To, Assignee Type and the playbook or person that created them. Select a task to open it. See Incident Workspace for completing a task.
The Pending Tasks list
Artifacts
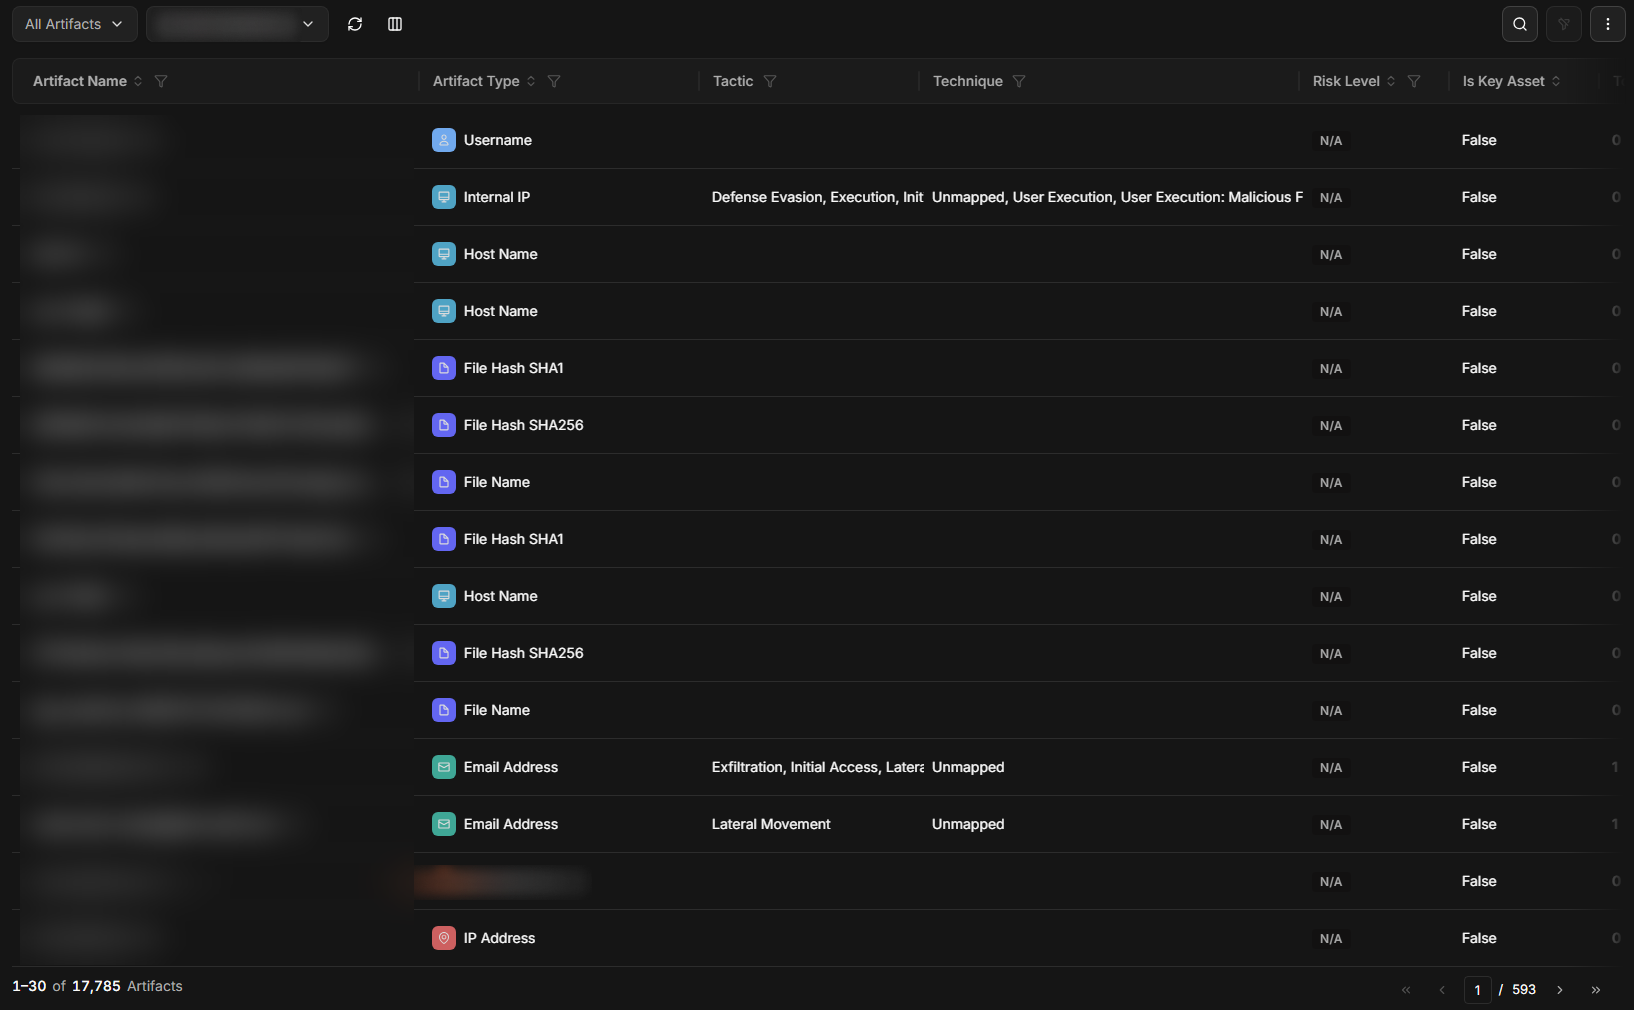
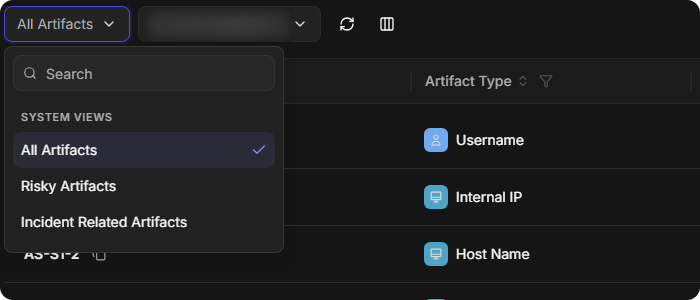
Artifacts lists every artifact from events and incidents, with its type, tactic, technique, risk level, whether it is a key asset, and how many events and incidents it appears in. Three views are built in: All Artifacts, Risky Artifacts (medium risk or higher) and Incident Related Artifacts.
Select an artifact to open Artifact Detail. It shows the artifact's First Seen and Last Seen dates, Risk Level, Site, Event Count, Incident Count, Tactic, Technique and Is Key Asset, with five tabs: Reputation, Events, Incidents, State and Notes. Two icons sit at the top right:
-
Export downloads the artifact as a STIX 2.1 JSON file.
-
Execute Command runs a command against the artifact.
The Artifacts list
The artifact views
Playbook Errors
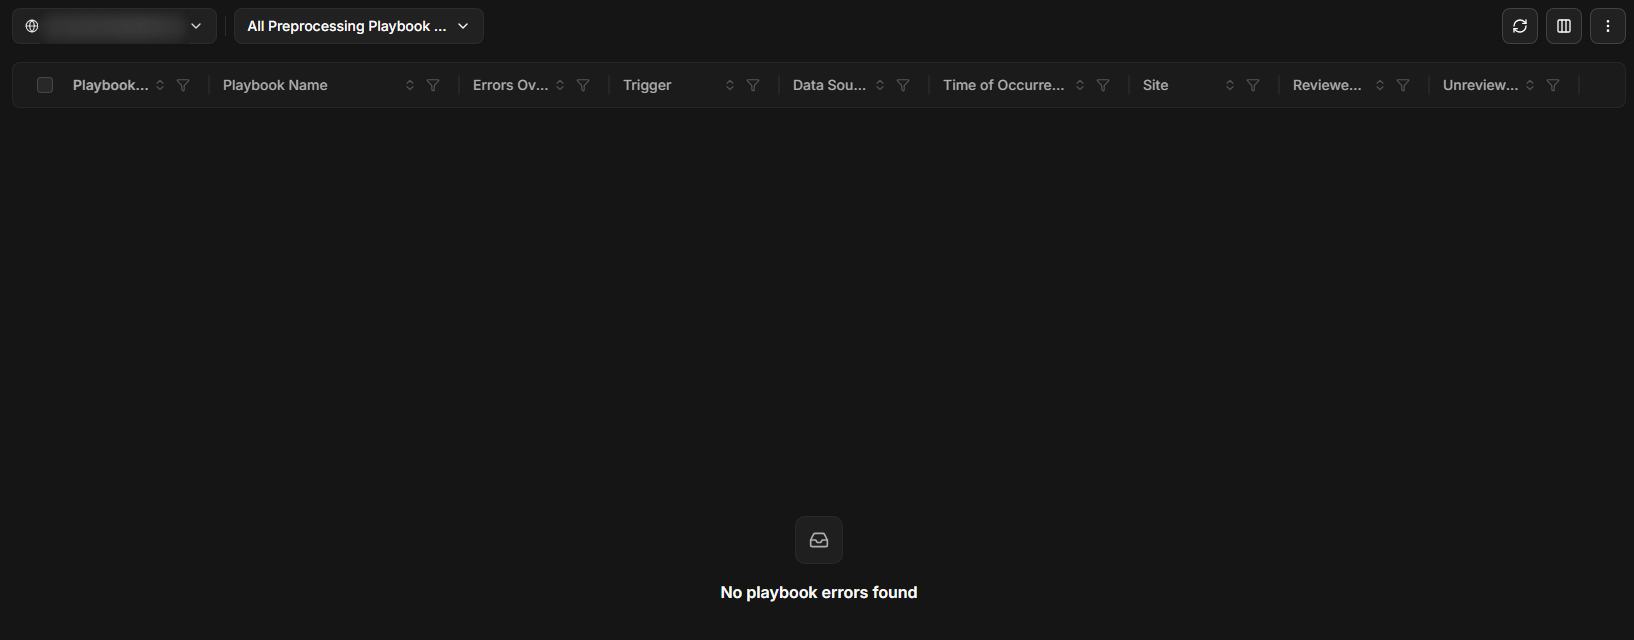
Playbook Errors > Standard lists errors from playbook runs, with the playbook, an errors overview, the trigger, data source, time and site, and how many errors have been reviewed. The view list has an all, a reviewed and an unreviewed view for each kind of playbook: preprocessing, investigation and command schedule. For example, All Preprocessing Playbook Errors, Reviewed Investigation Playbook Errors and Unreviewed Command Schedule Playbook Errors.
The Playbook Errors list
Notifications and Queue Alerts
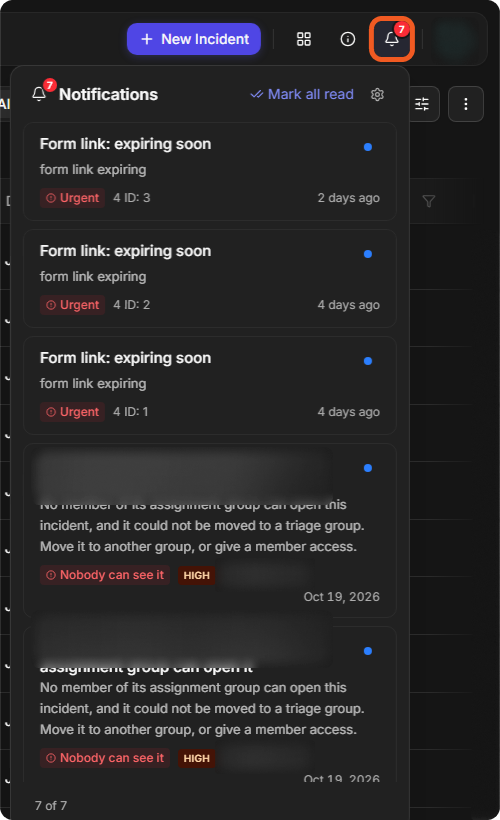
The bell at the top right of every page shows how many notifications you have not read. Select it to open Notifications, newest first.
The notification bell
-
Each entry has a title and a line beneath it, a label for its kind, such as Urgent or Nobody can see it, and, for an incident, the incident's severity and number. A blue dot marks an unread entry.
-
Mark all read marks every entry read.
-
The count at the bottom, such as 7 of 7, shows how many entries are listed.
Queue alerts about incidents in your assignment groups arrive in the bell too, for example Incident <number>: Nobody in its assignment group can open it, labelled Nobody can see it. See Queue Alerts for what raises a queue alert and how to claim one, and Notifications for pop-up cards and their settings.
Customizing the Incident Workspace
What the quick view panel and the incident workspace show is set for each incident type in Configuration > MANAGEMENT > Incident Type Manager. Select an incident type to open its General, Quick View, Incident Workspace and Incident Form Builder tabs. See Incident Type Manager, Incident Quick View Layouts and Configuring an Incident Type: Incident Workspace.