
Last Updated: November 17, 2026
Overview
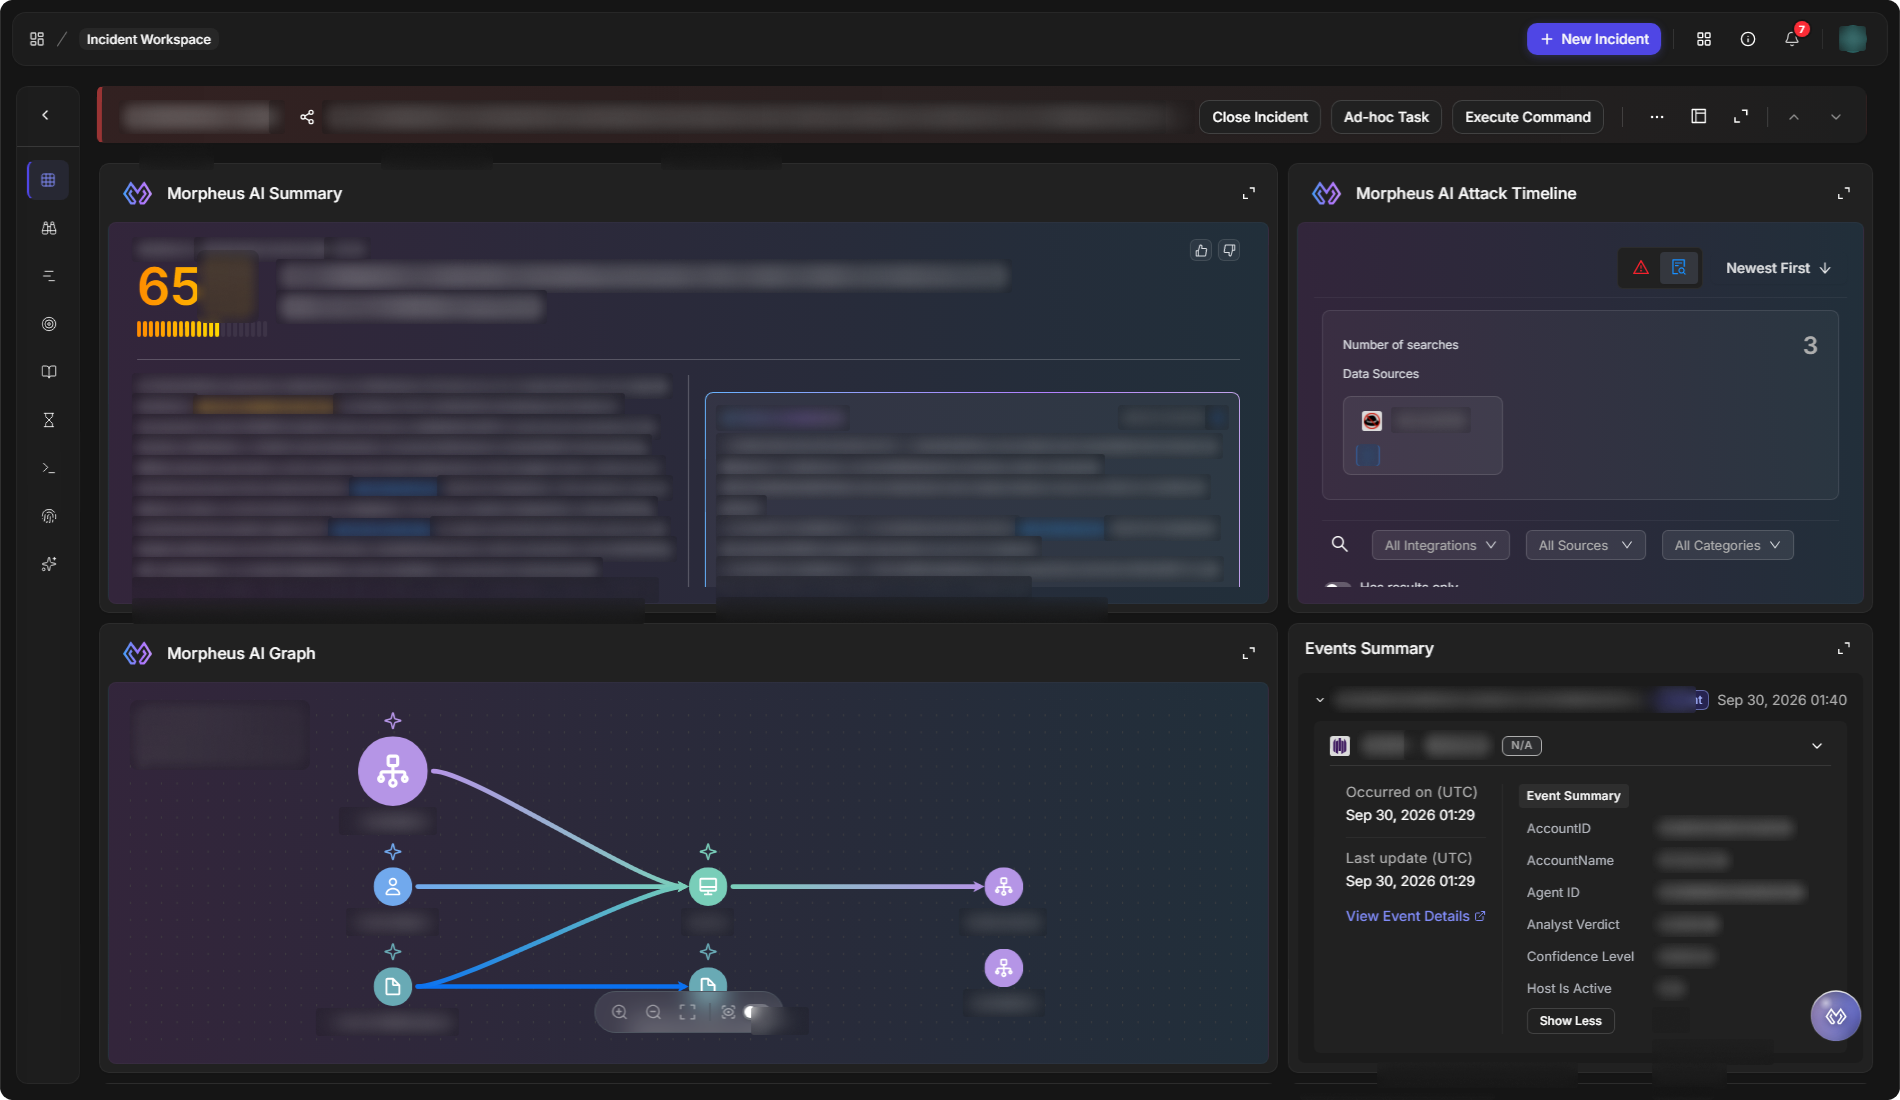
The Incident Workspace is where one incident is worked from start to finish: its key details, the events behind it, the investigation's findings, the artifacts involved, the playbooks and tasks running on it, and the record of everything done. Most of these parts can be added to the Overview as widgets, so an analyst can keep everything on one screen without leaving the incident.
Open an incident from Incidents to reach its workspace. It opens in a new browser tab, so the incident list stays where you left it. To work an incident by hand from start to finish, follow Documenting an Incident below.
The Incident Workspace
In short
|
To |
Go to |
|---|---|
|
See the incident's key details and summary panels |
Overview |
|
Read the findings and recommendations |
Investigation |
|
Log what happened, in order, by hand |
Timeline |
|
Review the source events |
Events |
|
Run or follow the incident's playbooks |
Playbooks |
|
Work the tasks waiting on you |
Pending Tasks |
|
See every action, result and message |
Command Centre |
|
Review the artifacts involved |
Artifacts |
|
See what matters most at a glance |
Key Findings |
Most of the views on the left side are now also available as widgets that can be added to the Overview: Investigation, Events, Playbooks, Pending Tasks and Artifacts. This is the direction the workspace is taking. Only Command Centre, Timeline and Key Findings stay as separate views. The Timeline view is a manually logged timeline; it is not the Morpheus AI Attack Timeline widget, which Morpheus fills. To add widgets to the Overview, see Customizing the Workspace below.
Documenting an Incident
An incident's workspace is also its record. When you work an incident by hand, document it as you go, in the order below, so that anyone who opens it later can see what happened, what was found and what was done. Each step names the widget that holds that part of the record. Which widgets an incident shows depends on its workspace layout (see Customizing the Workspace below); every widget is listed in Widget Reference.
Start with Morpheus. Select the Morpheus icon at the bottom right of the workspace to open Morpheus Adaptive Tasking on the incident. Ask it in plain words, or type / for quick actions. When a request would change the incident, such as adding a tag, Morpheus can ask you to Approve the command first, depending on the site's action-permission policy. Notes from Morpheus can be picked out with the Morpheus AI Note filter in the Notes widget, and the Morpheus widgets show what Morpheus AI found while investigating (see AI Summary and APD Widgets). Review what Morpheus did, then complete the record with the steps below.
Opening the Incident and Its Key Fields
Open the incident from Incidents. If the header is collapsed, select Expand/collapse in the header to show the key fields under the title: Site, Incident Type, Status, Severity, Disposition, Owner, Assignment group, Date Contained and Viewers. Created, Last Modified and Time Zone are above them, and the incident's tags are below them.
The key fields

Triaging the Incident
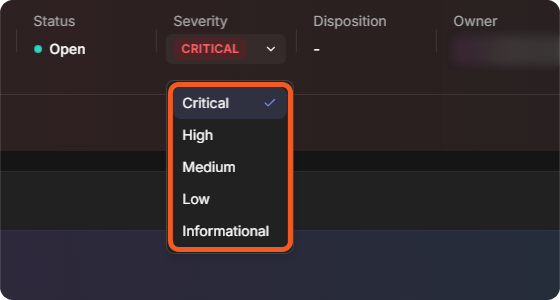
Set the key fields as soon as you have assessed the incident. Select a field to open its list, then choose the new value:
-
Status: where the incident stands, such as Open, In Progress, On Hold or Closed.
-
Severity: Critical, High, Medium, Low or Informational.
-
Disposition: your verdict, such as True Positive, False Positive, Duplicate, No Action, Resolved or N/A.
-
Owner: opens Change Site & Owner. Choose the site under Select Incident Site, then the owner under Select Incident Owner (the list of users is based on the site selected), and select Apply.
-
Assignment group: the group that should work the incident.
-
Date Contained: the date the incident was contained, from Select date.
-
Tags: select + New Tag to add a tag.
Setting the severity
Writing Notes
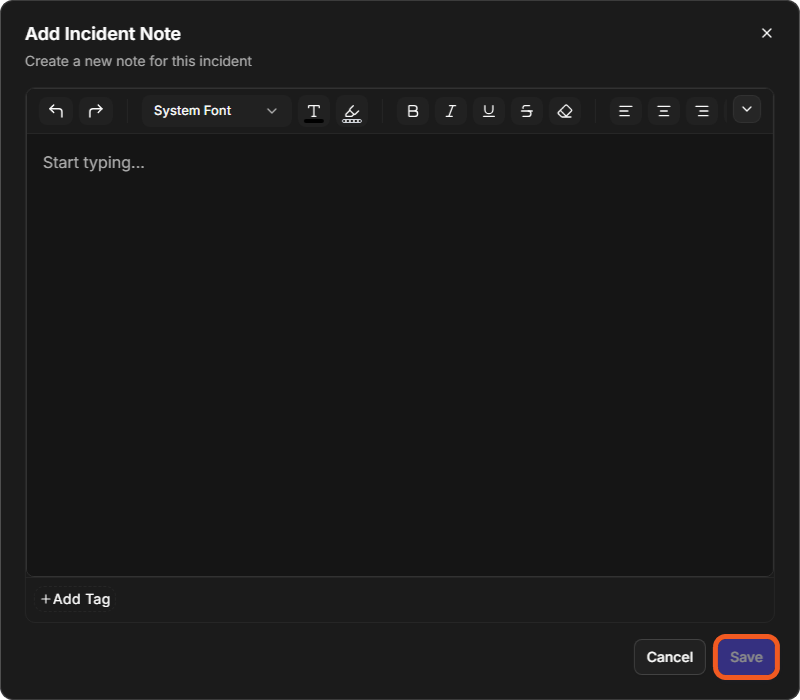
The Notes widget is the incident's running log: what you checked, what you saw and what you decided. Select + beside Notes (or Add Note when there are no notes yet) to open Add Incident Note. Write the note in the editor, select + Add Tag to tag it, then select Save.
Adding a note
-
Find a note with Search notes. Filter by type with All Notes (Incident Note, Task Note or Morpheus AI Note), by tag with All Tags, and change the order with Newest First.
-
Type @ in a note to mention a teammate. See Mentioning Teammates in Notes.
-
To record when something happened, open the Timeline view and select Add Note. Set the Time, write the Note, then select Add. Timeline entries are listed in time order.
Documenting the Incident Details
Document each kind of detail in the widget made for it:
-
Description: what the incident is about. Select the pencil icon in the widget to write it.
-
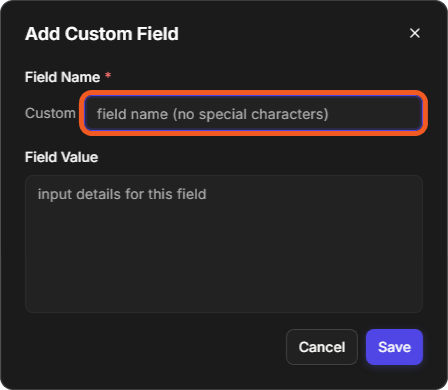
Custom Fields: facts that have no field of their own. Select + to open Add Custom Field, enter a Field Name (no special characters; it is shown with the prefix Custom) and a Field Value, then select Save.
Adding a custom field
-
Incident Fields: the incident type's own form, which an administrator sets up for each incident type. The widget lists the form's sections by name. Select the pencil icon beside a section name to open that section, fill in its fields, then select Save.
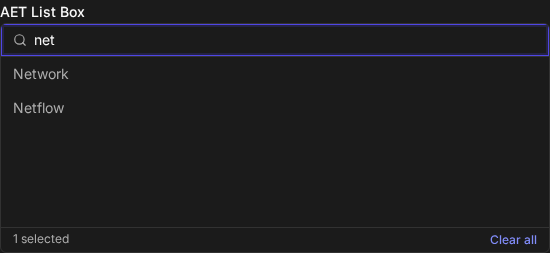
A list field that takes several values has a Search options box above its options. Type in the box and the list narrows to the options that match. Case does not matter: net, Net and NET all find Network and Netflow. If nothing matches, the list shows No matching options. Select × in the box to clear the search.
Select an option to add it, and select it again to remove it; there is no need to hold Ctrl. Searching only changes which options are shown: options you have already selected stay selected even when the search hides them, and the line under the list keeps count, for example 2 selected. If you close the window without selecting Save, you are asked whether to discard your changes.
Searching a list field
-
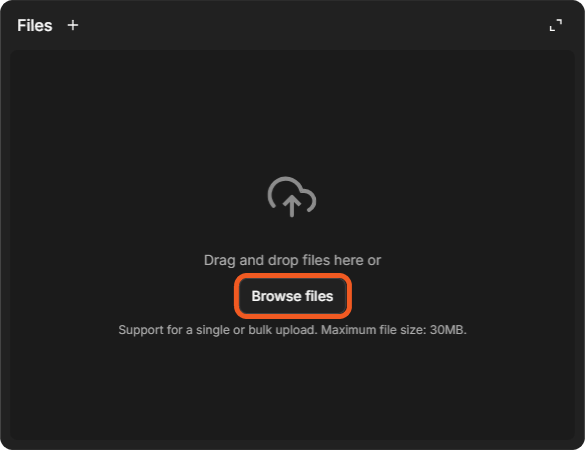
Files: logs, screenshots, exported emails and other documents. Drag files onto the widget, or select Browse files. One file or several can be uploaded at once; the maximum file size is 30MB.
The Files widget
-
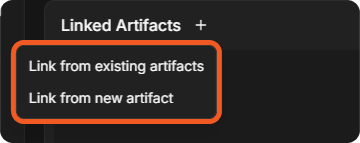
Linked Artifacts: the IP addresses, hosts, accounts, hashes and other artifacts involved. Select +, then Link from existing artifacts or Link from new artifact. See Linked Artifacts. The Artifacts view also has Add New.
Linking an artifact
-
Adversary Lifecycle: the MITRE ATT&CK tactics and techniques seen. Select + to open Add Tactics & Techniques, search for a tactic by name or ID, select its techniques, then select OK.
-
Linked Incidents: other incidents that are part of the same story. Select + to open Add Linked Incidents, search by incident number or keyword or filter by Severity, Status, Type, Owner, Tags, Tactic, Technique or Created, select the incidents, then select Link Selected Incidents. The Suggested Matches tab lists incidents that may be similar.
-
Findings: what the investigation found. Select +, then Data Table or HTML Rich Text. Switch between Grouped View and Timeline View to read them.
-
Events Summary: the events behind the incident, grouped by how they were escalated. Nothing to enter; select View Event Details to open an event.
Tracking the Work with Tasks
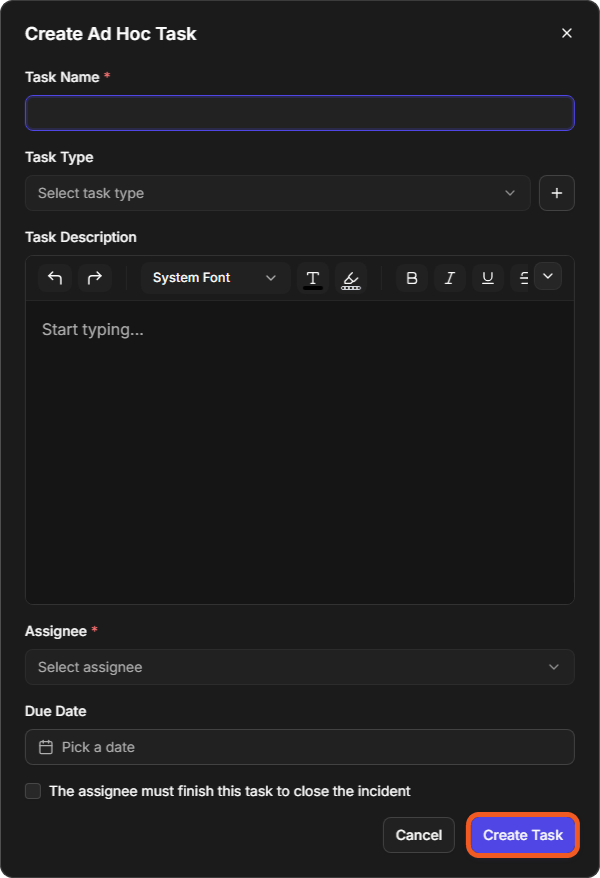
Record work that someone still has to do as a task. Select + in the Tasks widget, or Ad-hoc Task in the header, to open Create Ad Hoc Task. Task Name and Assignee are required; Task Type, Task Description and Due Date are optional. Tick The assignee must finish this task to close the incident for work that must be done before the incident is closed, then select Create Task.
Creating an ad hoc task
-
Tasks splits the incident's tasks into Assigned to Me and Assigned to Others, and shows how many are pending or completed. The Pending Tasks view lists the tasks still waiting.
-
Playbook Automation lists the playbooks on the incident, with their tasks and status. Select + to open Add Playbooks. See Playbooks below.
Writing Up and Closing
Before closing the incident, write up the outcome:
-
Investigation Summary: an overview of the incident and the investigation. A new incident starts with a standard paragraph. Hover over it and select the pencil icon to rewrite it, then ✓ to keep the change or × to discard it.
-
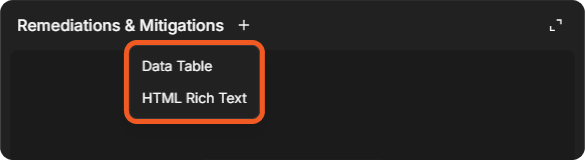
Remediations & Mitigations: what was done, or should be done, to contain and fix the issue. Select +, then Data Table or HTML Rich Text.
Adding a remediation
-
Recommendations: what to do to prevent a similar incident. Select +, then Data Table or HTML Rich Text.
-
Conclusion: the final word on the incident. Select the pencil icon in the widget to write it.
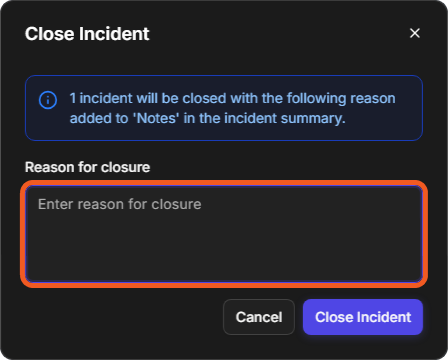
Then select Close Incident in the header. The Close Incident window explains that the incident will be closed with the reason added to Notes. Enter the Reason for closure, then select Close Incident.
Closing the incident
Open Playbook Tasks When You Close
If your administrator has turned on Cancel Open Playbook Tasks When an Incident Is Closed, closing an incident also cancels its playbook tasks that are still waiting for someone: manual tasks, pending tasks and tasks waiting for a reply, including required tasks and tasks in child playbooks. Tasks that are already running are not affected, and a playbook that closes the incident itself is left to finish. The incident’s notes record what was cancelled, for example Closing the incident cancelled 3 open playbook tasks.
This happens when the incident is closed from the incident page, from the Incidents list, or by a playbook. Auto-close rules and the legacy Incident Update API leave tasks open.
When you close several incidents at once from the Incidents list, the Cancel open playbook tasks? window first lists each incident with its open tasks, how many of them are required, and how many are done. Select Cancel tasks and close to close them, or Back to leave them open.
The setting is off by default. While it is off, closing an incident leaves its playbook tasks as they are.
Turning it on
READER NOTE
You need access to Application Settings to change this setting.
-
Go to Global Settings > Application Settings.
-
Under Feature Settings, select Web Config.
-
For Cancel Open Playbook Tasks When an Incident Is Closed, select True, then save.
To share the finished record as a PDF, see Exporting Incidents.
Widget Reference
These are the widgets the workspace builder offers in 18.6, in the builder's order. Where the title in the workspace differs from the builder's name, it is shown in brackets. For how each widget works in detail, see Incident Workspace Widgets.
Type shows how each widget is filled: Manual input widgets are where you document the incident yourself, Data output widgets only display what D3 Morpheus, playbooks or integrations produce, and Both widgets take your input and also show automated results. The table lists the manual input widgets first.
|
Widget |
Type |
Use it to record |
What to enter |
|---|---|---|---|
|
Adversary Cycle (Adversary Lifecycle) |
The MITRE ATT&CK tactics and techniques seen. |
+: Add Tactics & Techniques. |
|
|
Conclusion |
Manual input |
The conclusion of the incident. |
The pencil icon: free text. |
|
Custom Fields |
Manual input |
Facts that have no field of their own. |
+: Add Custom Field. |
|
Description |
Manual input |
What the incident is about. |
The pencil icon: free text. |
|
Files |
Manual input |
Documents and other evidence files. |
Drag and drop, or Browse files (up to 30MB). |
|
Findings |
Manual input |
What the investigation found: initial analysis, data enrichment, correlations, IOAs and IOCs. |
+: Data Table or HTML Rich Text. |
|
Incident Ad Hoc Form |
Manual input |
Answers to a custom form made for this incident, to give playbooks more details. |
The form's answers. |
|
Incident Form (Incident Fields) |
Manual input |
Answers to the predefined form of the incident type, to give playbooks more details. |
The form's answers. |
|
Investigation Team |
Manual input |
Who is working the incident. |
+: the investigators, where the widget offers it. |
|
JSON Table |
Manual input |
A custom JSON table for the incident. |
JSON data. |
|
Linked Artifacts |
Manual input |
The artifacts involved, such as IP addresses, hosts, accounts and hashes. |
+: Link from existing artifacts or Link from new artifact. |
|
Linked Incidents |
Manual input |
Related incidents. |
+: Add Linked Incidents. |
|
Notes |
Manual input |
The running log of the investigation. |
+: Add Incident Note. |
|
Recommendations |
Manual input |
How to prevent a similar incident. |
+: Data Table or HTML Rich Text. |
|
Remediations & Mitigations |
Manual input |
What was done, or should be done, to contain and fix the issue. |
+: Data Table or HTML Rich Text. |
|
Summary (Investigation Summary) |
An overview of the incident and the investigation. |
The pencil icon: free text. |
|
|
Playbook Automation |
Both |
The playbooks on the incident and their progress. |
+: Add Playbooks. |
|
Tasks |
Both |
Playbook and ad hoc tasks, and how far along they are. |
+: Create Ad Hoc Task. |
|
Markdown Widget |
Both |
Markdown content that your playbooks write, or that you write yourself. |
The pencil icon: Markdown, with a Preview tab. A later write by a playbook, an integration or APD replaces your edit. See Customizing the Incident Workspace. |
|
Morpheus Adaptive Playbook Runs |
Data output |
The Adaptive Playbook runs launched for the incident. |
Nothing. Filled by Morpheus. |
|
Morpheus AI Attack Timeline |
Data output |
Each step of the attack, from the initial breach to the final compromise, in time order. |
Nothing. Filled by Morpheus. See AI Summary and APD Widgets. |
|
Morpheus AI Graph |
Data output |
The attack as a graph of the IOCs and artifacts involved. |
Nothing. See Morpheus AI Graph. |
|
Morpheus AI Summary |
Data output |
Morpheus AI's summary of the incident. |
Nothing. See AI Summary and APD Widgets. |
|
Morpheus APD Narrative |
Data output |
The narrative of Morpheus AI's investigation. |
Nothing. See AI Summary and APD Widgets. |
|
Morpheus Form Submission |
Data output |
The form submission behind the incident: who submitted it, the answers as given, and what the incident field mapping did with them. |
Nothing. An incident not created from a form says so. |
|
Emails |
Data output |
The incident's emails. |
Search with Search through emails. See Email and SLA Widgets. |
|
Events Summary |
Data output |
The incident's source events. |
Nothing. View Event Details opens an event. |
|
HTML Widget |
Data output |
HTML content that your playbooks write. |
Nothing by hand. See Customizing the Incident Workspace. |
|
SLA |
Data output |
How the incident stands against its SLAs. |
Nothing. Refresh reloads it. See Email and SLA Widgets. |
The Incident Header
The bar across the top identifies the incident and holds the actions that apply to it as a whole:
-
The incident number and title.
-
Close Incident closes the incident when the investigation is done.
-
Ad-hoc Task adds a one-off task to the incident, outside any playbook.
-
Execute Command runs a command for this incident.
-
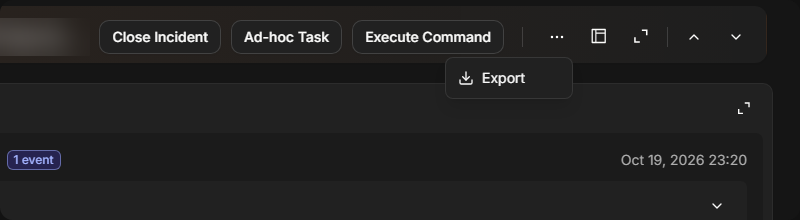
More options (⋯) holds Export. It opens Export Incident Report: tick the sections to include, such as Morpheus AI Investigation Summary, Attack Timeline, Artifacts, Event Summary, Notes & Files and Conclusion, or Select All. Turn on Only export non-empty sections to leave out empty ones, then select Export. See Exporting Incidents.
-
Workspace layout switcher lists the layouts available for the incident, such as System Default, and marks the one in use as Active. Select Select beside a layout to use it.
-
Expand/collapse opens the header to show the incident's key fields and tags. Select it again to fold them away. The header opens collapsed unless an administrator has set it to open expanded, and your own choice is remembered in this browser. See Setting How the Header Opens below.
-
New Tag adds a tag to the incident. It opens a search box listing the tags already suggested in this site; select one to apply it, or type a new name to create one. To remove a name from that suggested list for everyone, hover over it and select the bin beside it. Deleting a suggested tag needs the Delete Tag permission; creating one needs Create New Tag. Both are set per role under Operational Modules > Incident (see Roles).
-
Page Up and Page Down open the previous and next incident in the list the workspace was opened from. Page Up is unavailable on the first incident.
The More menu
Setting How the Header Opens
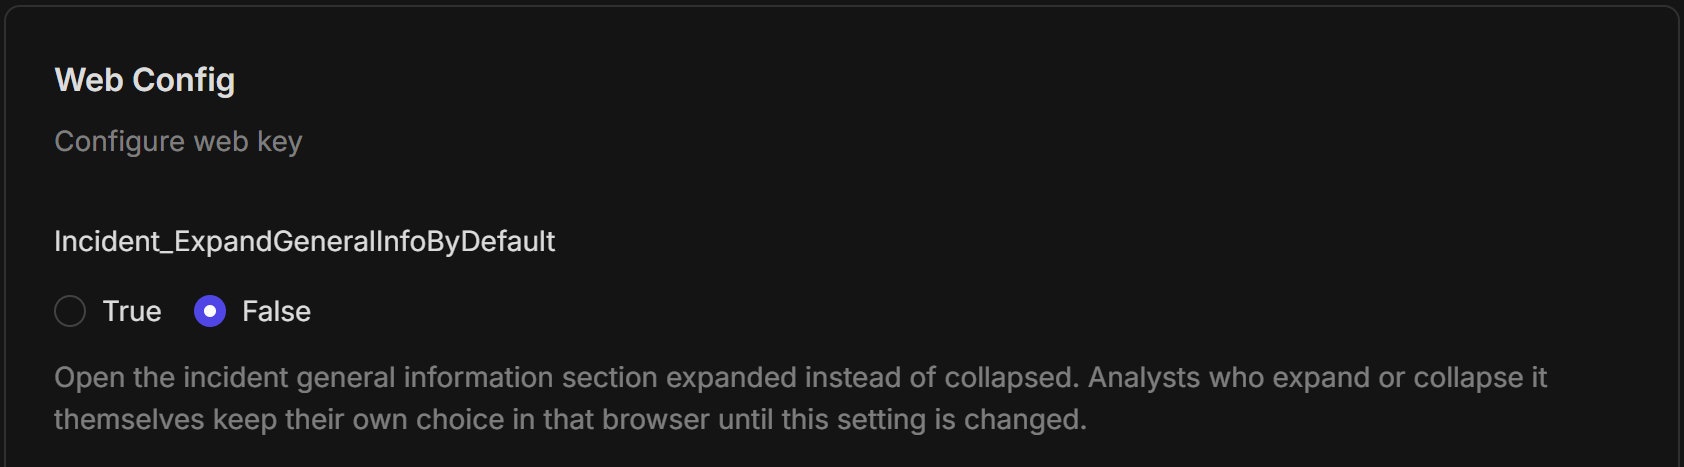
Incident_ExpandGeneralInfoByDefault is the site setting that decides how the incident header opens: expanded, showing the incident's key fields and tags, or collapsed. A site whose analysts always want the key fields in view can open the header expanded, so nobody has to expand it on every incident. The setting is False by default, which keeps the header collapsed. It applies to the new UI only; the classic view is unchanged.
The setting is in Application Settings, which needs a role with the Administrator switch on. See Roles.
-
Go to Global Settings > Application Settings.
-
Under Feature Settings, select Web Config.
-
Scroll the right panel to Incident_ExpandGeneralInfoByDefault (the keys are in alphabetical order). Select True to open the header expanded, or False to open it collapsed.
The header setting in Web Config
-
Select Save.
The message "Web Config saved!" appears. The header opens the new way the next time an incident is opened; nobody needs to sign out.
How each analyst's own choice works
-
When an analyst selects Expand/collapse, that choice is remembered in their browser, across incidents and sessions, and it wins over the setting.
-
When an administrator changes the setting, every analyst's remembered choice is dropped the next time they open an incident. They follow the new setting until they select Expand/collapse again.
-
The choice is kept per browser. In a new browser, or after the browser's site data is cleared, the header follows the setting again.
-
Expanding a widget on the Overview to full size still folds the header away, and closing the widget brings it back. That does not count as a choice and is not remembered.
Moving Between Views
The rail down the left side switches between the workspace's views. Hover over it to see each view's name, and select one to open it.
The view rail
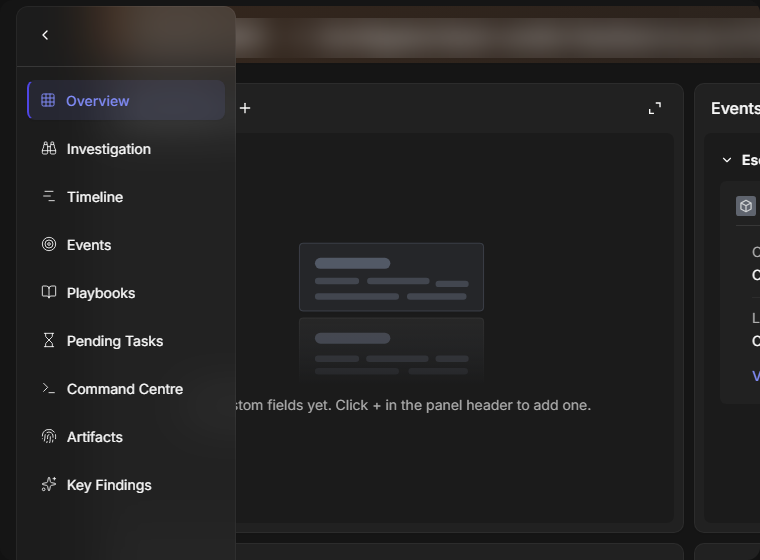
Overview
Overview is the incident at a glance: the key fields, shown with Expand/collapse in the header (Site, Incident Type, Status, Severity, Disposition, Owner, Assignment group and others) and a set of panels. The panels include Events Summary, Description, Tasks, Custom Fields, Conclusion, Adversary Lifecycle, Notes and Playbook Automation. Some incidents also show Morpheus AI Summary and Linked Artifacts.
Each panel can be opened full size with its expand icon. A panel with a + beside its title takes new entries: a custom field, a task, a tactic or technique, a note, or a playbook. An empty panel says so, for example No custom fields yet. Click + in the panel header to add one.
Which panels appear, and in what order, depends on the workspace layout. Layouts are designed for each incident type at Configuration > Incident Type Manager > [incident type] > Incident Workspace, where each layout can be assigned to groups, roles or users. Switch between the layouts available to you with the Workspace layout switcher.
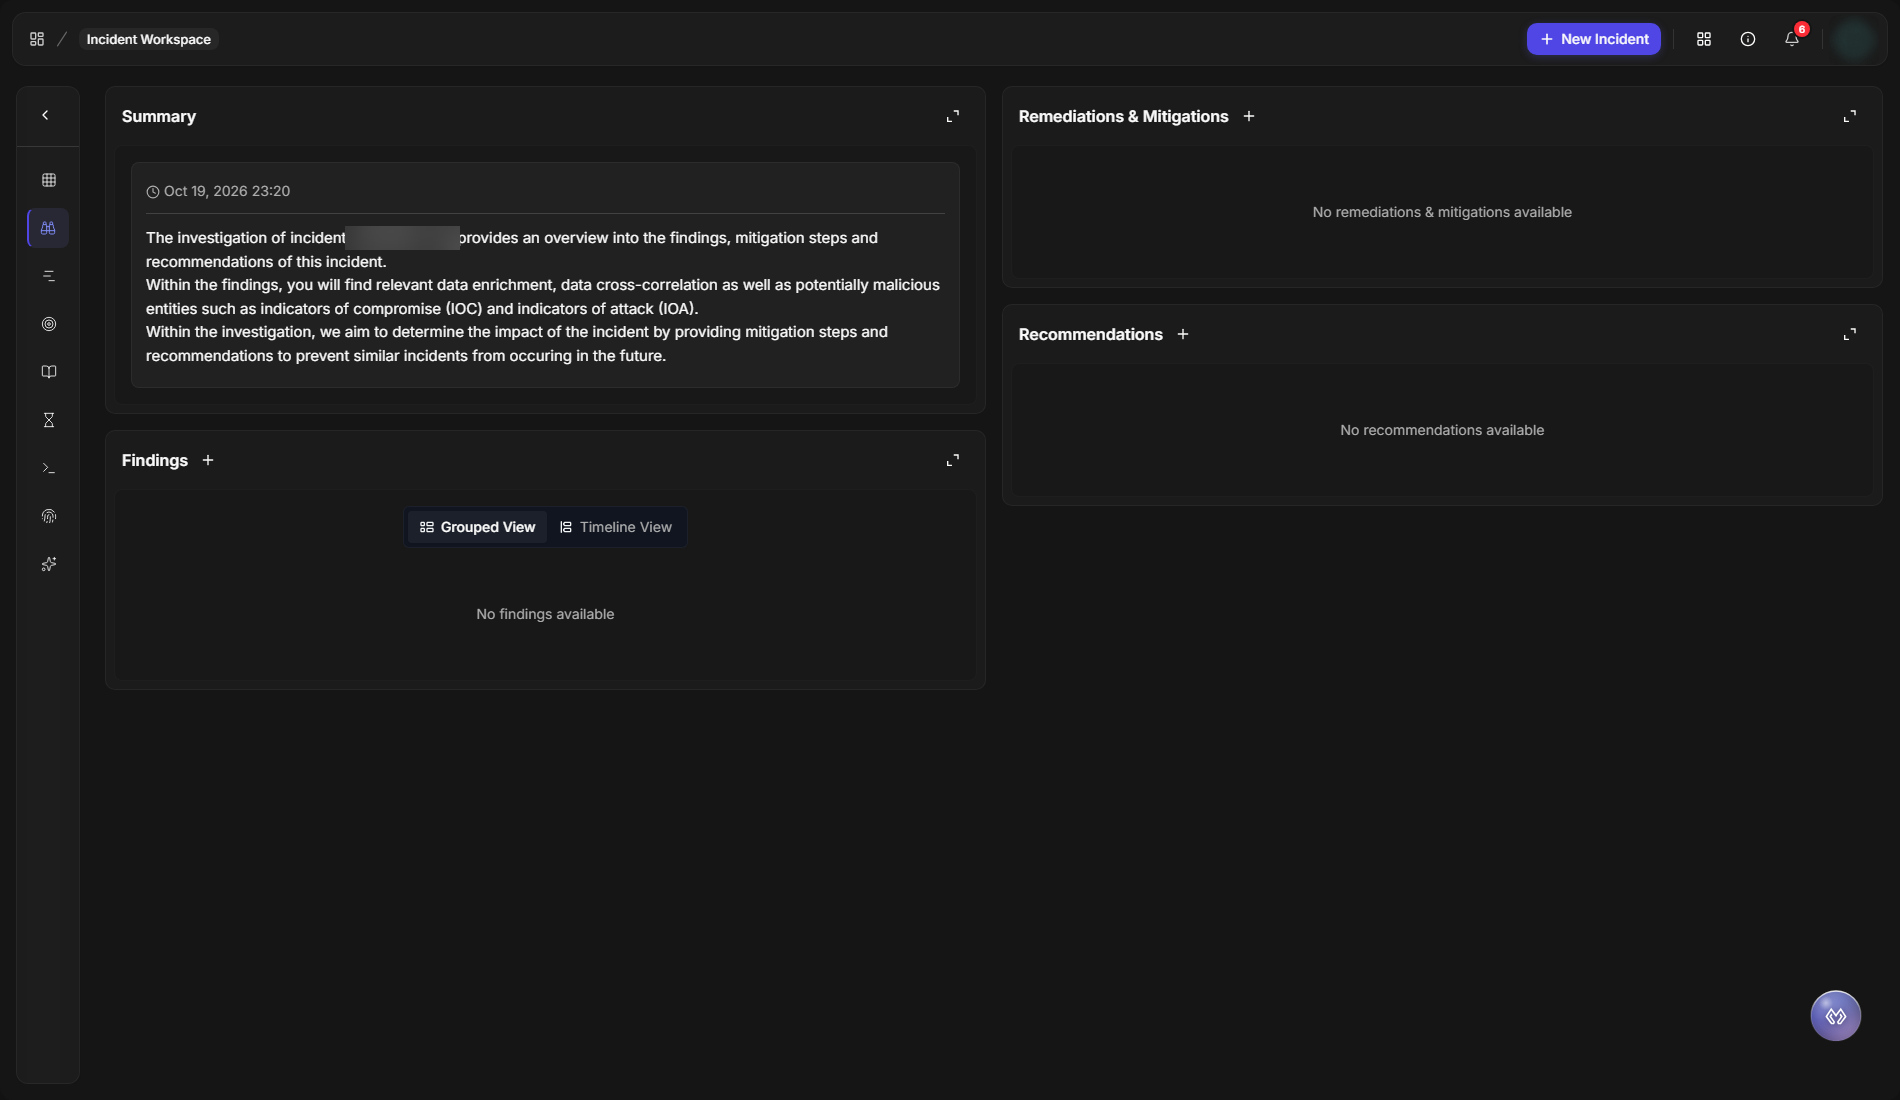
Investigation
Investigation holds the written outcome of the investigation, in four sections:
|
Section |
What it holds |
|---|---|
|
Summary |
An overview of the incident and the investigation. |
|
Findings |
What the investigation found. Switch between Grouped View and Timeline View. |
|
Remediations & Mitigations |
The steps taken or recommended to contain and fix the issue. |
|
Recommendations |
What to do to prevent a similar incident. |
The Investigation view
Timeline
Timeline lists the investigation's items in time order (in UTC), so the sequence of what happened is easy to follow. Search it by note, summary or author, and select + Add Note to add an entry by hand.
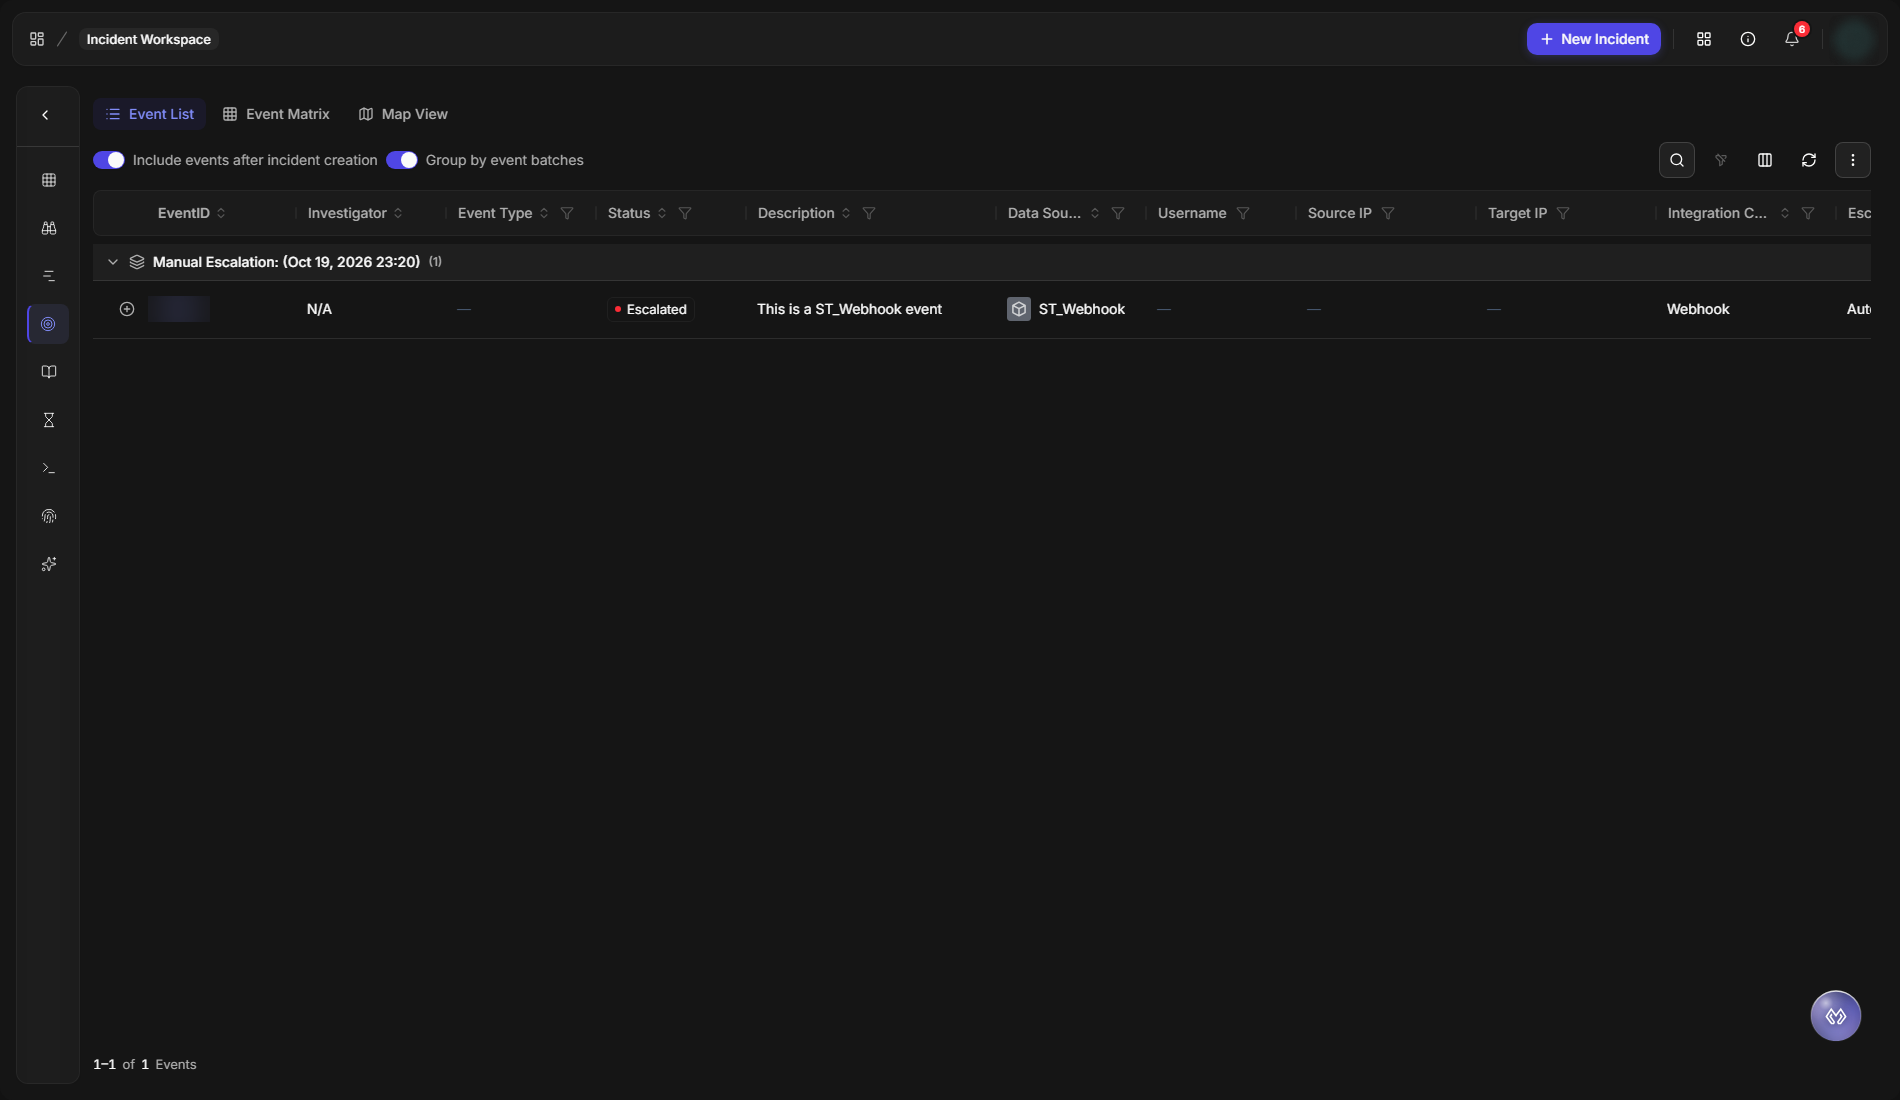
Events
Events lists the events behind the incident, grouped by how they were escalated. Switch between Event List, Event Matrix and Map View.
-
Include events after incident creation adds events that arrived after the incident was opened.
-
Group by event batches groups the events by the batch they arrived in.
The Events view
Playbooks
Playbooks shows the playbooks running on the incident under Playbook Automation, with their tasks and progress. Select + to add a playbook to the incident.
Pending Tasks
Pending Tasks lists the incident's tasks that still need someone, with tabs for Assigned to me and Assigned to others. Each task shows its playbook or ad hoc task creator, Task ID, Task Name, task type, Assignee, Assign Date and Due Date.
Command Centre
Command Centre is the incident's running record: the playbook tasks, ad hoc tasks, command results, field changes, messages and notes, in the order they happened. Use Filter and the search box to find an entry.
Command Centre opens on the Activity log view, a plain-language history of the incident that you can filter by category or by person. The entry-by-entry view is Raw log. See Command Centre Activity Log.
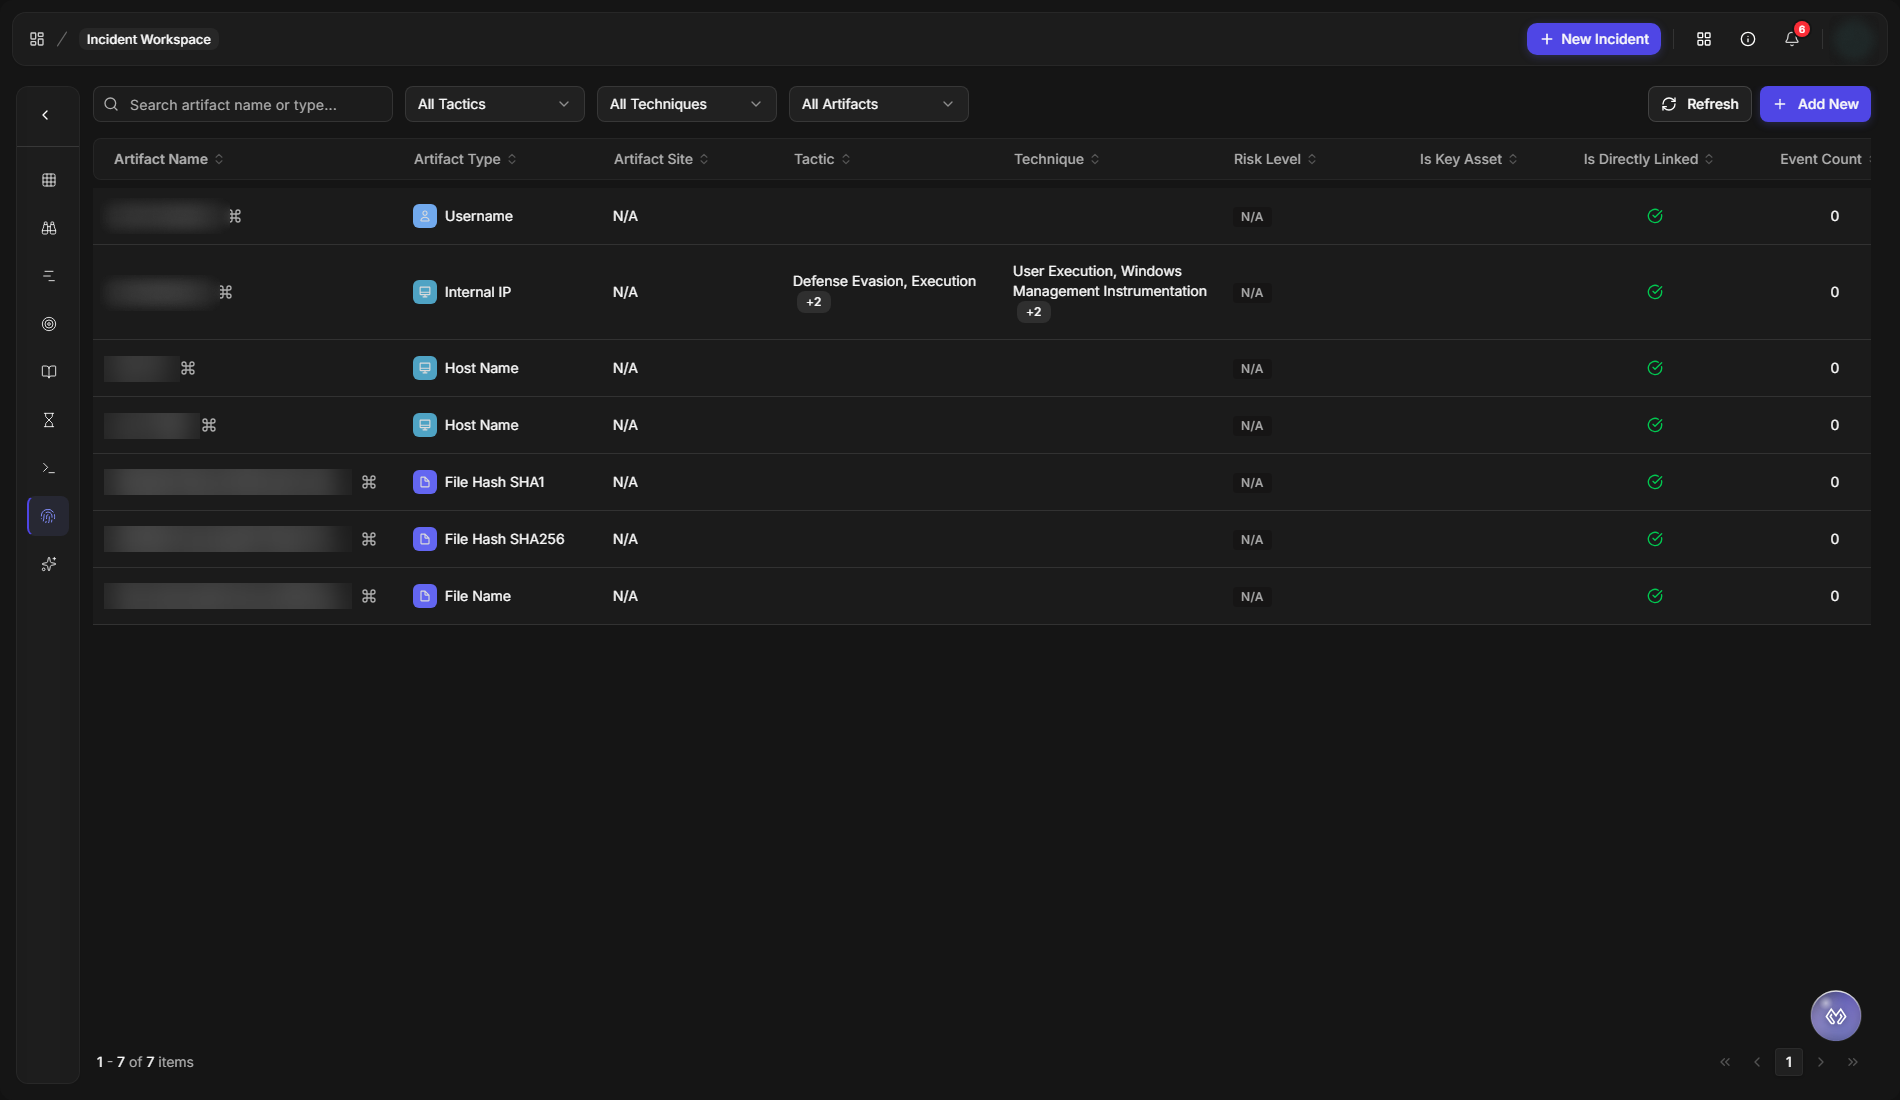
Artifacts
Artifacts lists every artifact involved in the incident: hosts, accounts, IP addresses, file hashes and more. Each row shows its Artifact Type, Artifact Site, Tactic, Technique, Risk Level, whether it is a key asset, whether it is directly linked to the incident, and its Event Count.
Filter by tactic, technique or artifact with the lists above the table, select Refresh to reload, and select + Add New to add an artifact. Refer to Linked Artifacts.
The Artifacts view
Key Findings
Key Findings pulls out what matters most, in four tabs: Artifacts with Bad Reputation, Technique Patterns, Tactics & Techniques and Key Playbook Tasks.
Customizing the Workspace
What a workspace shows is set for each incident type in its workspace layouts, so a team can put the widgets it needs in front of its analysts. See Configuring an Incident Type: Incident Workspace, and:
-
Customizing the Incident Workspace: Markdown and HTML widgets that your own playbooks fill.
-
Email and SLA Widgets: the incident's emails and its SLAs.
-
AI Summary and APD Widgets: what Morpheus AI found while investigating the incident.
-
Incident Workspace Widgets: every widget, one by one.
Working with Others and Other Tools
-
Mentioning Teammates in Notes: type @ in a note to mention a teammate.
-
Exporting Incidents: export the incident as a PDF report.
-
Syncing Incidents with External Tools: keep an incident in step with the tool it came from, such as Microsoft Sentinel or Jira.
Morpheus AI in the Workspace
Click the Morpheus icon at the bottom right of the workspace to work the incident with Morpheus Adaptive Tasking, and see what Morpheus found while investigating on the Morpheus AI Graph card.