
Last updated: November 10, 2026
Overview
The top panel is the header at the top of an incident in the incident workspace, and from 18.6 you decide what it shows, for each workspace. You choose which incident fields appear and in what order, show your own custom fields beside them, pin link buttons that open the matching record in another tool—the alert in Microsoft Sentinel, the ticket in your service desk—and add compact summaries of workspace widgets, such as tasks done or the latest note. Analysts get the facts they check on each incident in that workspace in the first place they look, without scrolling the page or copying an ID into another console.
A configured top panel
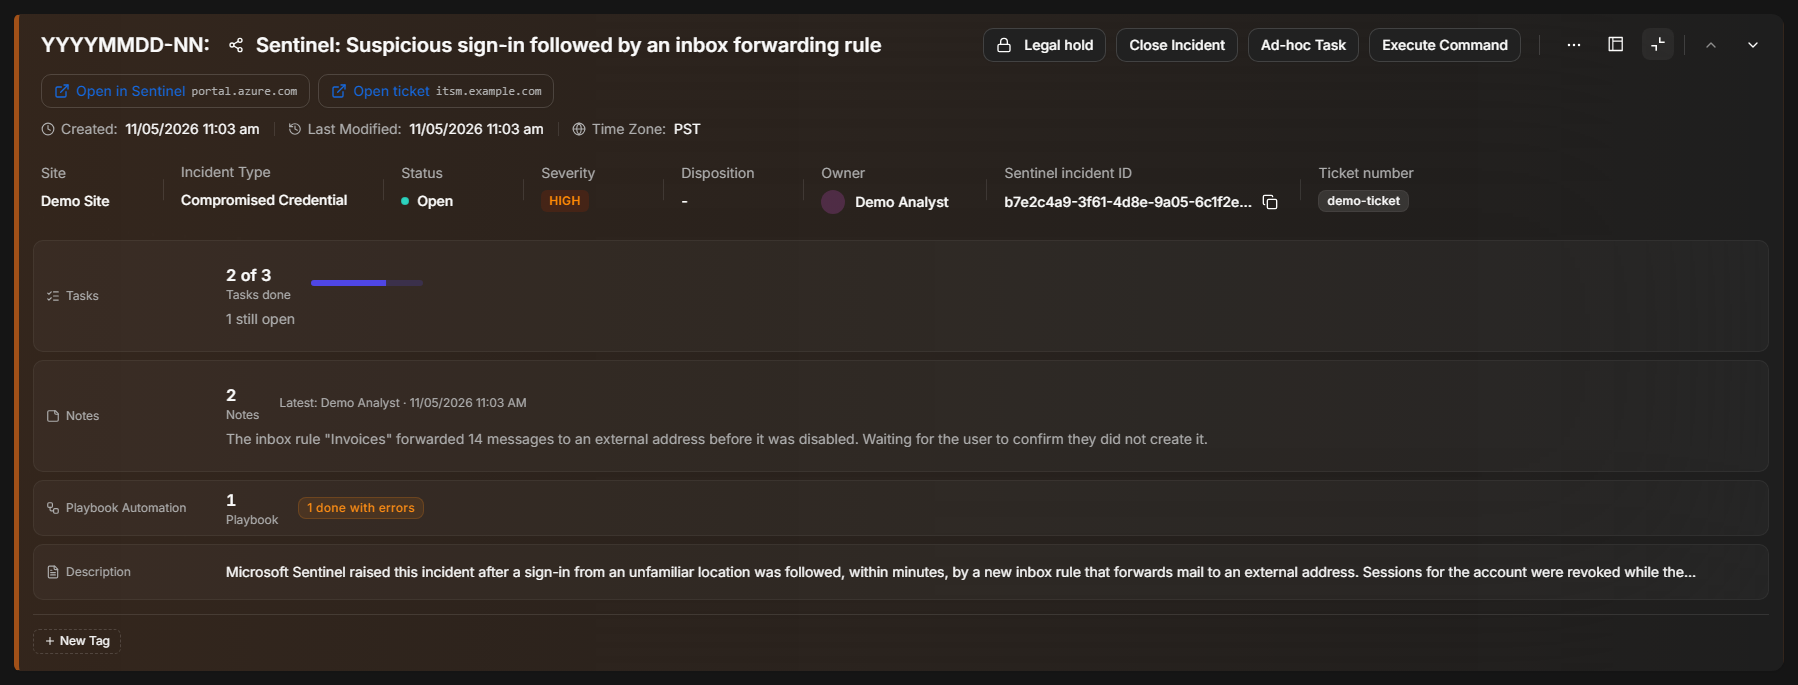
The top panel is set up per incident workspace, in the workspace builder under Configuration > Incident Type Manager. Its settings apply to every custom page of that workspace. A workspace whose top panel you never configure keeps the standard header, exactly as before.
In short
|
# |
Stage |
Where it happens |
|---|---|---|
|
1 |
Open the workspace you want to change |
Configuration > Incident Type Manager > the incident type > Incident Workspace |
|
2 |
Open the top panel settings |
Build tab > the gear on the Top panel tile |
|
3 |
Choose and order the fields; add custom fields |
Fields in the settings |
|
4 |
Pin link buttons |
Links in the settings |
|
5 |
Add up to five widget strips |
Widgets in the settings |
|
6 |
Save |
Save, top right of the builder |
|
7 |
Check the result |
The header of an incident that uses the workspace |
Roles and Access
Configuring the top panel is part of editing an incident workspace, so it is available to anyone whose role has the Incident Type Manager privilege.
Analysts need nothing extra to see it. The top panel follows the workspace: everyone who opens an incident with that workspace sees the same links, fields, and strips. What each strip shows follows that person's own permissions, the same as the widget it summarizes (see What Analysts See).
Opening the Top Panel Settings
The top panel settings live in the workspace builder, beside a live preview of the header.
-
Go to Configuration > Incident Type Manager and select the incident type.
-
Select the Incident Workspace tab.
-
Open the workspace you want to change, or select + New Workspace to create one.
-
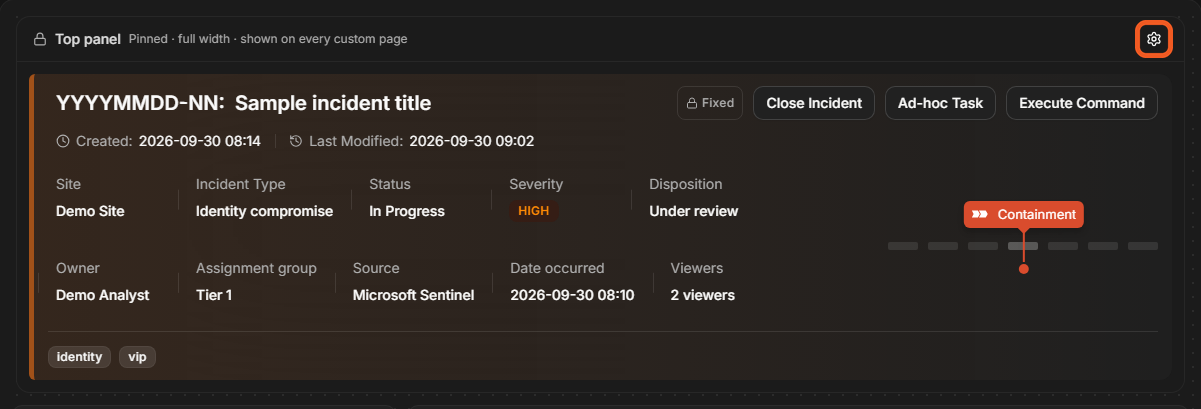
On the Build tab, find the Top panel tile pinned above the canvas. It reads Pinned · full width · shown on every custom page.
-
Select the gear icon on the tile.
The Top panel tile in the workspace builder
RESULT
The Top panel settings open on the right, in place of the widget list. The tile previews the header with sample values and updates as you edit, so you can see each change before you save. Select Widgets at the top of the settings to go back to the widget list.
The top panel settings
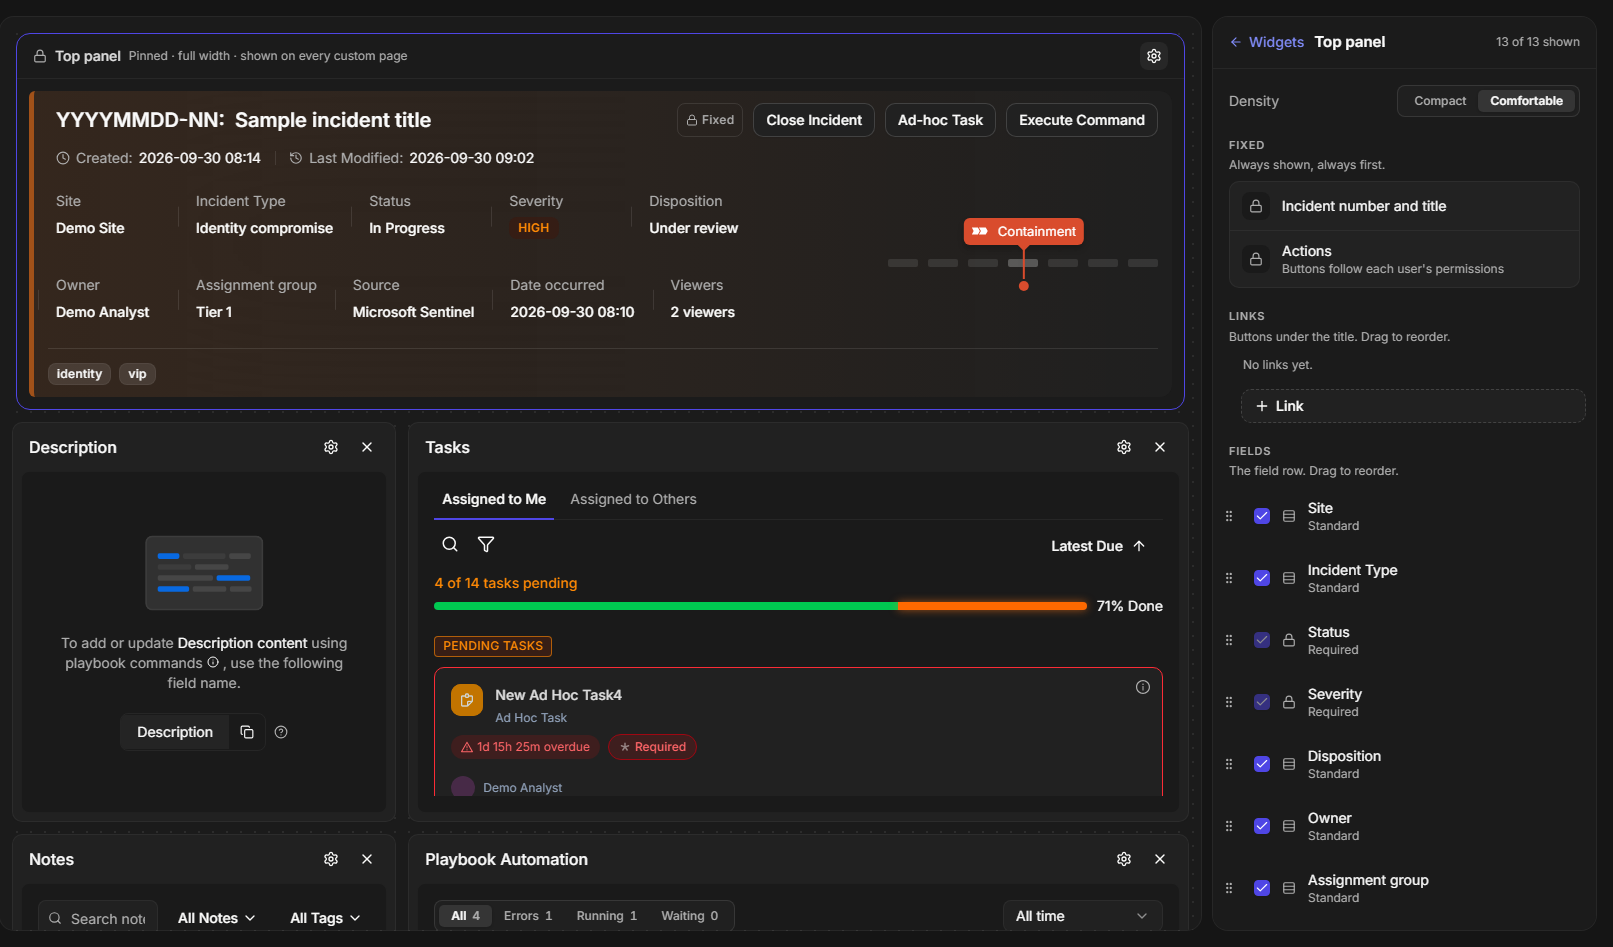
The Top Panel Settings
The settings list every part of the header from top to bottom, so the order on screen is the order in the header. Select the box beside a part to show or hide it, drag the handle beside it to move it, and select its name to open its own settings underneath, where Remove block takes it out again. The count at the top—for example 20 of 21 shown—tells you how many parts are shown.
|
Section |
What it holds |
|---|---|
|
Density |
Compact or Comfortable spacing for the whole header. |
|
Fixed |
Incident number and title, and Actions. Always shown, always first. The action buttons follow each user's permissions. |
|
Links |
Buttons under the incident title. + Link adds one. |
|
Fields |
The field row: Site, Incident Type, Status, Severity, Disposition, Owner, Assignment group, Source, Date occurred, Viewers, and any custom fields you add. + Custom field adds one. |
|
Widgets |
Compact strips under the fields, up to five. + Widget adds one. |
|
Other parts |
Created and last modified, Stage, and Tags. They keep their place; you can show or hide them. |
|
Reset to default |
Appears at the bottom once the top panel is configured. It removes the configuration, so the workspace shows the standard header again after you save. |
Choosing and Ordering Fields
The field row is where analysts read the incident's state at a glance, so keep it to the fields your team actually uses. Clear the box beside a field to hide it, and drag a field by its handle to move it. Status and Severity are marked Required and cannot be hidden, so every header still shows them.
Showing a Custom Field
A custom field in the top panel puts a value your playbooks or analysts record—an alert ID from another tool, a ticket number, a customer reference—in the field row, beside the standard fields.
-
In the top panel settings, under Fields, select + Custom field.
-
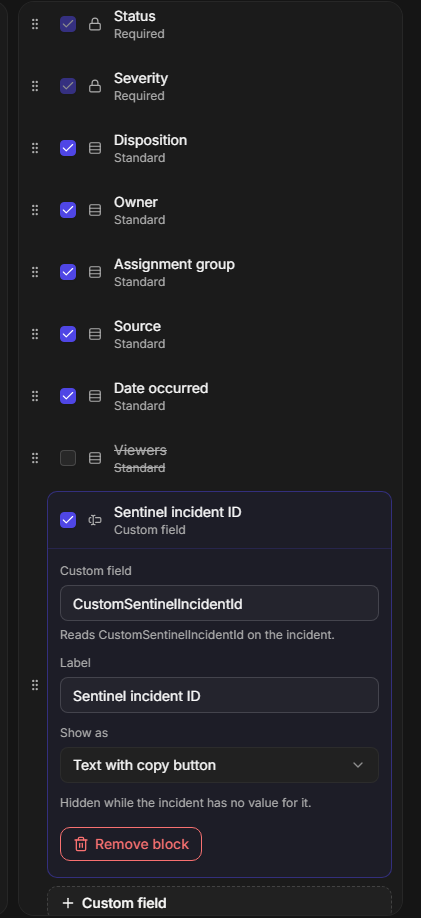
In Custom field, enter the field's display name (for example
Sentinel incident ID) or its stored name. The line underneath confirms the field it will read, for example Reads CustomSentinelIncidentId on the incident. -
In Label, enter the name analysts will see.
-
Under Show as, choose how the value looks.
A custom field's settings
RESULT
The field appears in the header's field row with your label. It is hidden on any incident that has no value for it, and its value updates on screen when a playbook or an analyst changes it.
|
Show as |
How the value appears |
|---|---|
|
Text |
Plain text. |
|
Badge |
A small badge, for short codes such as a ticket number. |
|
Text with copy button |
Text with a button that copies the value, for IDs analysts paste into another tool. |
|
Date |
The value shown as a date. |
READER NOTE
Every custom field you add here also becomes a button under Insert incident fields in the link settings, so a link can carry its value. Add the custom field first, then the link. If you want the value only in the link and not in the field row, clear the box beside the custom field.
Pinning a Link
A link button opens the matching record in another tool—the alert in Microsoft Sentinel, the ticket in your service desk—with one click from the incident. The address is built from incident fields, so each incident's button goes to its own record.
-
If the address needs a custom field, add it first under Fields (see Showing a Custom Field).
-
Under Links, select + Link.
-
In Button label, enter the text of the button, for example Open in Sentinel.
-
In Link address, enter the address. To put an incident field into it, place the cursor and select the field under Insert incident fields: Incident number, Incident ID, or any custom field you added. The field is written as
{{FieldName}}, and the Opens line shows the address with each field named.https://portal.azure.com/#view/Microsoft_Azure_Security_Insights/IncidentPage/incidentId/{{CustomSentinelIncidentId}} -
Leave Hide when the field is empty selected to hide the button on incidents that have no value for the field. Clear it to show the button disabled instead.
A link's settings
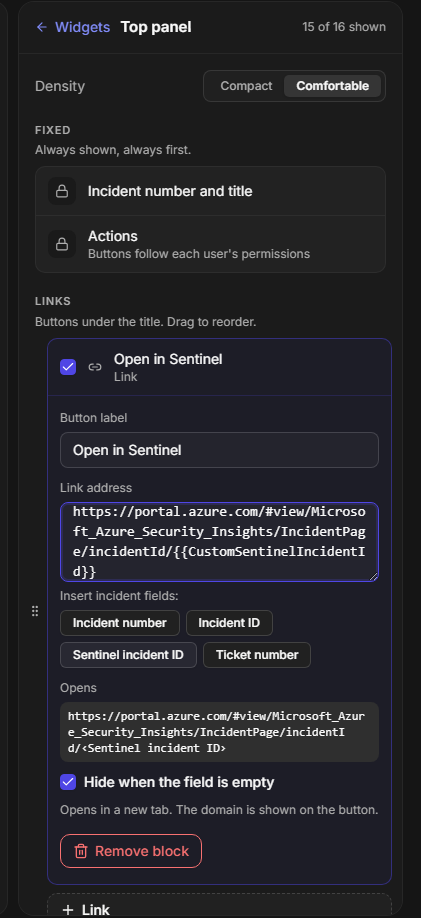
RESULT
The button appears under the incident title and shows the site it goes to—for example portal.azure.com—so analysts can see where a click leads before they make it. It always opens in a new tab, so the incident stays open.
Only web addresses that start with http:// or https:// become links, and field values are inserted in a way that cannot change the address's structure. While an address is incomplete, the link settings say what is missing: Enter a link address., Finish the address after its http(s):// start., or The address must start with http:// or https://.
WARNING
Write the site out in full and put fields only after it. If a field decides the site—https://{{Field}}/…—or makes up the whole address, whatever an alert writes into that field becomes the button's target, so a crafted alert could send analysts to a site of its choosing under your trusted label. The link settings warn you when this happens: The site this button opens comes from … or The whole address comes from …. Use such a field only if your own integration is the only thing that fills it.
The warning for an address whose site comes from a field
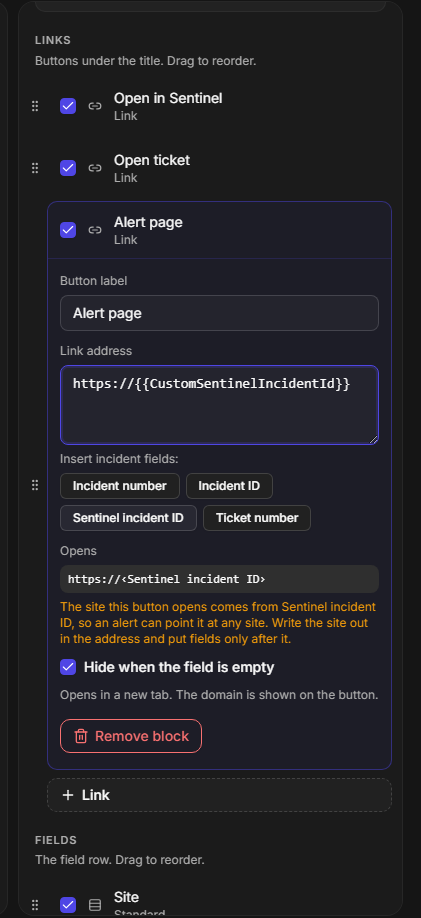
Adding Widget Strips
A widget strip is a one- or two-row summary of a workspace widget, shown under the field row: how many tasks are done, the latest note, whether a playbook failed. It answers the question an analyst would otherwise scroll the page for, and the full widget stays on the canvas for the detail.
-
Under Widgets, select + Widget. The Add a widget list opens beside the settings: the widgets your site offers that have a strip, each with a line saying what its strip shows.
Adding a widget
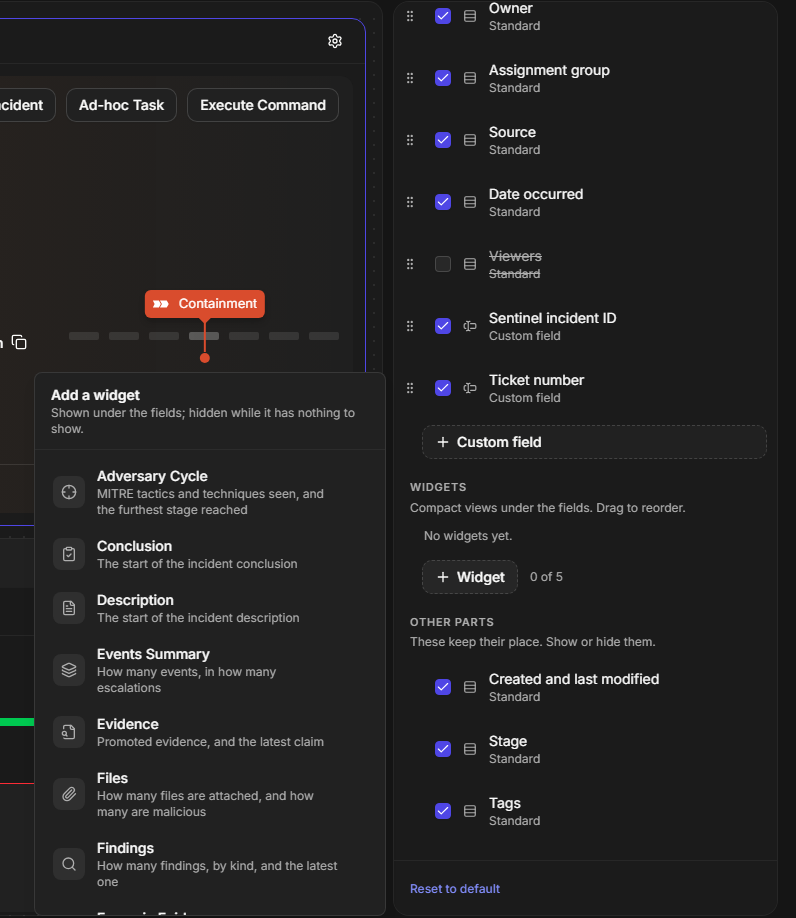
-
Select a widget. Its settings open in the list of widgets.
-
(Optional) Change its Label, and choose its Height: 1 row for the summary, or 2 rows to add a detail line, such as the latest note or each SLA deadline. Height appears for widgets that offer both.
A widget strip's settings
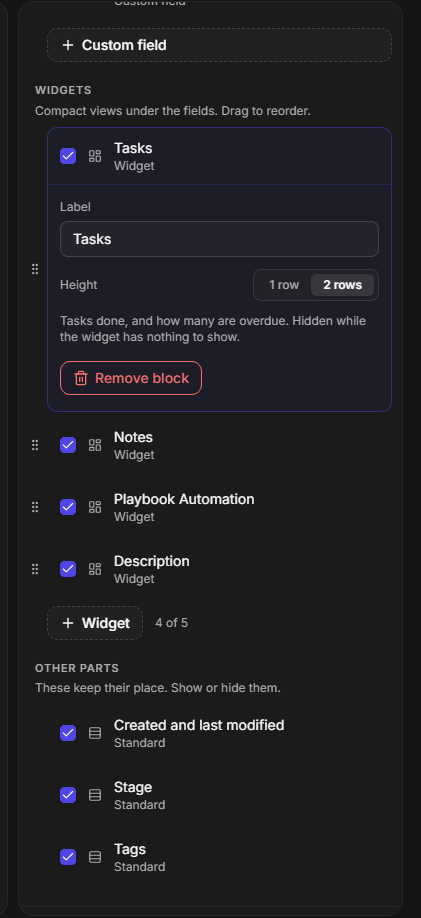
-
Drag the strips by their handles into the order you want them under the fields.
RESULT
The tile previews each strip with sample values. On an incident, each strip shows that incident's data and is hidden while its widget has nothing to show—an incident with no SLA rules shows no SLA strip.
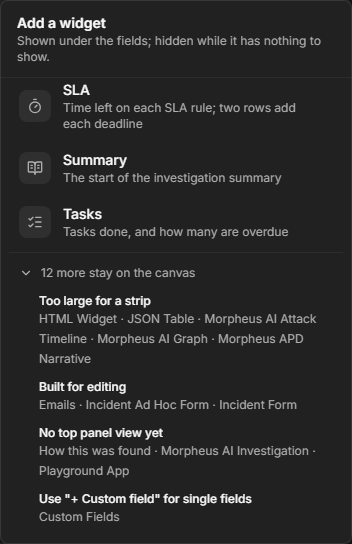
A widget already in the top panel is marked Added in the list. Widgets that have no strip stay on the canvas only; select 12 more stay on the canvas at the bottom of the list to see them grouped by the reason. Single custom fields belong under Fields instead.
Widgets that stay on the canvas
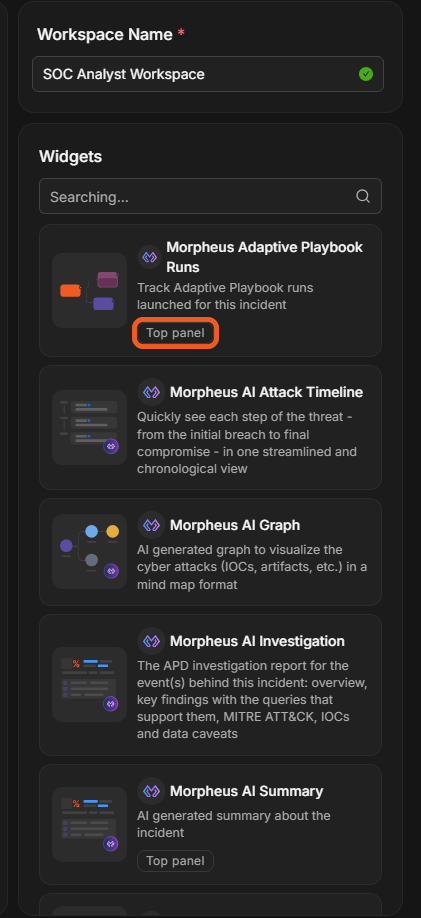
In the builder's widget list, every widget that can also go in the top panel carries a Top panel badge, so you can tell before you open the settings.
The Top panel badge in the widget list
|
Widget |
The strip shows |
|---|---|
|
Adversary Cycle |
MITRE tactics and techniques seen, and the furthest stage reached |
|
Conclusion |
The start of the incident conclusion |
|
Description |
The start of the incident description |
|
Events Summary |
How many events, in how many escalations |
|
Evidence |
Promoted evidence, and the latest claim |
|
Files |
How many files are attached, and how many are malicious |
|
Findings |
How many findings, by kind, and the latest one |
|
Forensic Evidence |
Sealed evidence count, legal hold, and items that need attention |
|
Investigation Team |
Who is on the investigation team |
|
Linked Artifacts |
How many artifacts are linked, and how many have a bad reputation |
|
Linked Incidents |
How many incidents are linked and how many are still open |
|
Morpheus Adaptive Playbook Runs |
Morpheus playbook runs: running, waiting for input, failed |
|
Morpheus AI Summary |
Threat confidence and the headline of the AI investigation |
|
Morpheus Form Submission |
The form this incident came from, and how far it got |
|
Notes |
How many notes, and the latest one |
|
Playbook Automation |
How many playbooks are running, waiting on someone, failed, or finished with errors |
|
Recommendations |
How many recommendations, and the latest one |
|
Remediations & Mitigations |
How many remediations, and the latest one |
|
SLA |
Time left on each SLA rule; two rows add each deadline |
|
Summary |
The start of the investigation summary |
|
Tasks |
Tasks done, and how many are overdue |
Widget names follow your site's widget list, so a few may read slightly differently on your site. Where your site offers Markdown widgets, a Markdown strip shows the start of a Markdown widget's content; enter the title of that widget in the strip's settings, and add one strip per Markdown widget you want.
READER NOTE
A top panel holds up to five widget strips, and hidden strips count toward the five. The count beside + Widget—for example 4 of 5—shows how many are placed.
Saving the Top Panel
Your changes reach the incident workspace only when you save the workspace.
-
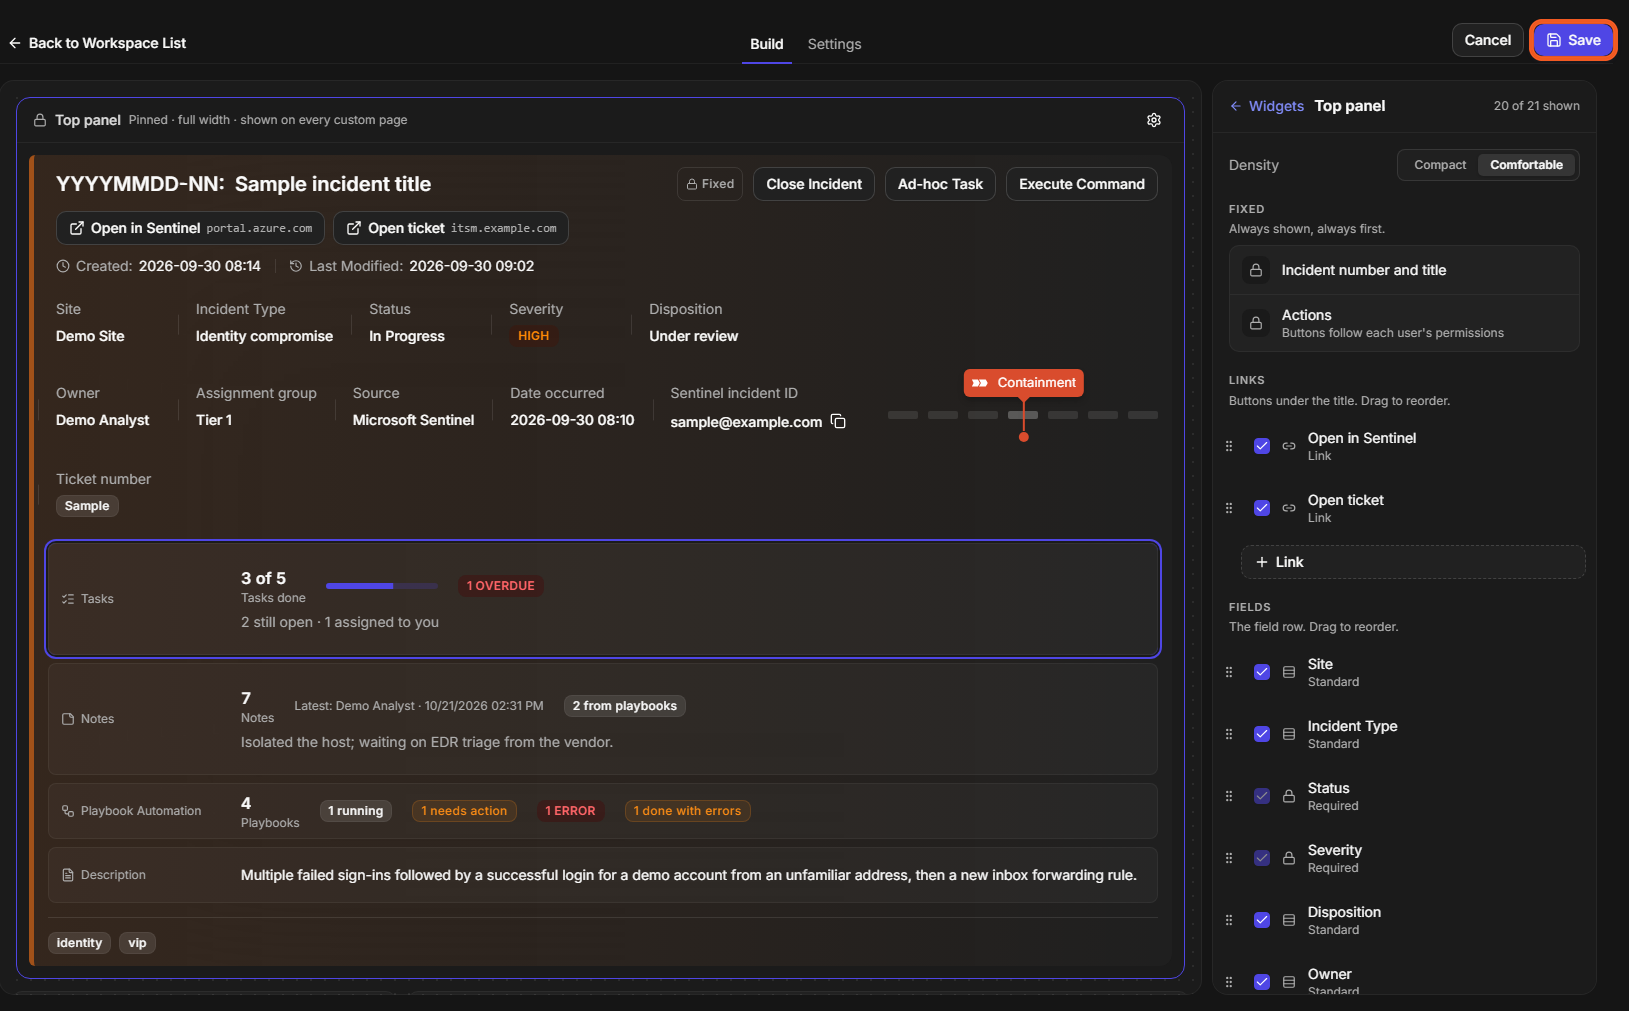
Check the preview on the Top panel tile.
-
Select Save at the top right of the builder.
The configured top panel before saving
RESULT
Layout saved successfully appears. Every incident that uses this workspace shows the new header the next time it is opened. While the workspace saves, the button reads Saving… and the builder is locked, so a second click cannot save it twice.
The builder checks the top panel before it saves and names the part that needs fixing:
|
Message |
What to fix |
|---|---|
|
The top panel holds up to 5 widgets. |
Remove a widget strip; hidden strips count too. |
|
Every top panel link needs a button label. |
Enter a Button label for each link. |
|
Top panel link "…": Enter a link address. (or another address message) |
Complete the link's address. |
|
Every top panel custom field needs a label. |
Enter a Label for each custom field. |
|
Top panel custom field "…" needs a field name. |
Enter the field in Custom field. |
To go back to the standard header, select Reset to default at the bottom of the settings, then Save.
What Analysts See
On an incident, the top panel shows the workspace's configuration with that incident's own values.
-
Link buttons sit under the incident title and show the site they open. They stay visible when the header is collapsed, so the link to the source alert is always one click away.
-
Custom fields sit in the field row with their labels. A field with no value on this incident is hidden.
-
Widget strips sit under the field row when the header is expanded. A strip is hidden while its widget has nothing to show.
-
Strips follow the same permissions as their widgets. Someone who cannot see the Tasks widget or the playbook widgets does not see those strips, and someone with read-only task access sees counts of their own tasks only.
-
Strips refresh with the workspace, and SLA times are shown in the incident's time zone, like the rest of the header.
The collapsed header

Limits and Good to Know
-
Five widget strips per top panel, hidden ones included.
-
The builder previews with sample values. The tile shows how the header is laid out, not a real incident. To check real values, open an incident that uses the workspace.
-
Tenant sync copies the top panel with the rest of the workspace.
-
A strip from a newer version is kept. If a workspace was set up on a newer version with a strip this version does not know, the strip is kept as it is and still counts toward the five; the settings say how many are kept.
-
Playground apps cannot be added as strips yet. They stay on the canvas.