
Last Updated: November 17, 2026
Overview
The Morpheus widgets put what Morpheus AI found while investigating an incident into the incident's workspace: a written summary, a narrative, a timeline of the attack, a graph of the attack, and the full investigation report. They are listed in the workspace builder with the Morpheus icon. Each widget is described below; the Morpheus AI Graph has the longest section, because it is the one you work in rather than only read.
The Morpheus widgets can be added only where Morpheus AI incident widgets are enabled for your D3 instance, and they appear on an incident only when its workspace includes them. If you do not see one, ask your administrator. See Availability at the end of this page.
Adding the Widgets
-
Open the workspace in the builder. See Configuring an Incident Type: Incident Workspace.
-
In Widgets, type Morpheus in the search box.
-
Drag a widget onto the canvas, then select Save.
The Morpheus widgets
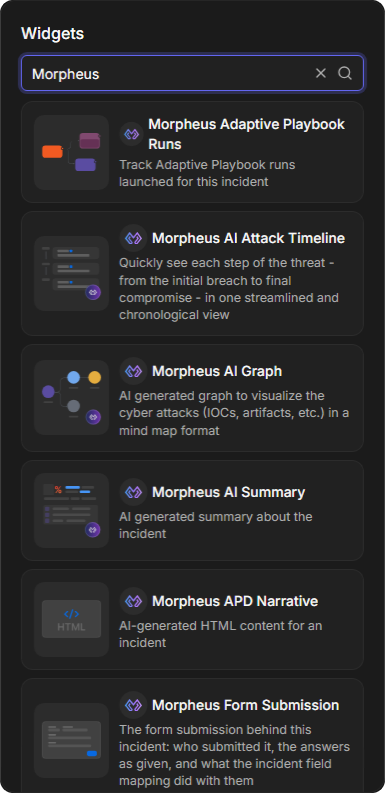
|
Widget |
What it shows |
|---|---|
|
Morpheus AI Summary |
AI generated summary about the incident |
|
Morpheus APD Narrative |
AI-generated HTML content for an incident |
|
Morpheus AI Attack Timeline |
Each step of the threat, from the initial breach to final compromise, in one chronological view |
|
Morpheus AI Investigation |
The full APD report for each investigated event behind the incident |
|
Morpheus AI Graph |
The attack as a graph of the IOCs and artifacts involved. See Morpheus AI Graph below |
|
Morpheus Adaptive Playbook Runs |
The Adaptive Playbook runs launched for the incident |
|
Morpheus Form Submission |
The form submission behind the incident. See Morpheus Forms |
Morpheus AI Summary
The summary of Morpheus AI's investigation of the incident:
-
When the investigation started (Initiated at, in UTC), a percentage, and a headline.
-
The Residual Risk, and the tactic and technique involved, such as Initial Access → Spearphishing Attachment (T1566.001).
-
A short account of what happened.
-
KEY FINDINGS, THREAT INTEL VERDICT, ATTACK SUMMARY with the attack window, WHY IT MATTERS and REMEDIATION SUMMARY.
-
Thumbs-up and thumbs-down buttons at the top right.
The Morpheus AI Summary widget
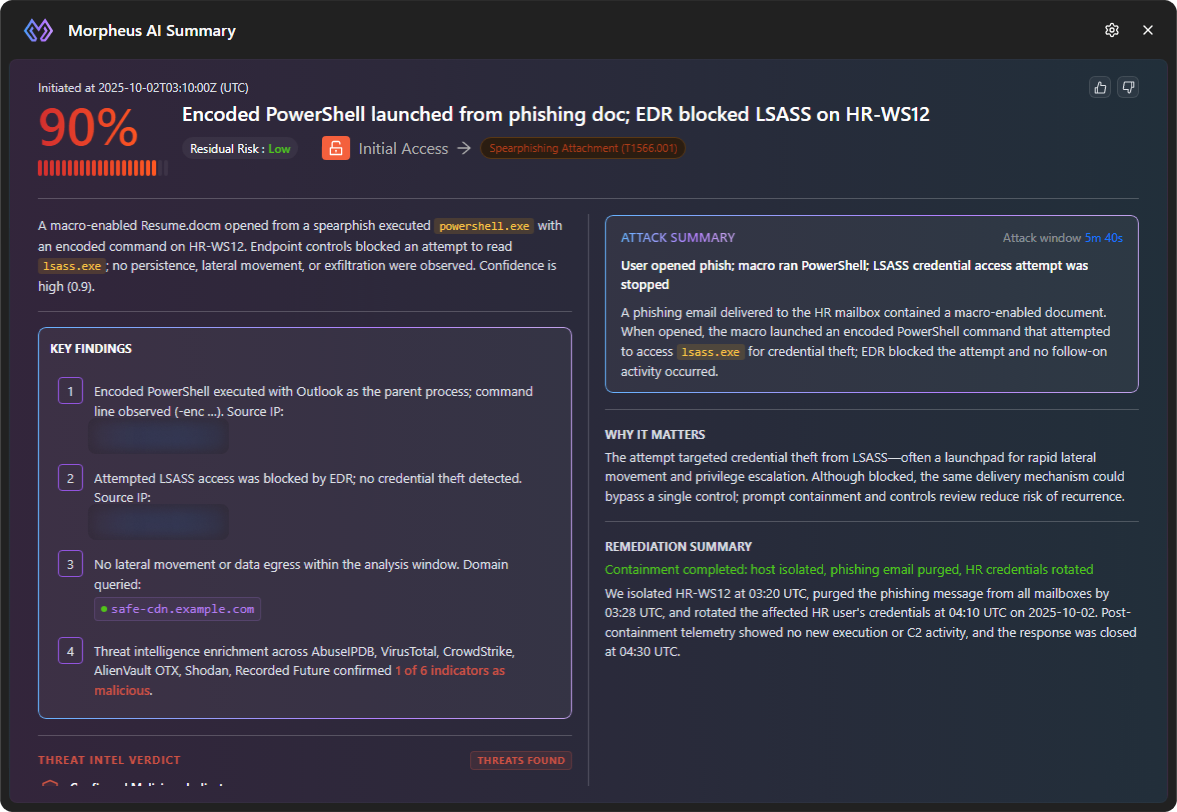
An incident with nothing to summarize shows No threats found.
Morpheus APD Narrative
The Morpheus APD Narrative widget shows the narrative of Morpheus AI's investigation of the incident as formatted HTML. Until a narrative is recorded for the incident, it shows No Data.
The Morpheus APD Narrative widget
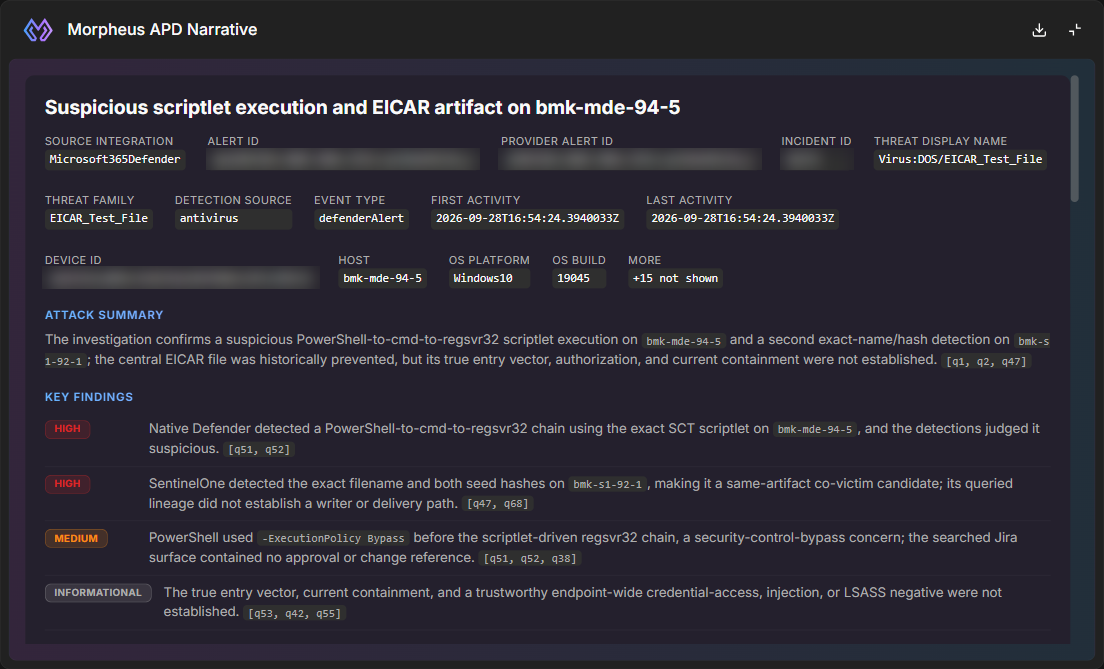
The narrative is also the first section of an exported incident report. See Exporting Incidents.
Morpheus AI Attack Timeline
The attack, step by step: each entry says what happened, on which device and from which data source, with its time in UTC. Filter by device, search with Search activity..., narrow with All Devices and All Data Sources, and change the order with Newest First. An incident with no timeline shows No threats found.
The Morpheus AI Attack Timeline widget
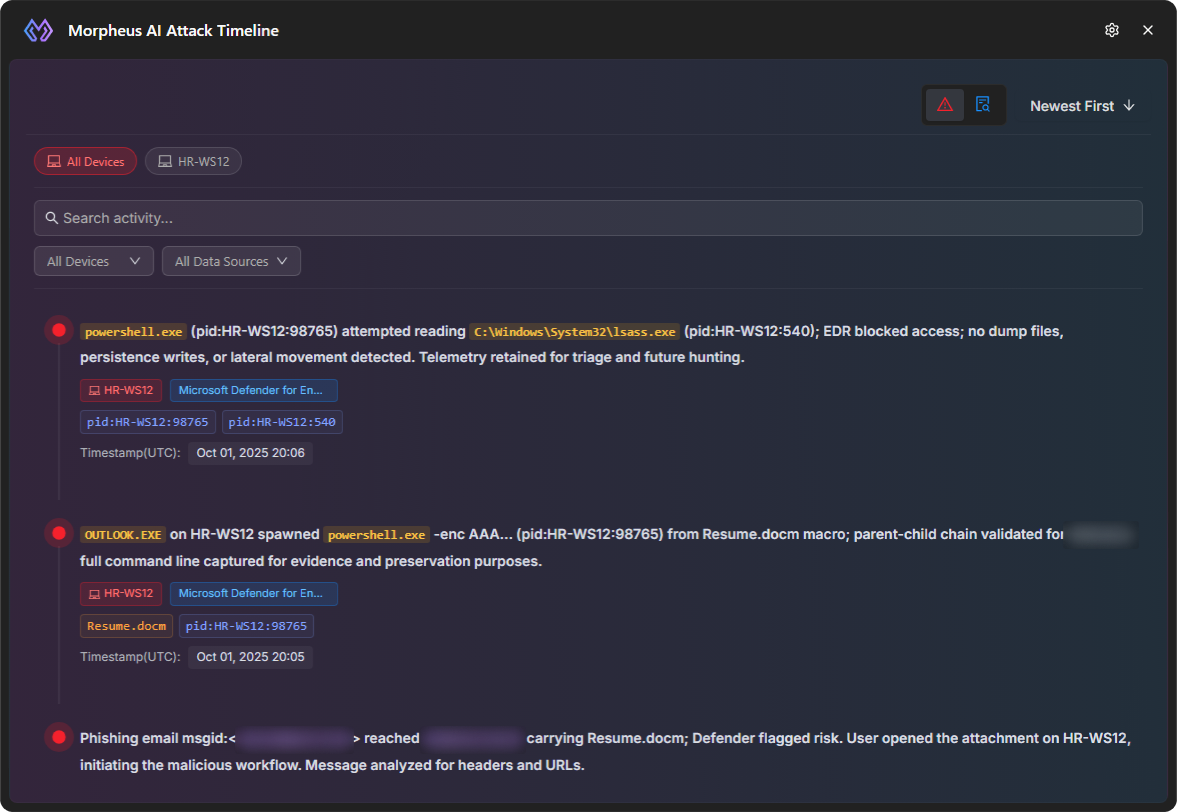
The pictures show the sample content the workspace builder displays.
Morpheus AI Investigation
The Morpheus AI Investigation widget shows the full report Morpheus AI wrote for one event behind the incident, with the searches behind every finding. Where the Morpheus AI Summary sums up the whole incident, this widget lets you check how Morpheus AI reached each finding for a single event. See Morpheus AI Investigation.
Morpheus AI Graph
The Morpheus AI Graph is the Incident Workspace card that draws what Morpheus AI found while investigating an incident. Each entity Morpheus recorded—an email, a user, a host, a process, a file, a domain, an IP address—is a node, and each link it traced between two entities is an arrow. You get the attack as one picture, from where it started to where it went, and every node that matches an artifact opens that artifact's full record.
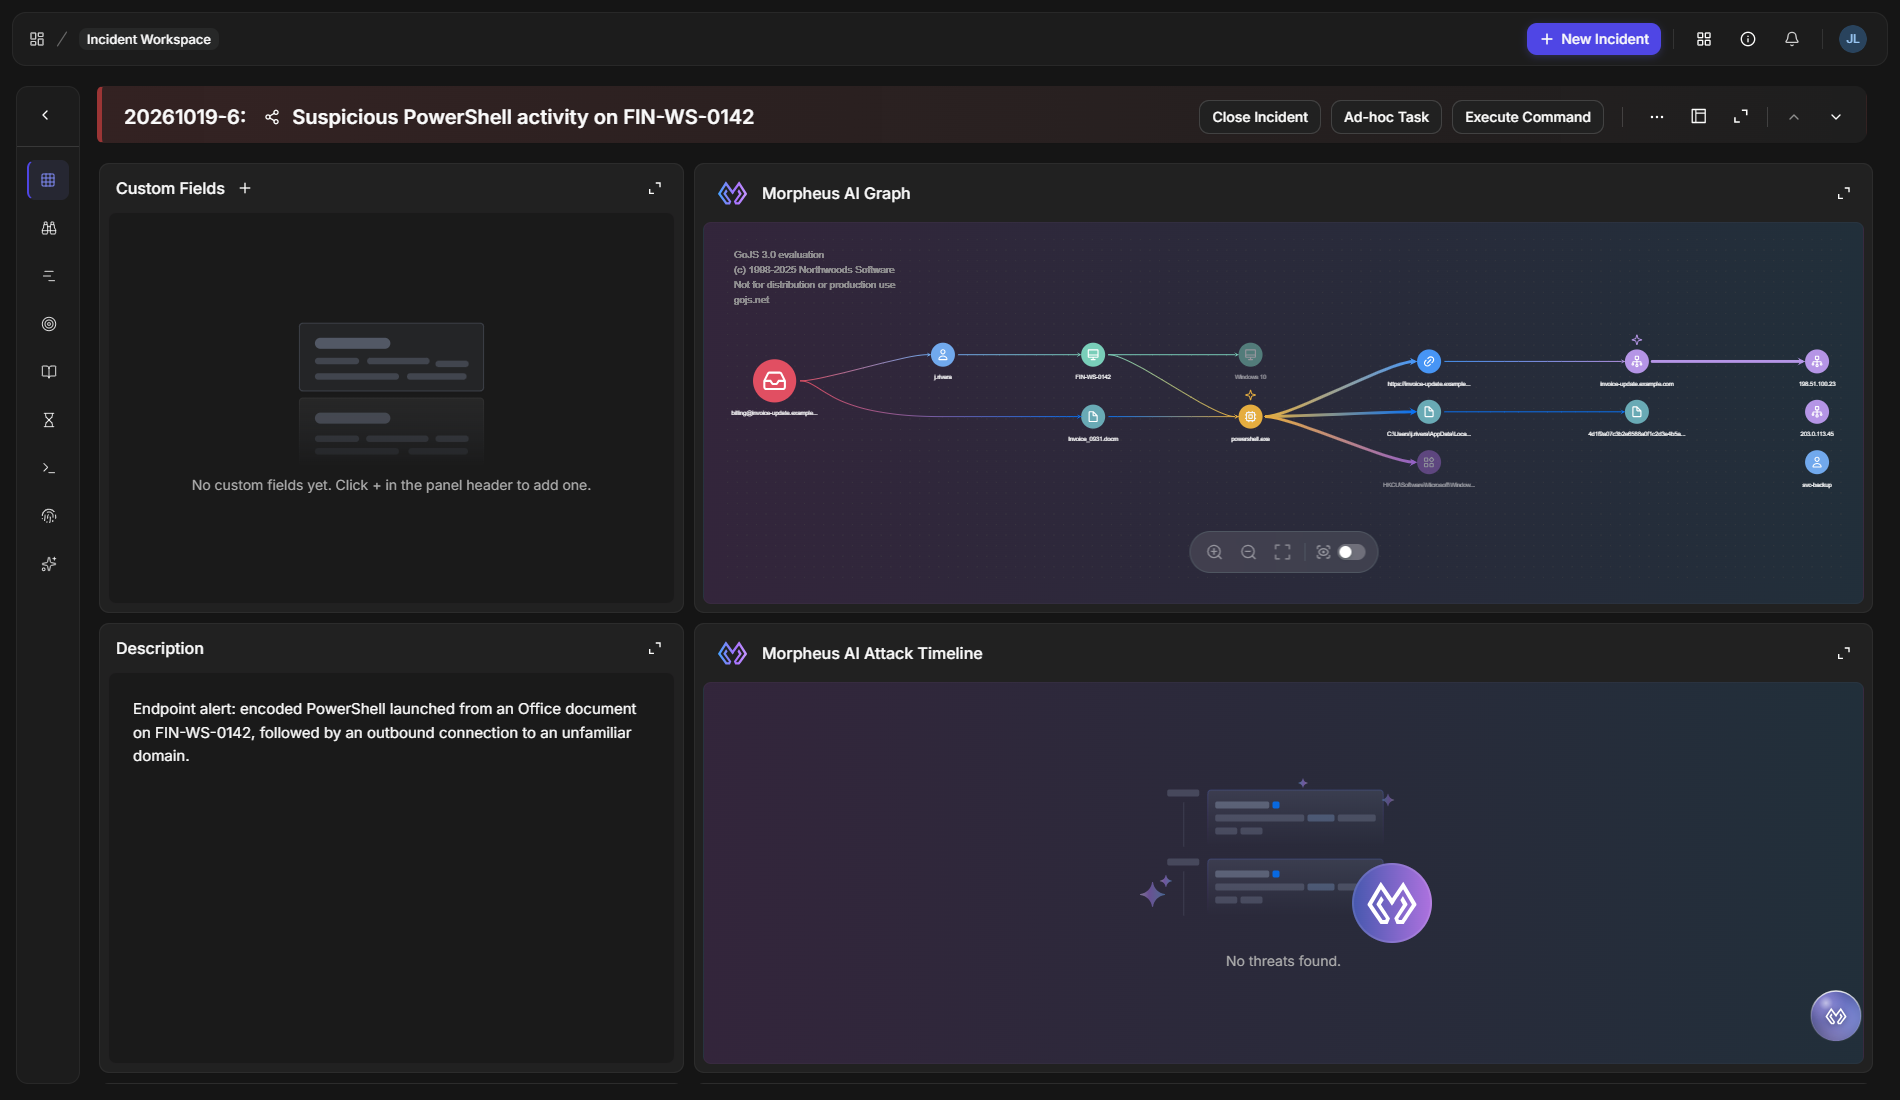
When Morpheus investigates an incident, it adds the entities on the graph to the incident as artifacts. It uses the artifact record when D3 already has one and creates it when D3 does not, so the IOCs it found are in the incident’s Artifacts list with the rest. Artifacts that Morpheus added are marked as coming from AI Investigation; the entity the alert itself started from is marked as coming from Field mapping, because it came in with the alert. An entity that D3 cannot keep as an artifact stays on the graph without a record. See Nodes Without an Artifact Record below.
The graph shows only what Morpheus recorded, and it explains its gaps where it can. A node with no artifact record says why in its tooltip, and a node with no connection to the rest of the attack says why when Morpheus recorded a reason, so a gap reads as a finding rather than as a fault.
In short
|
# |
Stage |
Where it happens |
|---|---|---|
|
1 |
Find the graph |
Incidents > the incident's number > the Morpheus AI Graph card in its Incident Workspace |
|
2 |
See the whole attack |
The card's expand control, then Zoom to Fit |
|
3 |
Read a node or a connection |
Hover over it |
|
4 |
Open an artifact's record |
Click the node to open the Artifact Detail panel |
|
5 |
Track what you have checked |
Right-click a node, then Mark as reviewed |
|
6 |
See reviewed nodes again |
The Show Reviewed switch in the graph toolbar |
|
7 |
Save the graph as an image |
The download icon (Export as PNG) in the card header |
Opening the Full Graph
Expanding the card gives the graph the whole page, which is the easiest way to read an investigation with more than a handful of entities.
-
On the Incidents page, select the incident's number. The incident's Incident Workspace opens in a new browser tab, with the Morpheus AI Graph card among its cards.
-
Select the expand control at the top right of the card.
-
Select Zoom to Fit in the toolbar at the bottom of the graph. Expanding keeps the graph at the size it had in the card, so this is the step that brings the whole graph into view.
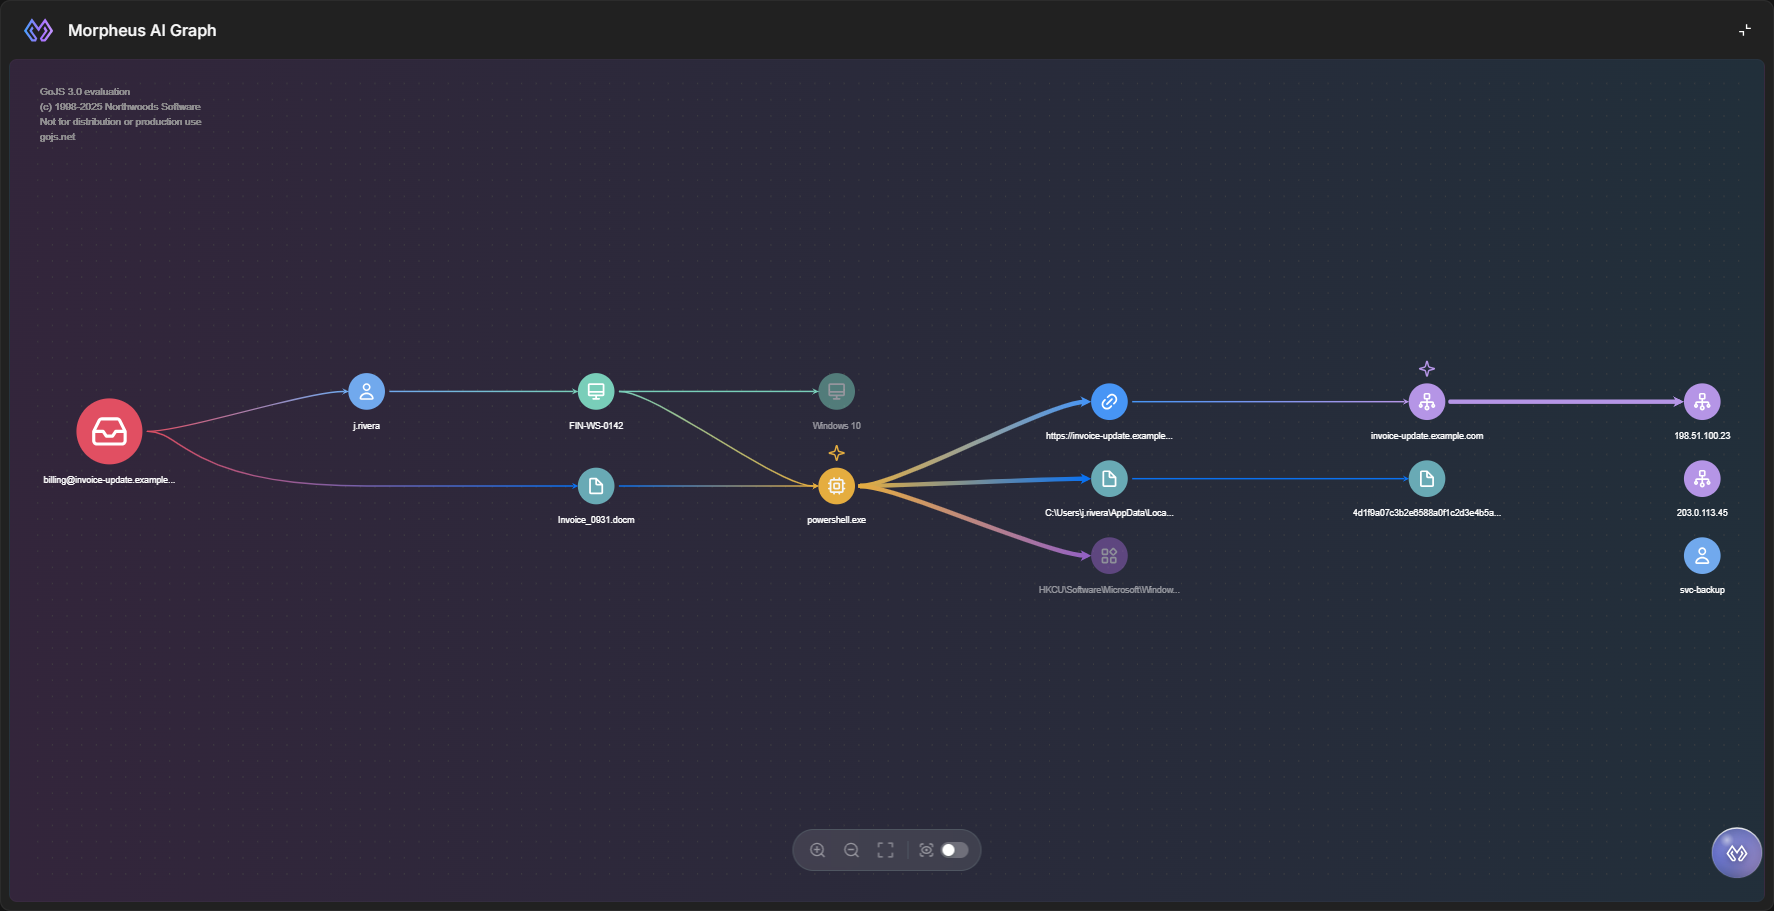
RESULT
The graph fills the page, and every node fits in view.
The toolbar has four controls, each named when you hover over it: Zoom In, Zoom Out, Zoom to Fit, and the Show Reviewed switch, which is covered in Marking Nodes as Reviewed.
Reading the Graph
The graph is a map of the attack. Each chain of connections reads from left to right, following each link Morpheus traced from one entity to the next. Each node shows an icon for its type and the entity's name. Long names are shortened on the graph; hover over the name to see it in full.
|
What you see |
What it means |
|---|---|
|
A larger node |
The initial activity—where Morpheus traced the start of the incident. It is not always at the far left. |
|
A sparkle above a node, and thicker arrows leaving it |
A key finding that Morpheus marked |
|
An arrow between two nodes |
A connection Morpheus recorded, pointing from one entity to the next |
|
A faded node |
Usually an entity with no artifact record, or a reviewed node shown again with Show Reviewed. The tooltip tells you which: a line starting No artifact record, or a REVIEWED BY block |
|
A node with no arrows, in the column at the right edge |
An entity Morpheus did not connect to the rest of the attack, or one whose only connection ran to a node marked as reviewed |
|
A dotted arrow |
A path that runs through a node someone marked as reviewed |
Hover over a node's icon to see what Morpheus recorded about it. From top to bottom, the tooltip shows:
-
the entity's type, with the security tool that reported it on the right—for example, Email reported by Email gateway
-
Morpheus's description of the entity, with names such as files and processes highlighted
-
REVIEWED BY, with a name and a time, when someone has marked the node as reviewed
-
the artifact line—Artifact linked when the node matches an artifact record
-
the reason the node stands apart from the rest of the graph, when Morpheus recorded one
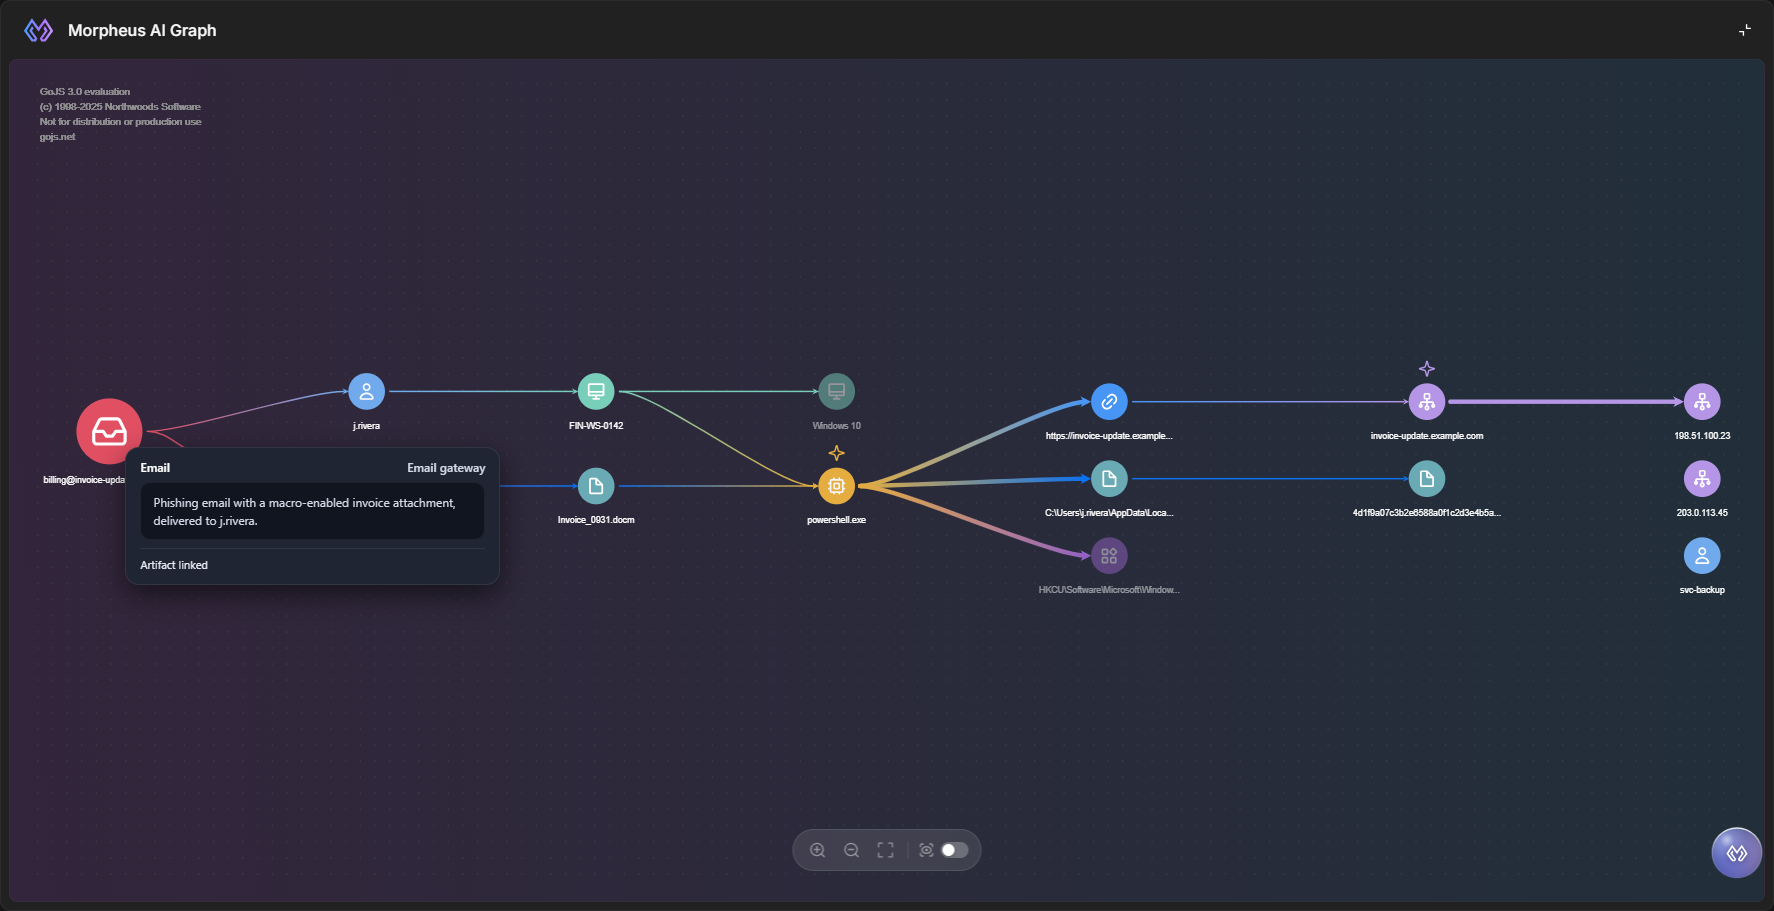
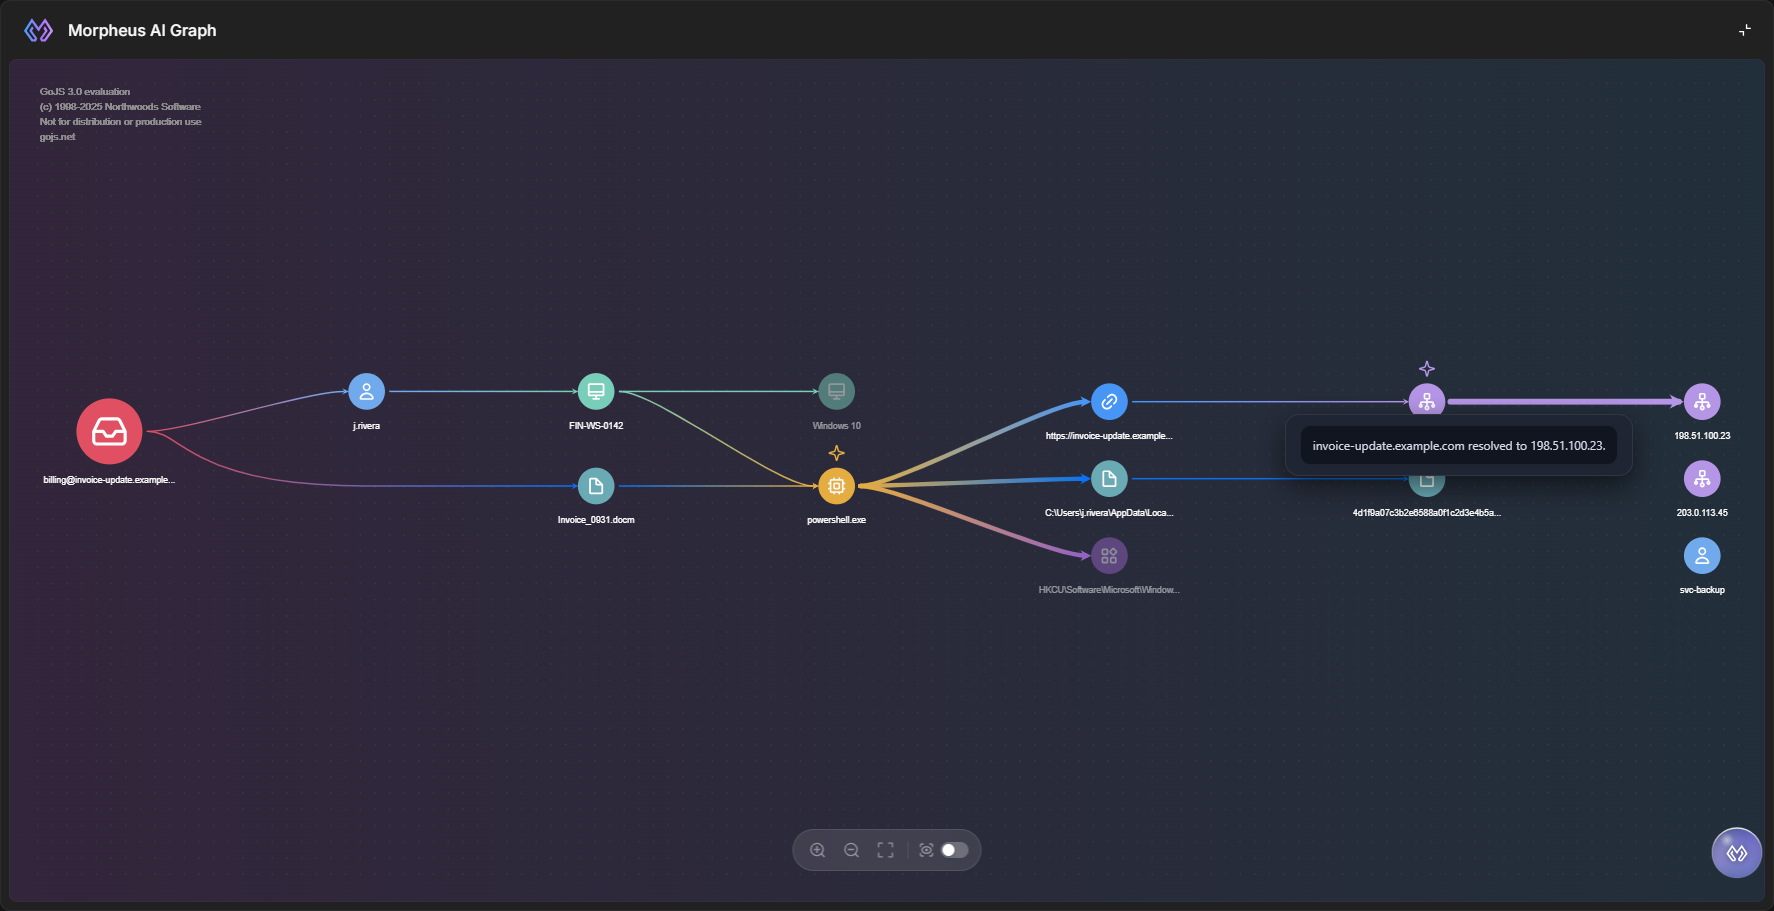
Hover over an arrow to read the connection in Morpheus's own words.
Opening an Artifact's Details
Clicking a node opens the artifact record behind it without leaving the incident, so you can check an entity's reputation, its other events and incidents, and its notes straight from the picture.
-
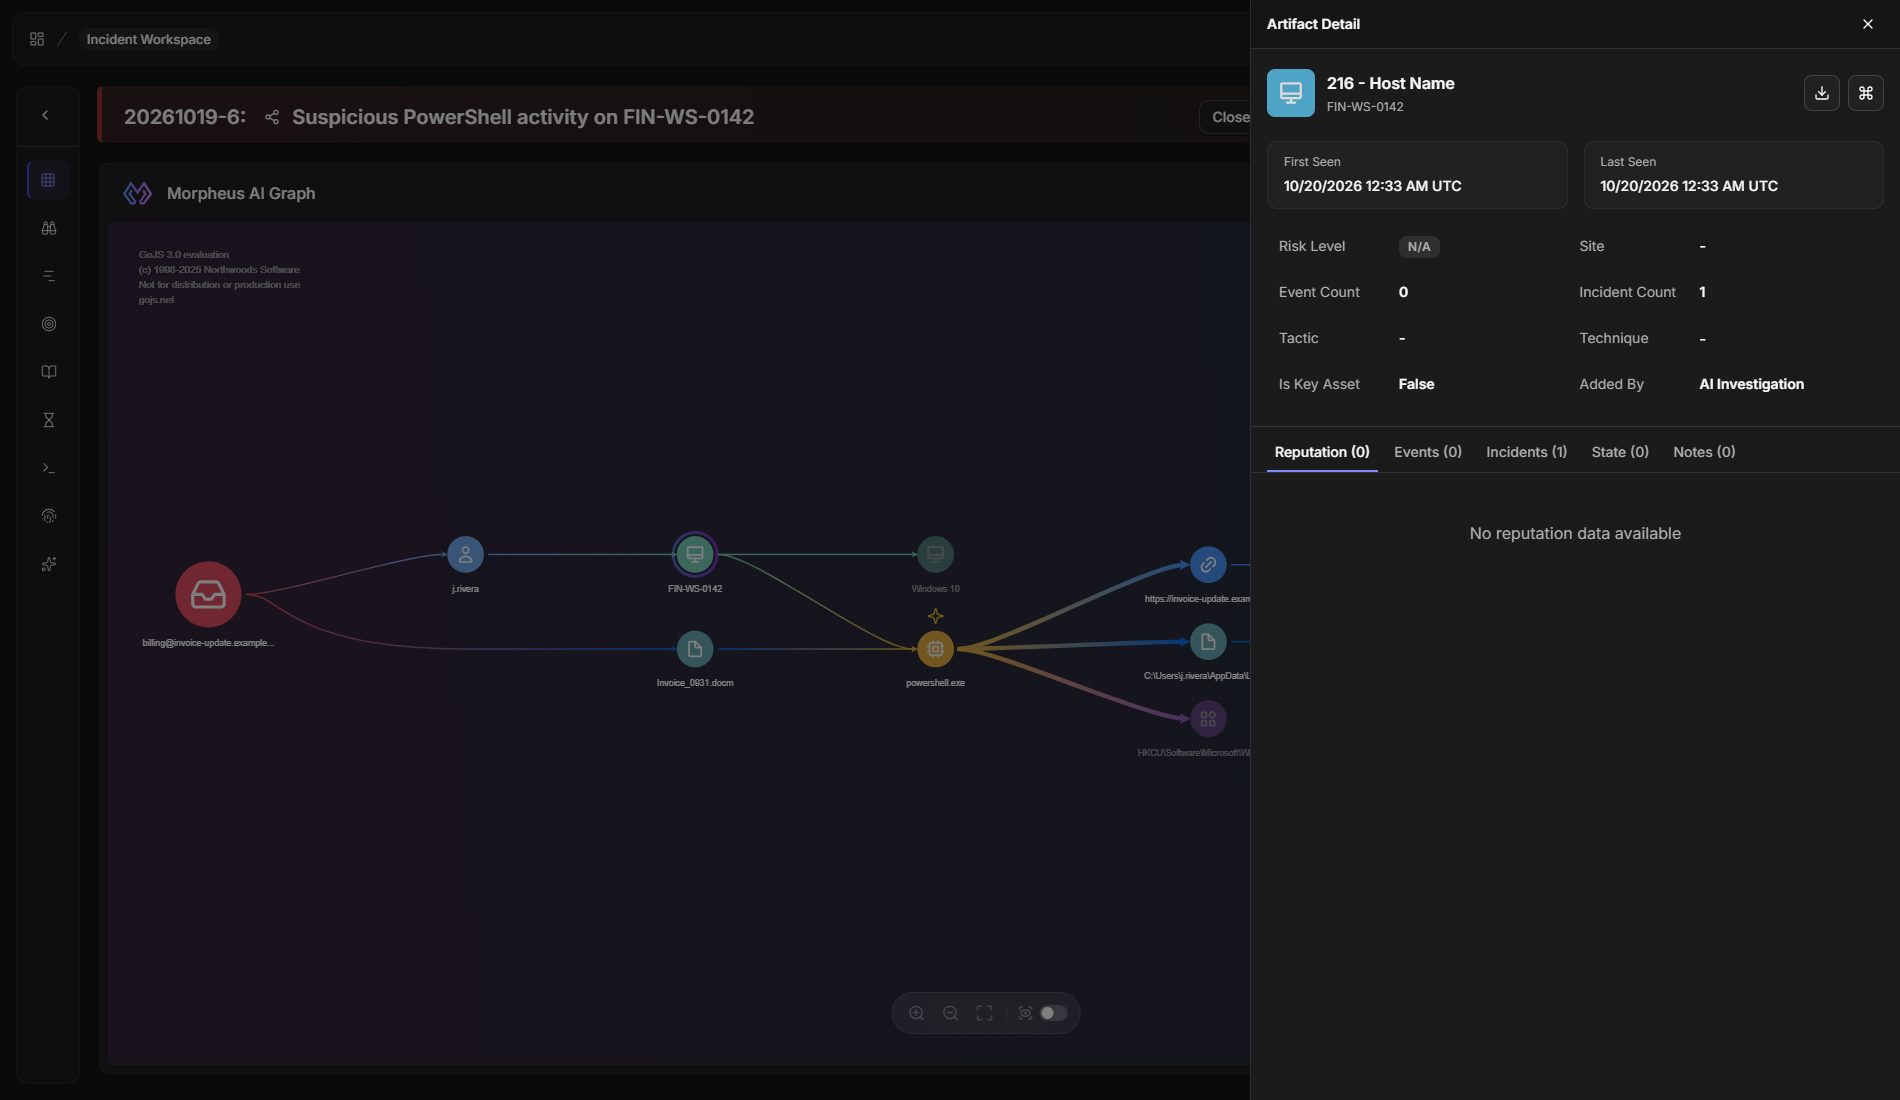
Click a node whose tooltip shows Artifact linked.
RESULT
The Artifact Detail panel opens on the right of the page. It shows the artifact's number, type, and value; when it was first and last seen; its Risk Level, Site, Event Count, Incident Count, Tactic, Technique, and Is Key Asset; and Added By, which reads AI Investigation for an artifact that Morpheus added. Below them, the Reputation, Events, Incidents, State, and Notes tabs each show how many entries they hold.
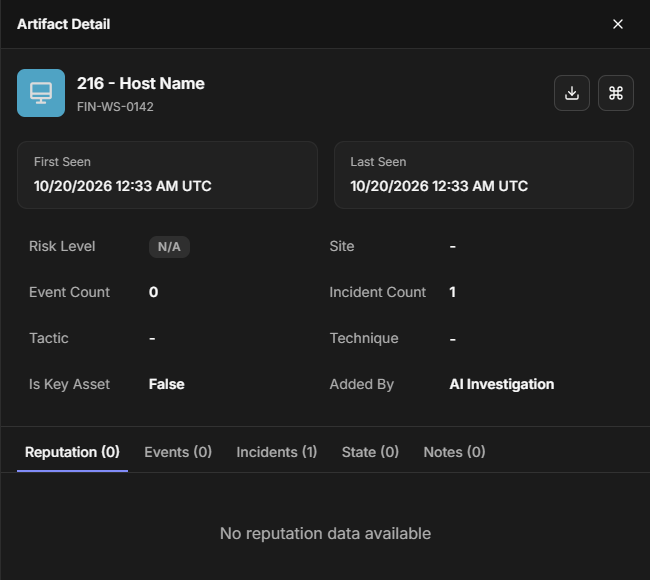
Clicking a node with no artifact record does nothing—hover over its icon instead to see why. A reviewed node shown faded with Show Reviewed still opens its record.
Merged Nodes
A merged node is one artifact that Morpheus mentioned more than once, drawn a single time so that each artifact appears on the graph once. It happens when two mentions match the same artifact record—for example, a process that Morpheus describes once when it starts and again when it runs a script later in the attack.
The merged node keeps the name of the first mention. Its tooltip lists the description of every mention, separated by a dot (·), and its arrows carry the connections of every mention, so nothing Morpheus recorded about the artifact is lost.
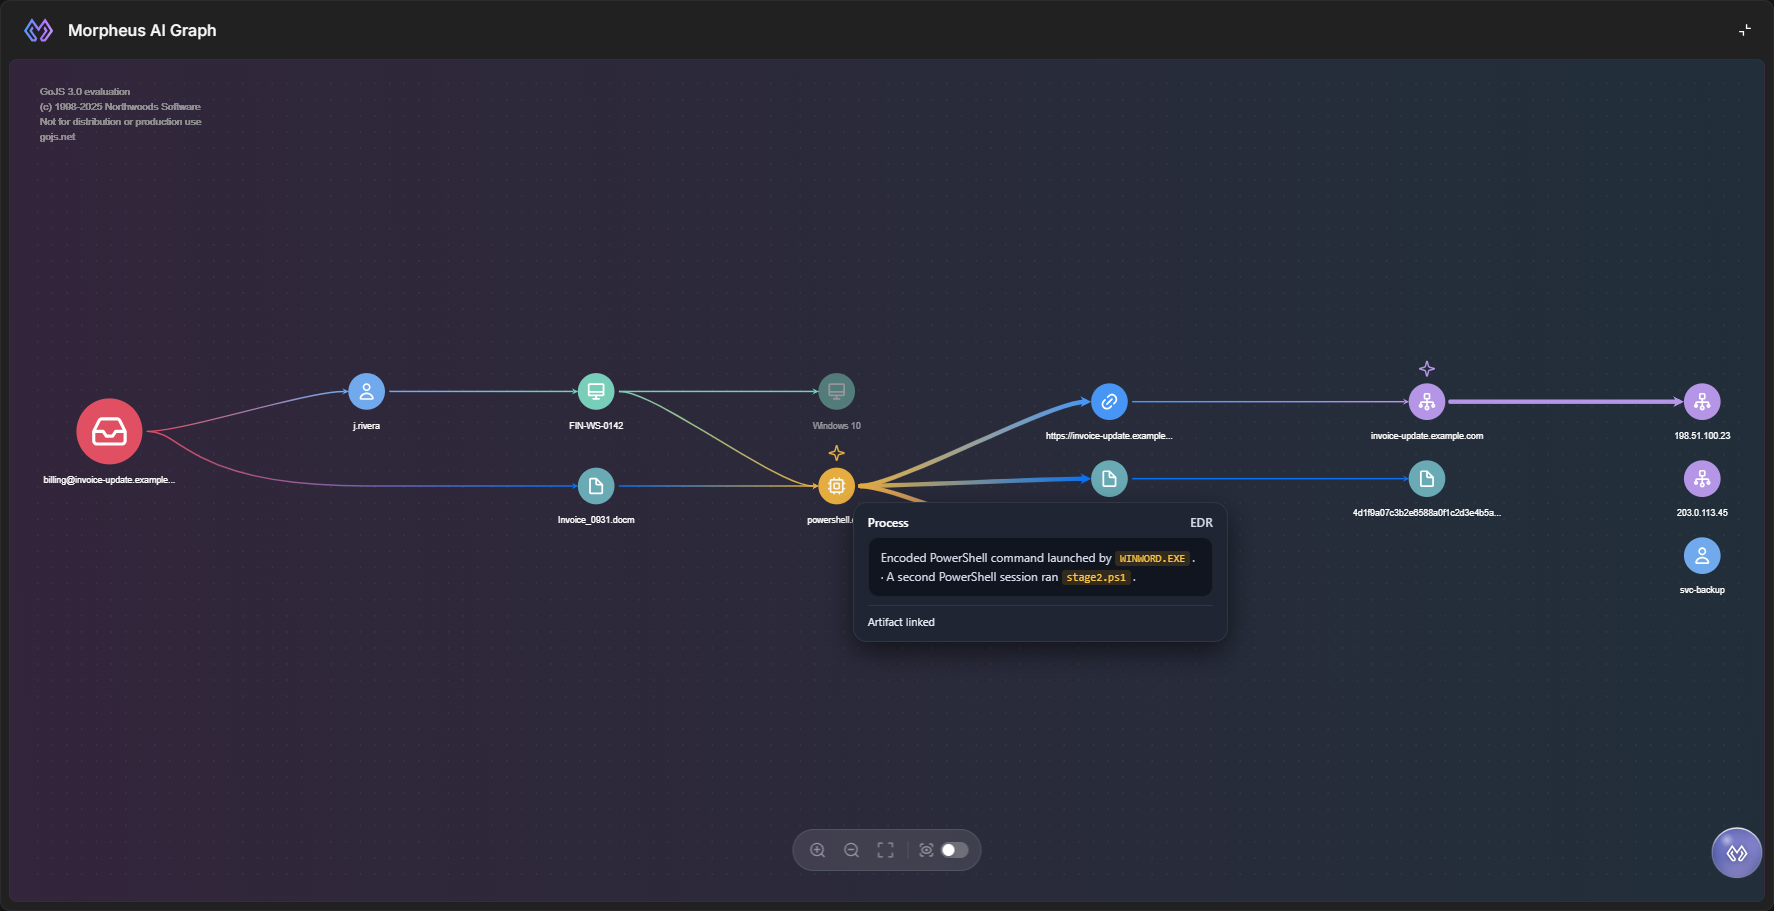
Marking a merged node as reviewed marks every mention at once, and unmarking it clears them all.
Nodes Without an Artifact Record
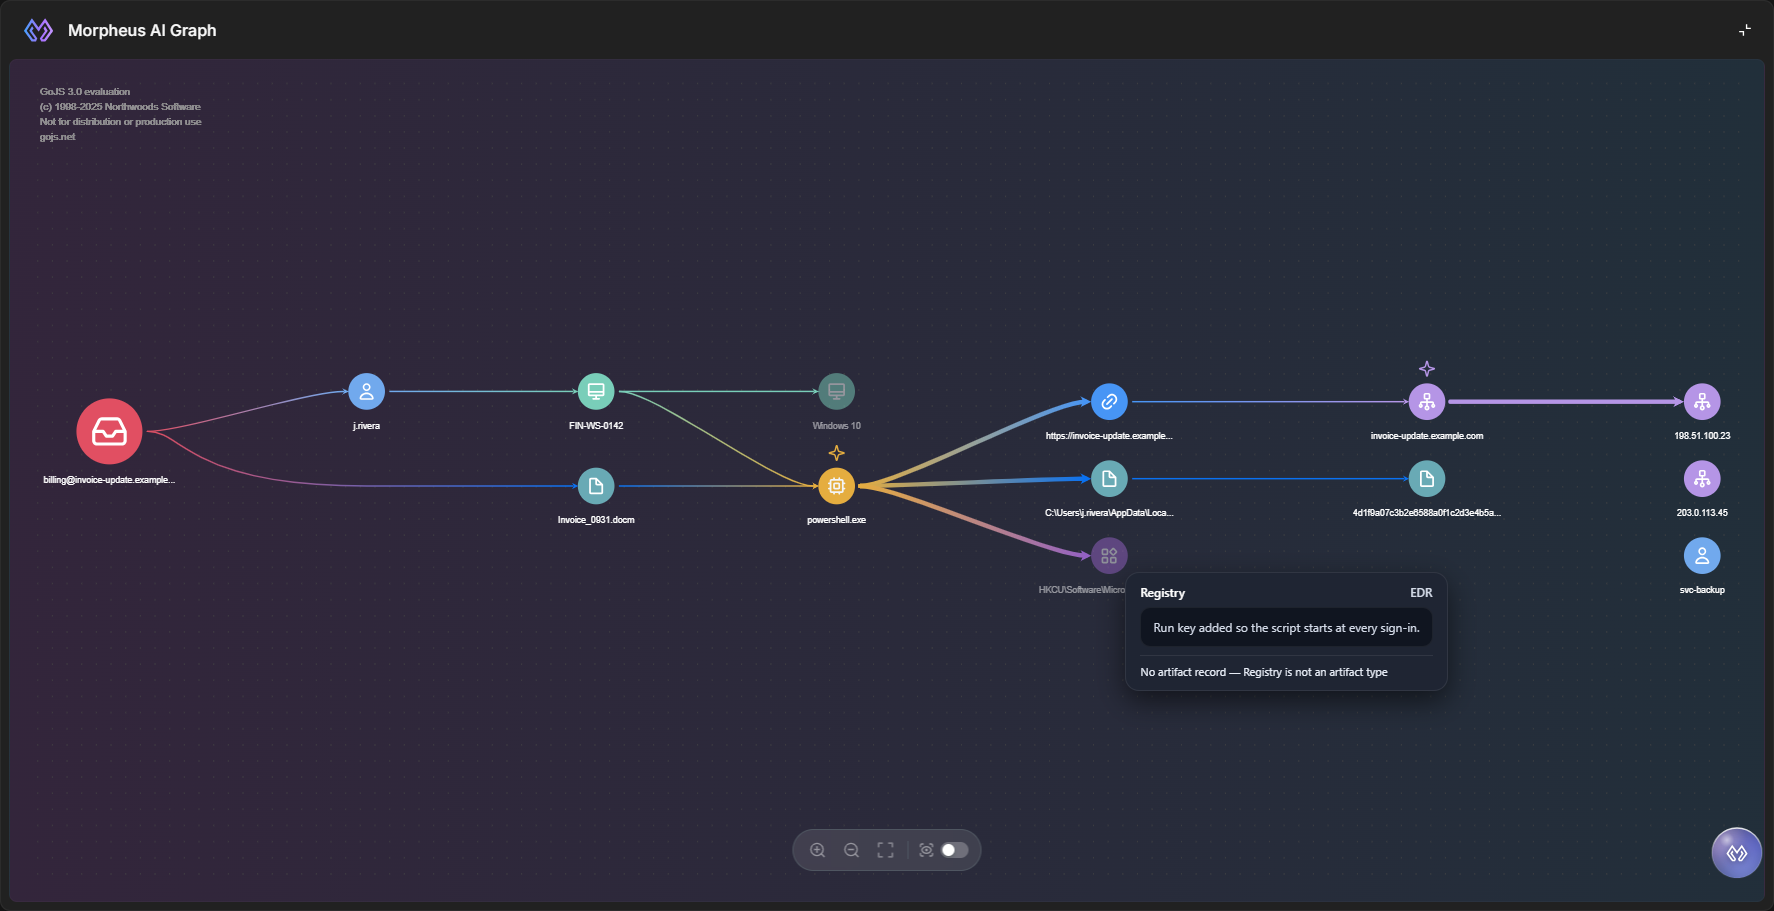
A node without an artifact record is an entity Morpheus recorded that does not match an artifact record. It stays on the graph, drawn faded, because it is still part of what Morpheus found. Reviewed nodes shown with Show Reviewed are faded too, so the tooltip line starting No artifact record is what marks a node without a record, and it says why—so you can tell an entity D3 does not track from one whose value looks wrong.
|
Artifact line |
What it means |
|---|---|
|
Artifact linked |
The node matches an artifact record. Click the node to open it. |
|
No artifact record — type is not an artifact type |
D3 does not keep this kind of entity as an artifact—for example, a registry key. |
|
No artifact record — value did not pass the type check |
D3 keeps this type of artifact, but the value does not look like one—for example, an operating system name recorded as a host name. |
|
No artifact record for this node |
No record matched, and no more specific reason is available. |
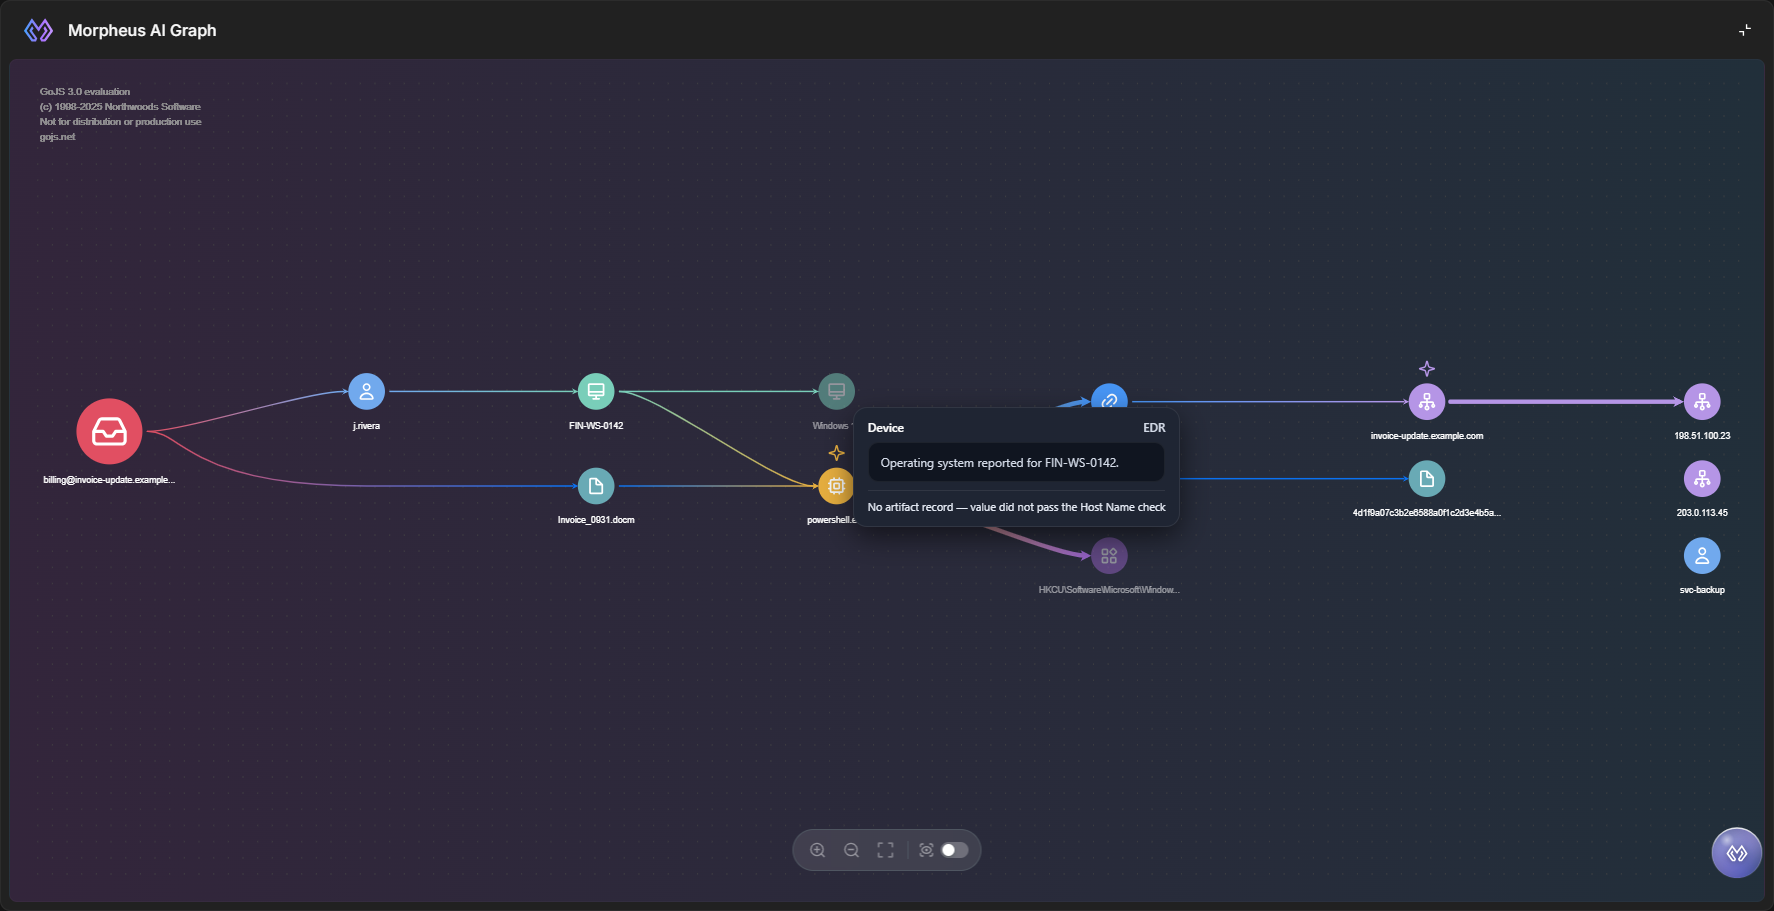
Nodes That Stand Alone
A node that stands alone is an entity Morpheus found during the investigation but could not tie to the attack path—for example, a connection from the same host in the same hour that no process on the path explains. It has no arrows and sits in the column at the right edge of the graph. When Morpheus recorded why, the reason is the last line of the node's tooltip, so you can decide whether it deserves a closer look.
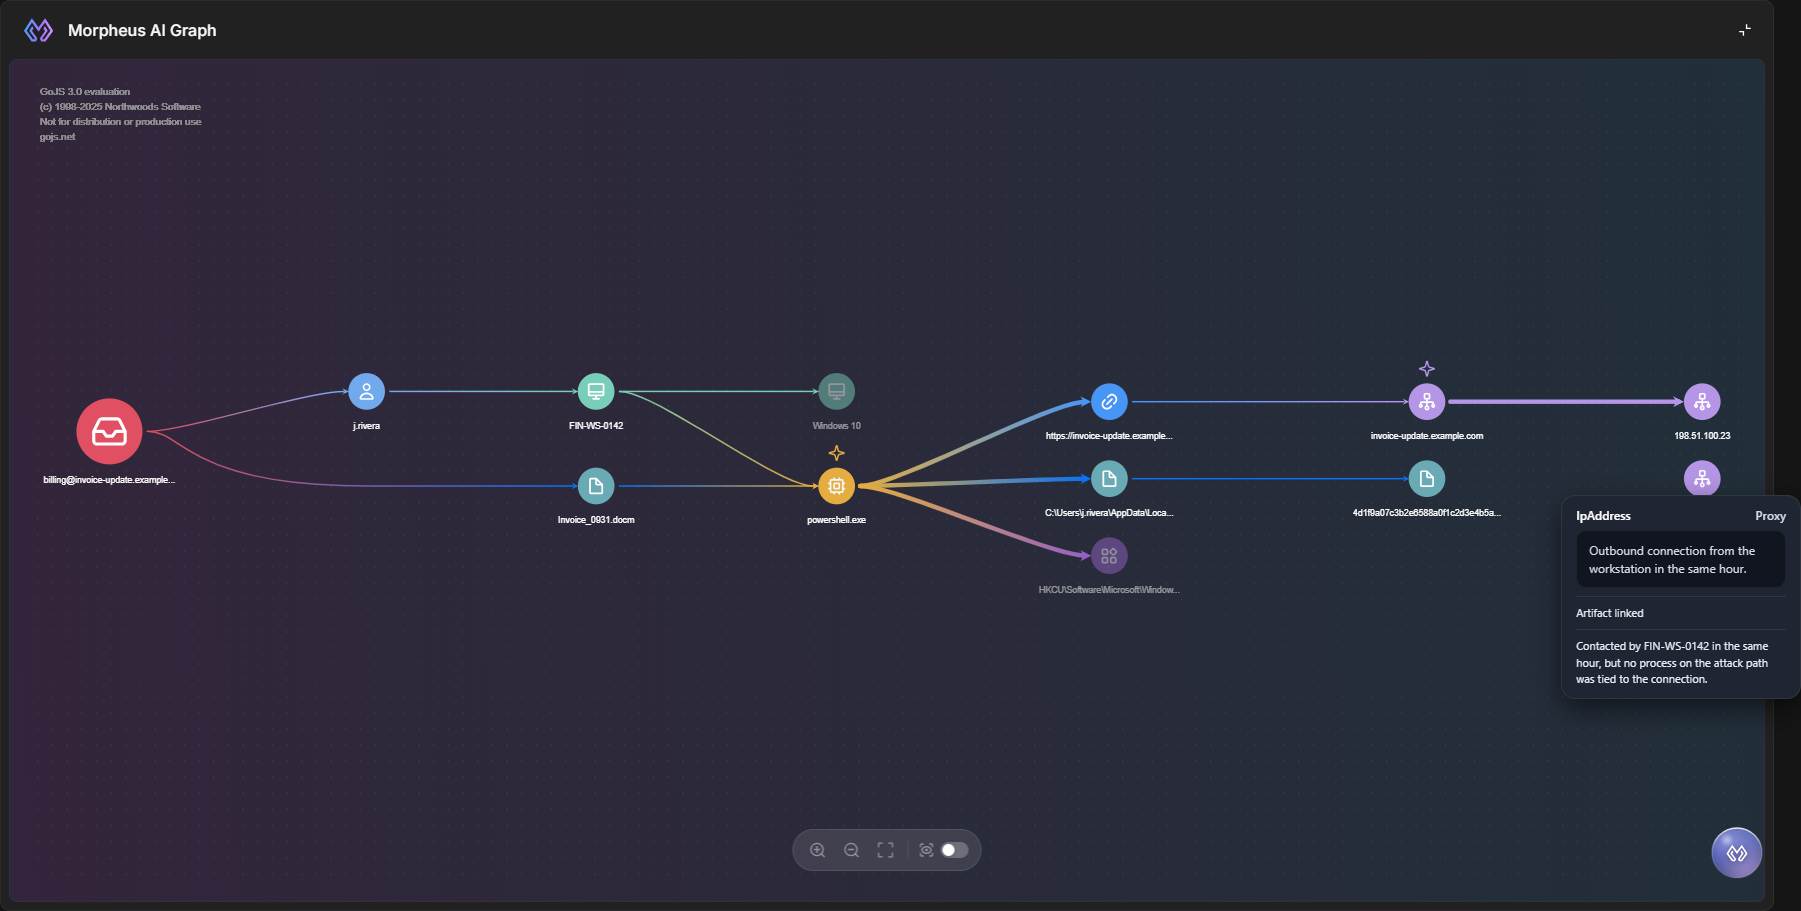
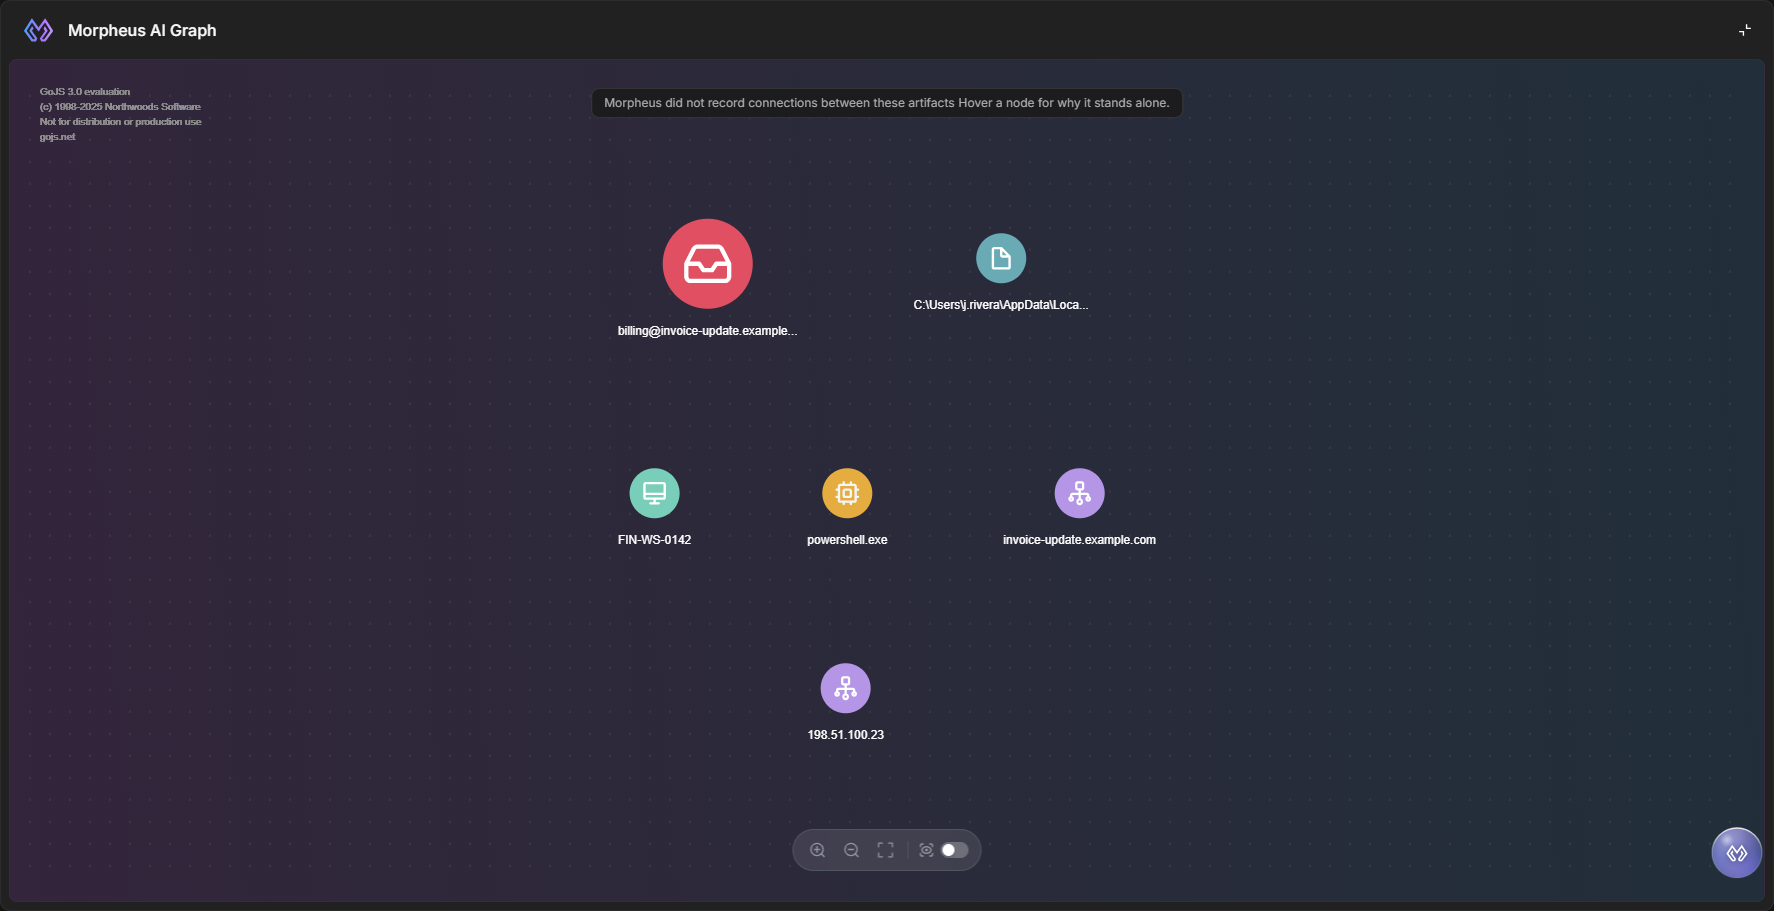
If Morpheus recorded entities but no connections at all, every node stands alone, and a note across the top of the graph reads Morpheus did not record connections between these artifacts. When at least one node carries a reason, the note adds Hover a node for why it stands alone. This tells you the investigation found the entities but not how they relate, which is different from an empty or broken graph.
Marking Nodes as Reviewed
Marking a node as reviewed takes it off the graph once you have checked it, so what remains is what still needs attention. The mark is saved with the incident and records who made it and when, so the rest of your team can see what has already been looked at.
READER NOTE
You can mark nodes only on an incident you can edit.
-
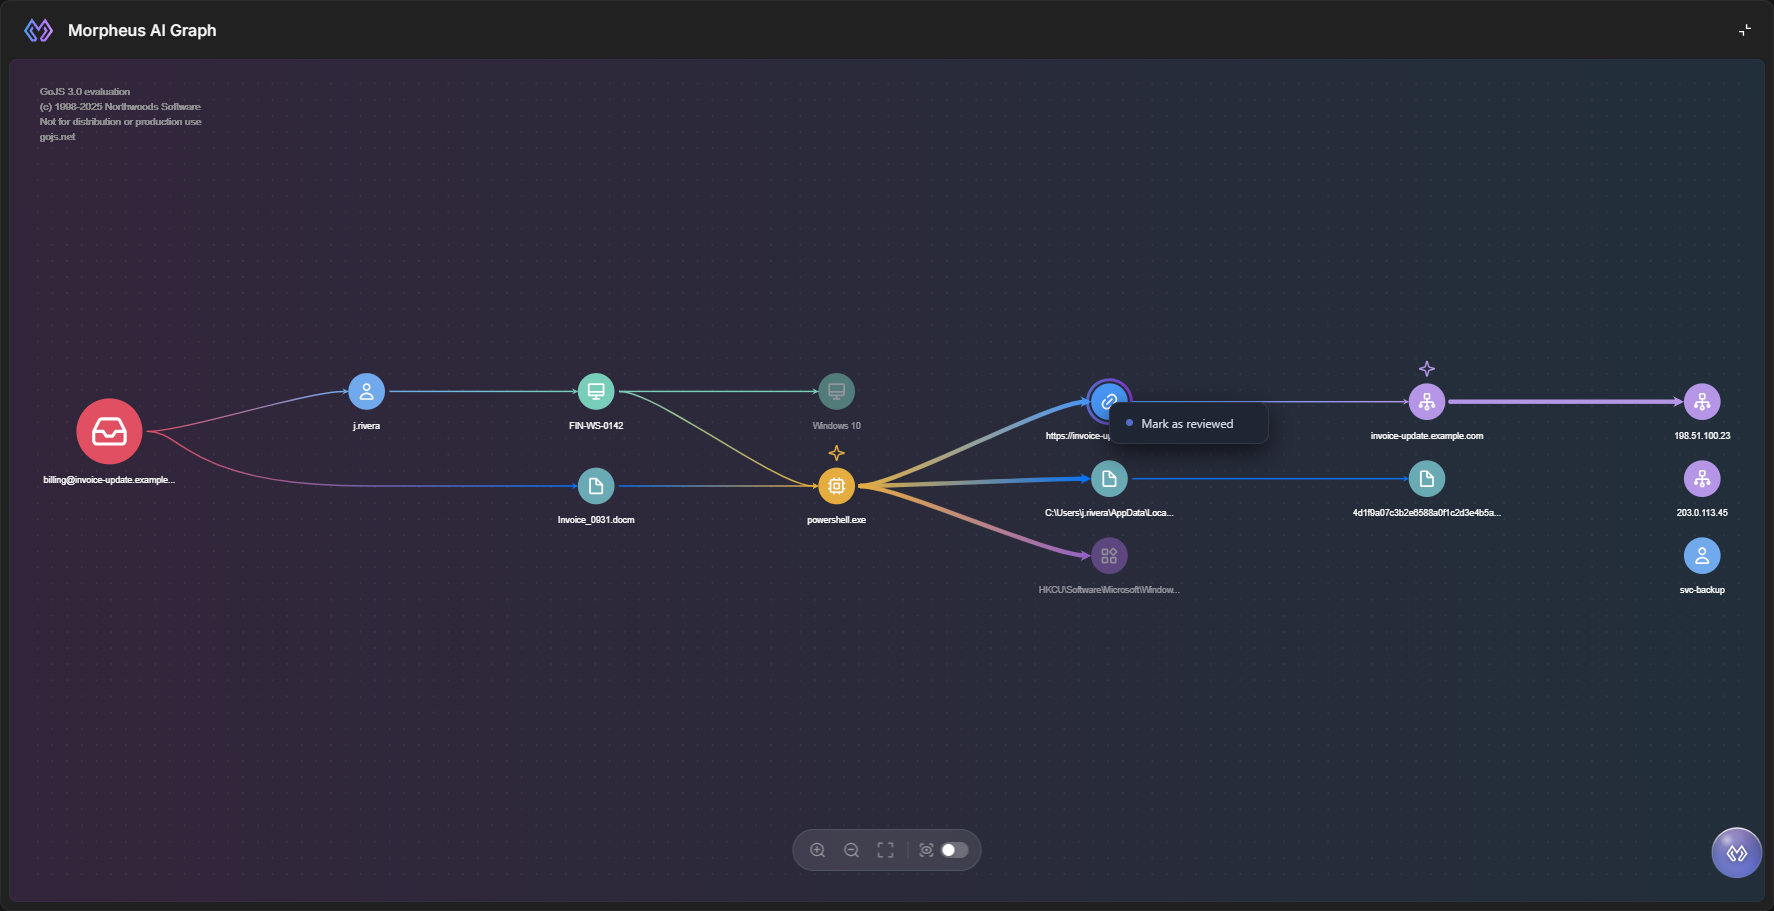
Right-click the node.
-
Select Mark as reviewed.
RESULT
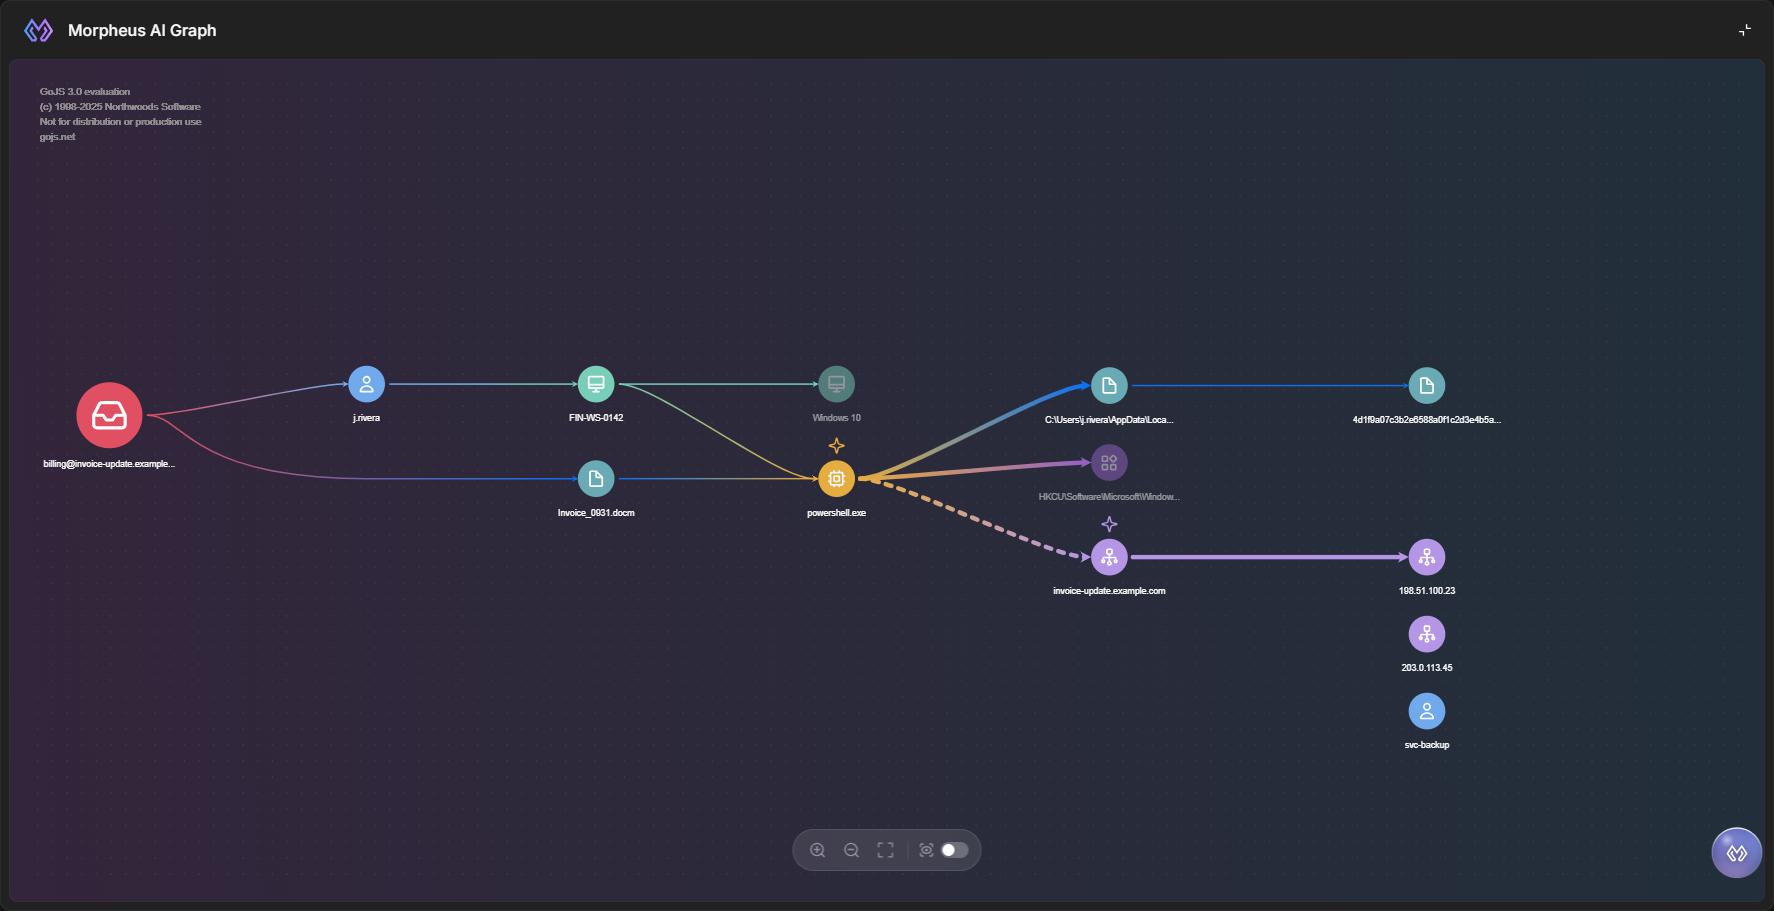
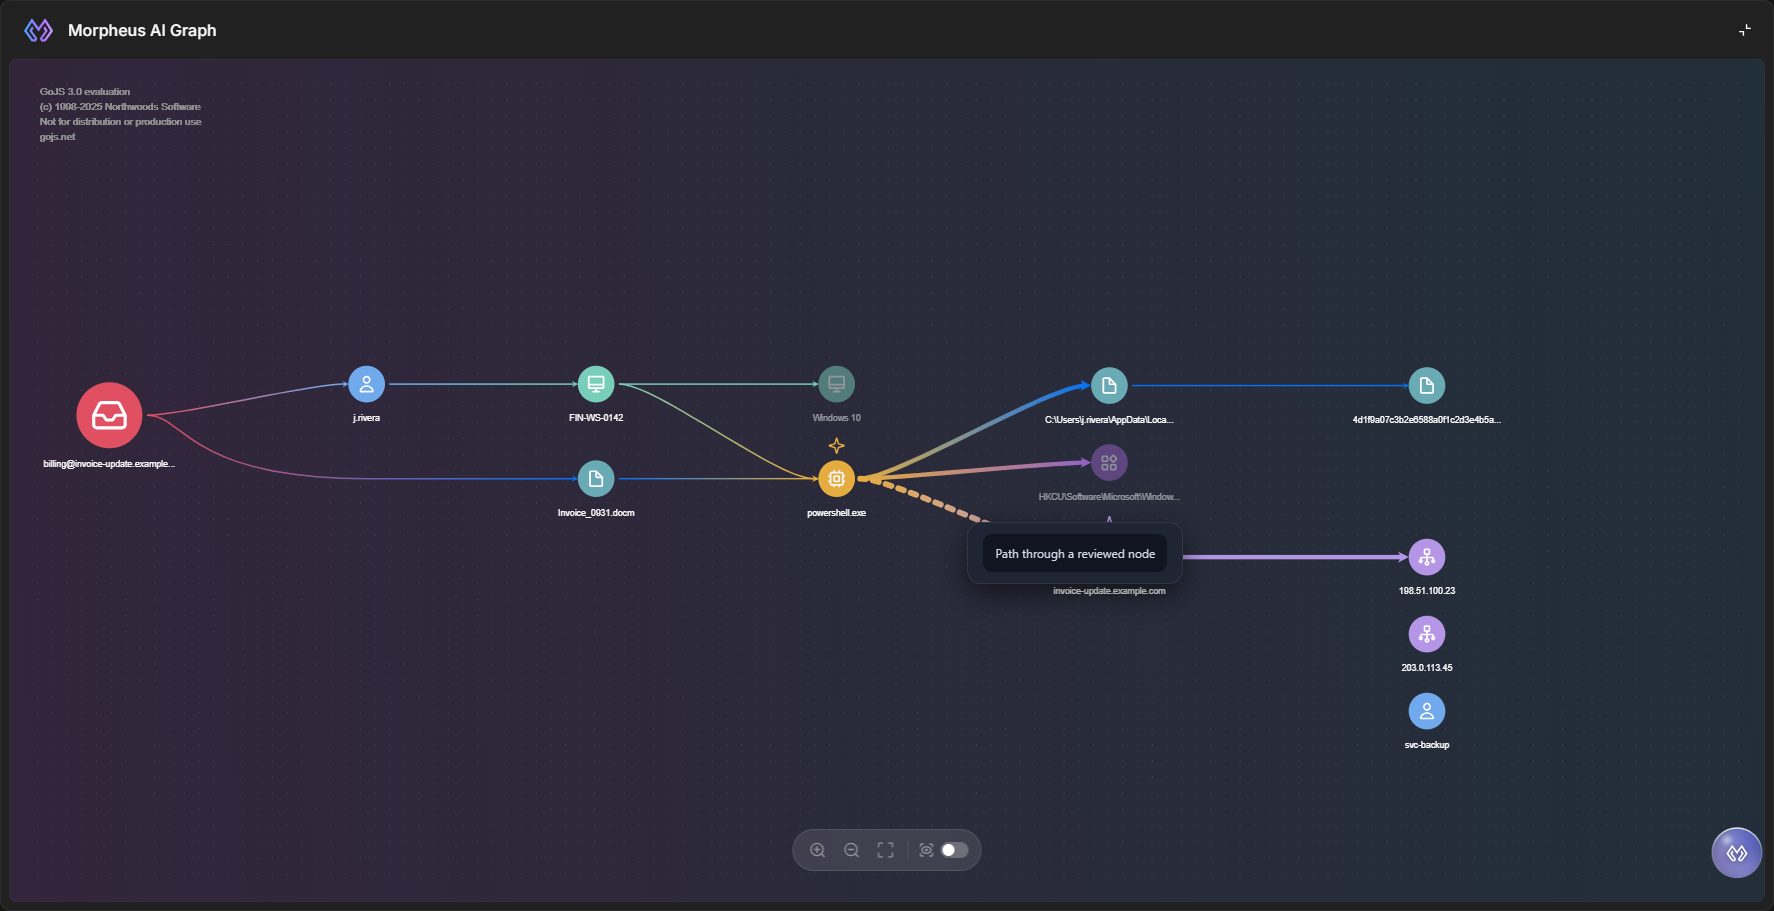
The node disappears from the graph. Where a path ran through it, a dotted arrow now joins its neighbors directly, so the path stays readable. Hover over the dotted arrow to see Path through a reviewed node.
If the reviewed node was at the start or end of a path, no dotted arrow replaces it, so its neighbor can be left with no arrows in the right-hand column; turn on Show Reviewed to see the connection again.
READER NOTE
Reviewed marks belong to the incident, not to you. Everyone who opens the incident sees the same nodes hidden, and anyone who can edit the incident can unmark them.
Showing Reviewed Nodes
The Show Reviewed switch, at the right end of the graph toolbar, brings reviewed nodes back so you can see what was checked and by whom. Reviewed nodes return faded, and hovering over one shows REVIEWED BY with the reviewer's name and the date and time in UTC. Clicking a reviewed node still opens its Artifact Detail panel.
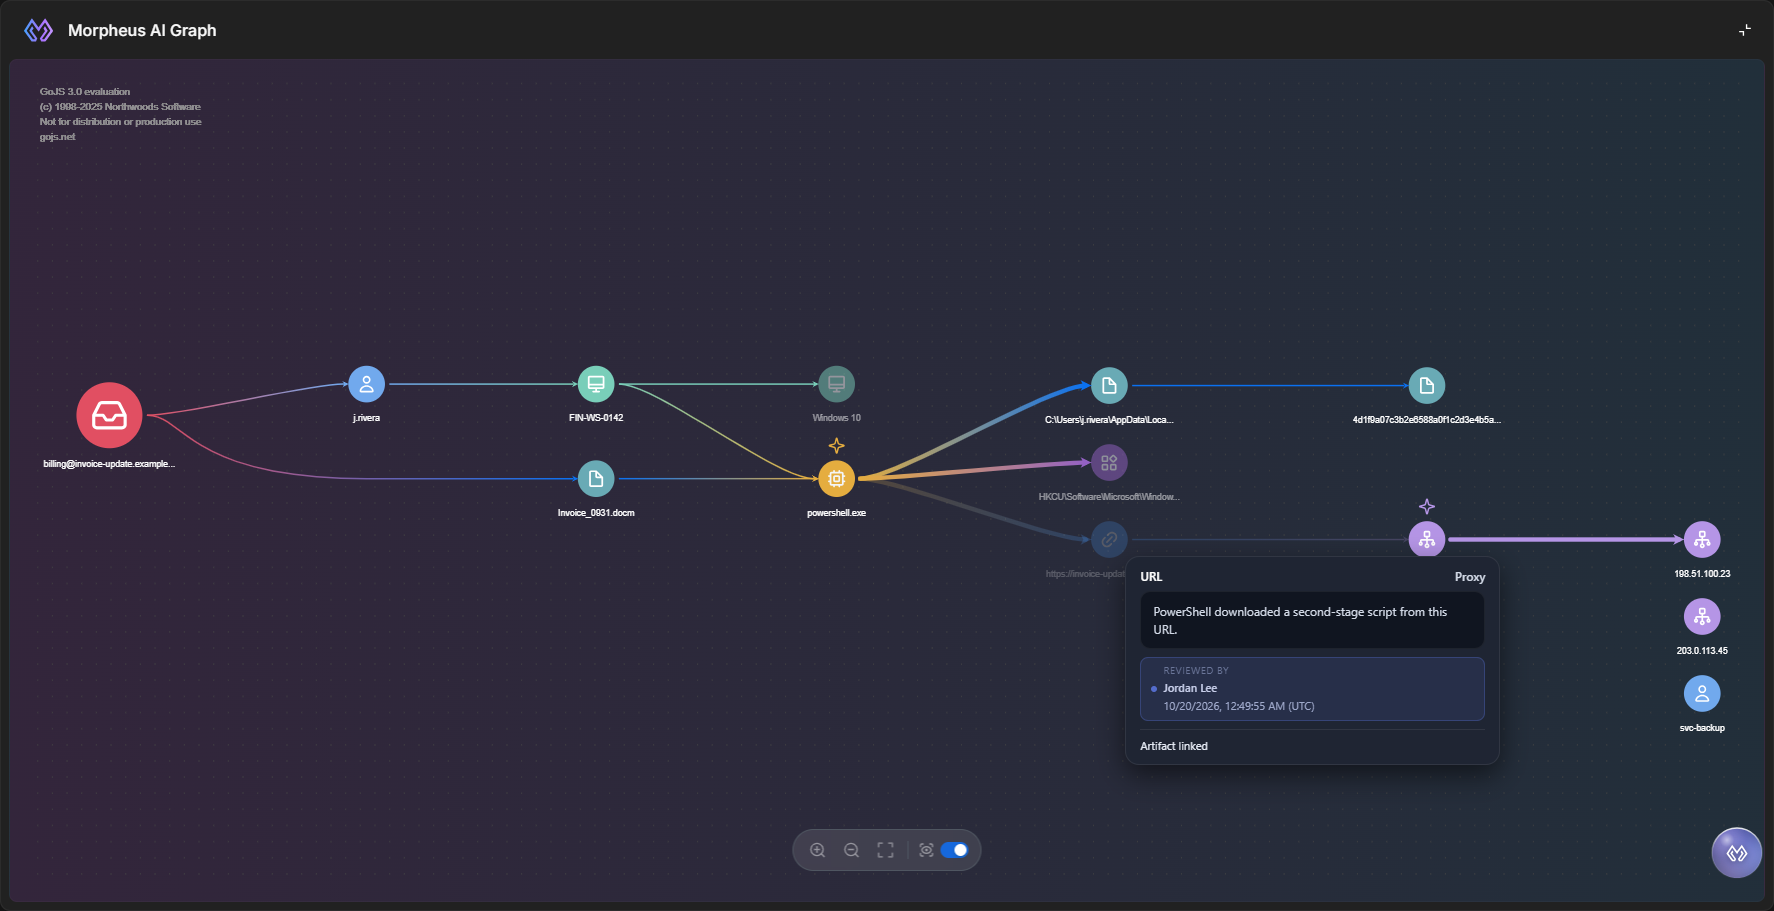
To undo a mark:
-
Turn on Show Reviewed.
-
Right-click the reviewed node, and select Unmark reviewed.
RESULT
The node returns to the graph for everyone who opens the incident.
Exporting the Graph as an Image
Exporting the graph saves it as a PNG image, so you can put the attack picture in a report, a ticket or a slide without taking a screenshot and cropping it. The image holds the whole graph, not only the part that fits in the card.
-
(Optional) Turn on Show Reviewed in the graph toolbar if the image should include nodes marked as reviewed. While it is off, reviewed nodes are left out of the image, as they are on screen.
-
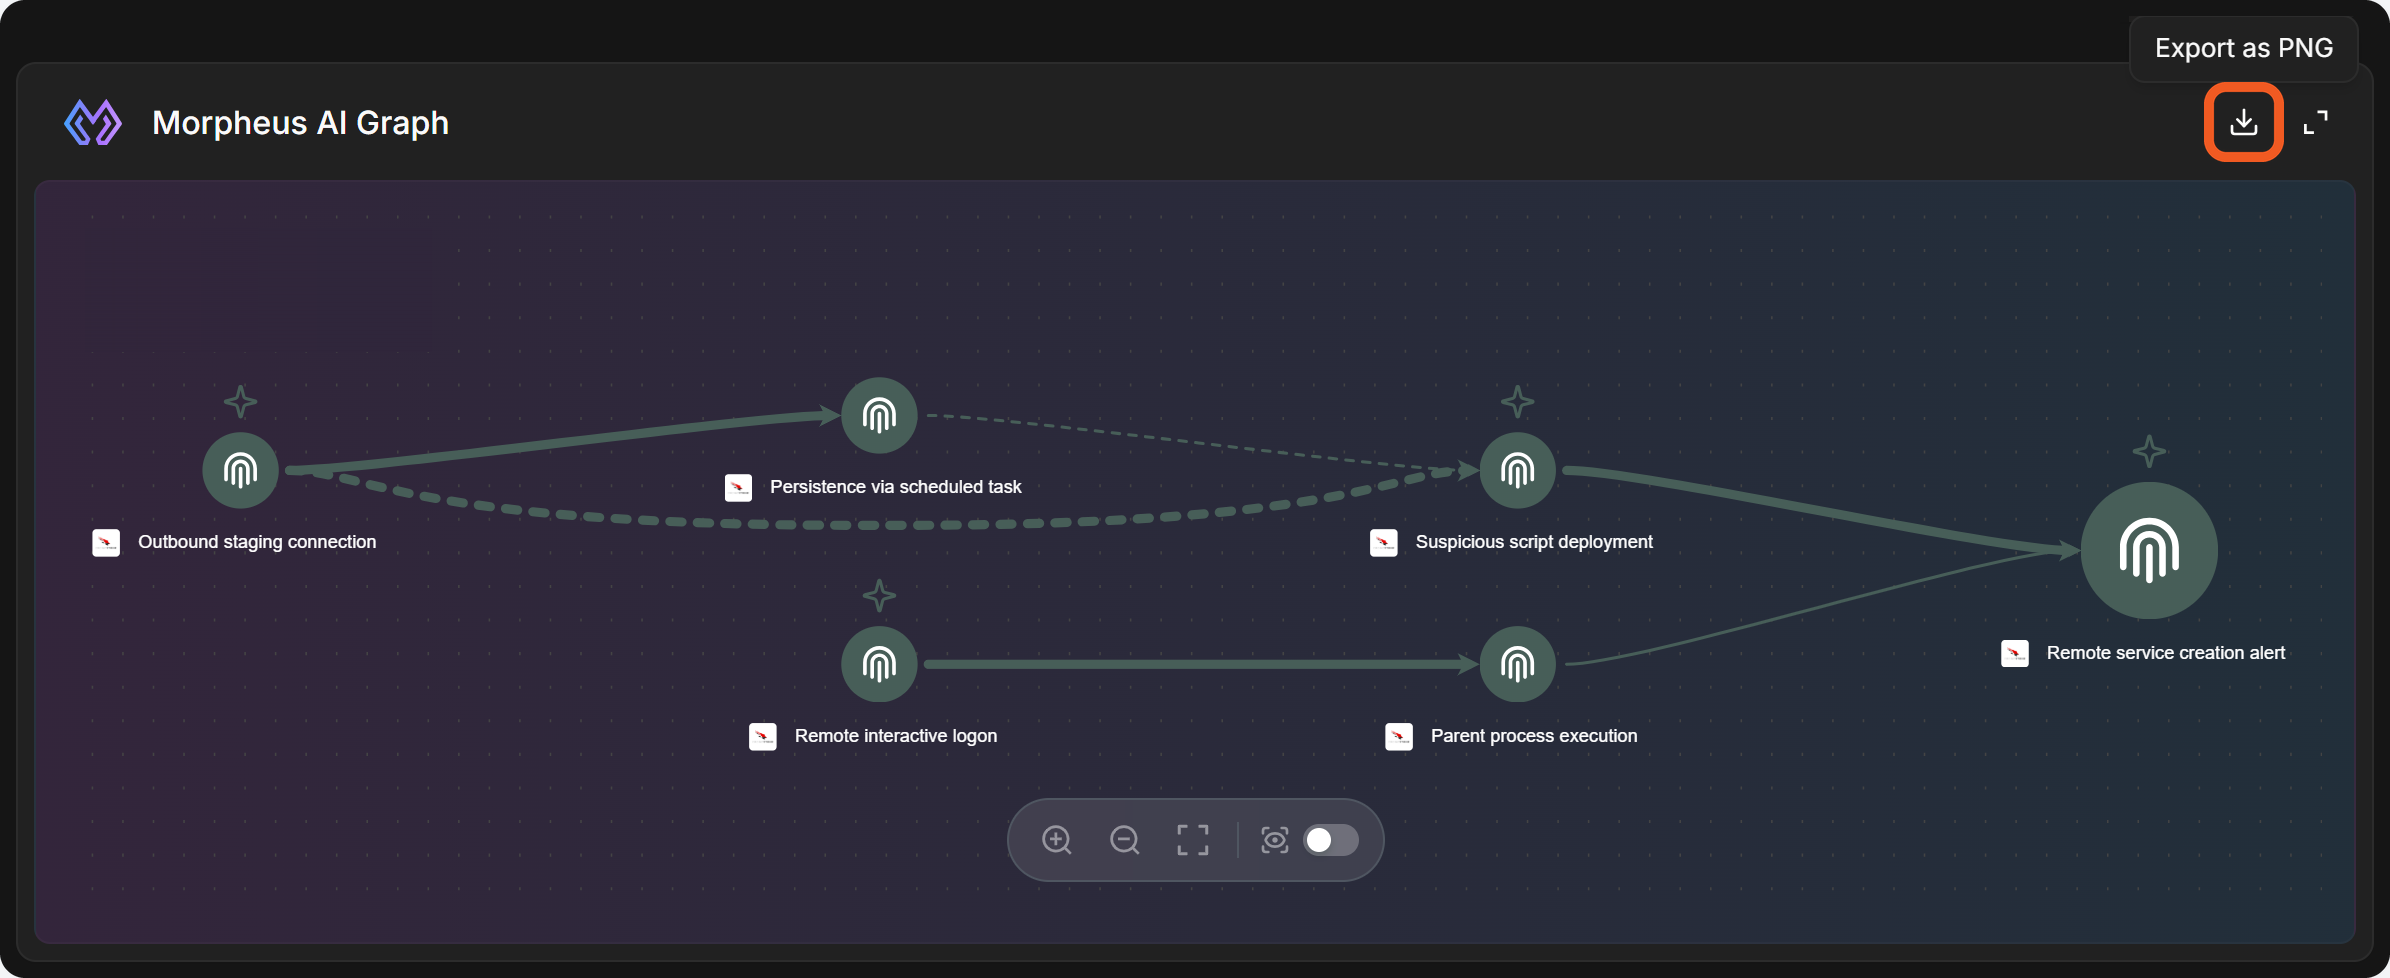
Select the download icon in the card header, just left of the expand control. Its tooltip reads Export as PNG.
The Export as PNG control
RESULT
Your browser downloads a PNG file named after the incident and the time of the export, for example morpheus-ai-graph-20261106-199-2026-11-10_1432.png: the incident number, then the date and the time (24-hour, hours and minutes) on your computer's clock.
The image shows:
-
Every node the graph currently draws, including any you would have to scroll or zoom to see. The zoom level does not matter. A very large graph is scaled down so it fits in one image; it is never cropped.
-
The card's background, in your current light or dark theme, so node names stay readable on the page you paste the image into.
-
Reviewed nodes at full strength, when Show Reviewed is on. On screen they are faded; in the image they are drawn like any other node. Nodes without an artifact record stay faded, as on screen.
The image leaves out what only makes sense on screen: the highlight on a node you clicked, the toolbar, tooltips, and the note across the top of a graph with no recorded connections.
READER NOTE
The download icon appears only when the card is drawing a graph. It is not shown while the graph is loading, while Morpheus AI is investigating, on a card that shows No threats found., or in the workspace builder's preview. If every node has been marked as reviewed and Show Reviewed is off, selecting it shows Nothing to export: no nodes are drawn. Reviewed nodes are only drawn while Show Reviewed is on.
Anyone who can see the graph can export it; you do not need to be able to edit the incident.
Empty and Loading States
The card always says why it has nothing to draw, so an empty card is never mistaken for a broken one.
|
Message |
What it means |
|---|---|
|
Loading . . . |
The graph is loading. |
|
Morpheus AI is investigating . . . |
An investigation is running on the incident. While it runs, the card checks every 20 seconds and draws the graph when it appears. If the investigation ends with nothing recorded, the card shows No threats found. |
|
No threats found. |
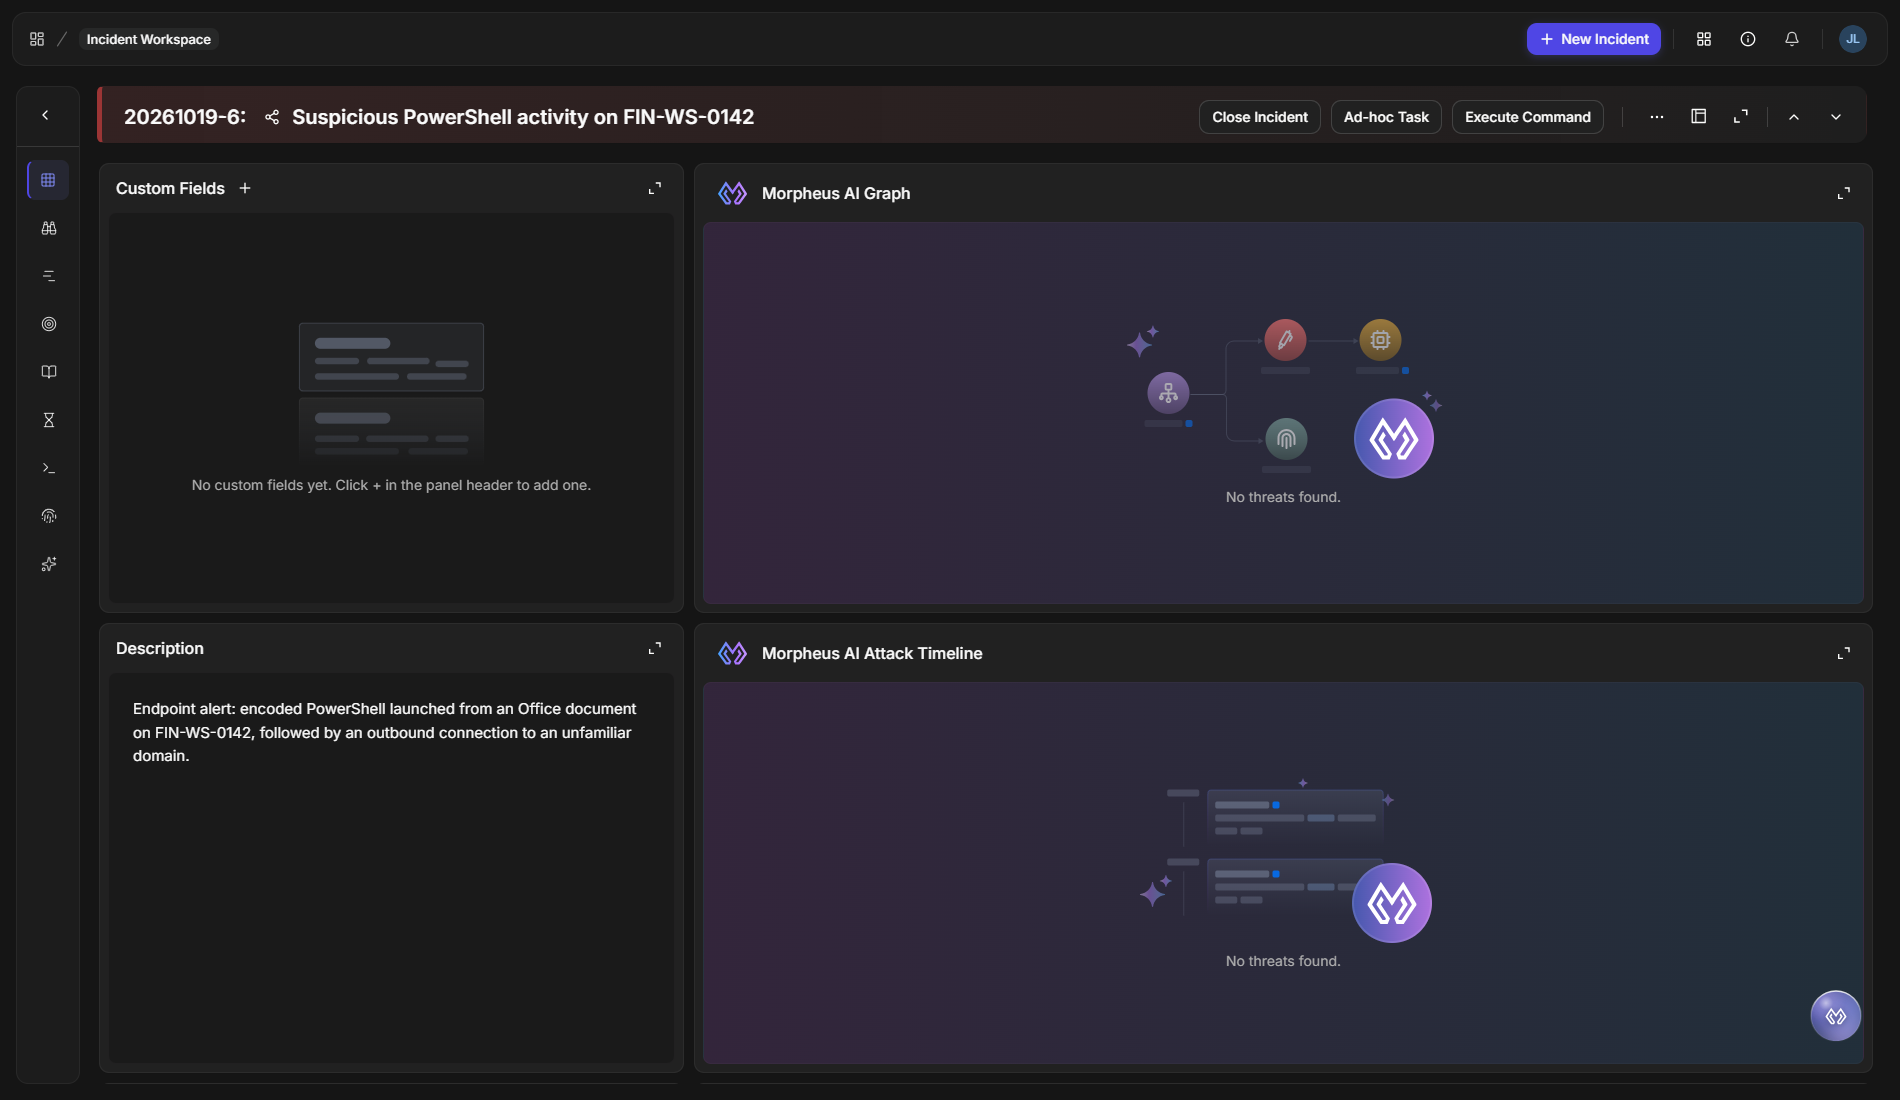
There is no graph for this incident—Morpheus has not recorded any entities for it. |
Availability
Each Morpheus widget is a card an administrator can place in an incident workspace, where it is listed under its own name — for example Morpheus AI Graph. Two things your administrator controls decide whether you see one: Morpheus AI incident widgets must be enabled on your D3 instance for the card to be added, and the card must be part of the workspace your incident uses.
Each incident type has its own workspaces. In the classic view, an administrator goes to Configuration > Incident Type Manager > incident type > Incident Workspace. The tab lists the type's workspaces, such as System Default, and New Workspace adds one. As the tab puts it, workspaces can be assigned "to specific groups, roles, or users."
Turning Morpheus AI incident widgets off removes the Morpheus widgets from the Widgets list in the workspace designer, so they can no longer be added to a workspace. It does not take a card out of a workspace that already has it: incidents that use that workspace keep showing it. To stop showing a card, your administrator removes it from the workspace.
To work an incident with Morpheus directly, see Morpheus Adaptive Tasking.
RELATED ARTICLES