
Last Updated: October 28, 2026
Overview
Attack Path Discovery (APD) has D3 Morpheus investigate an incoming alert the way an analyst would, and then decide what to do with it. APD reads the alert, queries your connected security tools on its own, reconstructs the attack path behind the alert, and records a disposition with the reasoning that produced it.
APD is a property of a data ingestion intake. Switch it on for an event intake, and the alerts that intake brings in are investigated as they arrive. As the setting puts it: "AI autonomously investigates alerts and reconstructs the attack path, replacing traditional Event Automation Rules."
What an APD run produces:
-
An investigation: the queries APD wrote and ran, the data sources it touched, and the attack path it reconstructed.
-
Graded evidence: findings marked CONFIRMED, INFERRED or GAP, so you can see what was proven, what was deduced, and what could not be established.
-
A disposition: dismiss, escalate, or neither when the evidence does not support a confident answer.
-
An incident, when the alert is escalated, carrying the narrative, the attack graph and the attack timeline. See AI Summary and APD Widgets.
APD takes over the investigation and disposition work that was previously scripted in a preprocessing playbook. Instead of building that logic as playbook tasks, you write it as plain-language rules. Triage stays deterministic: APD is meant for the alerts a person would actually work on, not for the raw alert volume ahead of them.
APD investigates and dispositions. It reads from your connected tools; it does not change anything in them, and it does not remediate.
How APD Differs from Preprocessing Playbooks and Event Automation Rules
|
|
What decides the outcome |
|---|---|
|
Preprocessing playbook |
Tasks you build and connect. The same steps run every time, in the order you set. |
|
Event automation rules |
Fixed conditions that dismiss or escalate an event. No investigation. |
|
Attack Path Discovery |
An investigation that Morpheus plans as it goes, then your plain-language dismiss and escalate rules applied to what it found. |
APD is not a playbook with AI in it. The investigation is generated for the alert in front of it and for the integrations you actually have, it is re-planned as findings come in, the queries are written for the question at hand rather than picked from a library, and a query that errors is corrected and retried. An empty result is treated as a question, not as an answer: APD reconsiders the field, the source and the time window before concluding that there is nothing there.
APD replaces an intake's event automation rules. If your dismissal or escalation logic lives in those rules, carry it into the APD dismiss and escalate rules.
Turning APD On for an Intake
APD is set on the intake, under Configuration > Data Ingestion. The page has an Event Intake and an Incident Intake tab; APD belongs to event intake.
To add a schedule with APD:
-
Select New > Schedule.
-
Fill in the Schedule Your Command window as usual: the INTEGRATION, the Connection, the Interval (Minutes) and the Ingestion Failure Process.
-
Expand Additional Settings. Alongside DATA FORMATTER, PREPROCESSING PLAYBOOK, Run MITRE TTP Search and Run Event Automation Rules, there is an Attack Path Discovery (APD) block.
-
Switch on Enable APD when this schedule is created.
-
Select Add Schedule.
The APD block
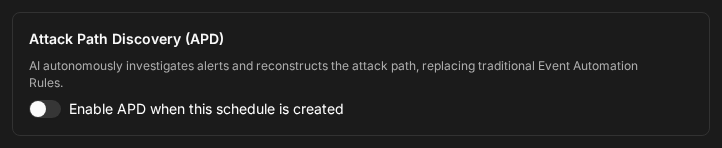
Leaving PREPROCESSING PLAYBOOK at (Not Set) gives an APD-only intake. Choosing a playbook runs that playbook first and APD after it.
To set up an intake with Morpheus instead, select the AI Ingest assistant at the bottom right of the Data Ingestion page. It opens with three starting points: New Webhook, New Schedule and Session History.
AI Ingest assistant

To create schedules for several sites at once, each with its own APD setting, see Multi-Site Data Ingestion Schedules.
Once an intake uses APD, its card in the data source list carries an AI Disposition Rules button. That is where the rules, the connections and the feedback are kept. A data source whose rules have unread feedback is marked on its row, for example "1 new AI disposition feedback note in this integration".
The Disposition Rules
Select AI Disposition Rules on an intake's card. The card has two tabs: Intake Setup, which is the intake's own configuration, and Disposition Rules.
The policy is versioned. The left rail shows the WORKING COPY, a draft that starts from the live version, and the PUBLISHED versions, with the current one marked. A published version is a read-only snapshot of what the pipeline ran under, which is what lets you see later which policy produced a given verdict.
A version has three sub-tabs: Rules, Feedback and Connections, and shows the thinking effort the investigation runs at.
AI Disposition Rules
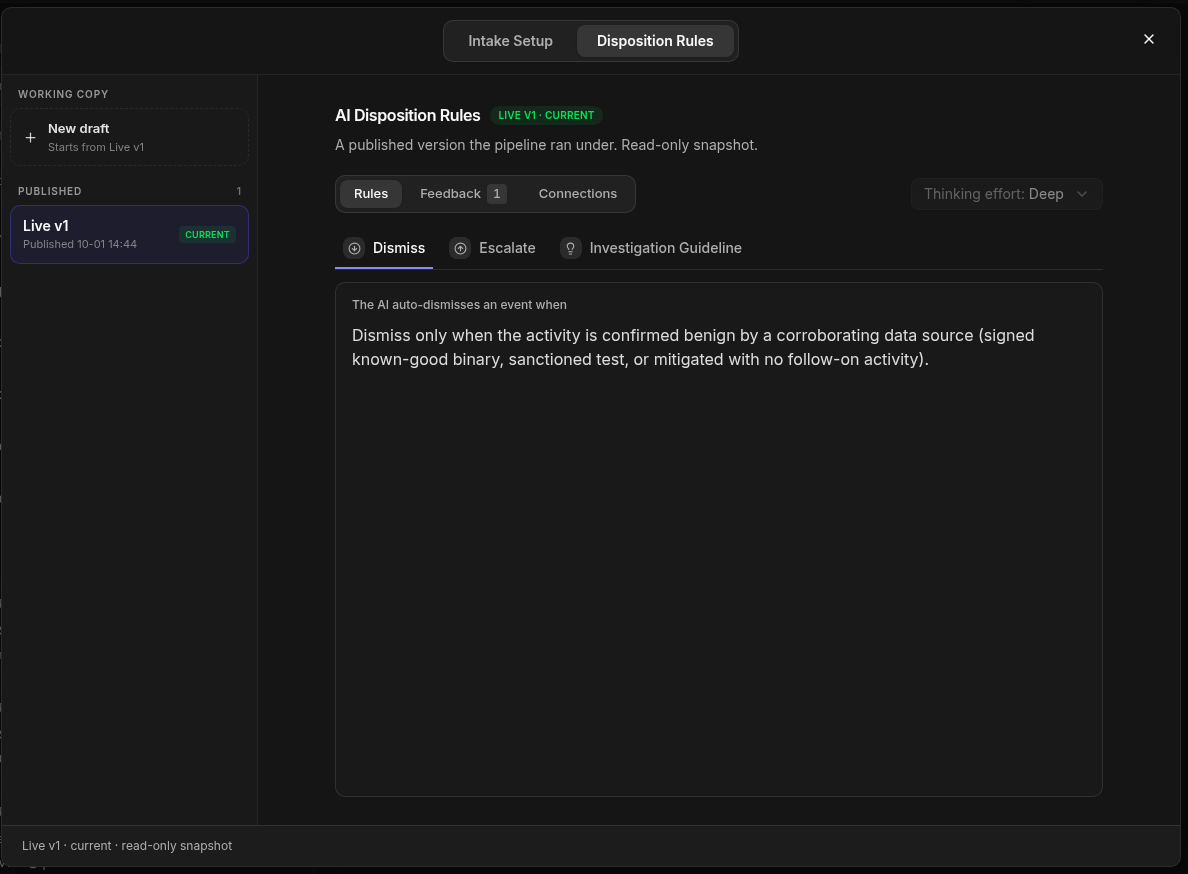
Rules
Rules holds the three parts of the policy, each one plain-language text rather than code.
|
Rule |
The page reads |
|---|---|
|
Dismiss |
"The AI auto-dismisses an event when …" |
|
Escalate |
"The AI escalates an event to an incident when …" |
|
Investigation Guideline |
"When investigating, the AI follows this guideline: …" |
Three things hold for every policy:
-
Escalate wins. Where the dismiss and escalate rules could both apply to the same alert, APD escalates. Keep the dismiss rule narrow.
-
A weak dismissal is not a dismissal. APD dismisses only when the benign conclusion is strongly supported and nothing material is left unresolved. When it is unsure, the alert goes to a person instead.
-
Absence is not benignity. An empty sweep, or one degraded by failed or truncated queries, is itself an open gap. Finding nothing never satisfies a dismiss rule.
Writing the Investigation Guideline
The investigation guideline is where you tell APD what it cannot work out for itself: facts about your environment, what is already sanctioned, and what matters most to you. It shapes the investigation only; the verdict stays with the dismiss and escalate rules.
|
The guideline can set |
Sample clause |
|---|---|
|
What counts as related, and over what window |
"Correlate identities case-insensitively; our directory and EDR render |
|
Which source answers which question |
"Pull firewall and network logs from the SIEM, not from the firewall integration directly." |
|
What is known-benign in your environment |
"Scans from 10.20.0.5 are our authorized vulnerability scanner; treat that source's noise as expected." |
|
What to weight more heavily |
"Data exfiltration is our top concern. When it is plausible, prioritize proving or ruling it out." |
|
The evidence bar |
"An empty result is inconclusive, not proof that nothing happened." |
|
How far to go |
"Look back 7 days, which matches our typical dwell time." |
|
How thorough to be |
"Do the deep investigation; several rounds are required, and corroborate each finding from at least two sources." |
The guideline cannot:
-
Decide the verdict. That is the dismiss and escalate rules.
-
Add a tool APD does not have. It can only use the connections available to the intake; naming a source you have no connection for returns nothing.
-
Add a new subject to investigate. It steers the investigation of the alert's own entities.
-
Pin an exact query window. Give a relative look-back and let APD resolve the window.
The guideline text is reused as written in prompts and in reports. Never put a credential, key or password in it.
Writing the Dismiss Rule
The dismiss rule states an affirmative benign condition that the evidence can positively confirm. Auto-dismissal is silent, so write it narrowly. For example:
-
"Dismiss only when the activity is confirmed benign by a corroborating data source: a signed known-good binary, a sanctioned test, or activity that was mitigated with no follow-on activity."
-
"Dismiss confirmed test or simulation activity, such as EICAR or approved pen-test tooling, when the evidence shows no real impact."
Do not write a dismiss rule as the absence of something, such as "dismiss if nothing is found" or "dismiss low-severity alerts". Neither is affirmative proof that an alert is benign.
Writing the Escalate Rule
The escalate rule states what has to be true for APD to open an incident. APD runs the investigation first and then judges the findings against the rule, so an escalate rule never shortens the investigation. For example:
-
"Escalate when credential dumping, lateral movement, or an un-mitigated malicious verdict is observed."
-
"Escalate confirmed lateral movement: a remote logon followed by execution on the target host."
Set the bar where your operation needs it, from "confirmed malicious behaviour only" to "anything that could not be ruled out". Name the behaviour, the host type or the evidence you mean, and do not write an escalate rule that contradicts your dismiss rule.
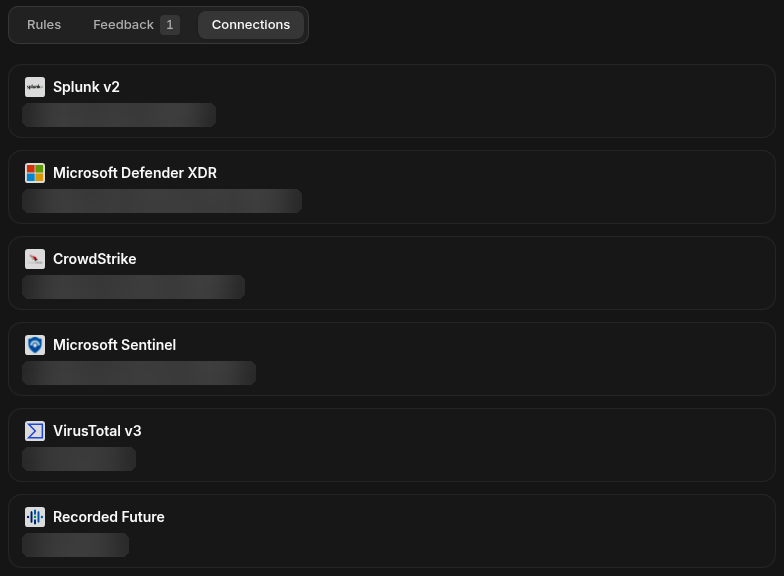
Connections
Connections controls which of your integrations APD may query for this intake. The tab lists each connection by integration and name, so a version records the exact data sources the investigation was allowed to use.
Connections
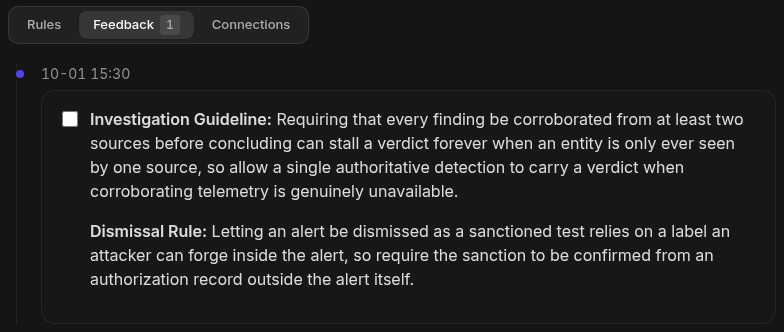
Feedback
Feedback collects what APD noticed about the policy itself once a published version has run on real alerts. Each note is dated and says which rule it concerns, for example that requiring every finding to be corroborated from two sources can stall a verdict when an entity is only ever seen by one source, or that a rule which dismisses an alert as a sanctioned test relies on a label an attacker can forge inside the alert.
Use the notes to find the rules worth tightening, change them in the working copy, and publish a new version.
Feedback
Reading the Result
On the Event
The Events list shows APD's progress in the Status column: an event reads Being Investigated while APD is working, and Escalated once it has escalated.
Correlated Events
An event's APD report includes a Correlated Events section: the events in your connected tools that share something with the alert, such as a file hash, a host, an IP address, a user or a process. APD finds them with its own queries during the investigation; it is the answer to "what else happened that is tied to this alert". To see it, open the event from the Events list and select the APD Investigation tab.
The section opens with a one-line summary of what was found, then a table.
Correlated Events
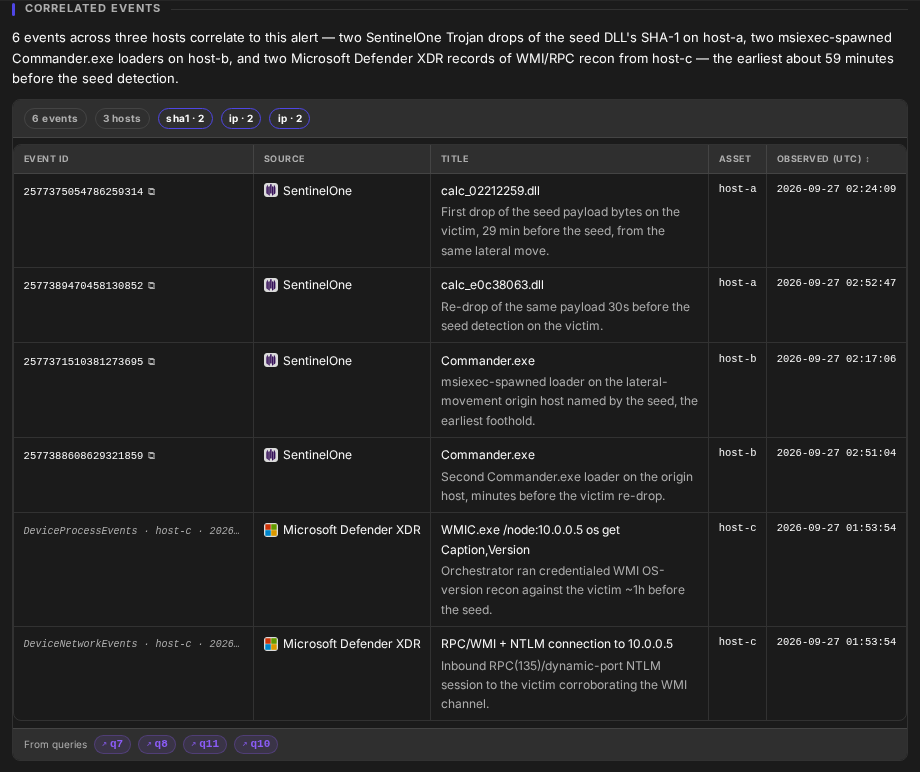
Above the table, chips give the totals: the number of events, the number of hosts, and one chip per entity the events were matched on, with how many events matched it (for example sha1 · 2). Hover a match chip to see the value.
|
Column |
What it shows |
|---|---|
|
Event ID |
The tool's own ID for the event, with a copy button so you can look the event up in that tool. A source that has no per-event ID shows a description of where the record came from instead, in italics. |
|
Source |
The integration the event came from. |
|
Title |
The event's title, with APD's note on why it relates to the alert underneath. |
|
Asset |
The host the event was seen on. |
|
Observed (UTC) |
When the event happened, in UTC. Select the column heading to sort by time. |
From queries, under the table, lists the APD queries the events were found by. Hover one to see the query; select it to jump to that query in the report.
The table shows the first 20 events; select Show all to see the rest. When a query matched more events than it returned, a note under the table says how many were shown out of how many matched. When nothing related was found, the section reads "No correlated events were found for this alert."
On the Incident
When APD escalates, it opens an incident. The Incidents list marks AI-investigated incidents in its Investigated by AI column and carries the priority score in its IRPS column.
The investigation itself is carried into the incident workspace as the Morpheus widgets: the AI summary, the APD narrative, the attack timeline and the attack graph. See AI Summary and APD Widgets.
Common Issues
-
Event automation rules stopped firing. APD replaces them for the intake it is enabled on.
-
APD and Morpheus Adaptive Tasking are different features. Adaptive Tasking is the analyst-driven entry point to Morpheus on an incident; APD runs by itself on an incoming alert. See Morpheus Adaptive Tasking.
-
A rule change has no effect. The working copy is a draft. Publish it, and check which version the intake is running.