
Last updated: November 10, 2026
Overview
The Morpheus AI Investigation widget shows, inside an incident, the full Attack Path Discovery (APD) report for the events behind that incident: what Morpheus concluded, the findings it reached, the searches it ran to reach them, and what it could not see. You can check the reasoning behind an AI investigation, and decide what to do next, without leaving the incident to open each event.
The Morpheus AI Investigation widget
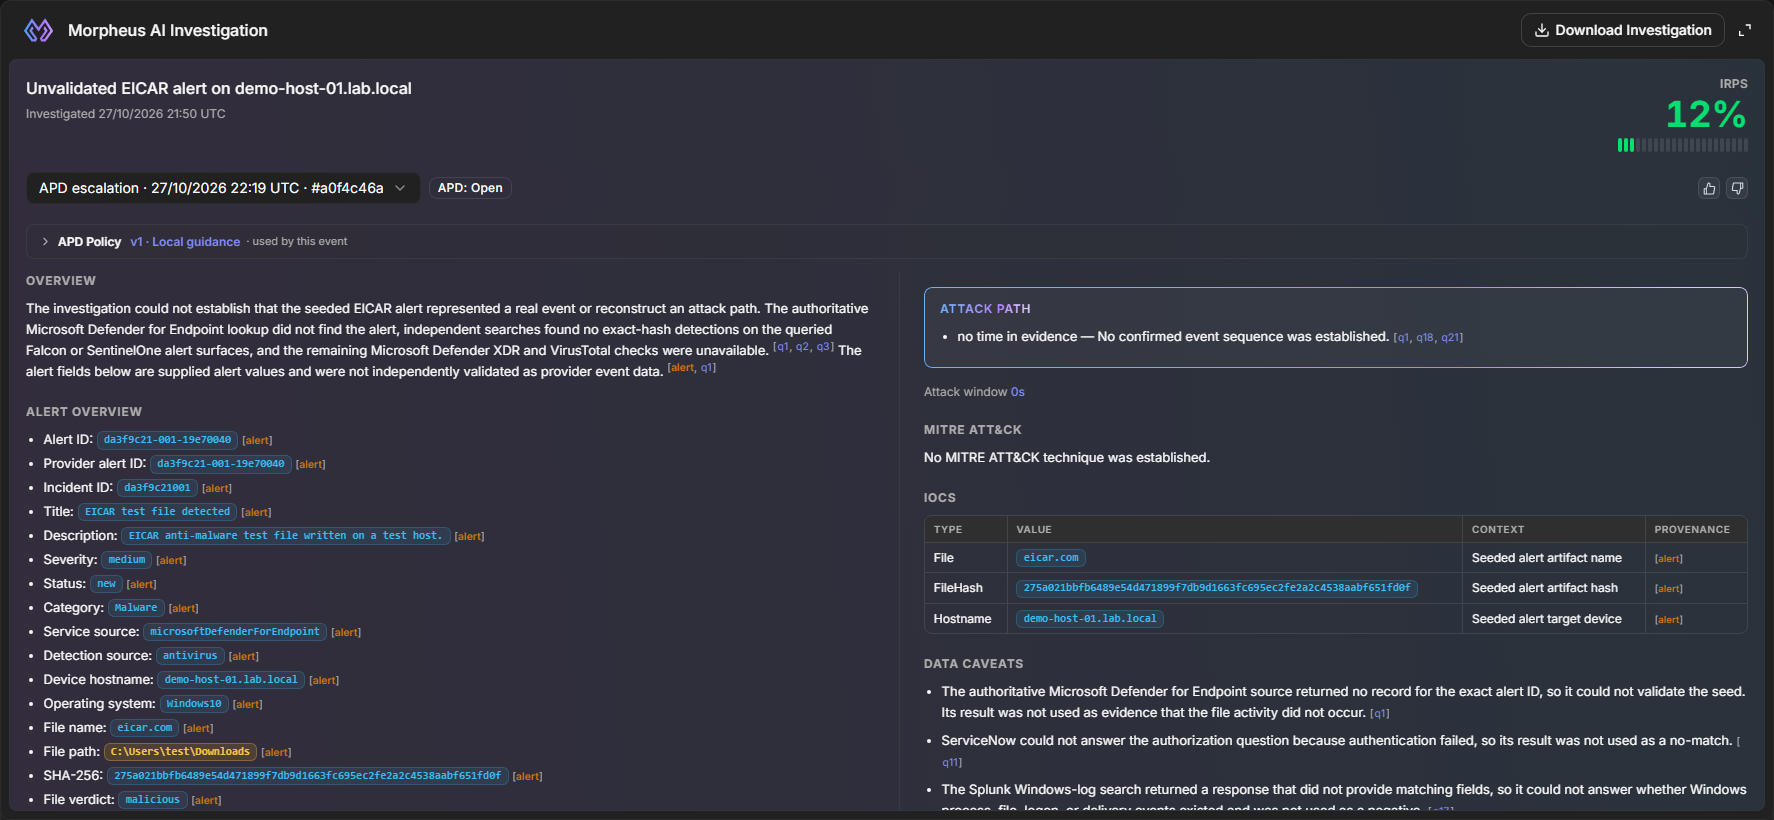
The widget opens on the event whose APD investigation created the incident. When APD investigated more than one of the incident's events, a picker at the top of the report switches between them. It is available in the new UI's incident workspace and on the classic incident page.
READER NOTE
The widget appears in an incident only after an administrator adds it to the incident workspace that the incident's type uses. If you do not see it, ask your administrator.
In short
|
# |
Stage |
Where it happens |
|---|---|---|
|
1 |
Add the widget to a workspace (administrators) |
Configuration > Incident Type Manager > an incident type > Incident Workspace |
|
2 |
Choose which report sections it shows (administrators) |
The gear (Visibility settings) on the widget's tile in the workspace builder |
|
3 |
Open the report |
The incident's workspace, Morpheus AI Investigation |
|
4 |
Switch to another investigated event |
The source picker at the top of the report |
|
5 |
Check a finding against its evidence |
A finding's citation, such as [q1], and the Investigation section |
|
6 |
Keep a copy of the investigation |
Download Investigation in the widget's title bar |
Adding the Widget to a Workspace
Add the widget to the incident workspaces your analysts use for incidents that APD investigates, so the report is in front of them when they open the incident. The widget is not added to existing workspaces on its own.
READER NOTE
Morpheus AI Investigation appears in the workspace builder's widget list only where Morpheus AI incident widgets are turned on for your deployment, which is the default. If it, Morpheus AI Summary and Morpheus AI Attack Timeline are all missing from the list, contact D3 Support.
-
Navigate to Configuration > Incident Type Manager.
-
Select an incident type, then select the Incident Workspace tab.
-
Open an existing workspace, or select New Workspace.
-
Drag Morpheus AI Investigation from the Widgets list on the right into the workspace layout. To find it quickly, type its name into the search box above the list. The tile shows a sample report, so you can judge its size and position.
-
(Optional) Select the gear on the tile (Visibility settings) to choose which report sections the widget shows. See Choosing the Sections.
-
Select Save.
Adding the widget and choosing its sections
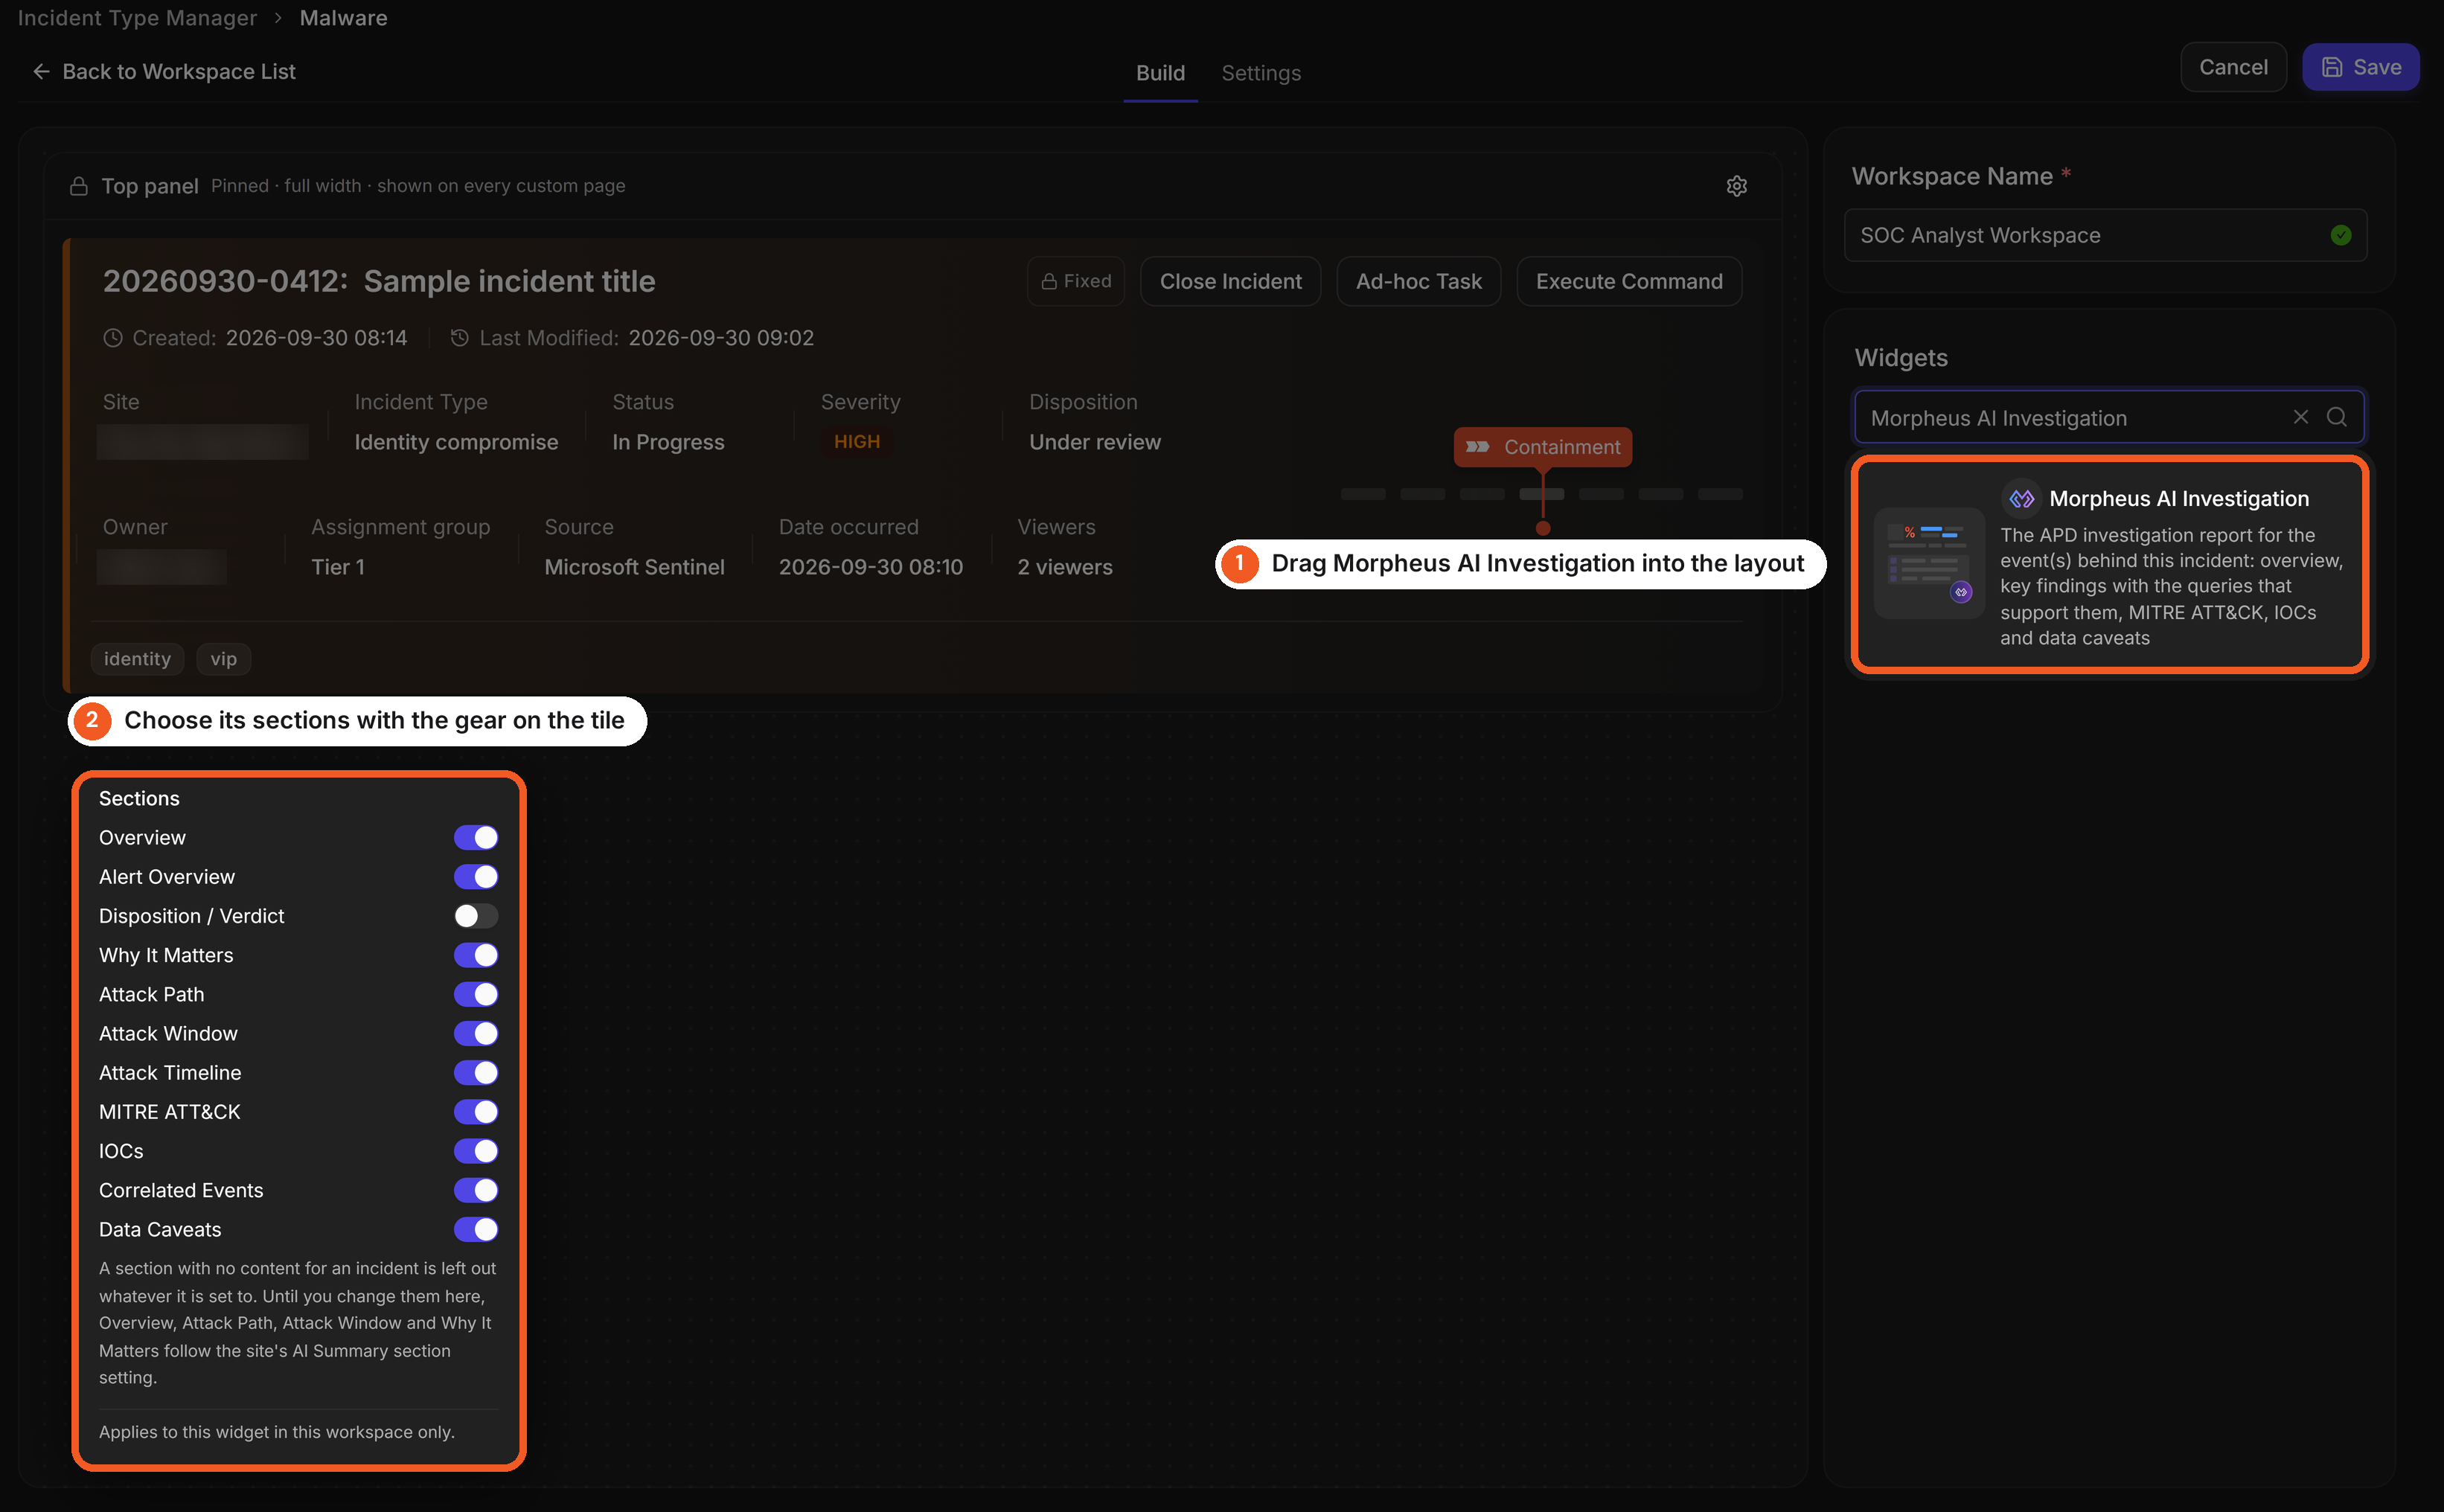
Adding the widget, step by step
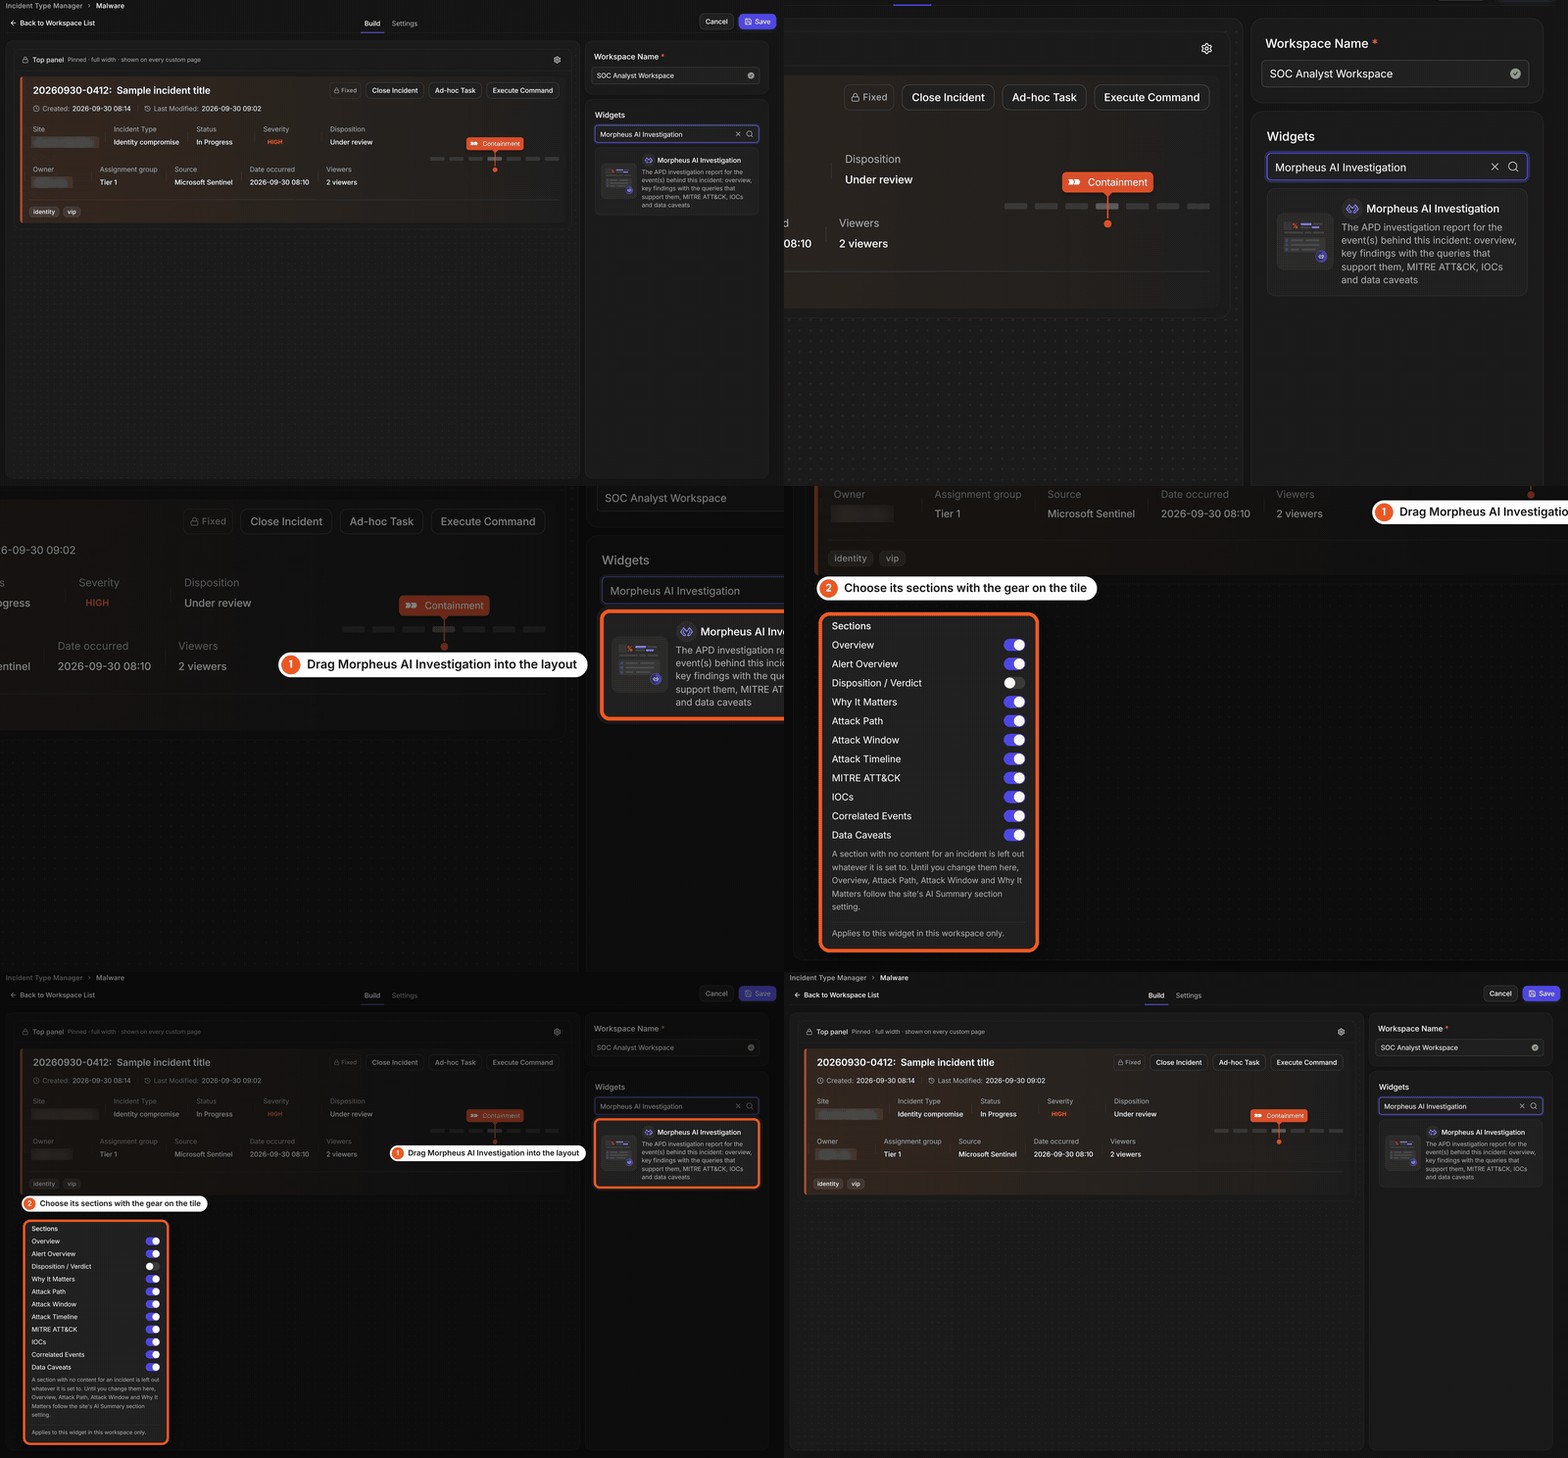
RESULT
Incidents whose type uses this workspace show the Morpheus AI Investigation widget for everyone the workspace is assigned to.
Who sees a workspace is set by its assignment to groups, roles or users, as for any incident workspace. The Morpheus AI Summary and Morpheus AI Attack Timeline widgets stay available, so you can place them beside this one or use this widget on its own.
Choosing the Sections
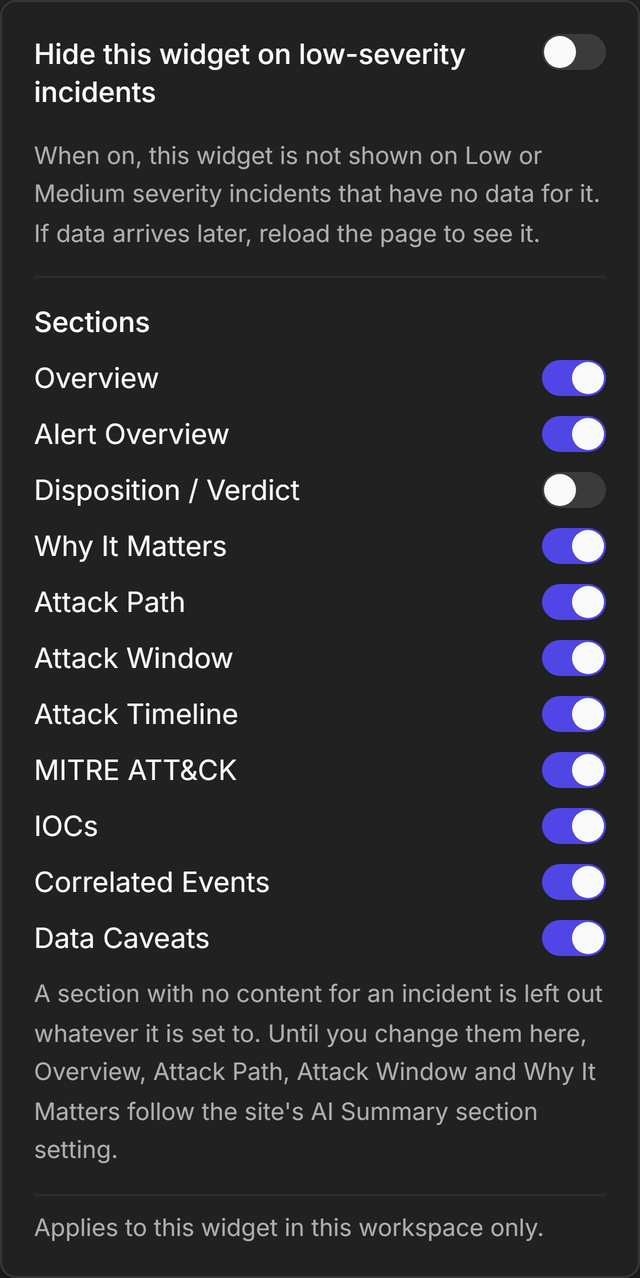
The section switches let you fit the report to how your team works: an analyst who only needs the conclusions and the evidence can skip the sections they never read. You set them once, on the widget's tile in the workspace builder, and they apply to everyone the workspace is assigned to, in both the new UI and the classic view. Analysts do not change them from the incident.
The widget's visibility settings
|
Section |
What it shows |
Starts |
|---|---|---|
|
Overview |
What the investigation concluded, in a few sentences |
Shown |
|
Alert Overview |
The alert's fields as APD received them, each marked with where it came from |
Shown |
|
Disposition / Verdict |
APD's verdict on the event and its reasons |
Hidden |
|
Key Findings |
The numbered findings, each with a severity and the searches that support it |
Always shown |
|
Why It Matters |
Why the findings matter for this incident |
Shown |
|
Attack Path |
The attack's steps, in order, as far as the evidence shows them |
Shown |
|
Attack Window |
How long the attack activity lasted |
Shown |
|
Attack Timeline |
The attack activity in time order, with filters for device and data source |
Shown |
|
MITRE ATT&CK |
The techniques the investigation established |
Shown |
|
IOCs |
The indicators of compromise it found, with their context |
Shown |
|
Correlated Events |
Other events the investigation tied to this one |
Shown |
|
Data Caveats |
What the investigation could not see or confirm |
Shown |
|
Investigation |
Every search it ran, with what each one found |
Always shown |
Disposition / Verdict starts hidden because the incident itself is the outcome of the verdict; switch it on if your analysts want APD's reasoning for it in the widget. Key Findings and Investigation cannot be hidden, because every citation in the report points to them.
A section with no content for an incident is left out, whatever its switch says. Until you change them, Overview, Attack Path, Attack Window and Why It Matters follow your site's AI Summary section setting, which D3 Support manages.
READER NOTE
The switches only change what the widget shows. Download Investigation still gives the full report, hidden sections included.
The same popover has a switch, Hide this widget on low-severity incidents, that keeps the tile out of the way on low-priority incidents. When it is on, the widget is not shown on Low or Medium severity incidents that have no data for it; if data arrives later, reload the page to see it. For this widget, "no data" means the incident has no investigated event, no AI Summary and no AI Timeline entries.
Reading the Report
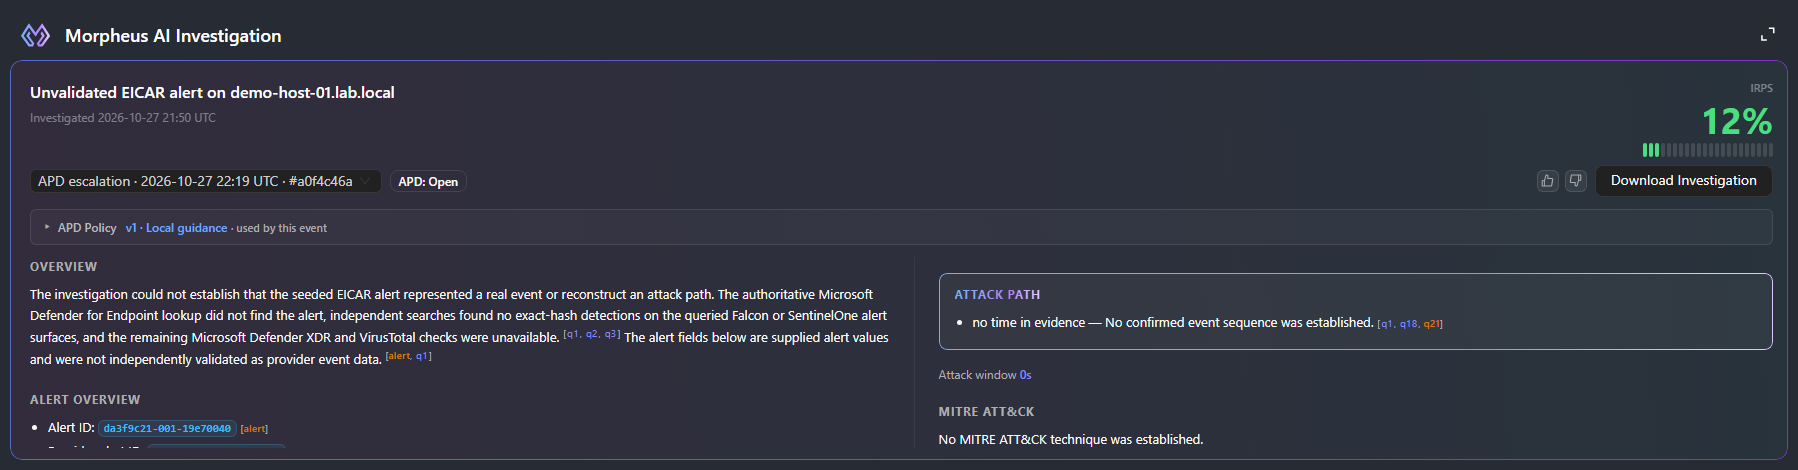
The report is APD's investigation of one event, laid out so you can move from the conclusion to the evidence behind it. Times in the widget are shown in UTC and labelled so.
The top of the report shows:
-
The report title and investigation time: what APD concluded the event was, and when it investigated it (Investigated … UTC).
-
IRPS: the investigation's risk score, as a percentage. Hover over it to see how the score was made up.
-
Badges: the residual risk, when the run gives one, and APD's verdict for a Dismiss or Open verdict, such as APD: Open. An escalated event has no verdict badge, because the incident is its result.
-
APD Policy: the policy version and guidance that steered this investigation. Expand it to read the guidance.
-
Feedback: the thumbs-up and thumbs-down buttons (Share your feedback) rate the report. Each search in the Investigation section has its own pair.
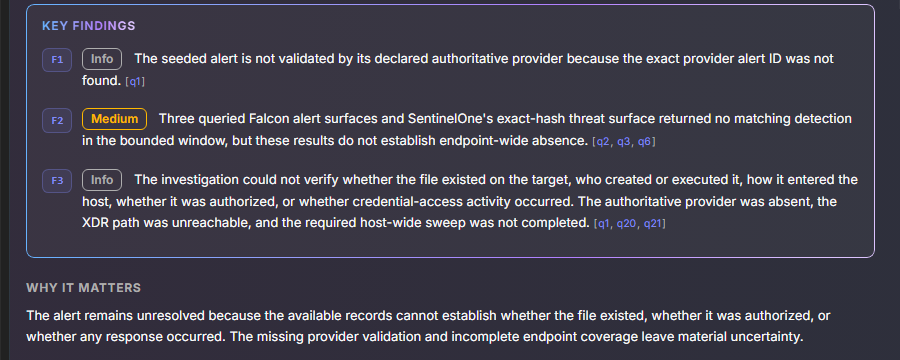
Key Findings lists what the investigation established, numbered and tagged by severity. The citations after each finding, such as [q1, q3], name the searches that support it. Select a citation to see the search, what it found and what that means, so you can judge a finding by its evidence instead of taking it on trust.
Key findings and why they matter
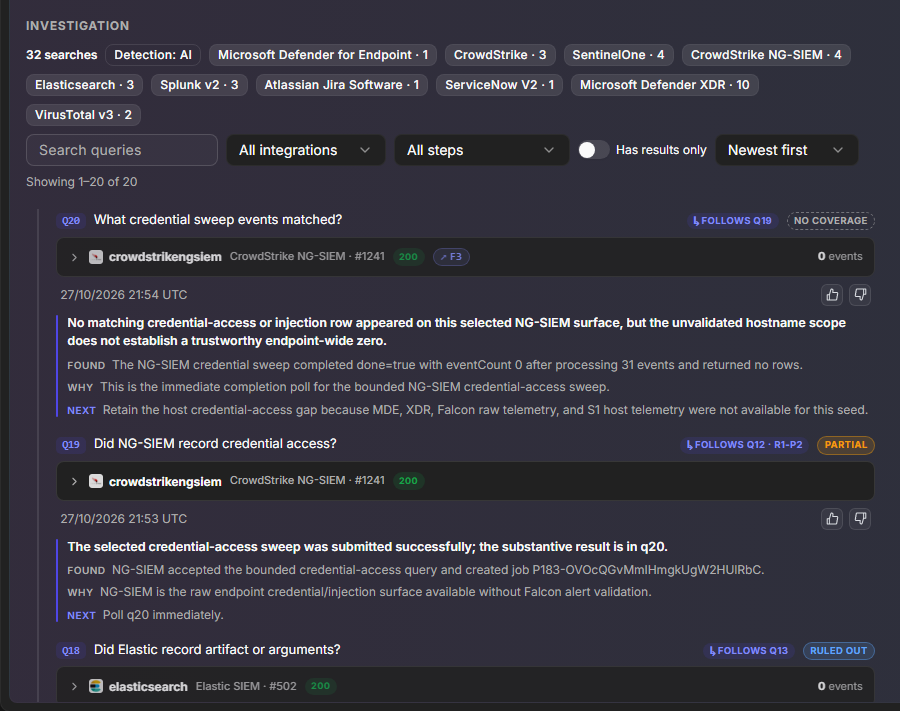
Investigation is the record of every search Morpheus ran: how many searches, how many per integration, and a card for each one with the question it asked, the integration it used, the result, and what Morpheus concluded (FOUND, WHY and NEXT). Search the cards, filter them by integration or step, show only searches that returned results with Has results only, or switch between newest and oldest first. A card's status, such as NO COVERAGE, PARTIAL or RULED OUT, tells you at a glance what the search could and could not settle.
The investigation log
Data Caveats is worth reading before you act on a conclusion: it names what the investigation could not see—an integration that did not answer, a log source with no coverage—so you know where to look yourself.
Choosing the Event
An incident can hold several events that APD investigated: the event whose investigation created the incident, and events linked to it later. The source picker at the top of the report chooses which one's report you are reading.
The source picker
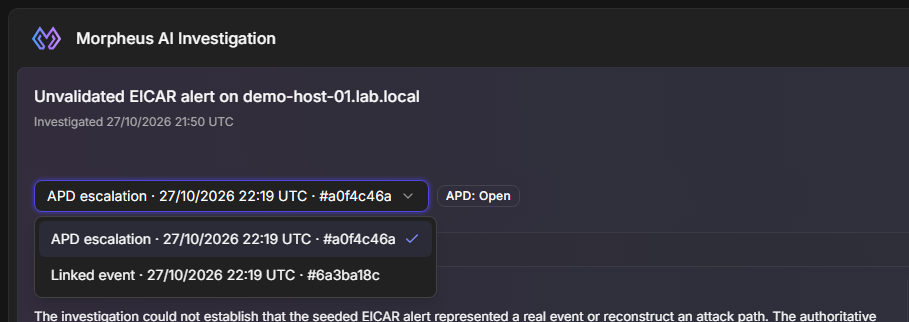
Each entry reads APD escalation (the event whose investigation created the incident) or Linked event, followed by the time the event joined the incident, in UTC, and the start of the event's ID. The picker appears only when there is more than one event to choose from.
-
Which event opens first: the APD escalation event. If APD did not create the incident, the most recently linked event that APD investigated opens instead.
-
Which events are listed: only events that APD investigated, and only events on sites you have access to.
-
Which run you see: the latest investigation of each event. Earlier runs of the same event are not listed.
-
When the list changes: an investigated event linked or merged into the incident joins the list without a page reload. The event you picked stays selected; if you have not picked one, a newly linked event becomes the one shown, unless APD created the incident.
While an Investigation Is Running
When APD is still investigating the selected event, the report shows an Investigation in progress badge. If the event was investigated before, you keep reading the previous report until the new one is ready, and the widget then updates on its own. For a first investigation, the widget shows Report not available yet.
When There Is No Investigation
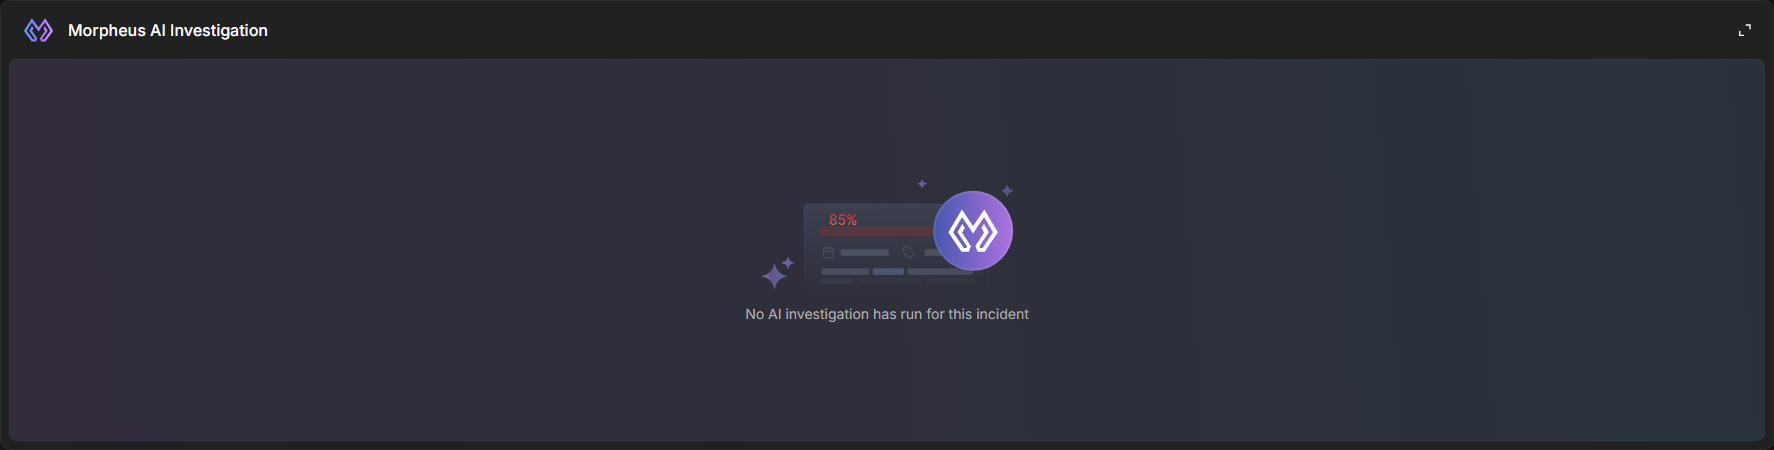
When APD investigated none of the incident's events, the widget shows what Morpheus does have for the incident instead of an empty tile: the incident's AI Summary with its AI Timeline under it, or the AI Timeline on its own. When the incident has neither, the widget says so.
No investigation to show
When the incident has investigated events but the selected event's report is not available—for example, because its investigation did not finish—the widget shows Report not available., with the AI Timeline under it when there is one.
Downloading the Investigation
Download Investigation saves the investigation of the selected event as a ZIP file, so you can attach it to a ticket, hand it to a colleague or keep it with your case notes. It is the same file the event's own APD report offers: Morpheus's notes from each round of the investigation, its summaries, and the final summary, as Markdown files. The download always holds the full report, whatever sections the widget hides.
Download Investigation is not available while the widget shows the AI Summary or AI Timeline instead of a report.
Expanding the Widget
A full report is long. Select the expand control at the right of the widget's title bar, or double-click the title bar, to enlarge the widget in place and read the report in a wider layout. The selected event and the section choices stay as they were.
The Widget in the Classic View
The widget works the same way on the classic incident page: the same report, source picker, live updates, sections and Download Investigation, with times in UTC.
The widget in the classic view
Who Can Do What
|
Task |
Who |
|---|---|
|
Add the widget to a workspace, remove it, or change its sections |
Anyone who can edit incident workspaces in Incident Type Manager |
|
See the widget on an incident |
Anyone who can open the incident and to whom the incident's workspace is assigned. The widget needs no permission of its own. |
|
See an event's report |
Users with access to the event's site. Events on other sites are left out of the picker. |
|
Download the investigation |
Anyone who can see the report |
Users with client access see the full report except the APD Policy line.
The Widget and the Other Morpheus AI Widgets
The Morpheus AI Summary and Morpheus AI Attack Timeline widgets summarize the incident as a whole, from the APD investigation that last updated it. Morpheus AI Investigation shows the complete report of one event at a time, including the searches behind every finding, and lets you switch between the incident's investigated events. Use the summary for a quick read, and this widget when you need to check the evidence. The Morpheus AI Graph widget draws the same investigation as a map of the entities involved.
FAQs
Why is Morpheus AI Investigation missing from the widget list? Morpheus AI incident widgets are turned off for your deployment; Morpheus AI Summary and Morpheus AI Attack Timeline will be missing too. Contact D3 Support. Widgets already placed in a workspace keep working if the setting is later turned off; remove them from the workspace if you no longer want them.
Why is a linked event not in the source picker? APD did not investigate it, or it belongs to a site you do not have access to.
Can I see an earlier investigation of the same event? No. The widget shows the latest investigation of each event.
Does hiding a section remove it from the download? No. The switches change only what the widget shows.
Why is Disposition / Verdict not shown? It starts hidden, because the incident is already the result of the verdict. An administrator can switch it on in the workspace builder.