
17.0
New Features
My Dashboards
.png?inst-v=a6d380fe-ff29-4bbc-9b46-e2545b975c77)
The new My Dashboards feature on the investigation dashboard enables users to add dashboards configured in the Reporting Dashboard tab, allowing them to personalize their data visualization to focus on the metrics most critical to their operational needs.
Refer to My Dashboards for details.
Interaction Task Response Link
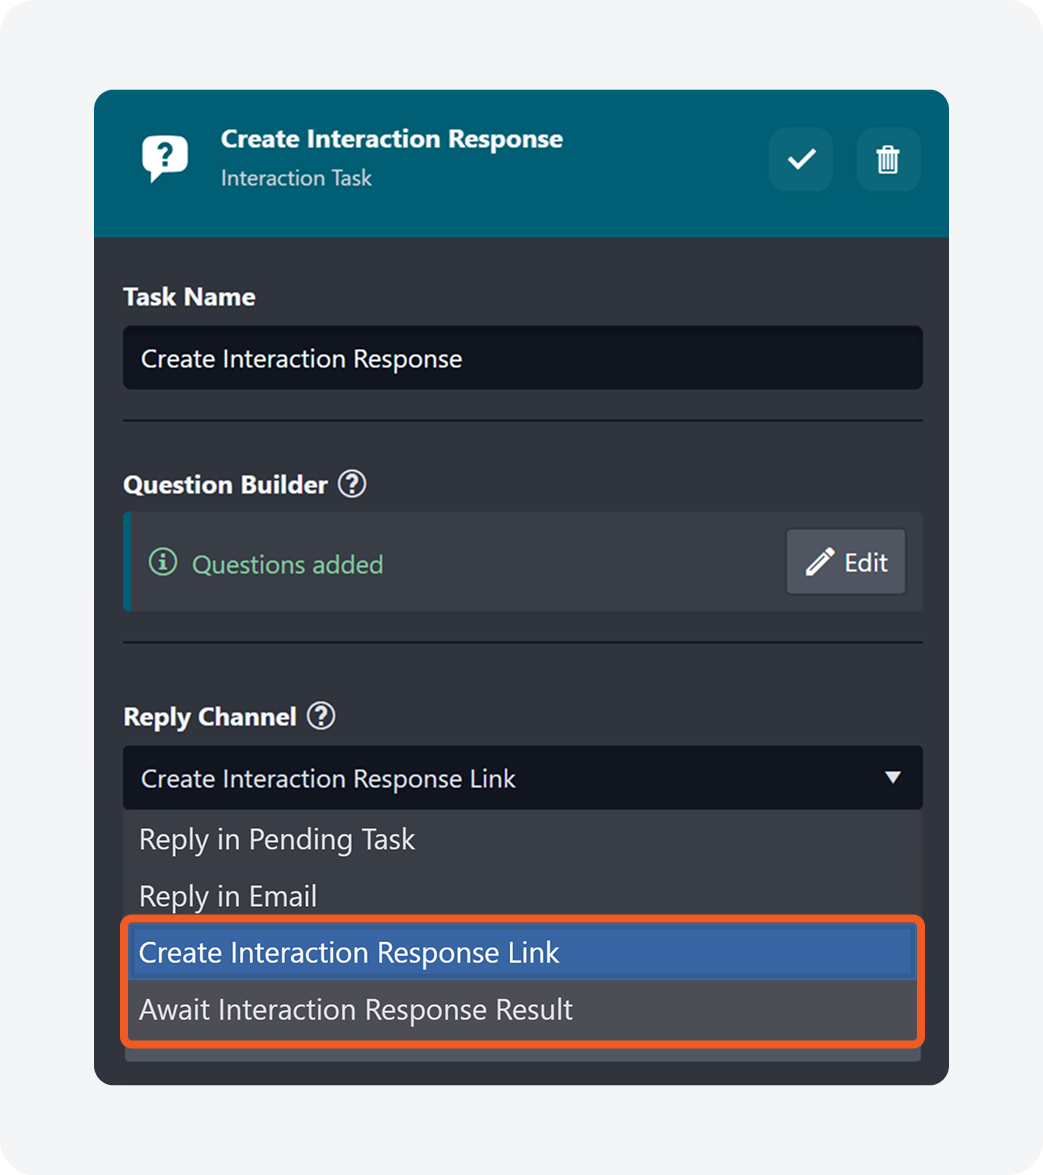
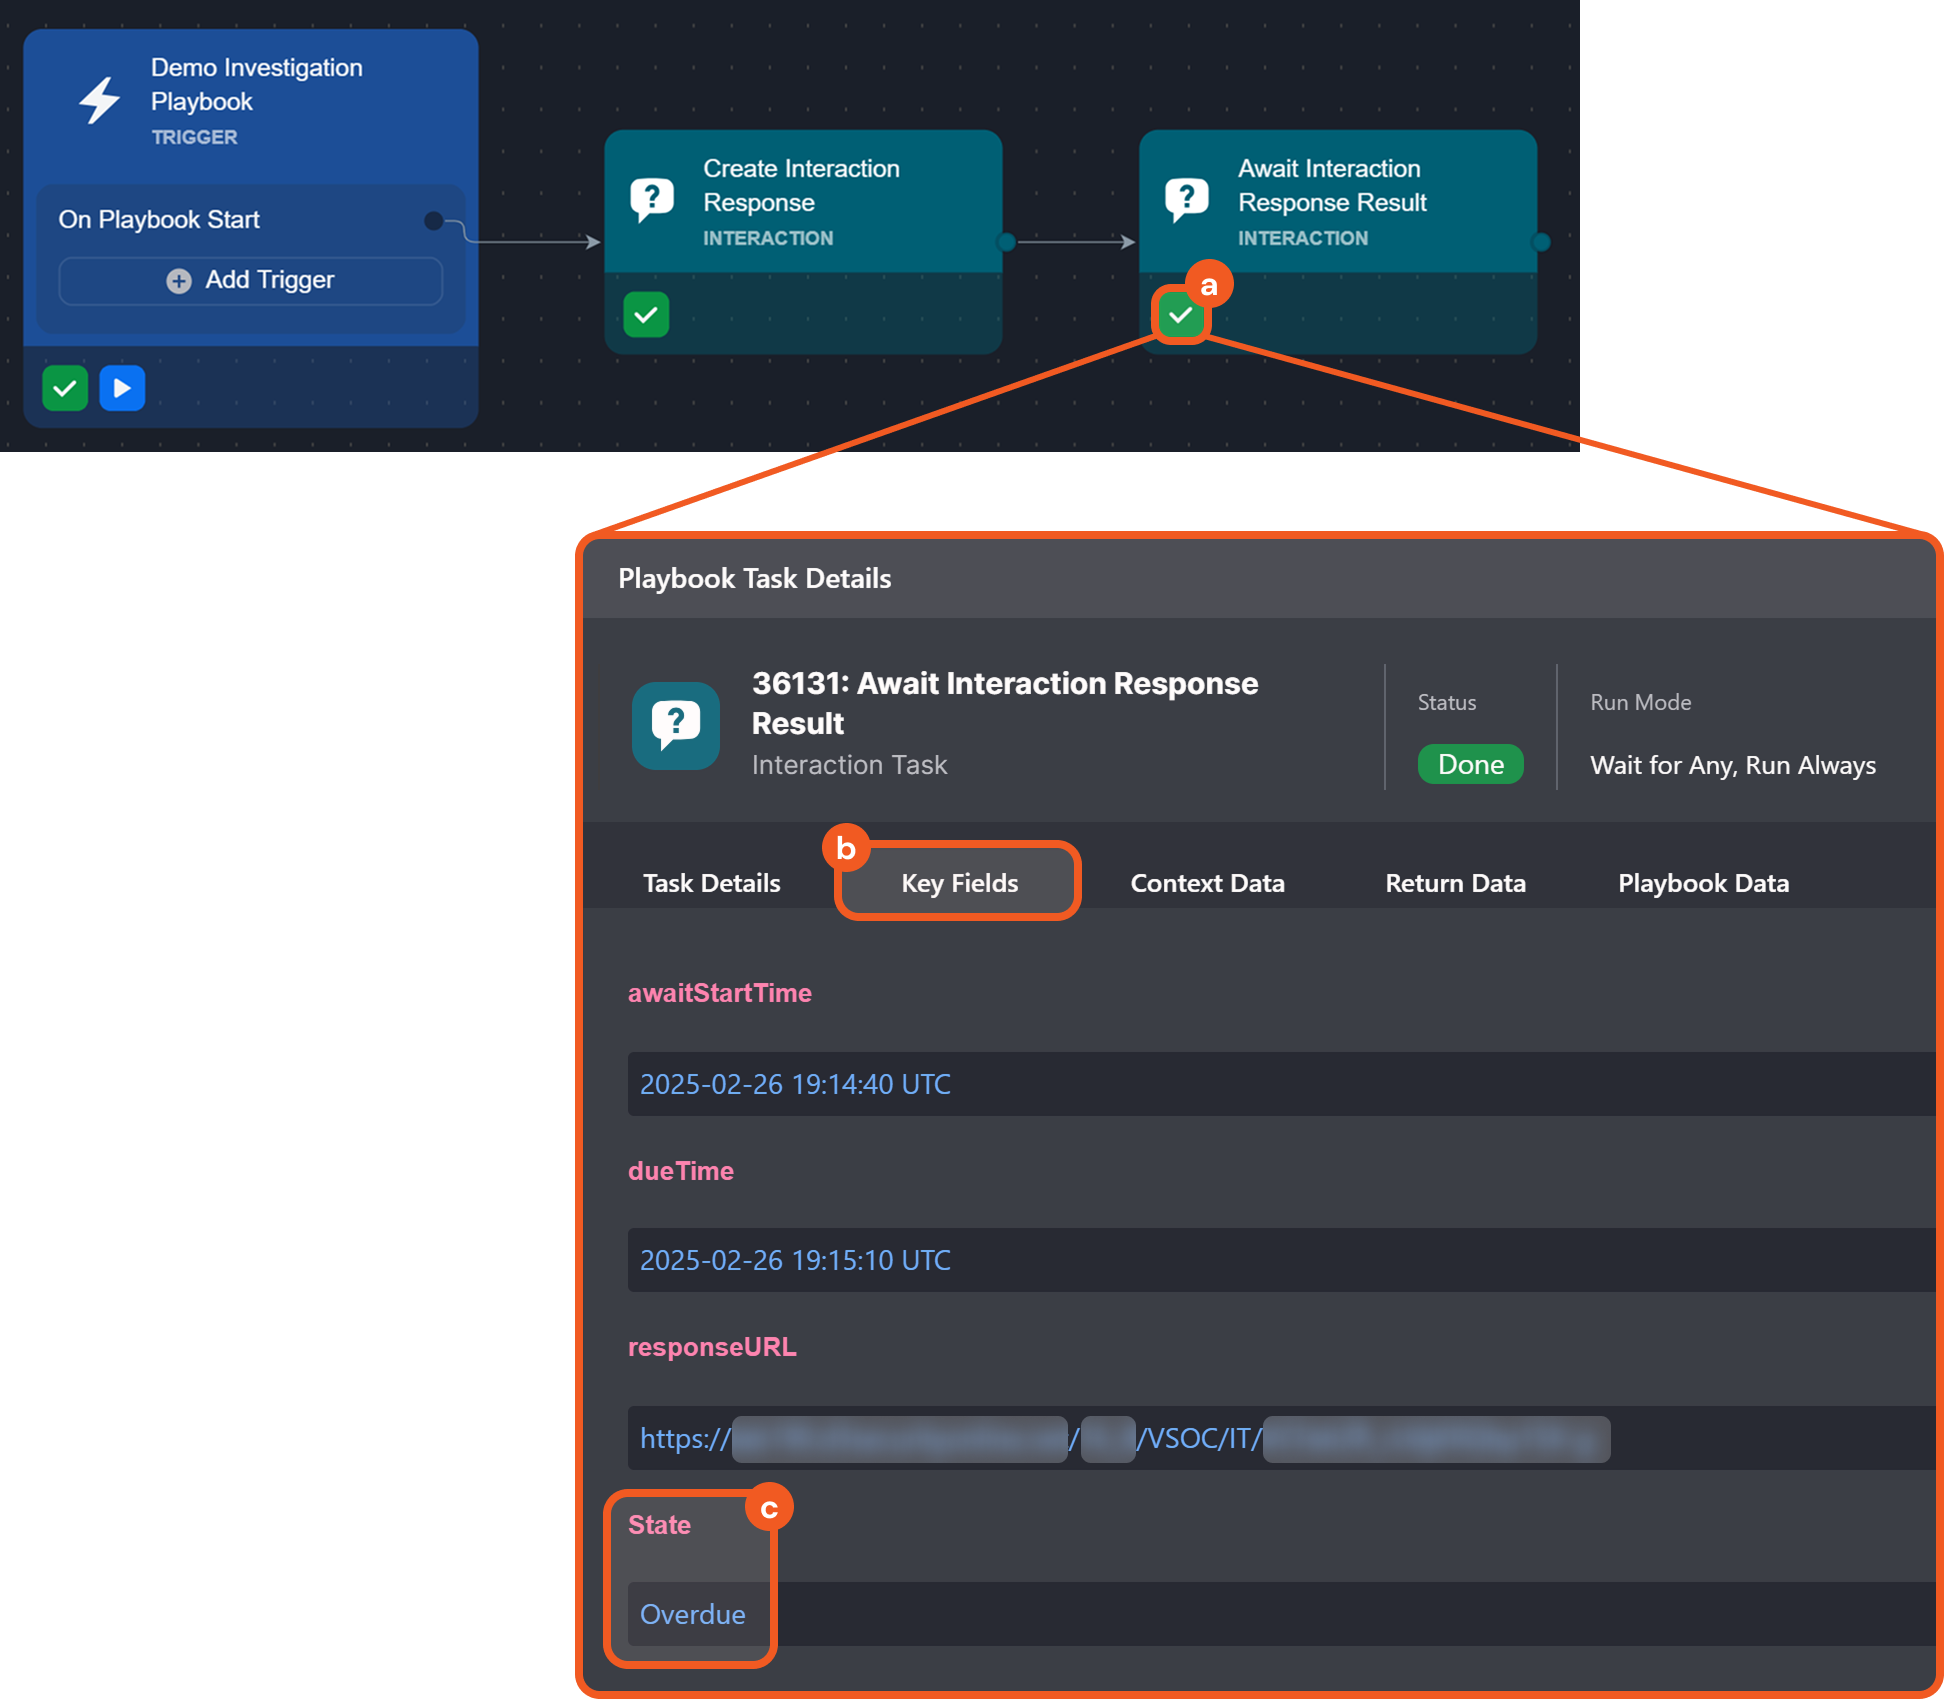
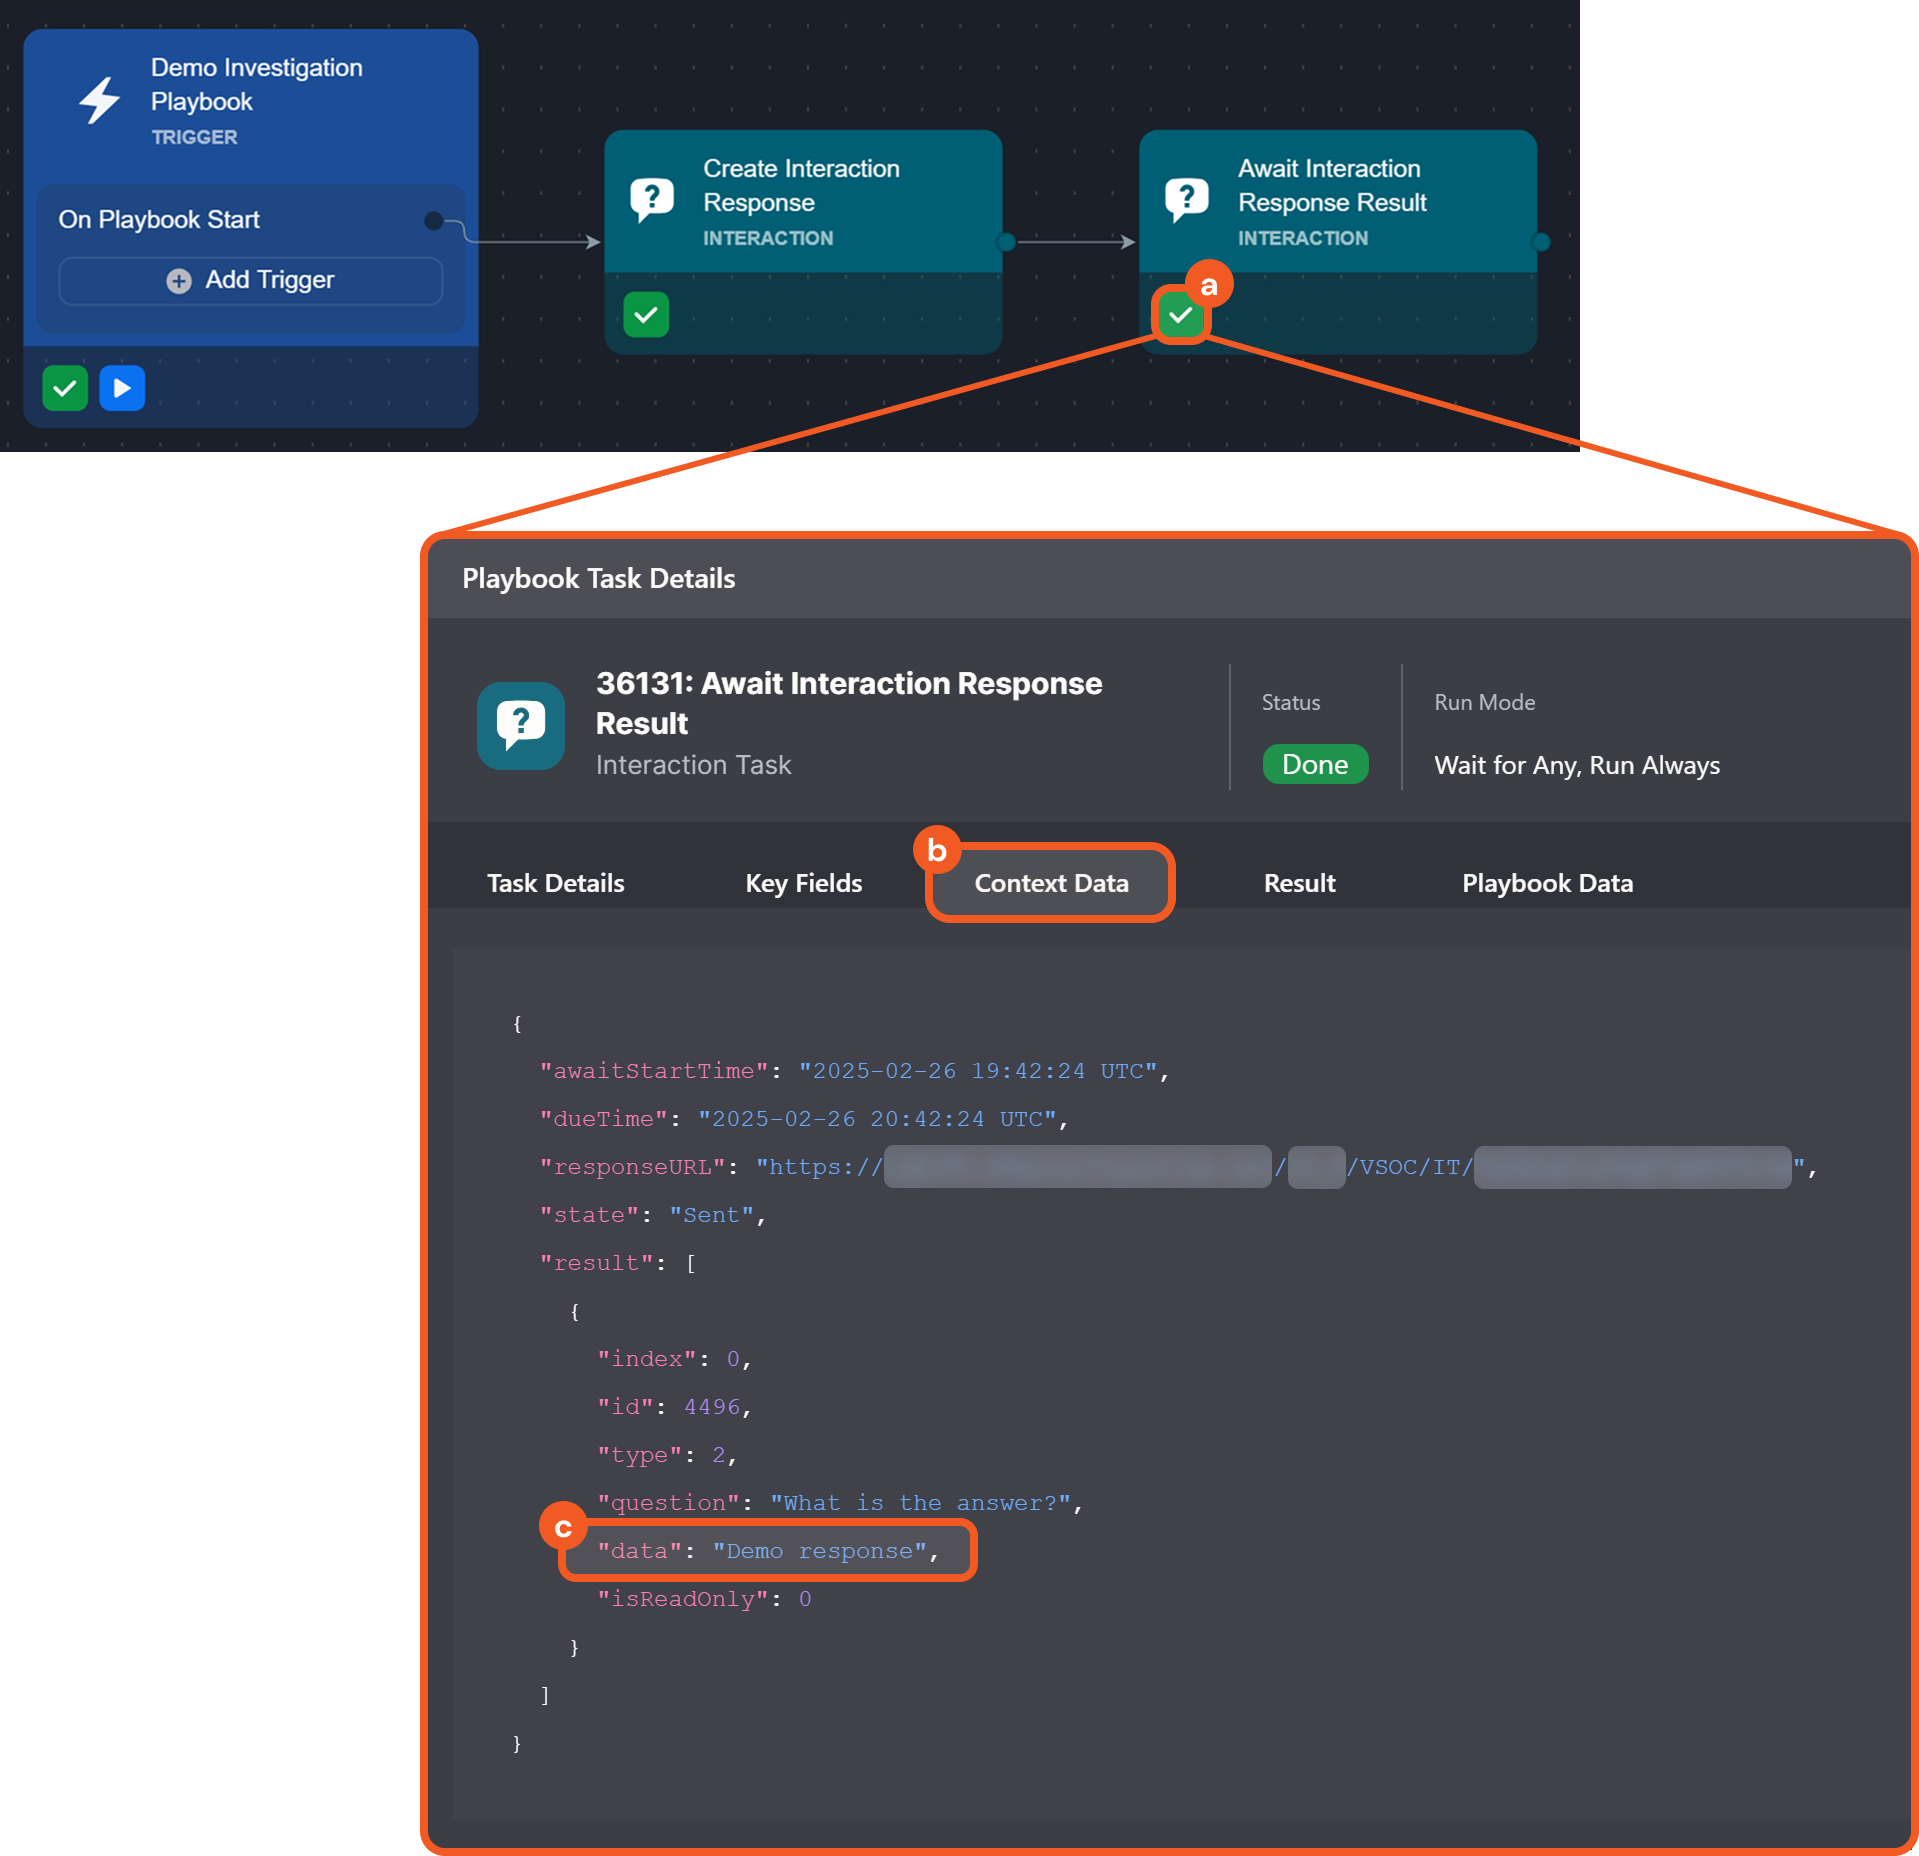
Two new interaction task reply channels have been introduced for use in conjunction: Create Interaction Response Link and Await Interaction Response Result. The former one generates a response link that can be shared with recipients. The latter one monitors the specified link, awaiting a response within a defined timeframe and updating the task status accordingly.
Suppose the following investigation playbook is provided:
%201.png?inst-v=a6d380fe-ff29-4bbc-9b46-e2545b975c77)
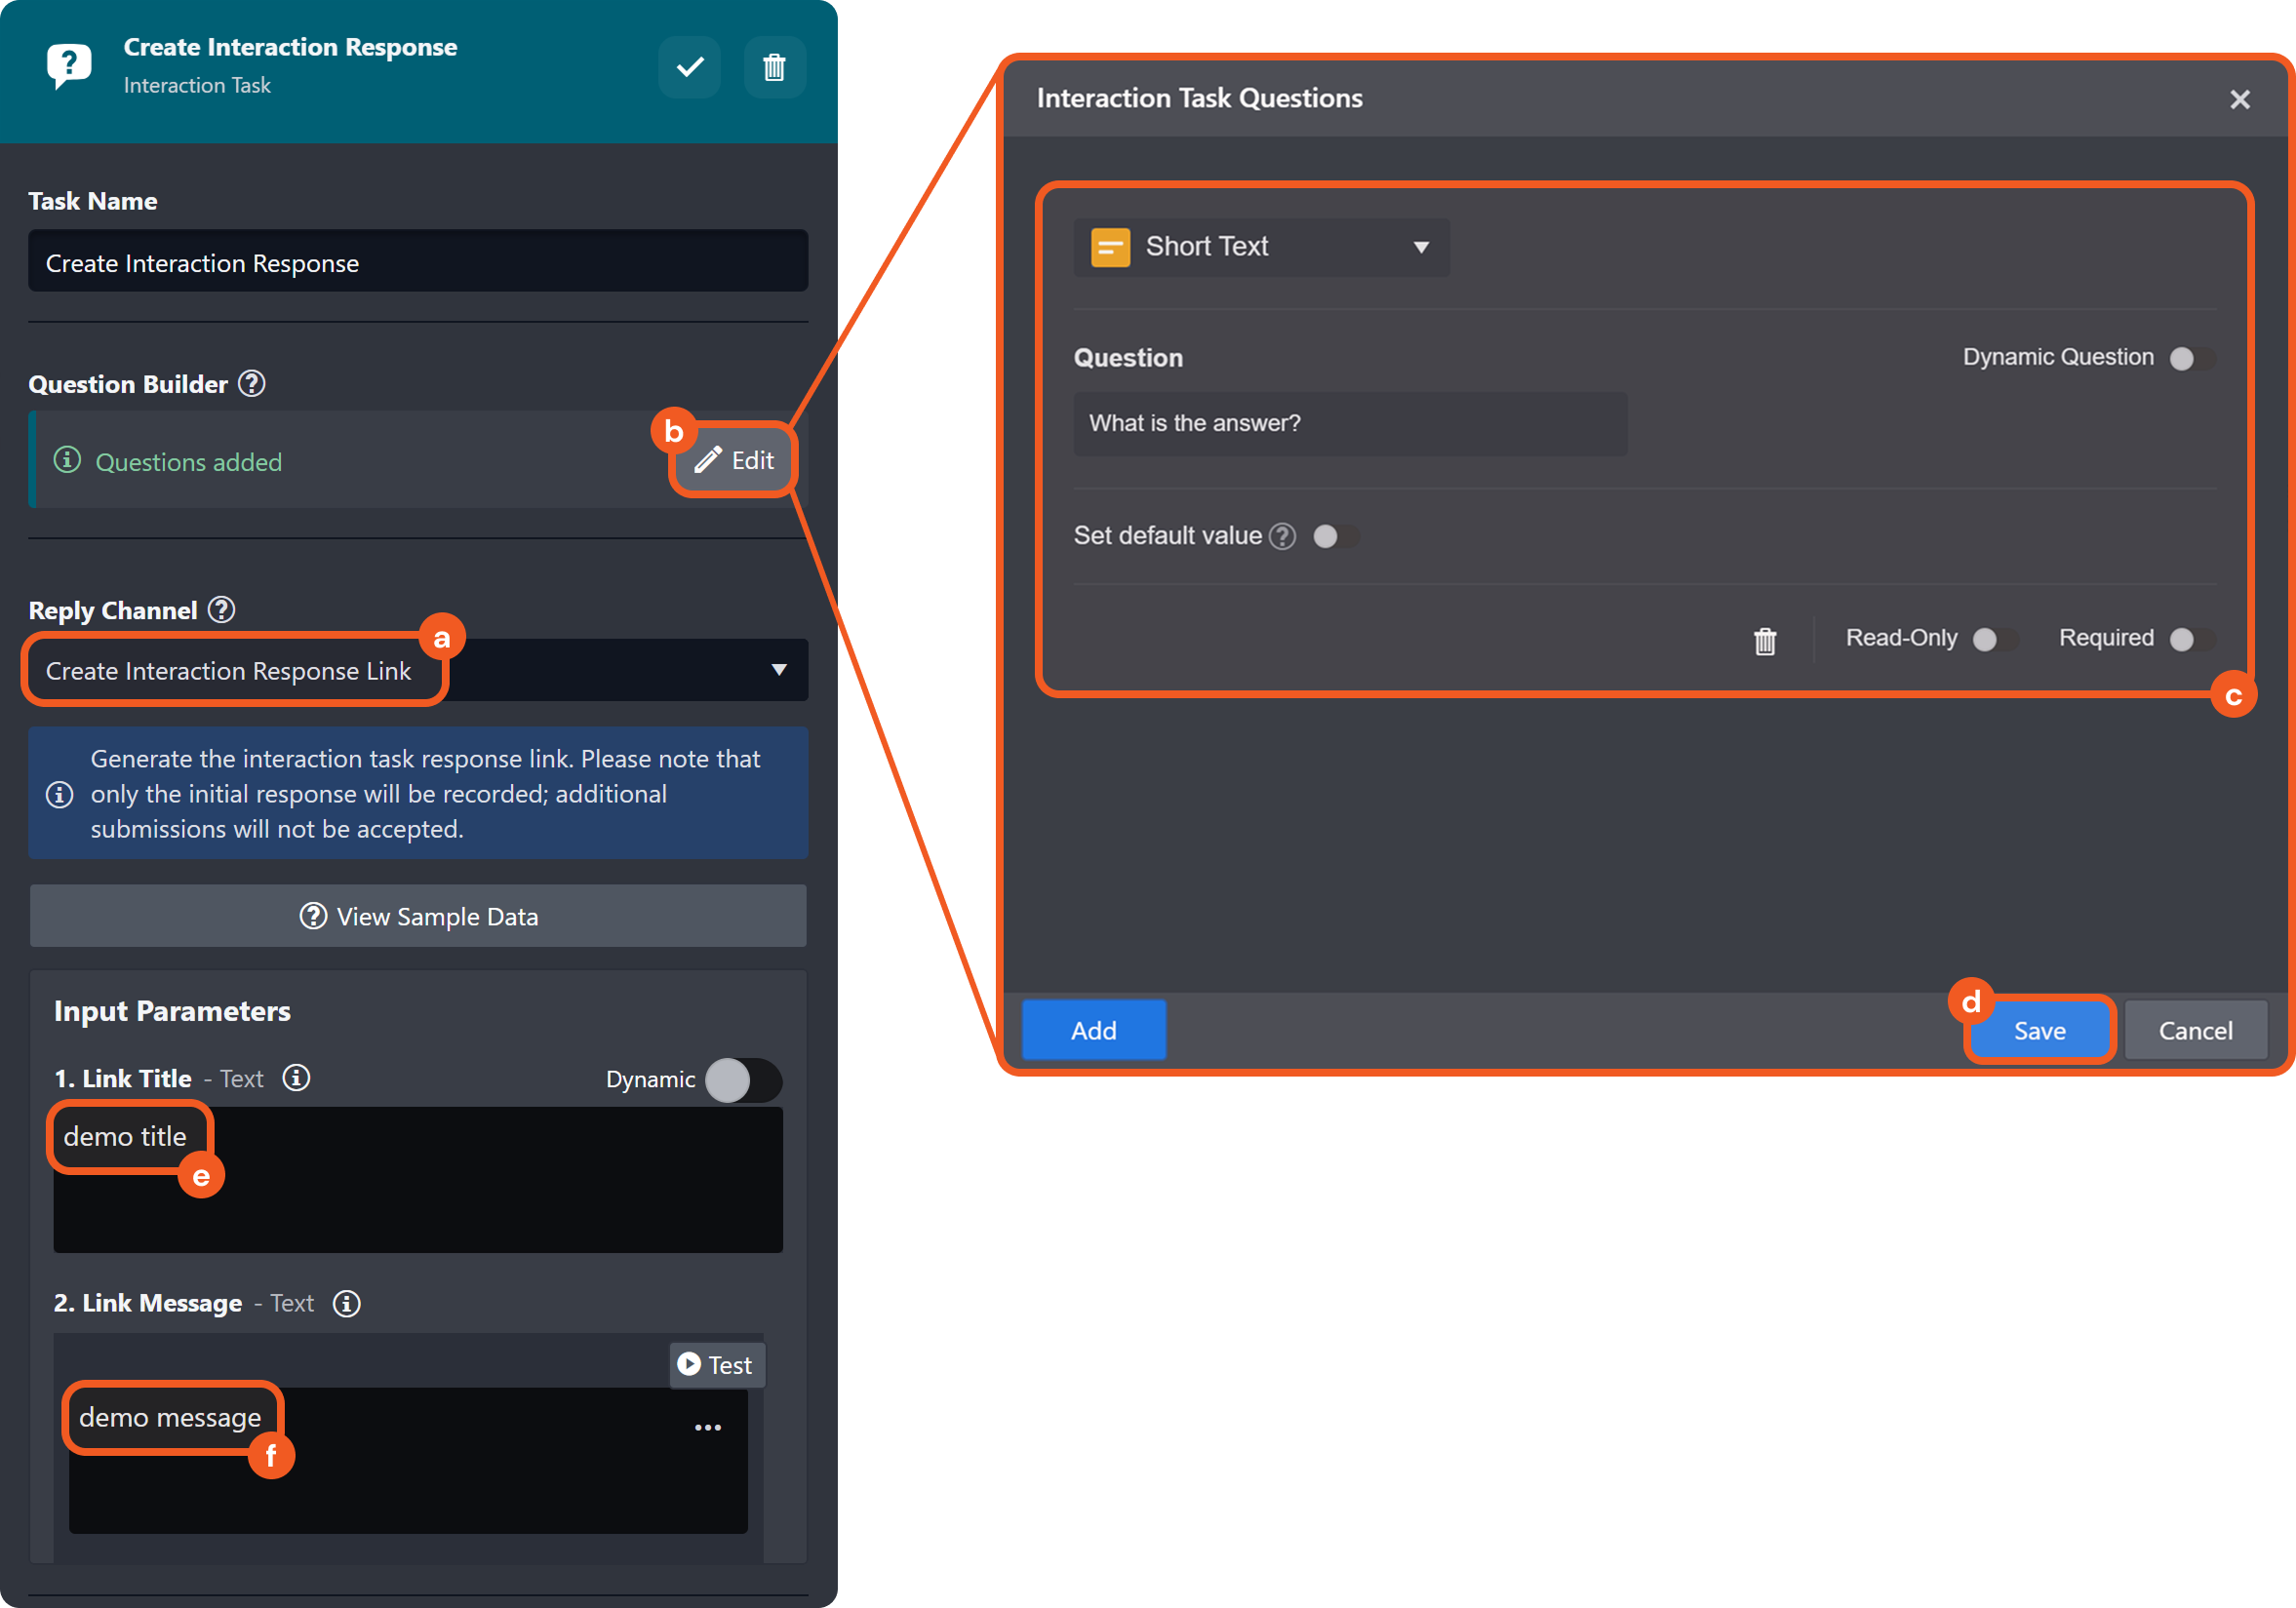
Set up the first interaction task.
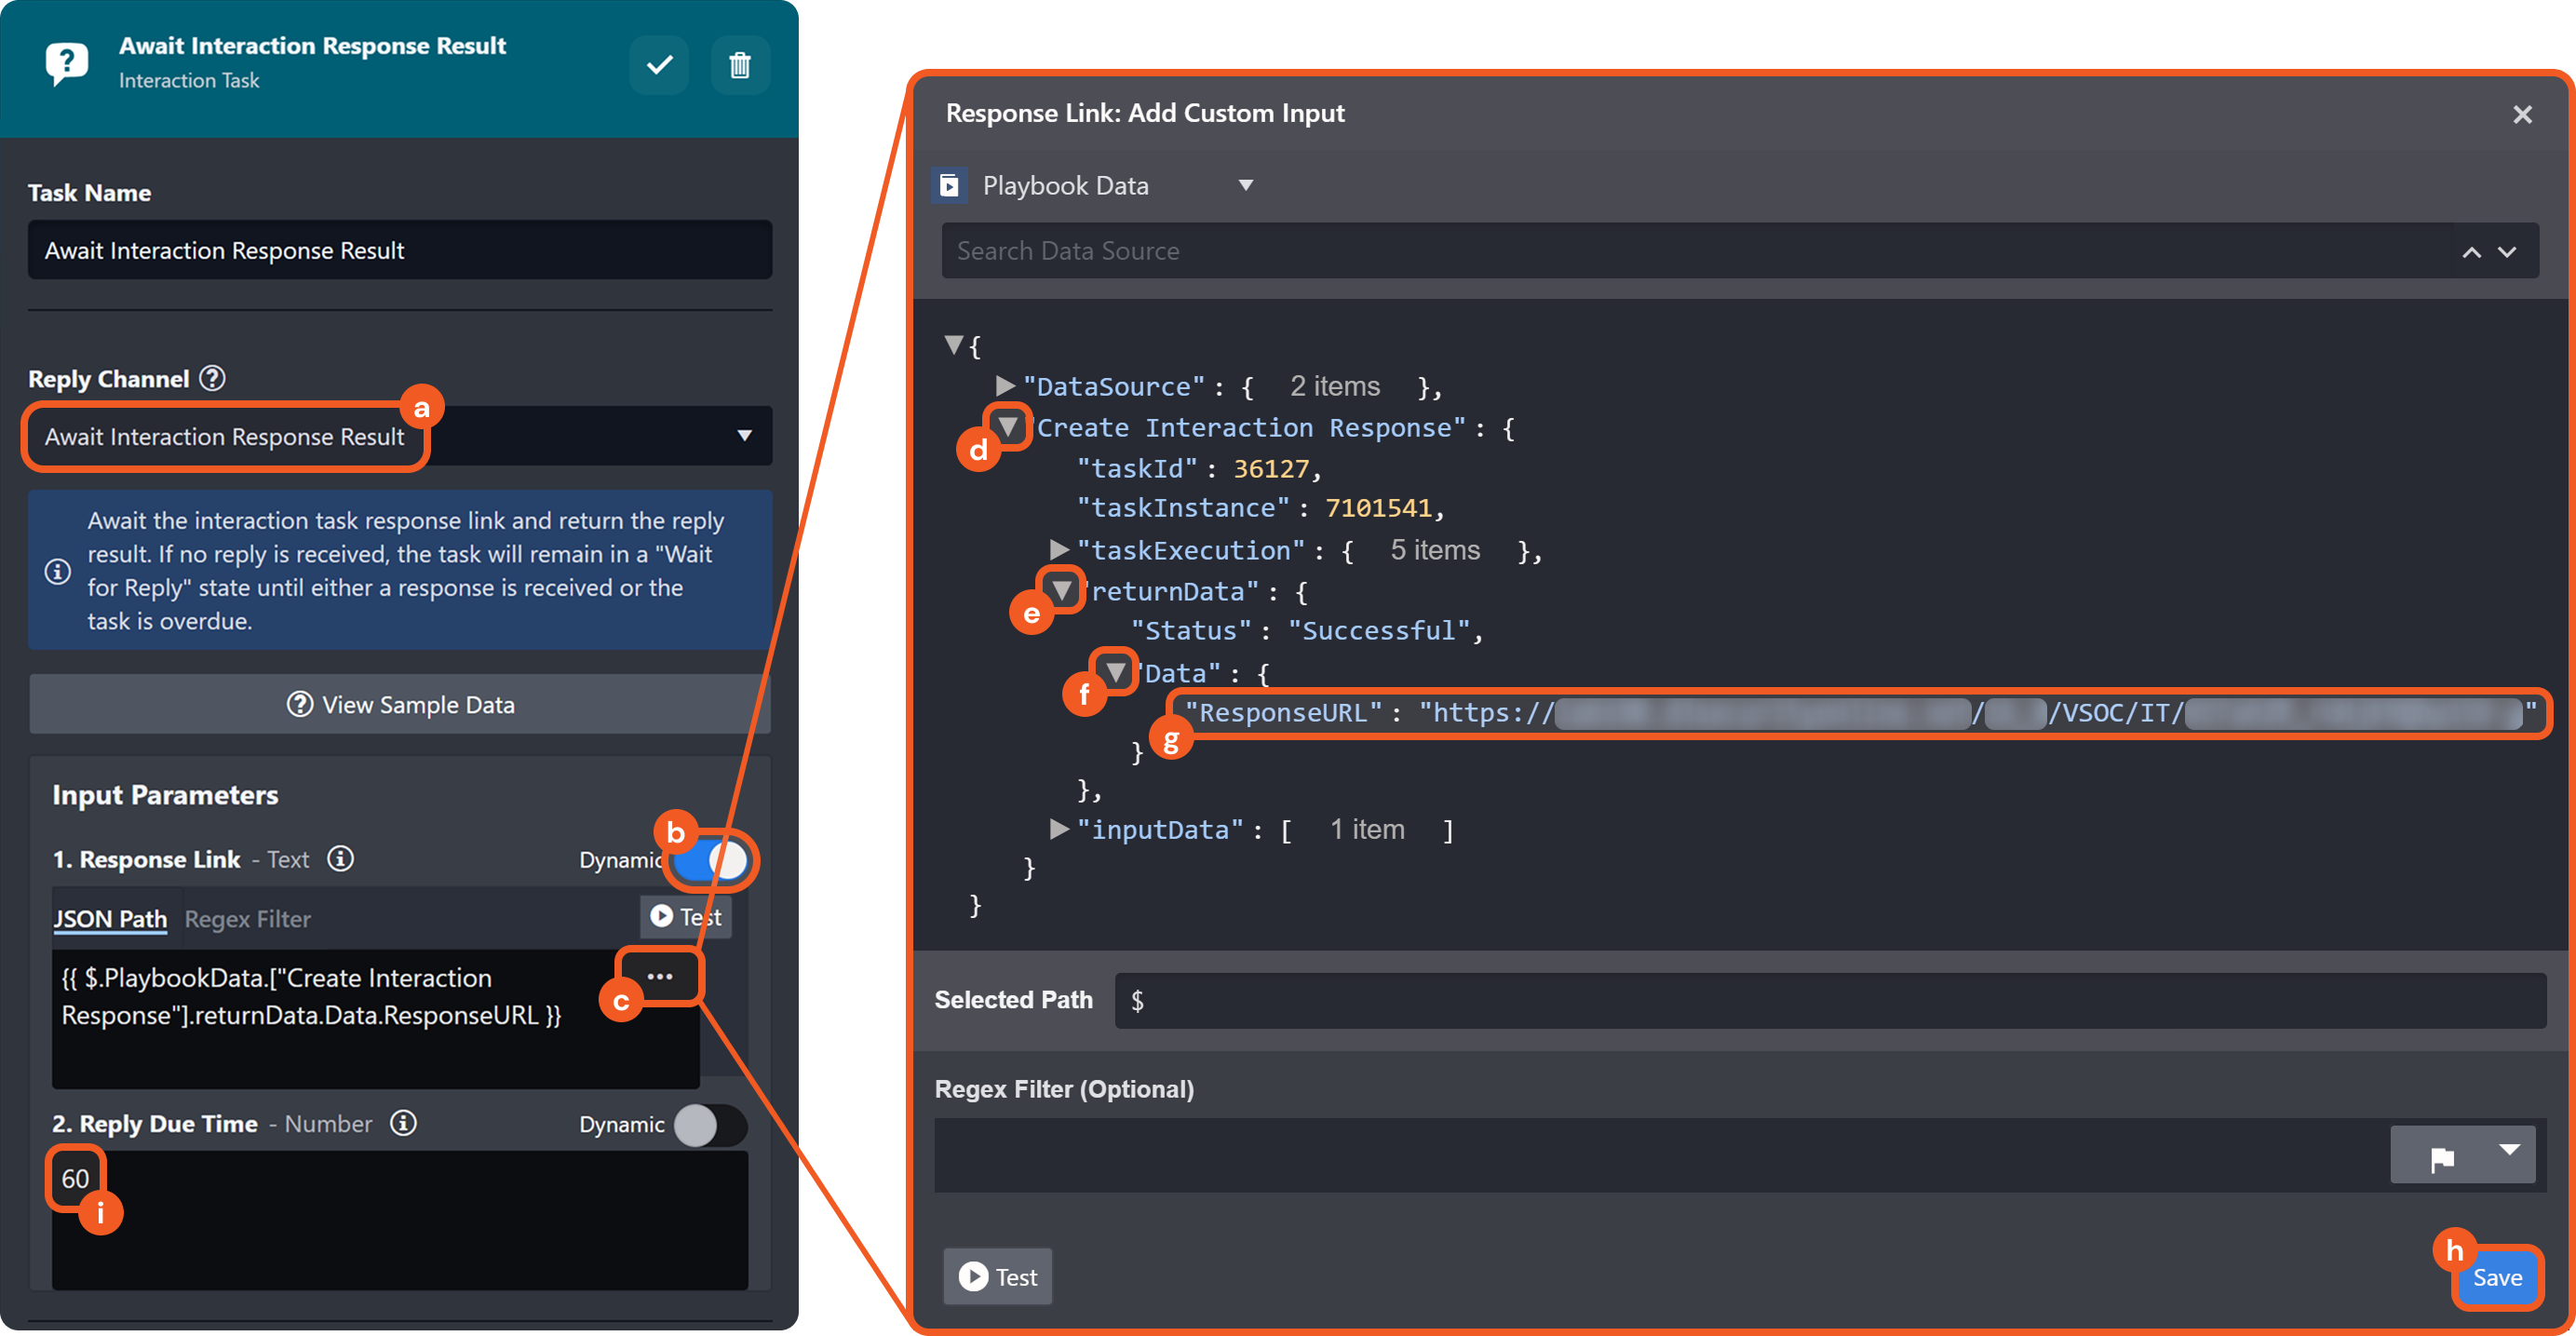
Set up the second interaction task.
Test the playbook, then click on the
 icon for the first interaction task to obtain the response URL.
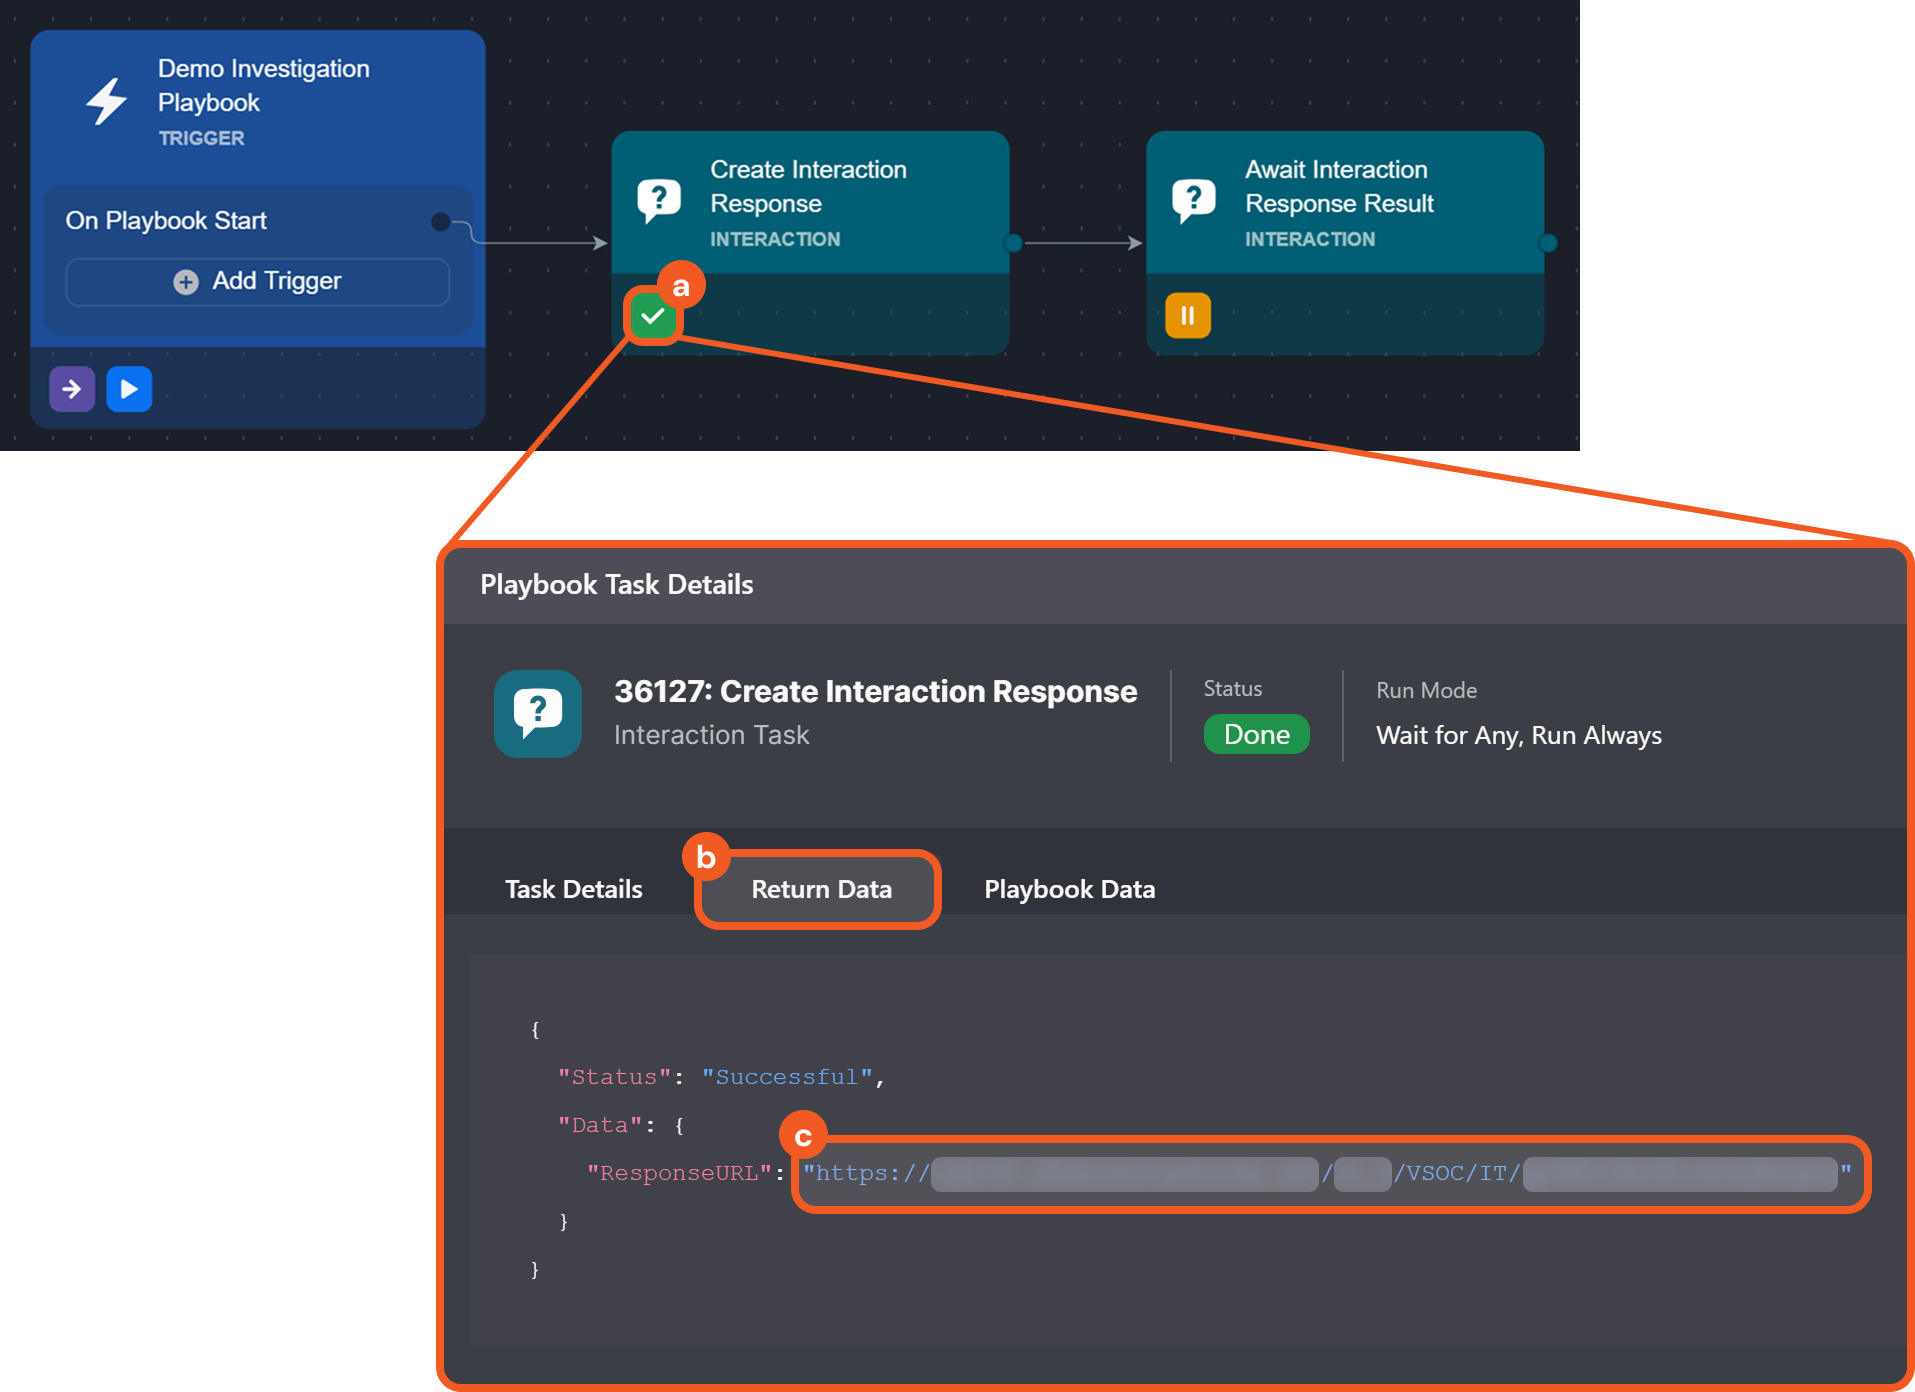
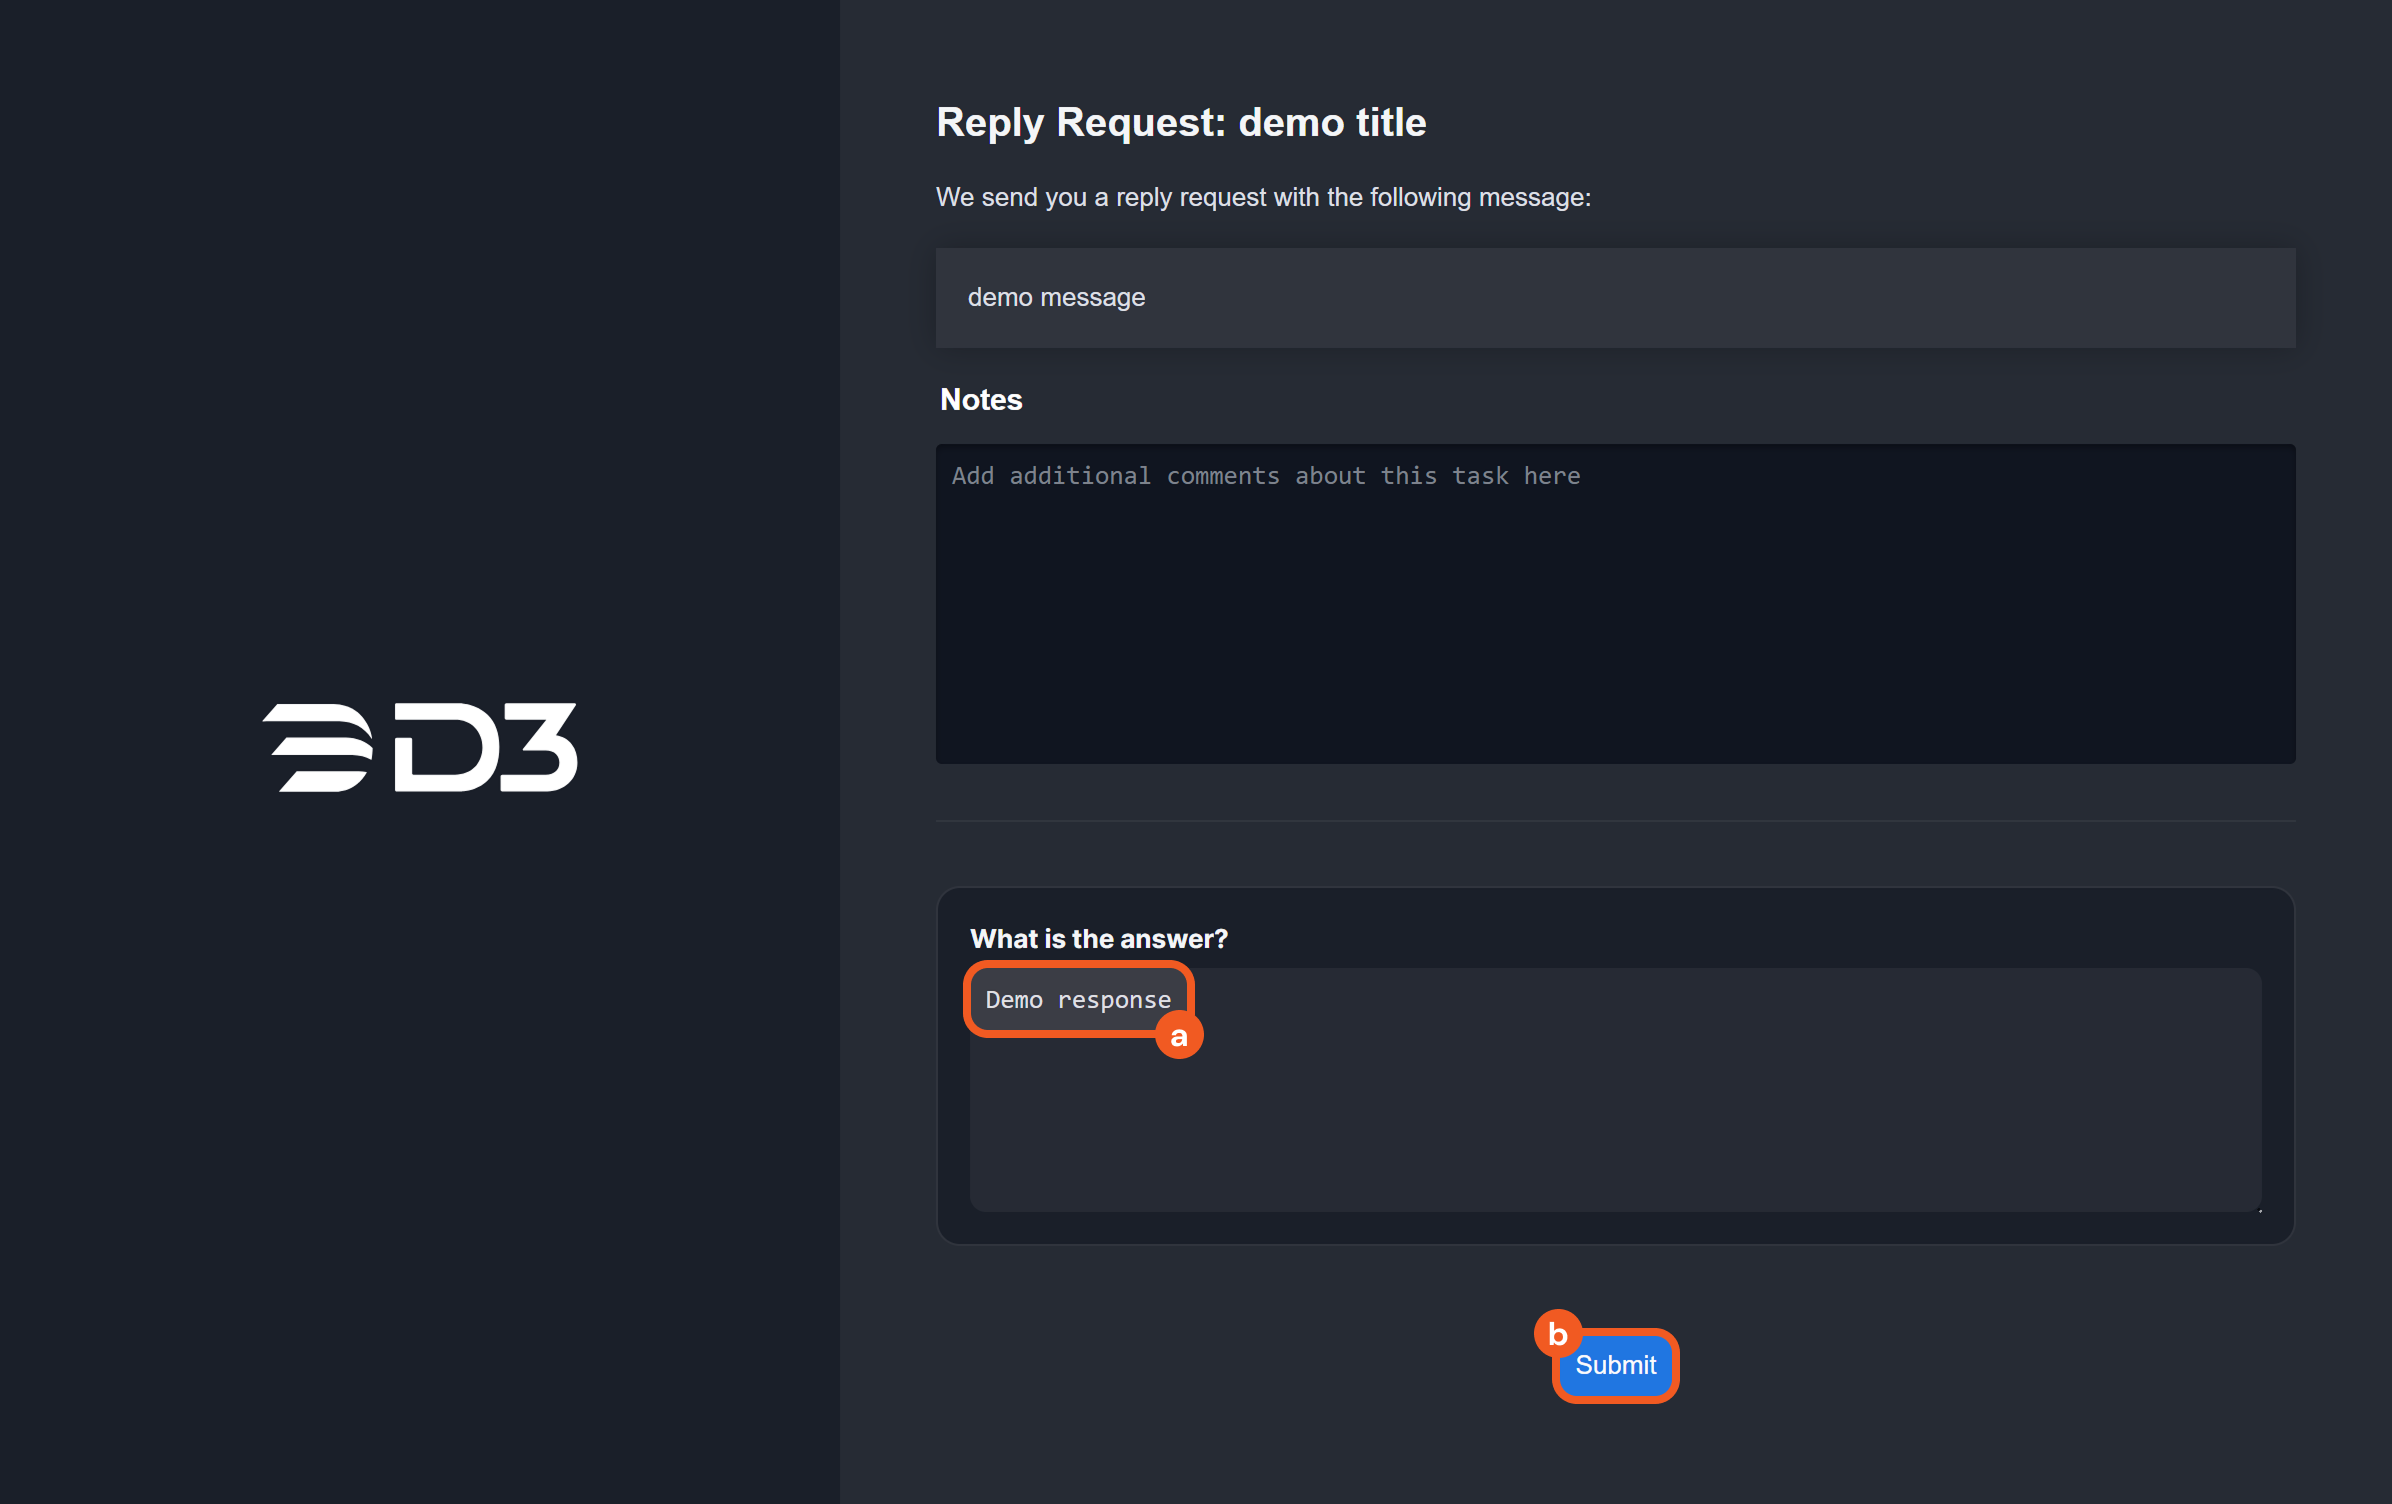
Send the URL to the relevant recipients. The form accessed via the URL will appear as follows:
%201%20(1).png?inst-v=a6d380fe-ff29-4bbc-9b46-e2545b975c77)
Click on the
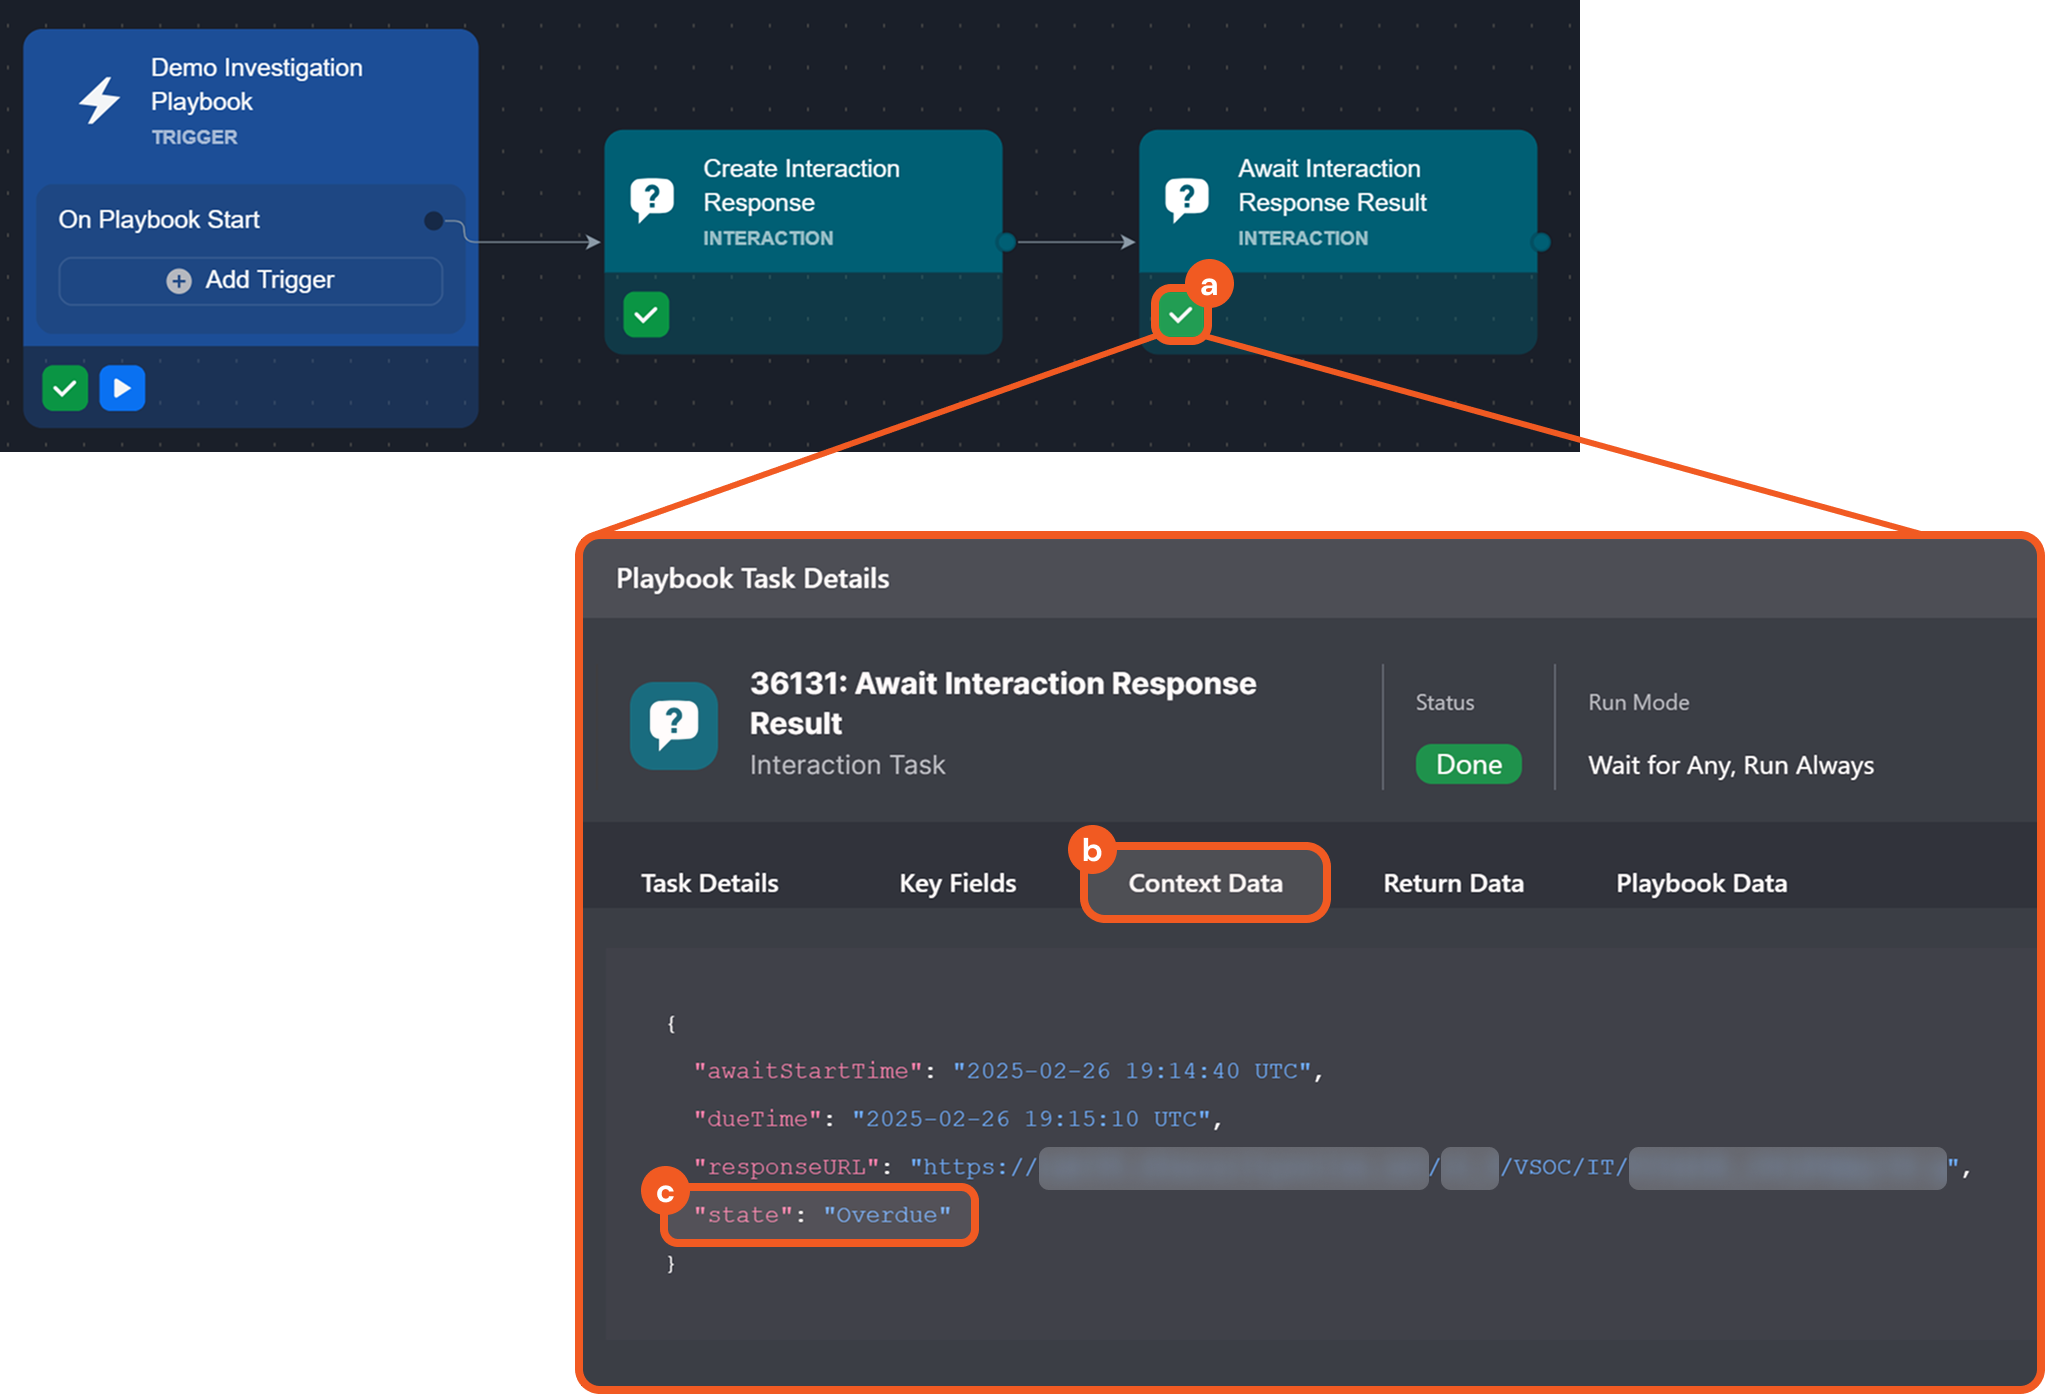
icon for the second interaction task to check on the response status. If the recipient does not respond within the allotted timeframe, an overdue message will be displayed in the Key Fields and Context Data tabs.
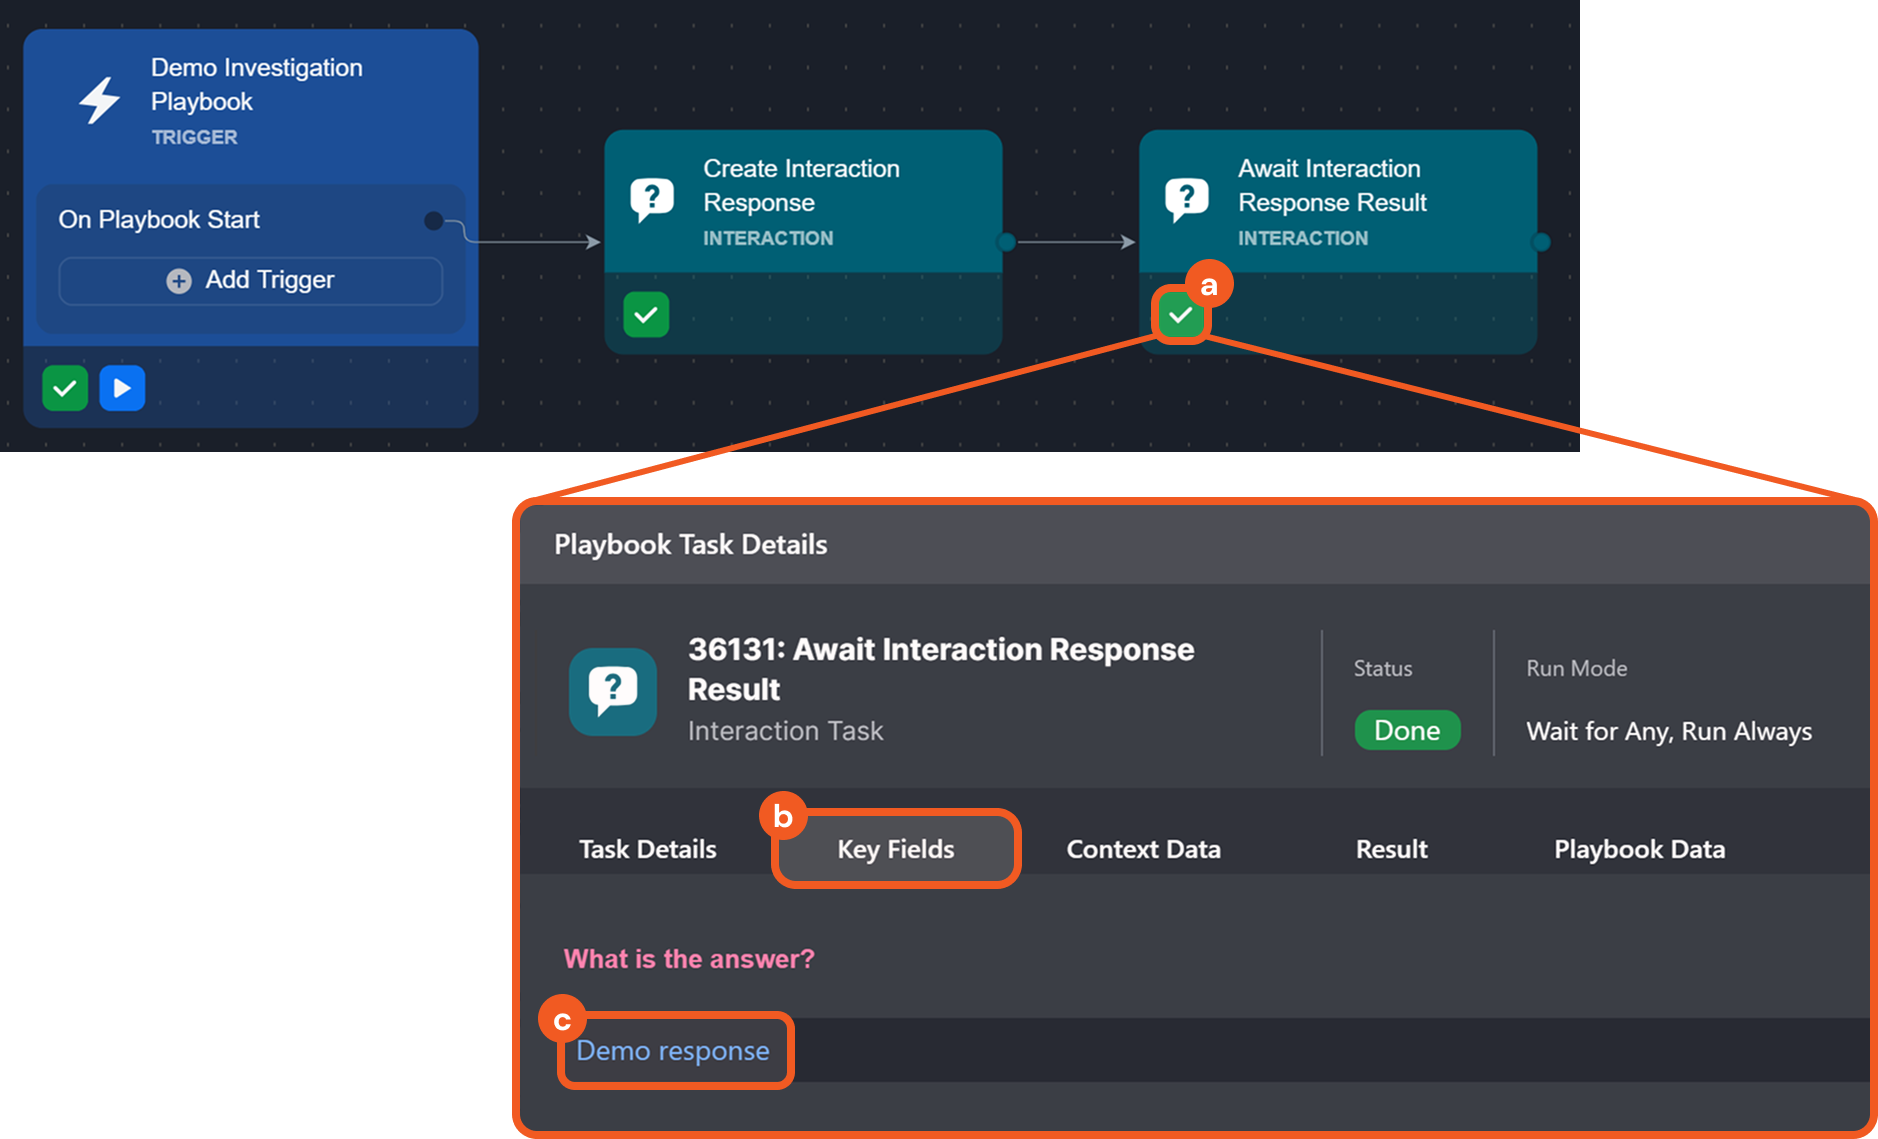
If the recipient responds by submitting the form within the allotted timeframe, their response will be displayed in the Key Fields and Context Data tabs.
%201.png?inst-v=a6d380fe-ff29-4bbc-9b46-e2545b975c77)
Log Request Details
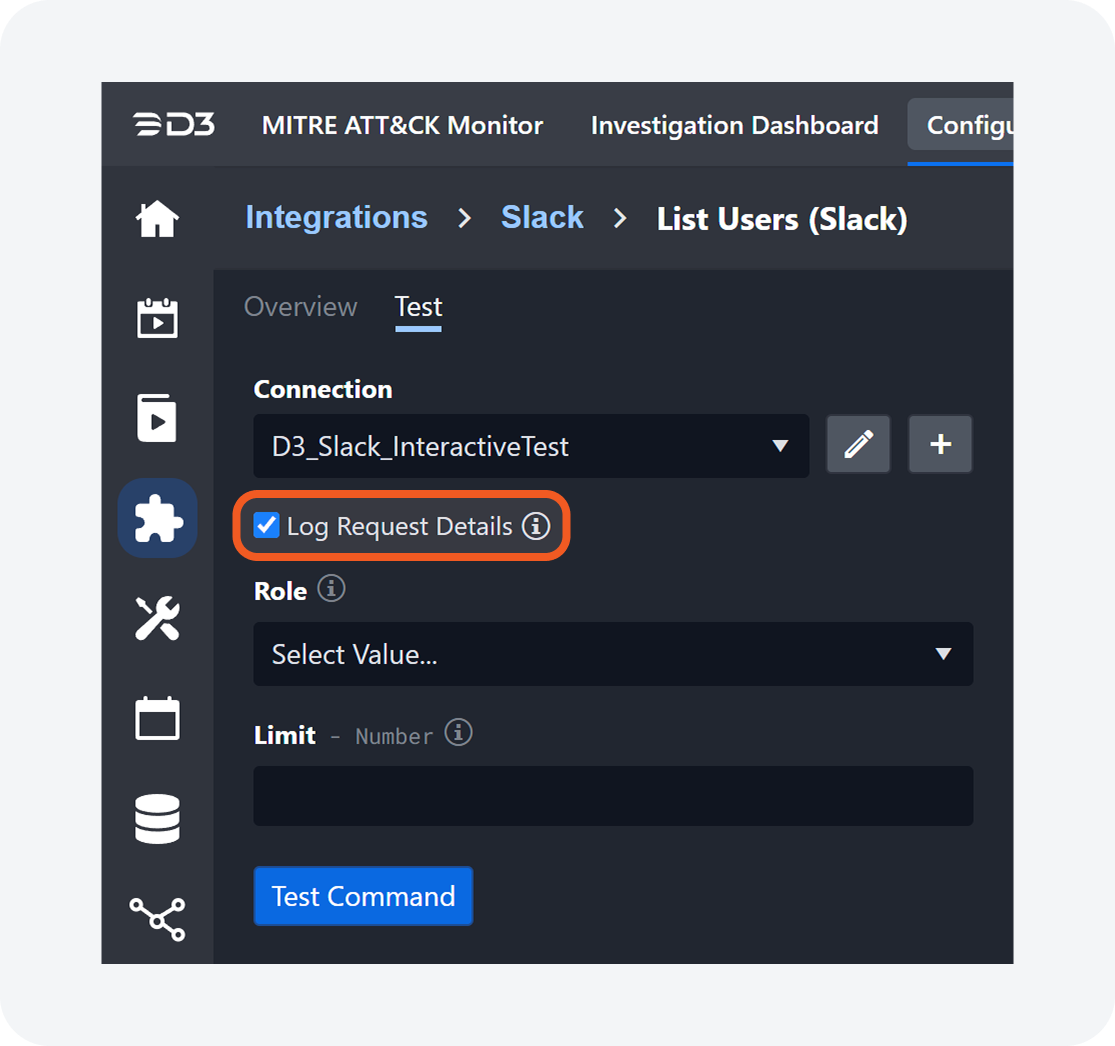
The Log Request Details feature allows users to view raw data sent and received by built-in and custom integration commands. Users can select the Log Request Details checkbox to view the request details in the Result Log after testing the command.
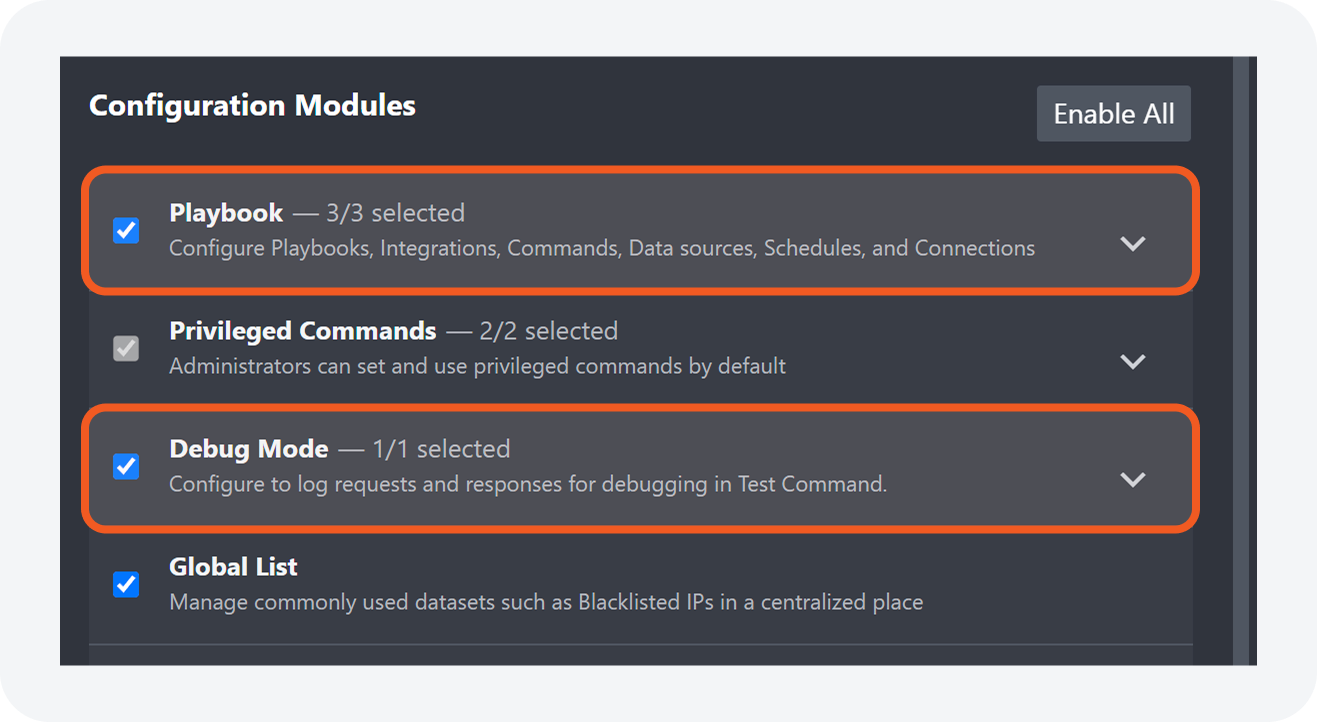
This feature is restricted to users with Debug Mode and Playbook access.
Sensitive data, such as tokens in the header, may be revealed by the functionality.
This feature is available for Python commands, covering 90% of D3's built-in integration commands.
Add or Update Artifact Reputation
Users can add or update the reputation of existing artifacts more efficiently with the Add or Update Artifact Reputation utility command and certain integration check reputation commands —Check IP Reputation, Check URL Reputation, and Check File Hash Reputation.
Navigate to the Configuration module, then click the Utility Commands sub-module.
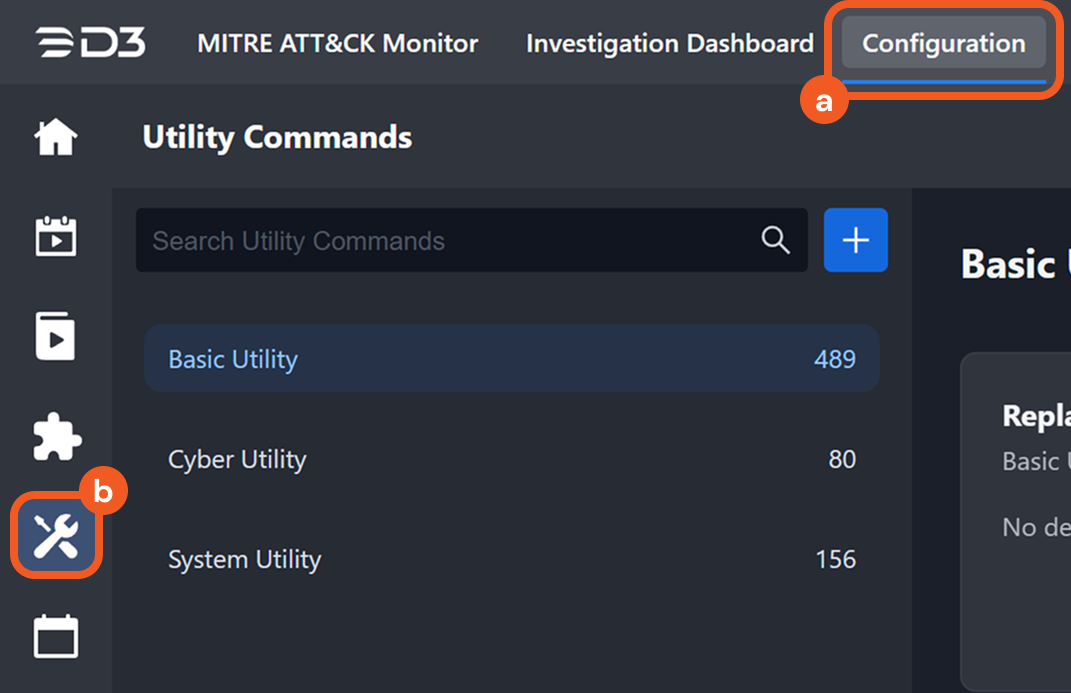
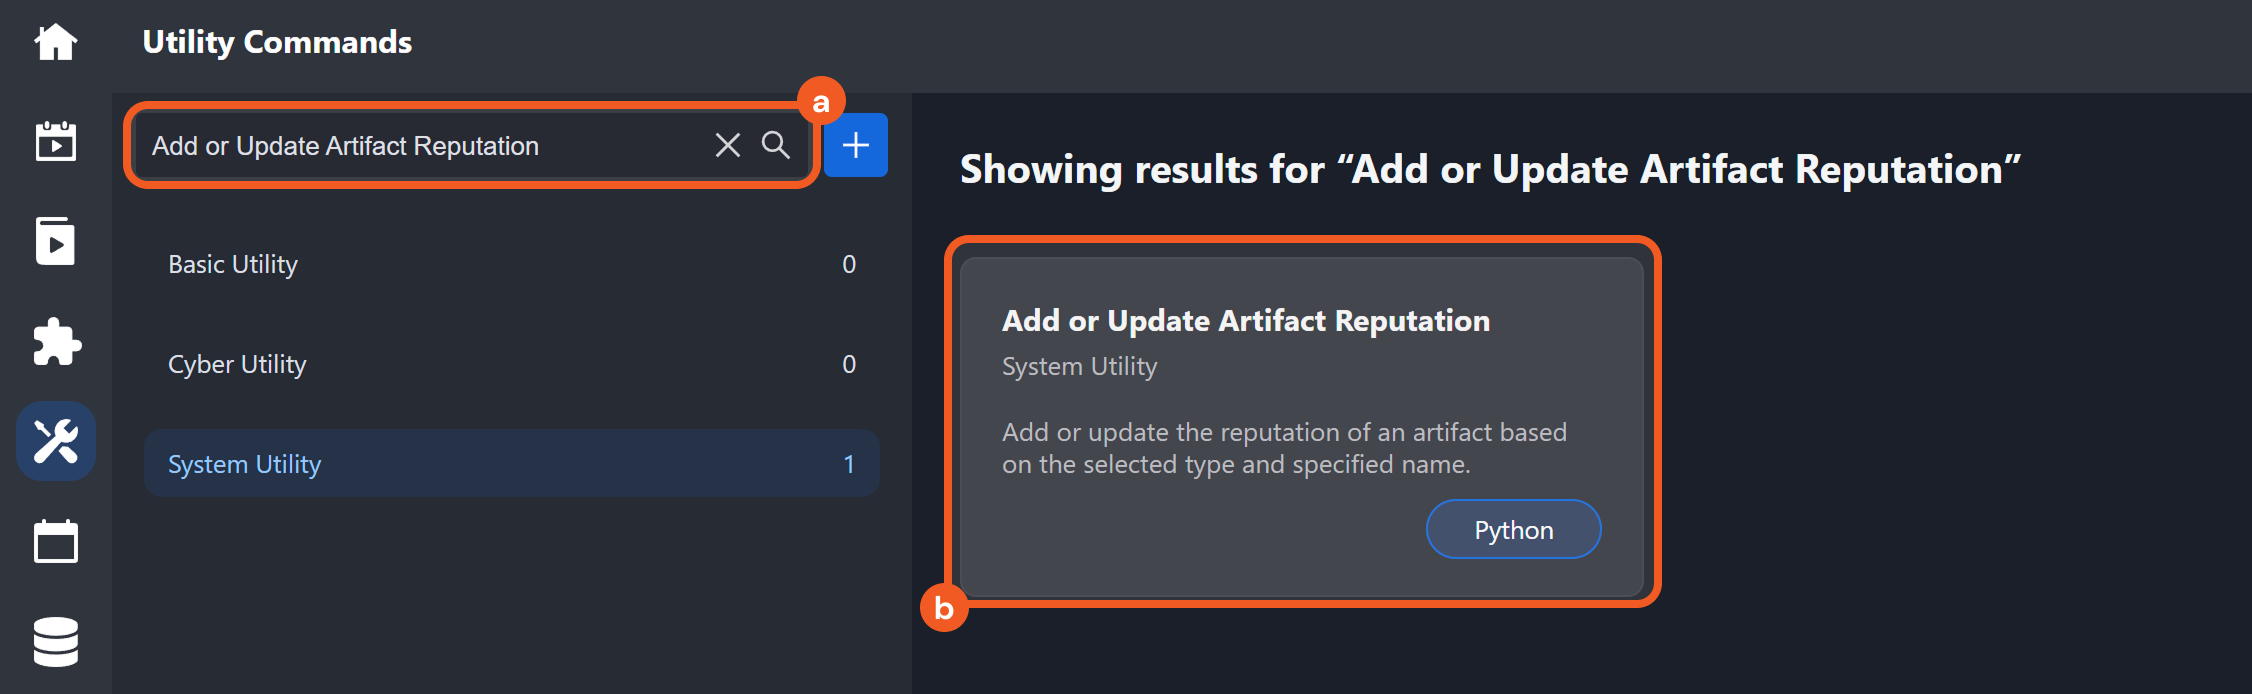
Enter Add or Update Artifact Reputation in the search bar, then select the matching result.
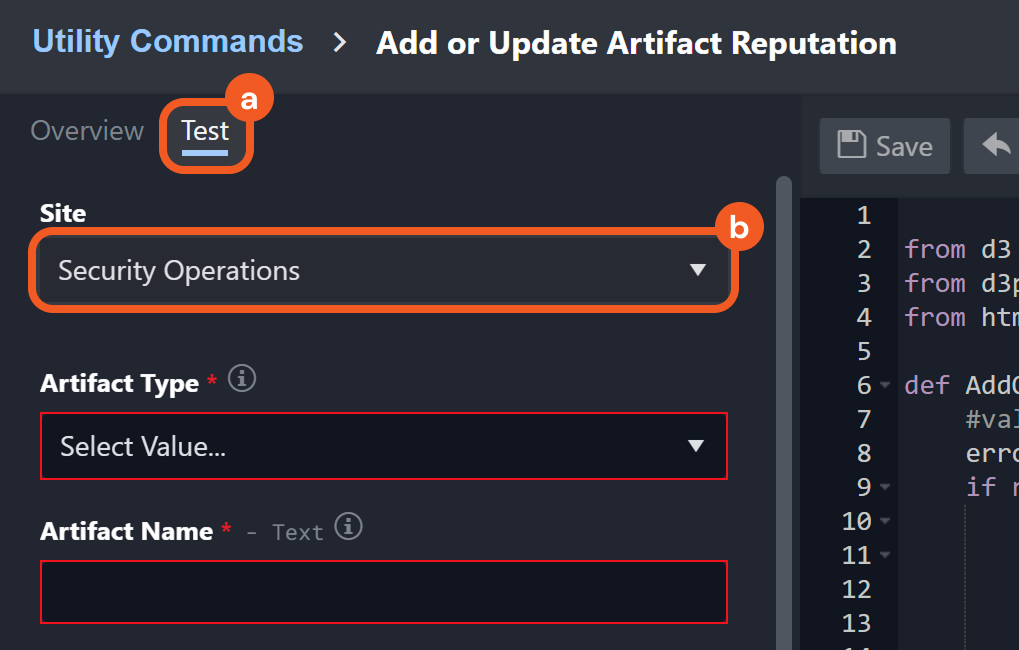
Click the Test tab and select a site.
Fill the input parameters as necessary, then click the Test Command button.
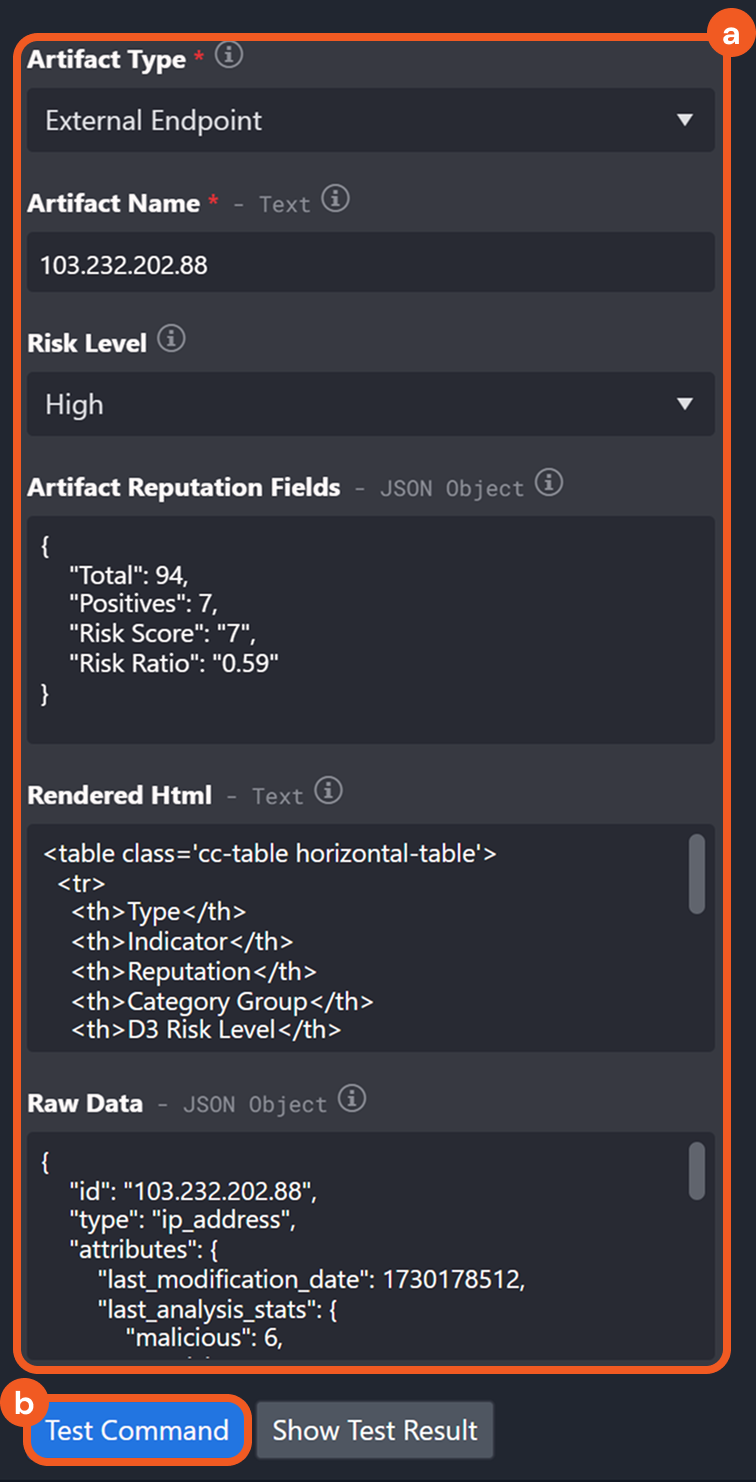
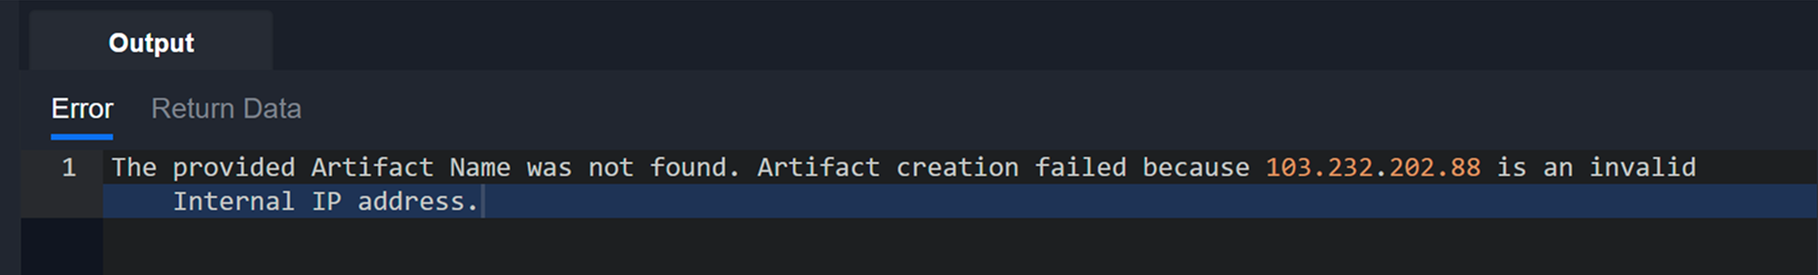
Ensure that the Artifact Type and Artifact Name correspond. For example, selecting Internal Endpoint as the type while providing an external IP address will result in an error.
Navigate to the Investigation Dashboard module, select the site, then choose the All Artifacts view.
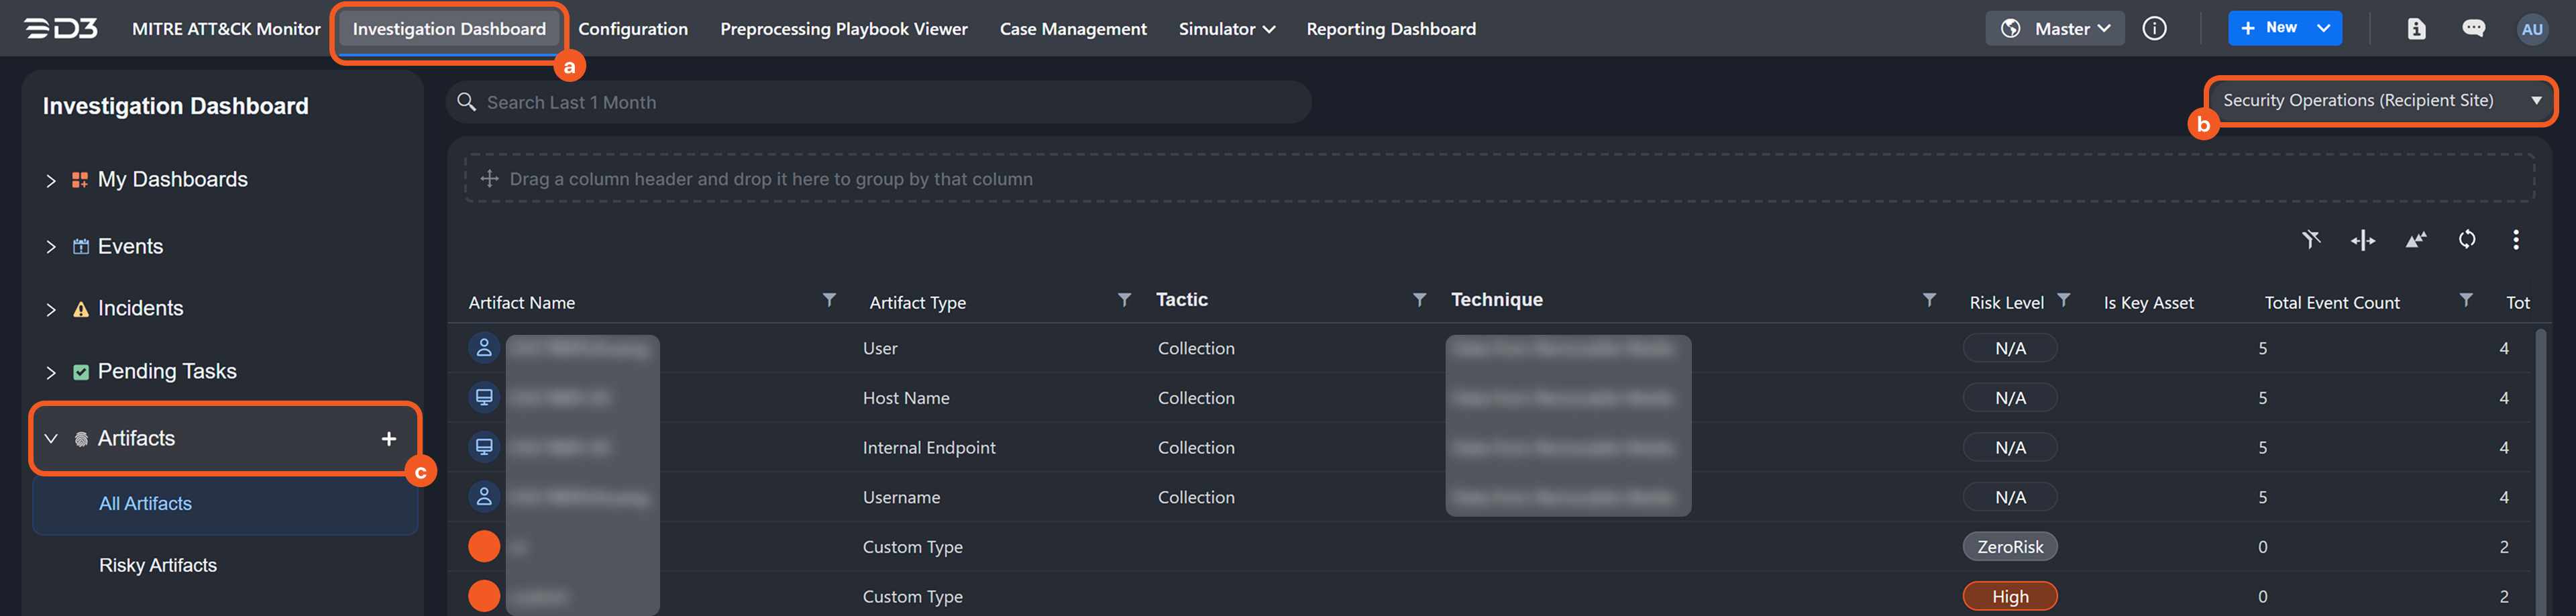
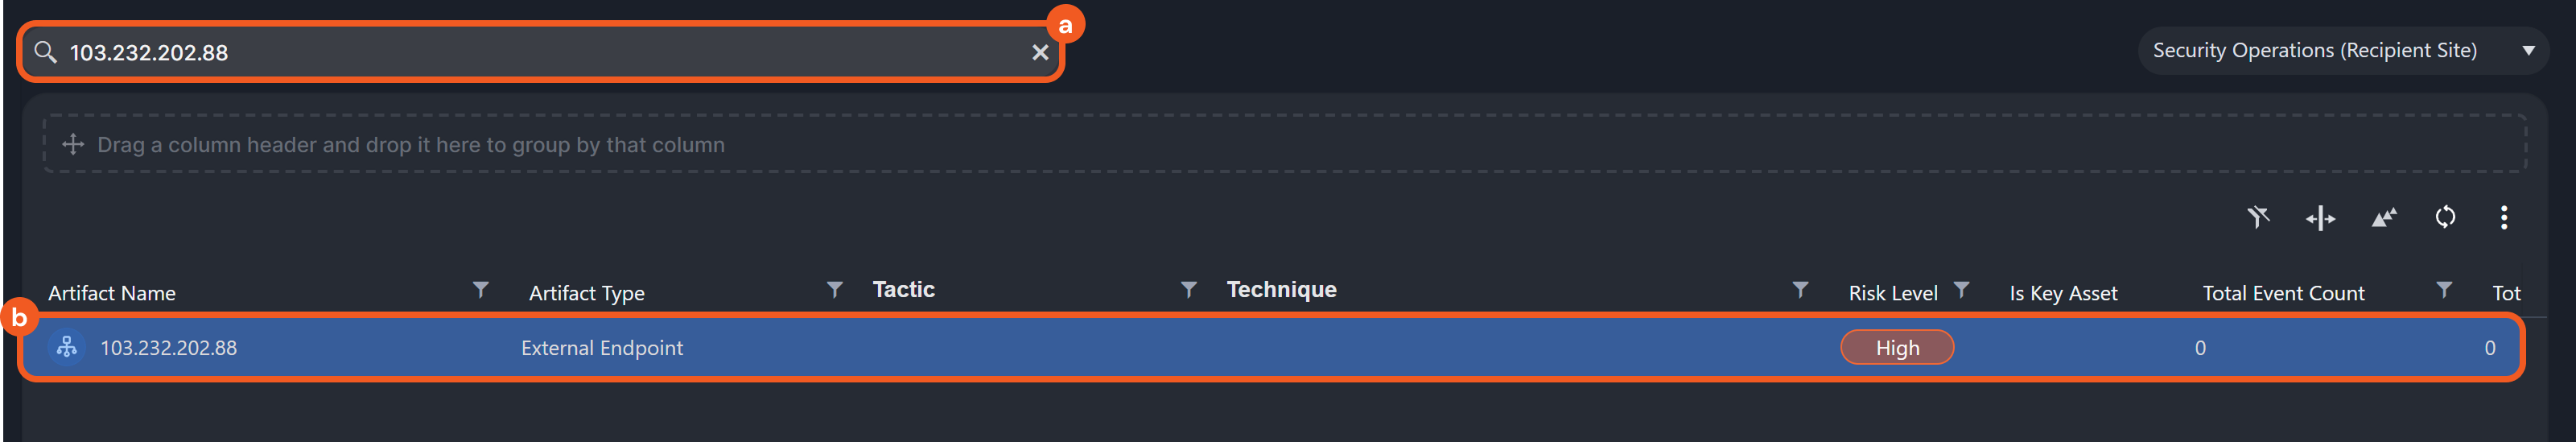
Search for the artifact by its name and click the matching result.
RESULT
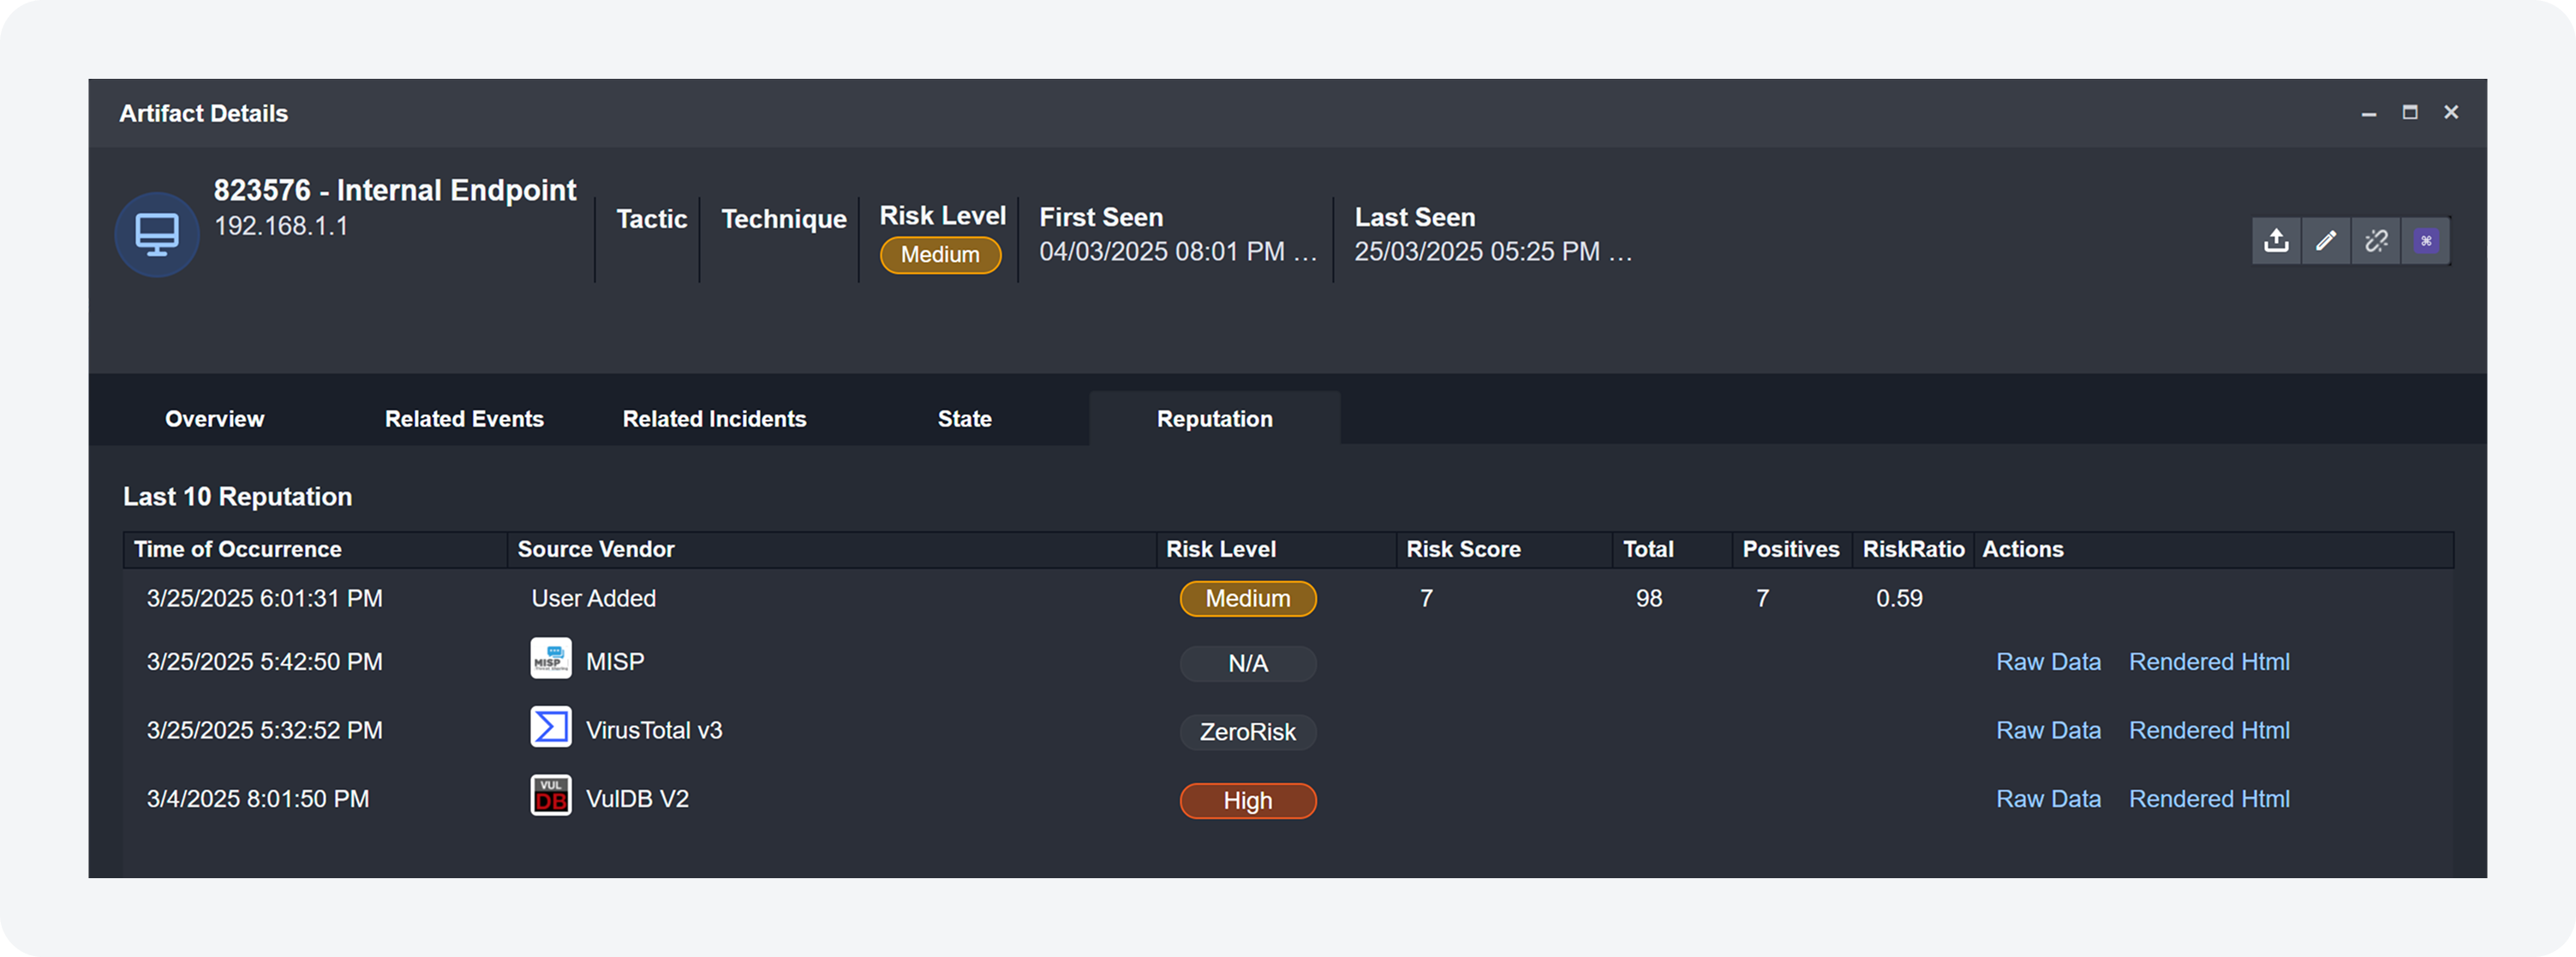
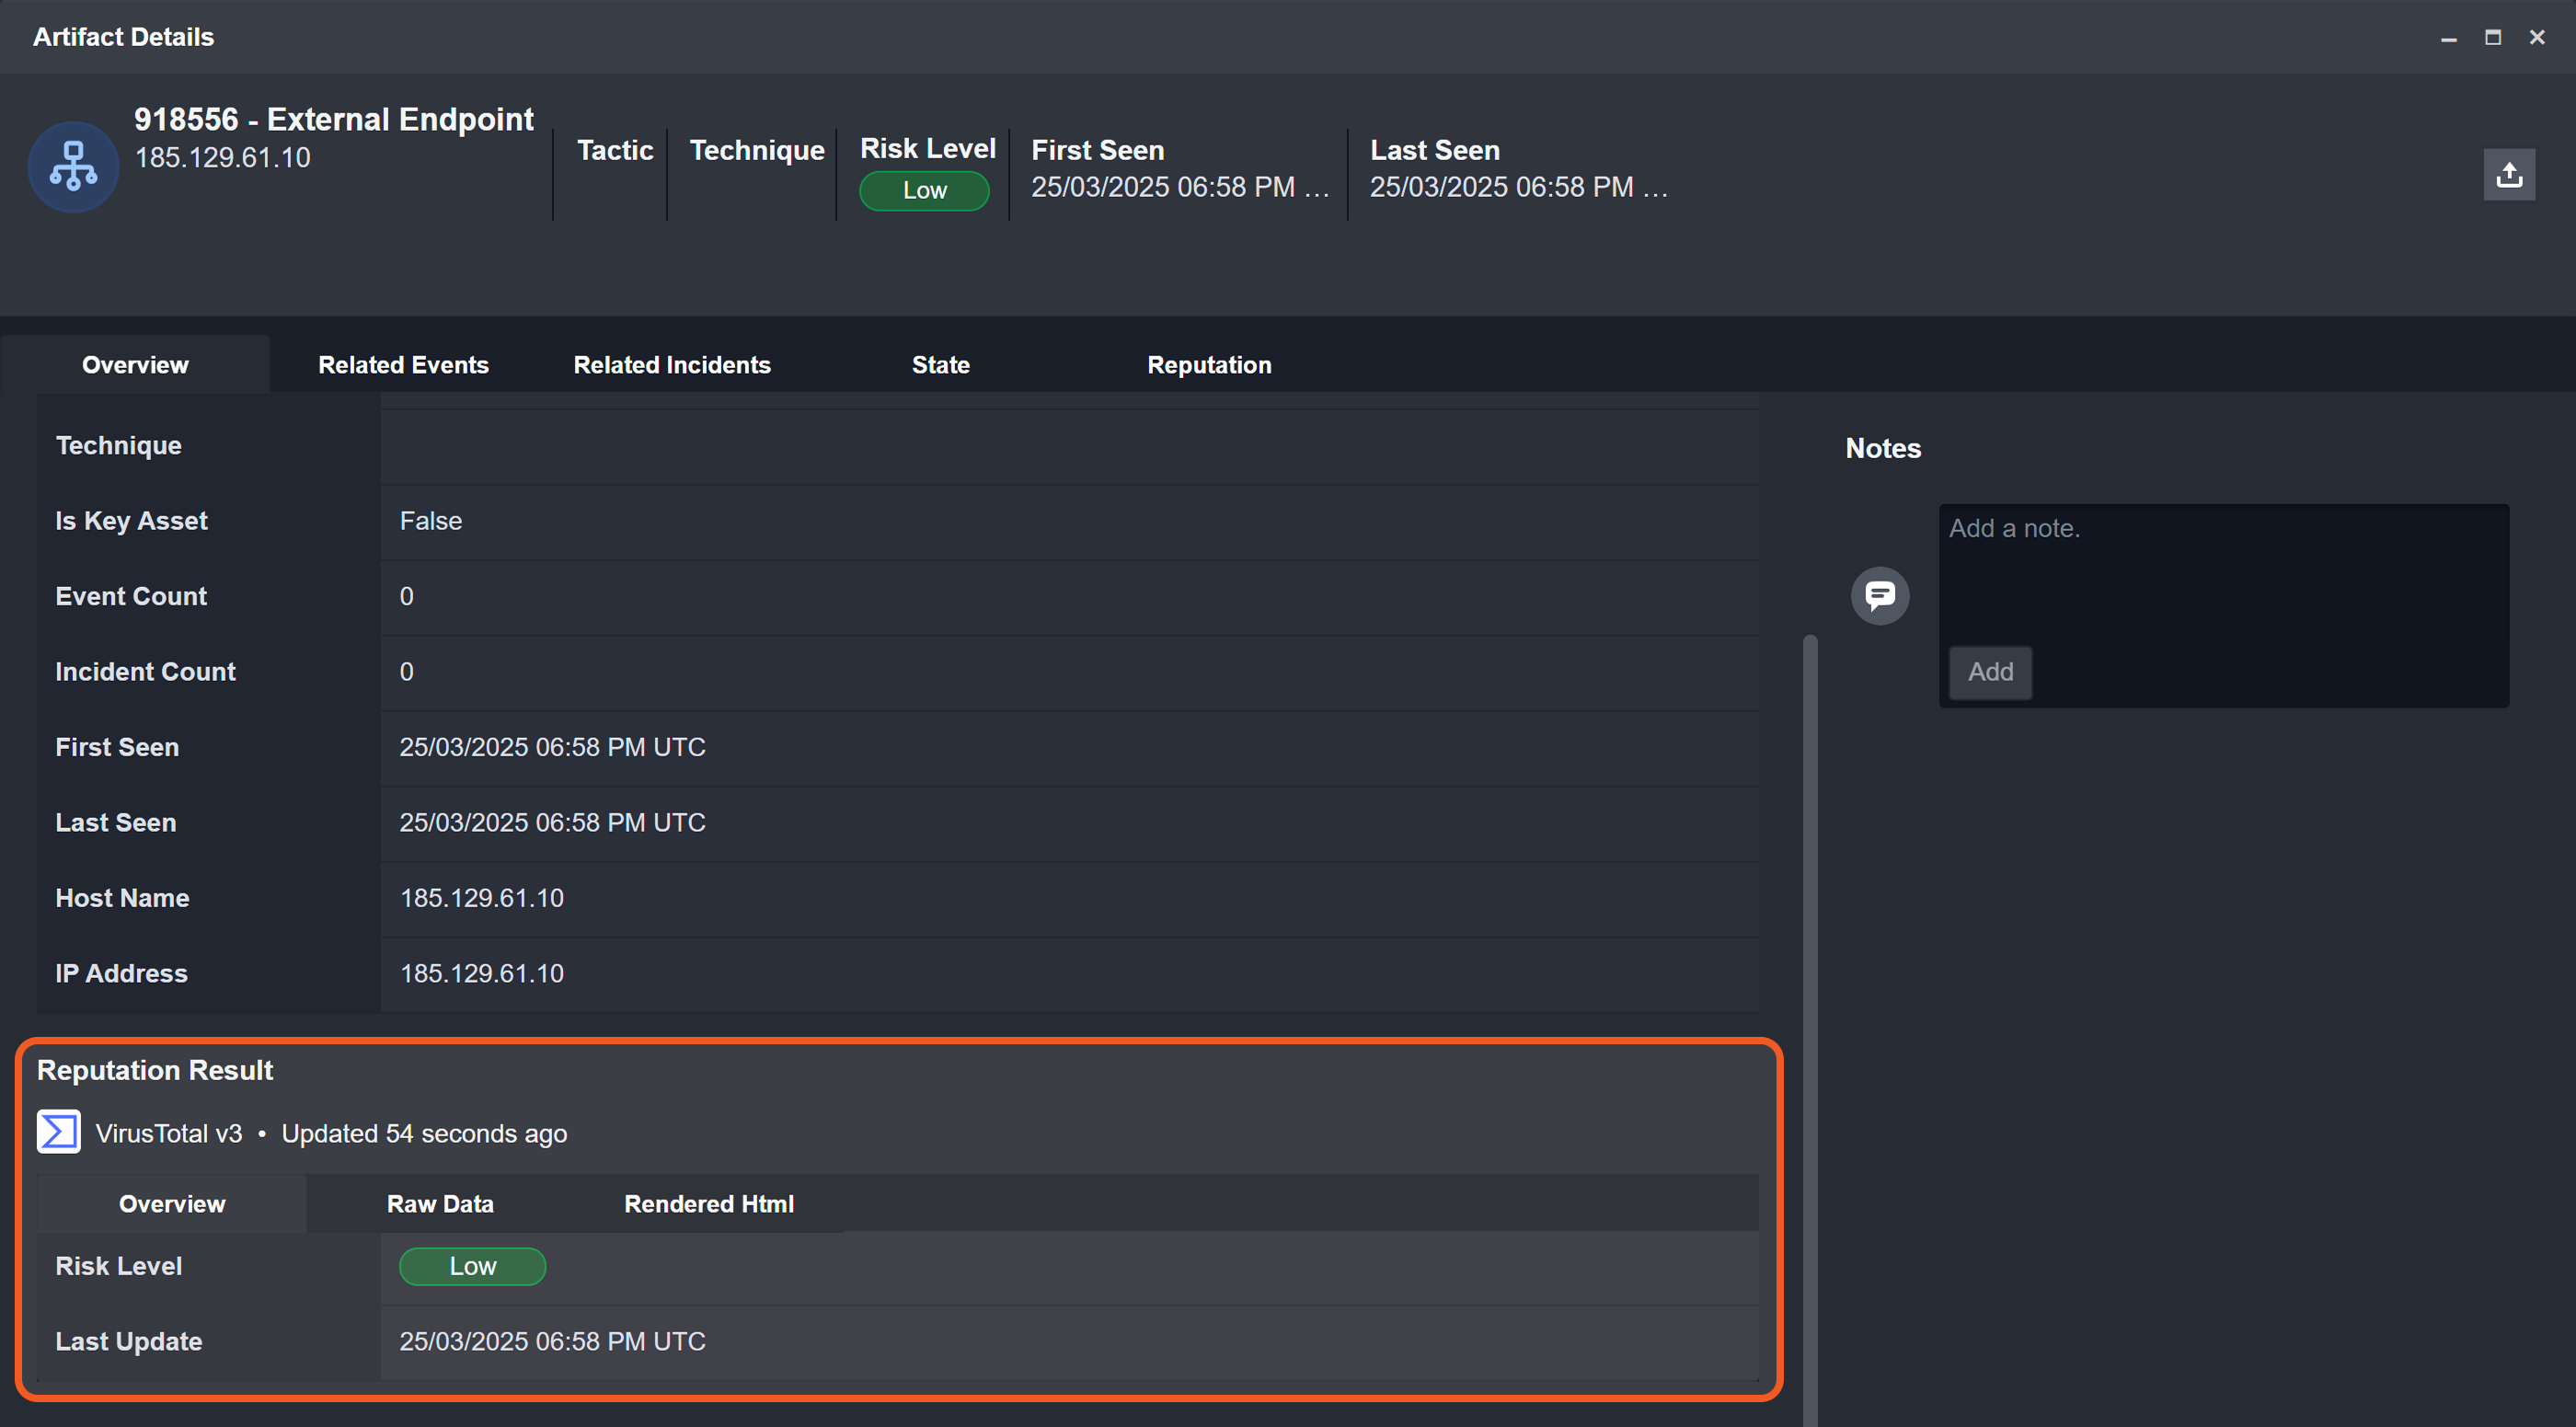
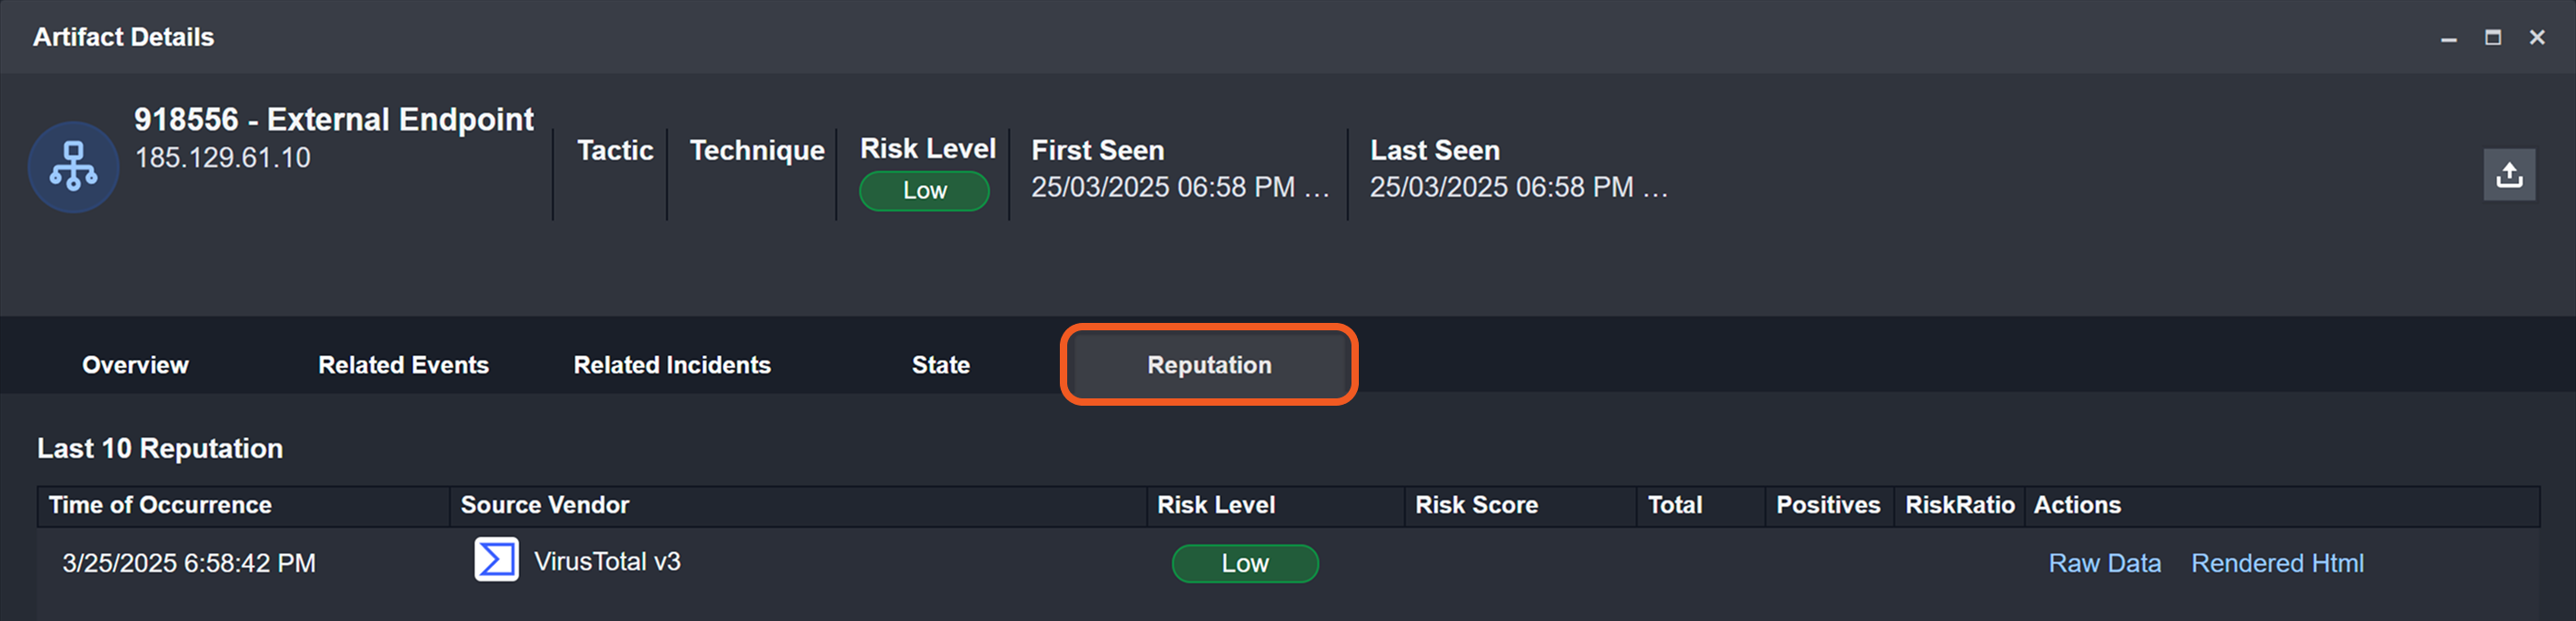
If the command execution was successful, the updated reputation details are displayed in a dedicated section on the Overview (only shows the most updated data) and in the Reputation tab (also shows historical data) within the Artifact Details pop-up window.
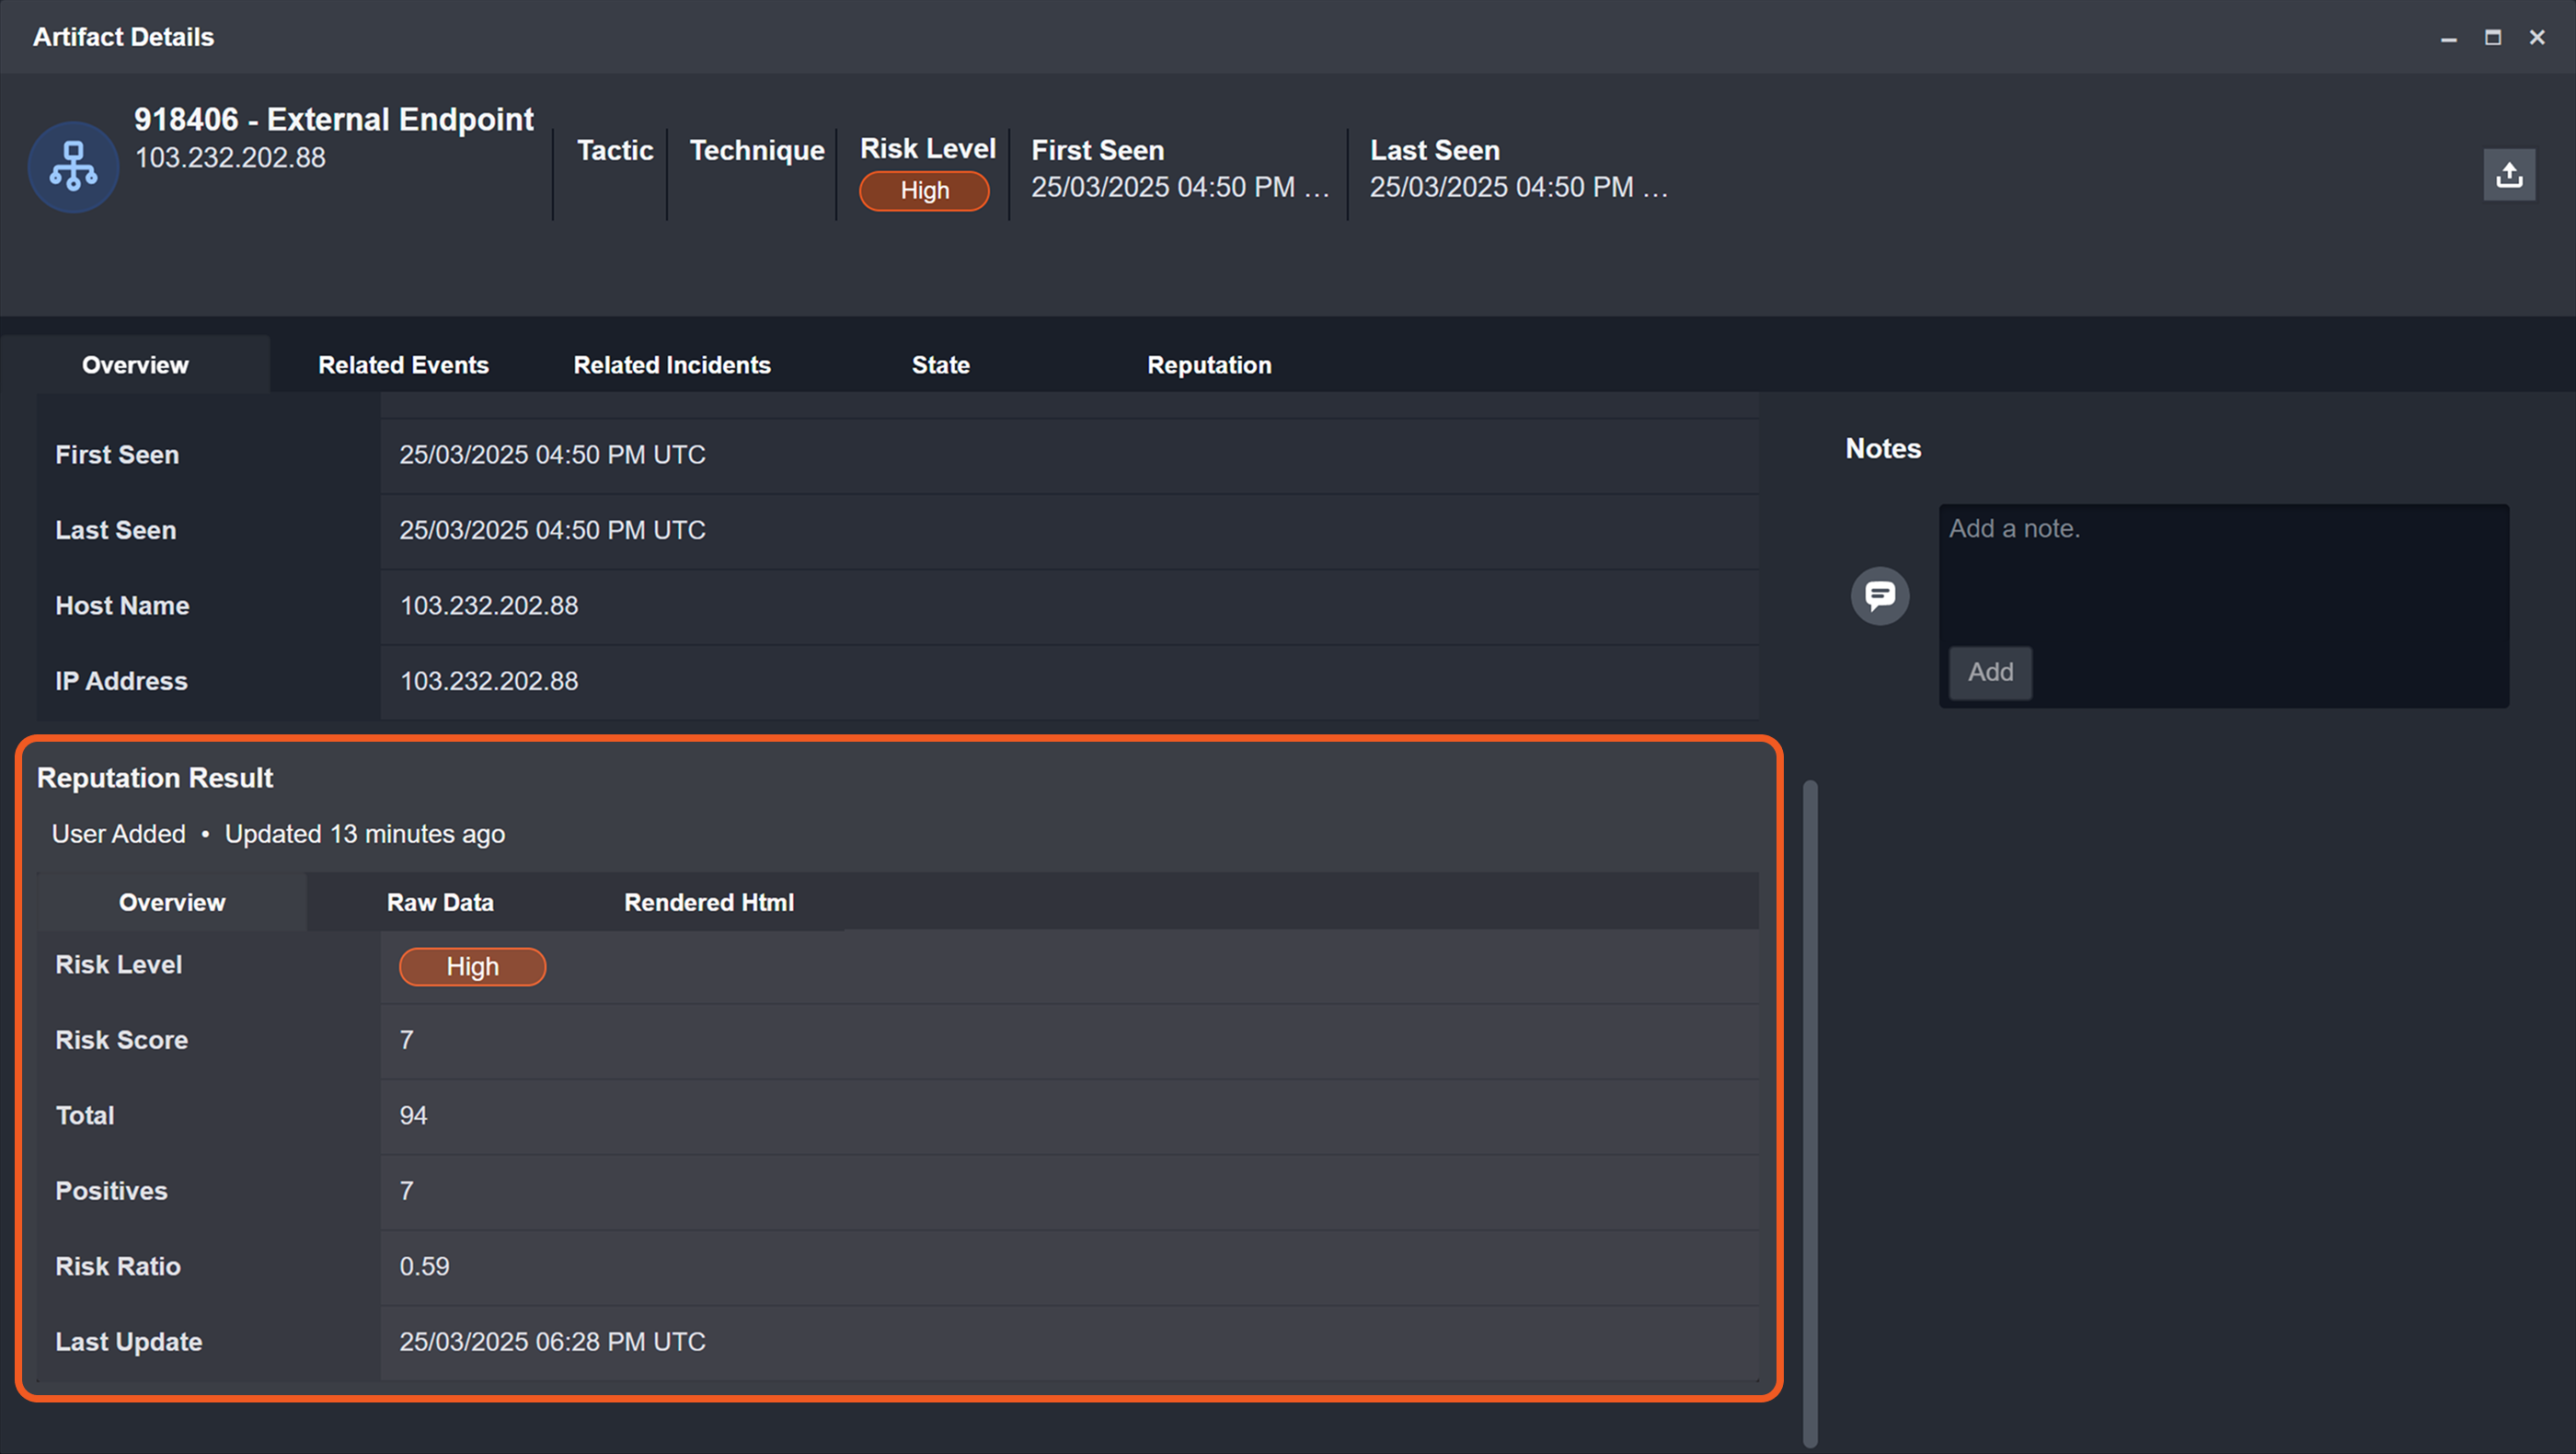
The details displayed in the Reputation Result section in the Overview tab.
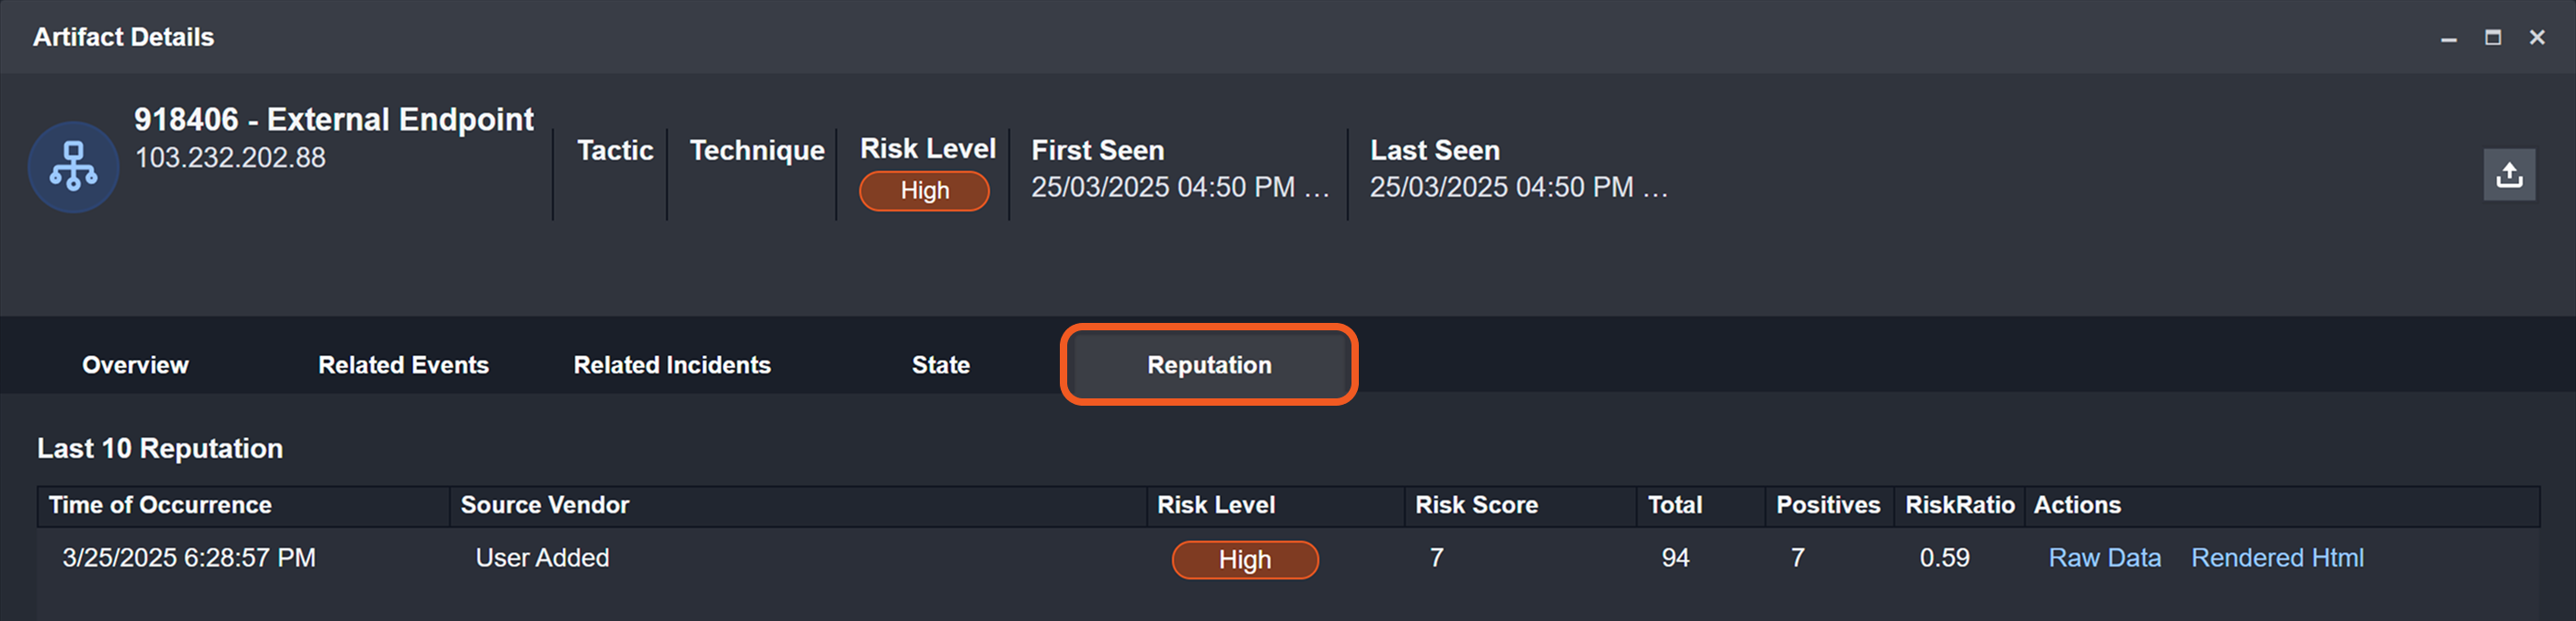
The details displayed in the Reputation tab.
Adding or Updating Artifact Reputation with a Check Reputation Command
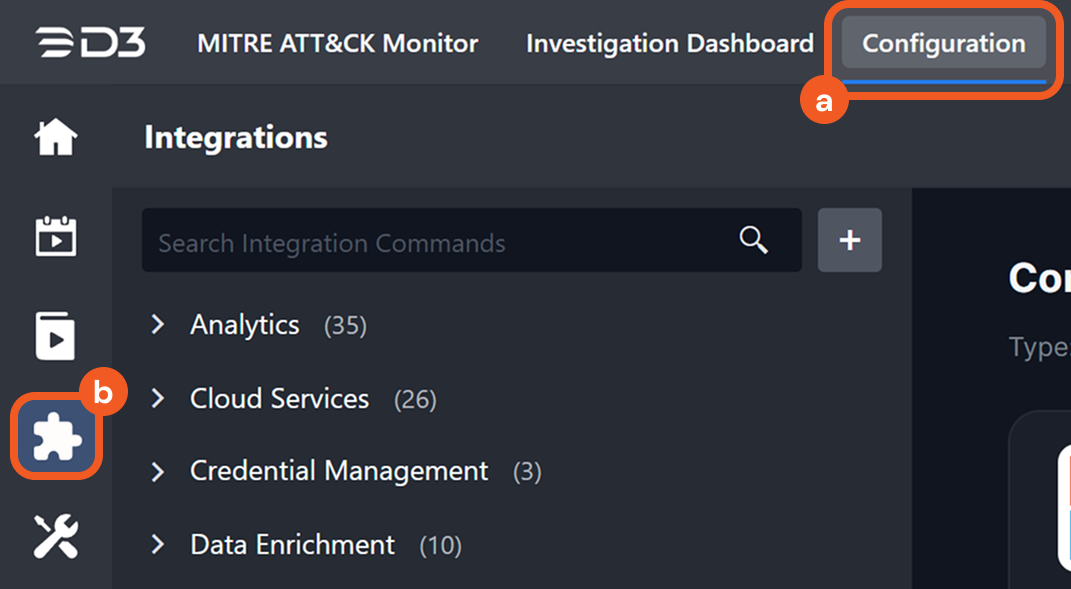
Navigate to the Configuration module, then click the Integrations sub-module.
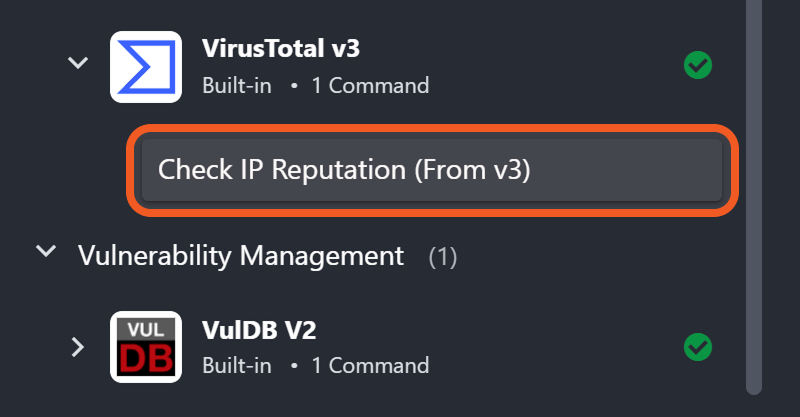
Select a check reputation command, such as VirusTotal v3’s Check IP Reputation command.
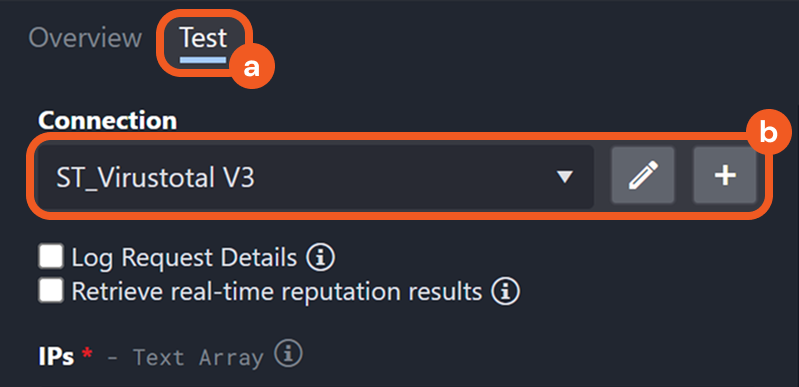
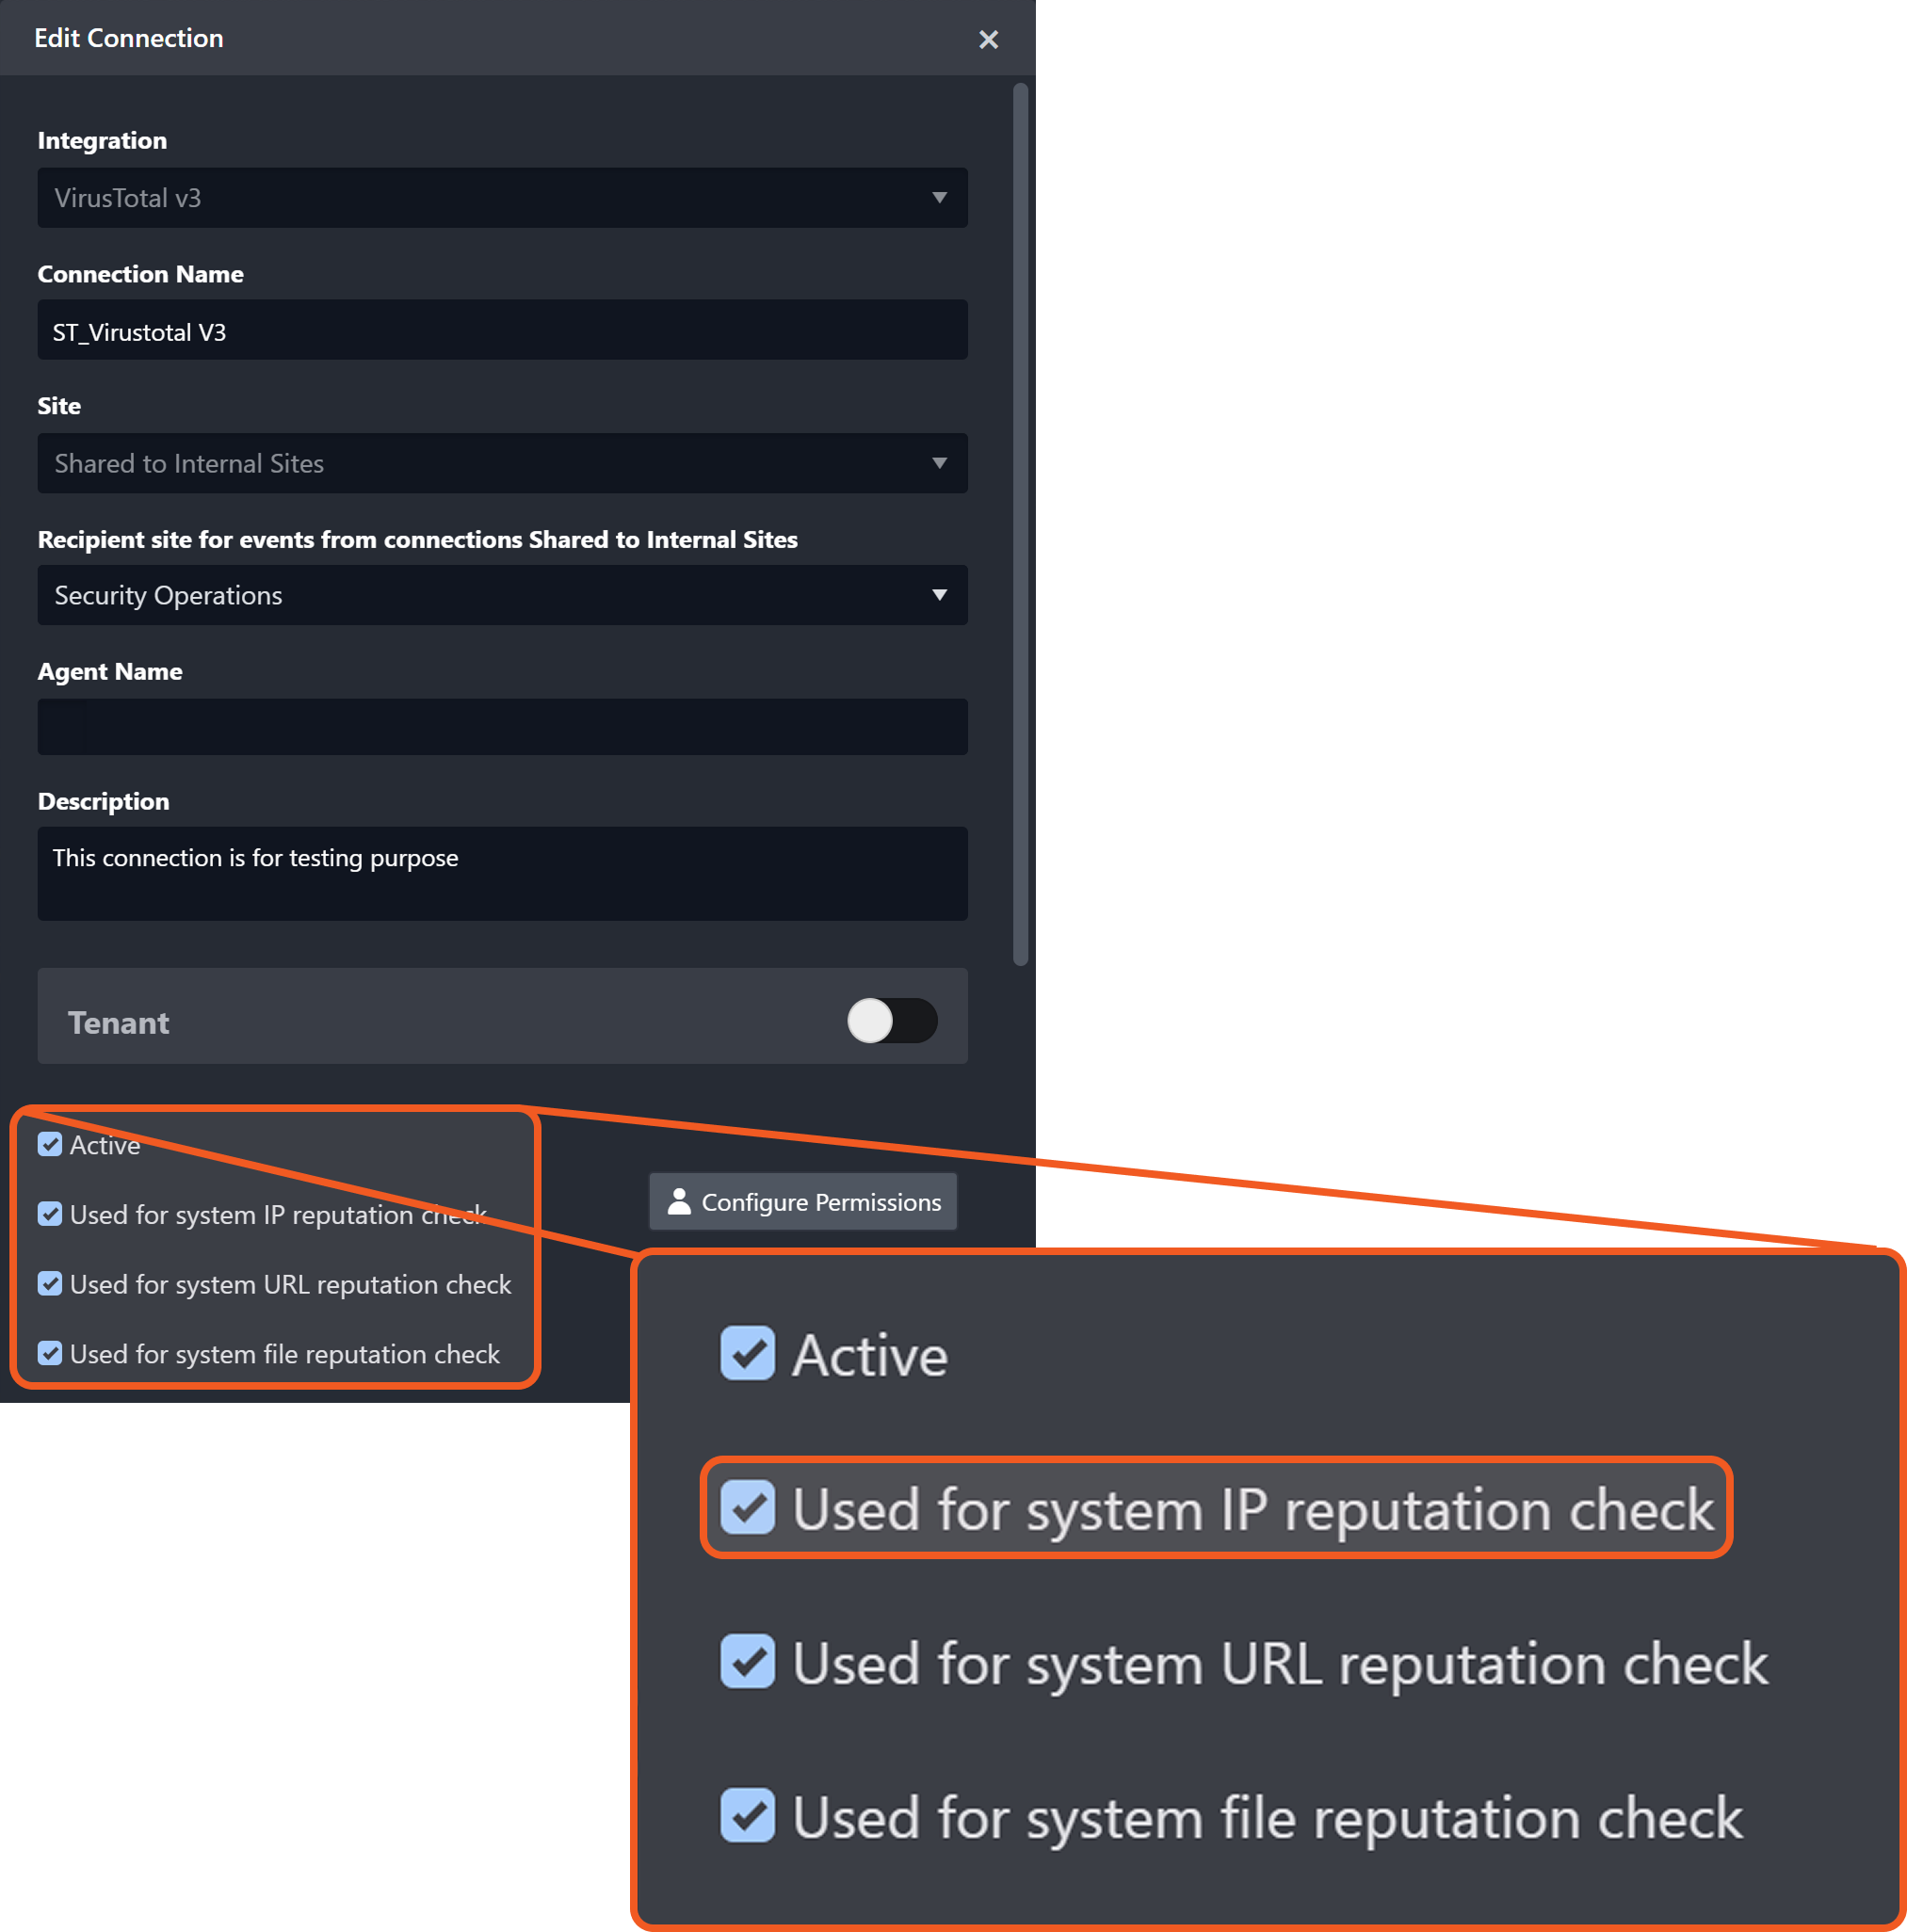
Click the Test tab, then add or select a connection.
Ensure that the chosen connection is allowed to run system IP reputation checks by selecting the Used for system IP reputation check checkbox on the edit or add connection form.
(Optional) Select the Retrieve real-time reputation results checkbox.
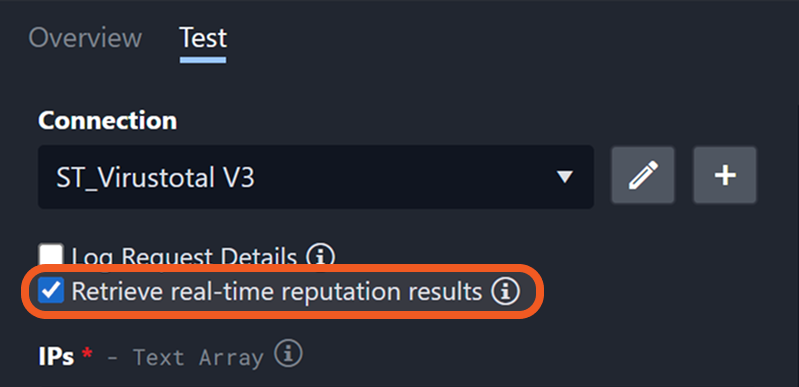
If users select the checkbox, the command will perform a live query for reputation data instead of retrieving cached results. Refer to Retrieve Real Time Reputation Results for details.
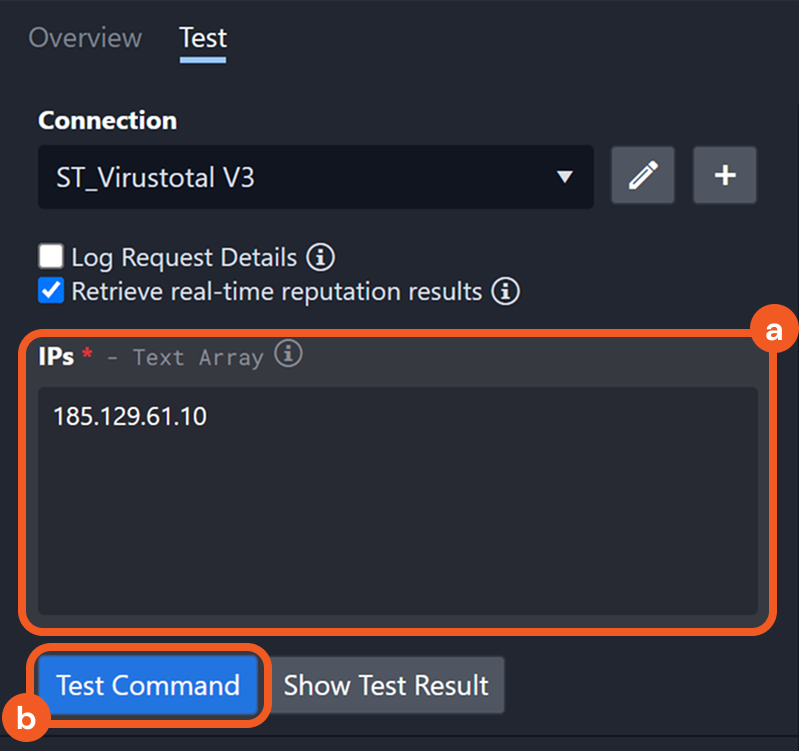
Fill the input parameters as necessary, then click the Test Command button.
Navigate to the Investigation Dashboard module, select the site, then choose the All Artifacts view.
Search for the artifact by its name and click the matching result.
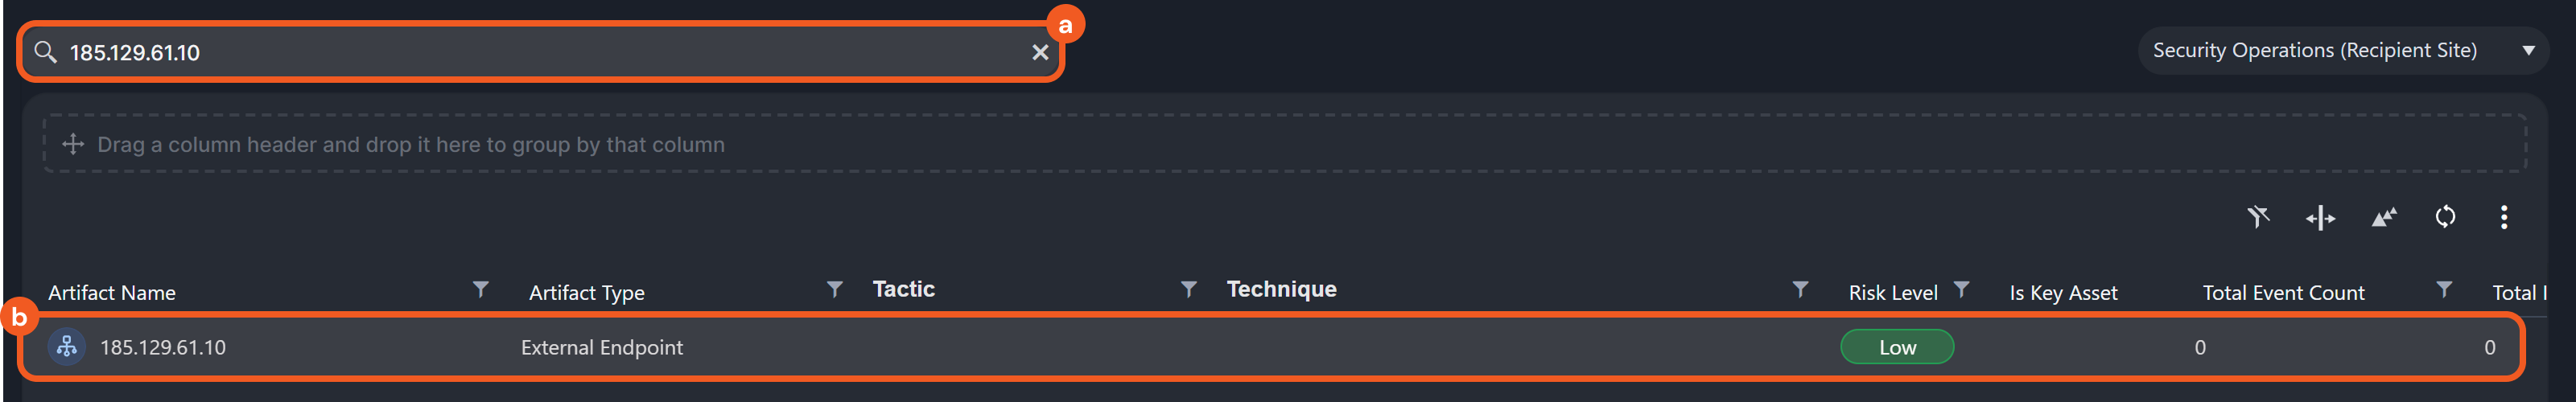
RESULT
If the command executed successfully, the reputation details of the artifact will be updated and displayed in a dedicated section on the Overview tab (only shows the most updated data) and in the Reputation tab (also shows historical data) within the Artifact Details pop-up window.
The reputation details updated by the Check IP Reputation command displayed in the Reputation Result section in the Overview tab.
The reputation details updated by the Check IP Reputation command displayed in the Reputation tab.
Download Button for Query Results
Users can now download query results in the Reporting Dashboard as a .xlsx file by clicking the Download button. They can download results after running a query or from an existing widget on the dashboard.
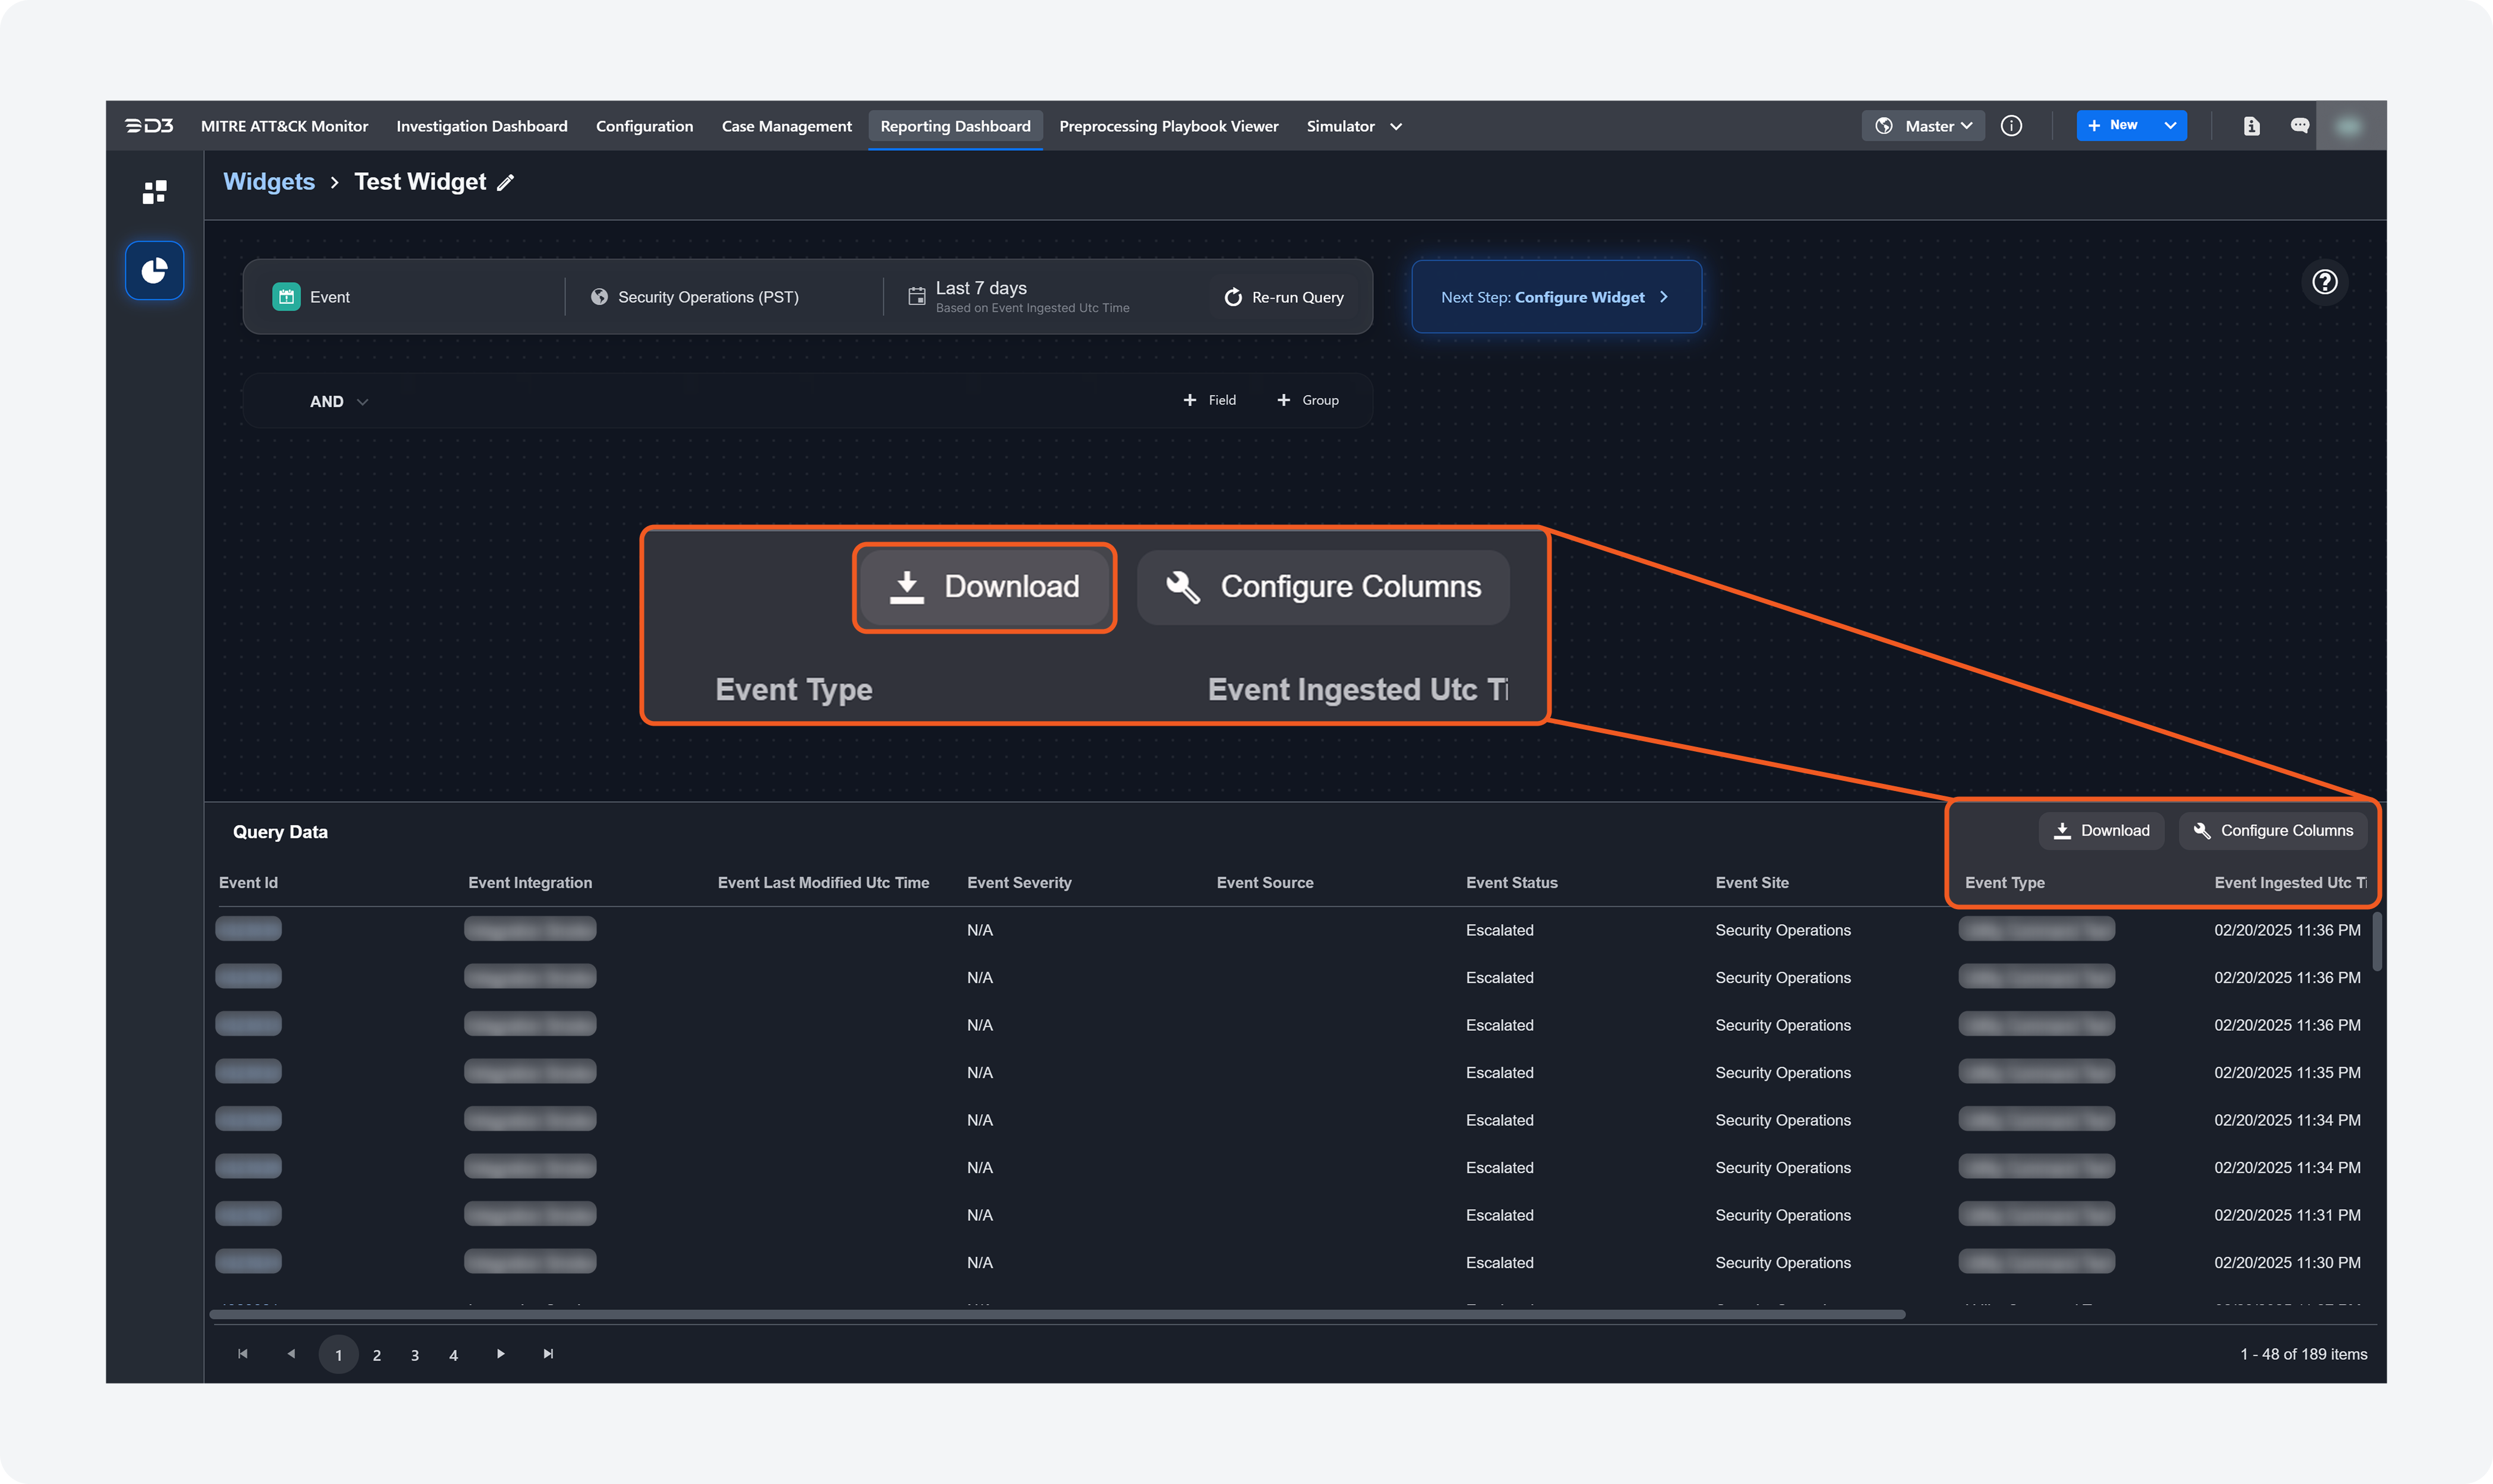
After Running a Query
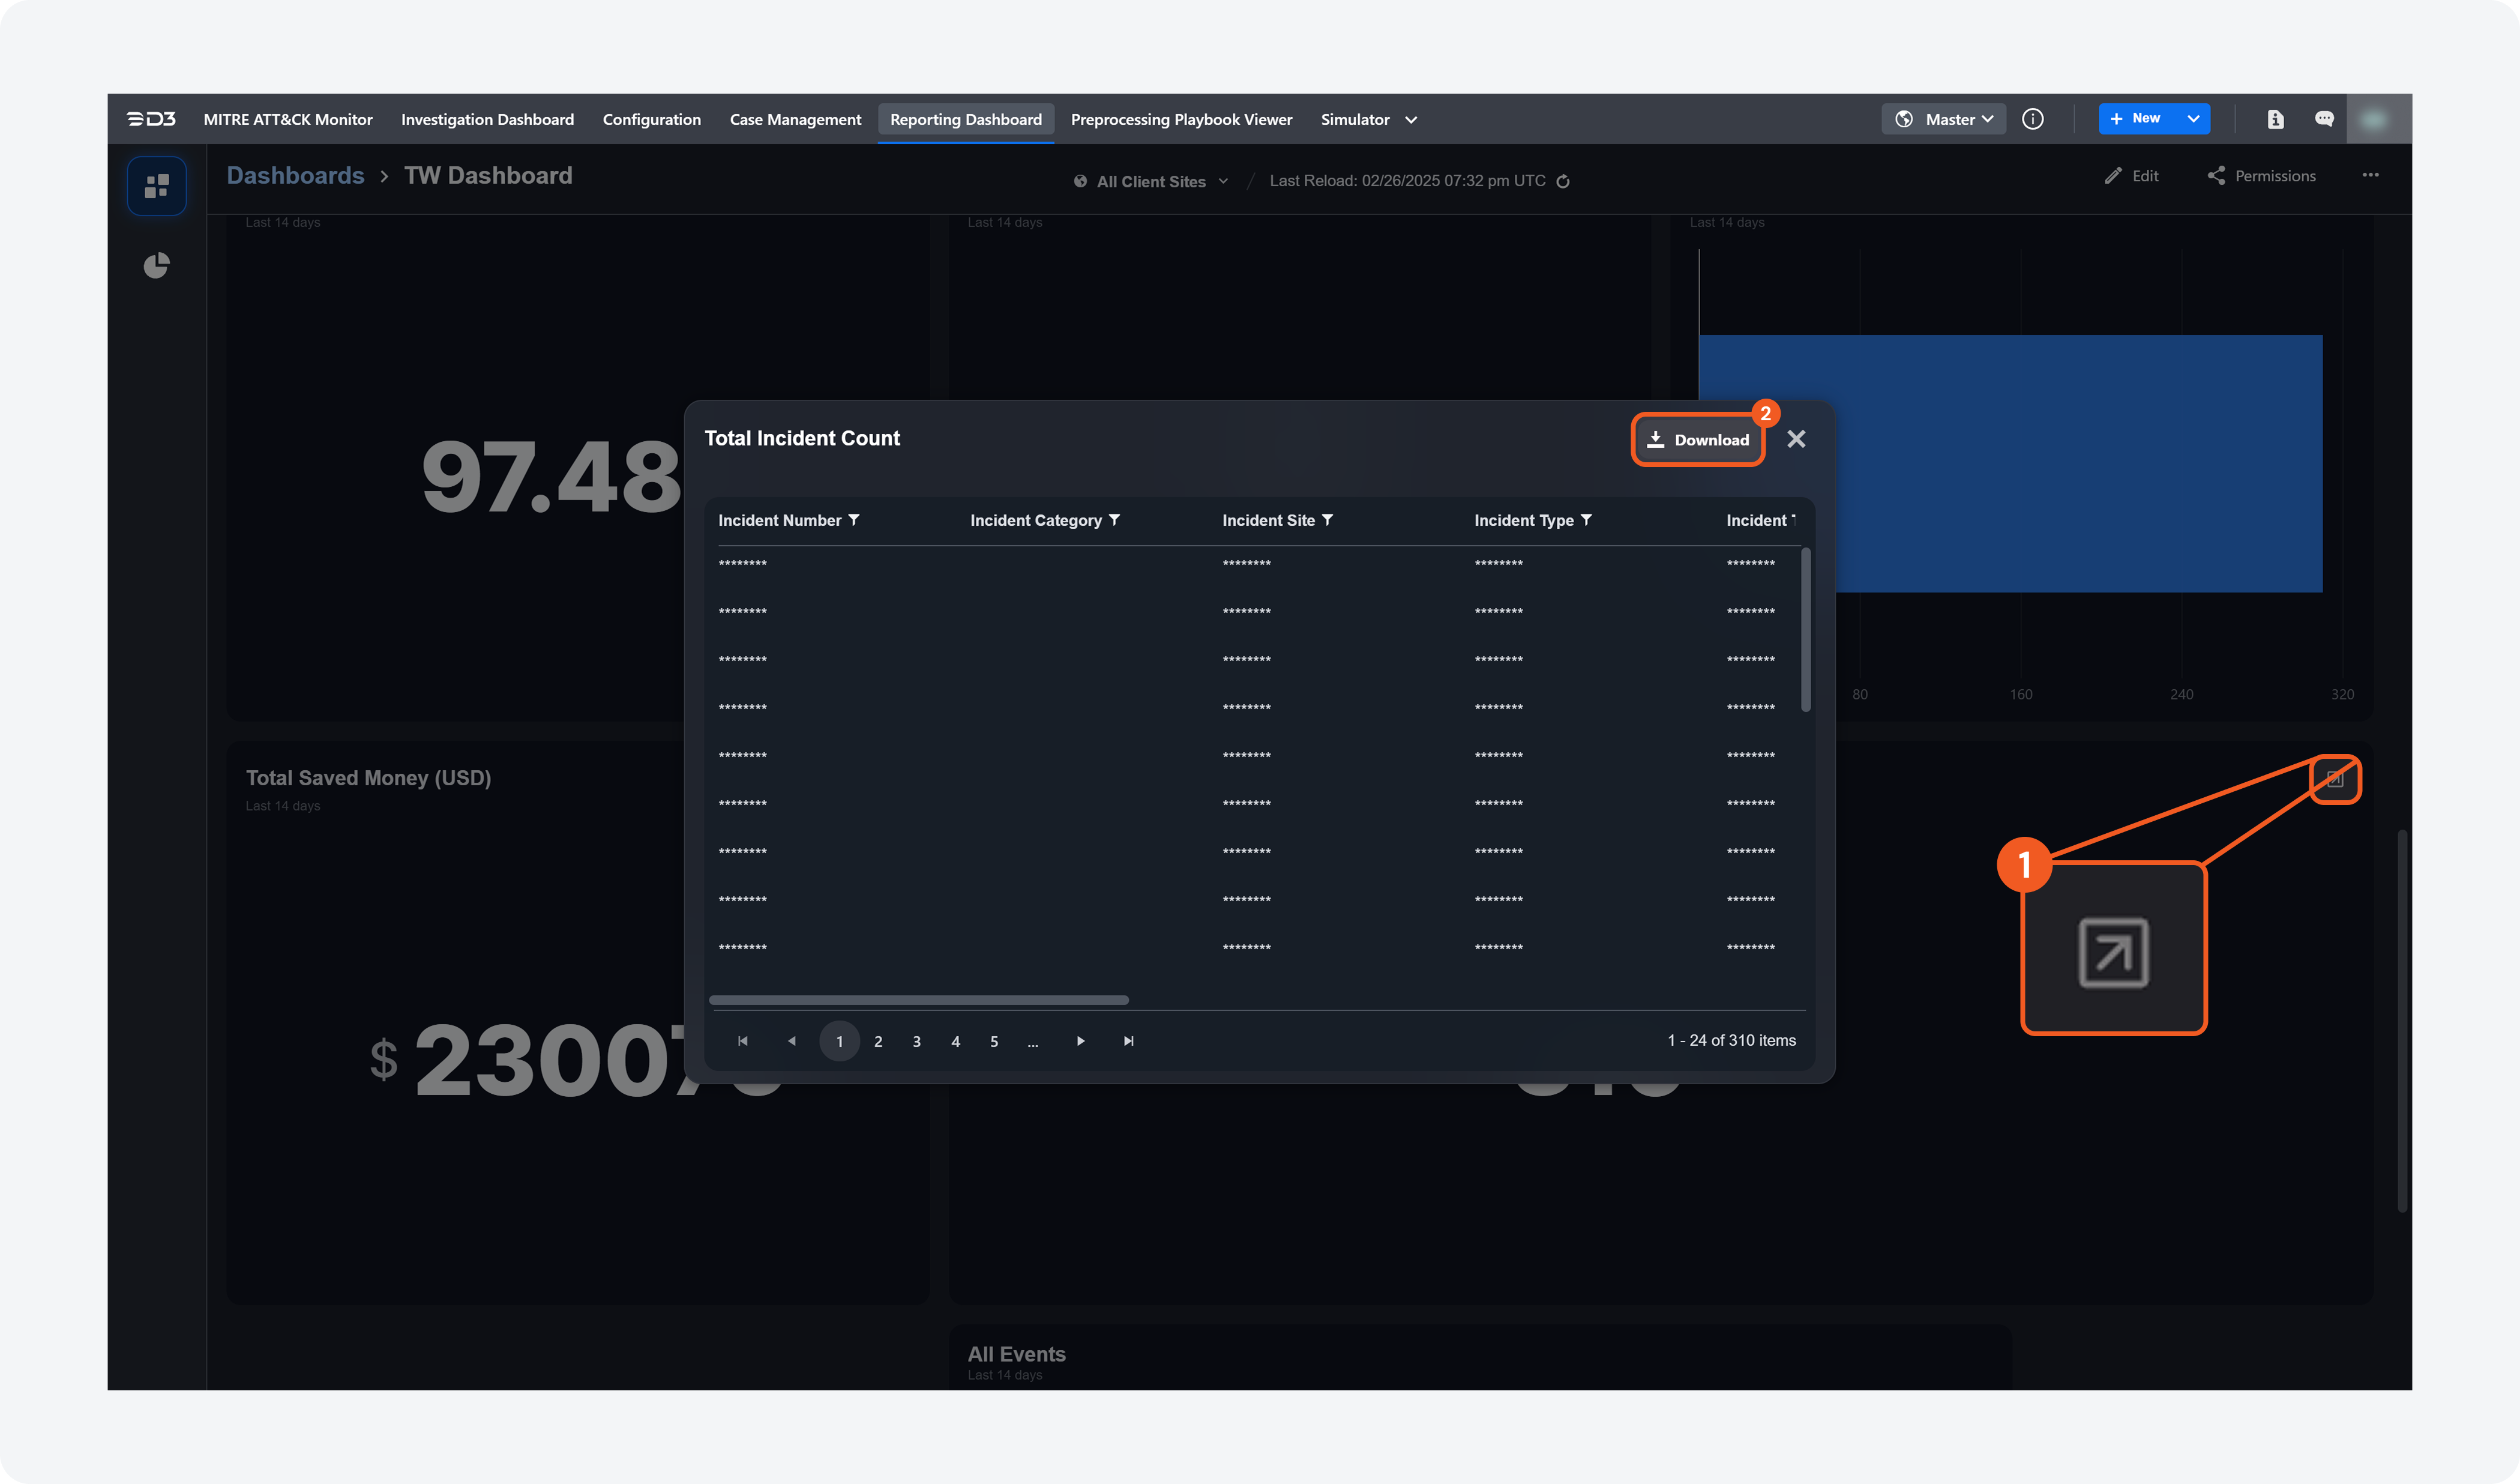
From Existing Widget
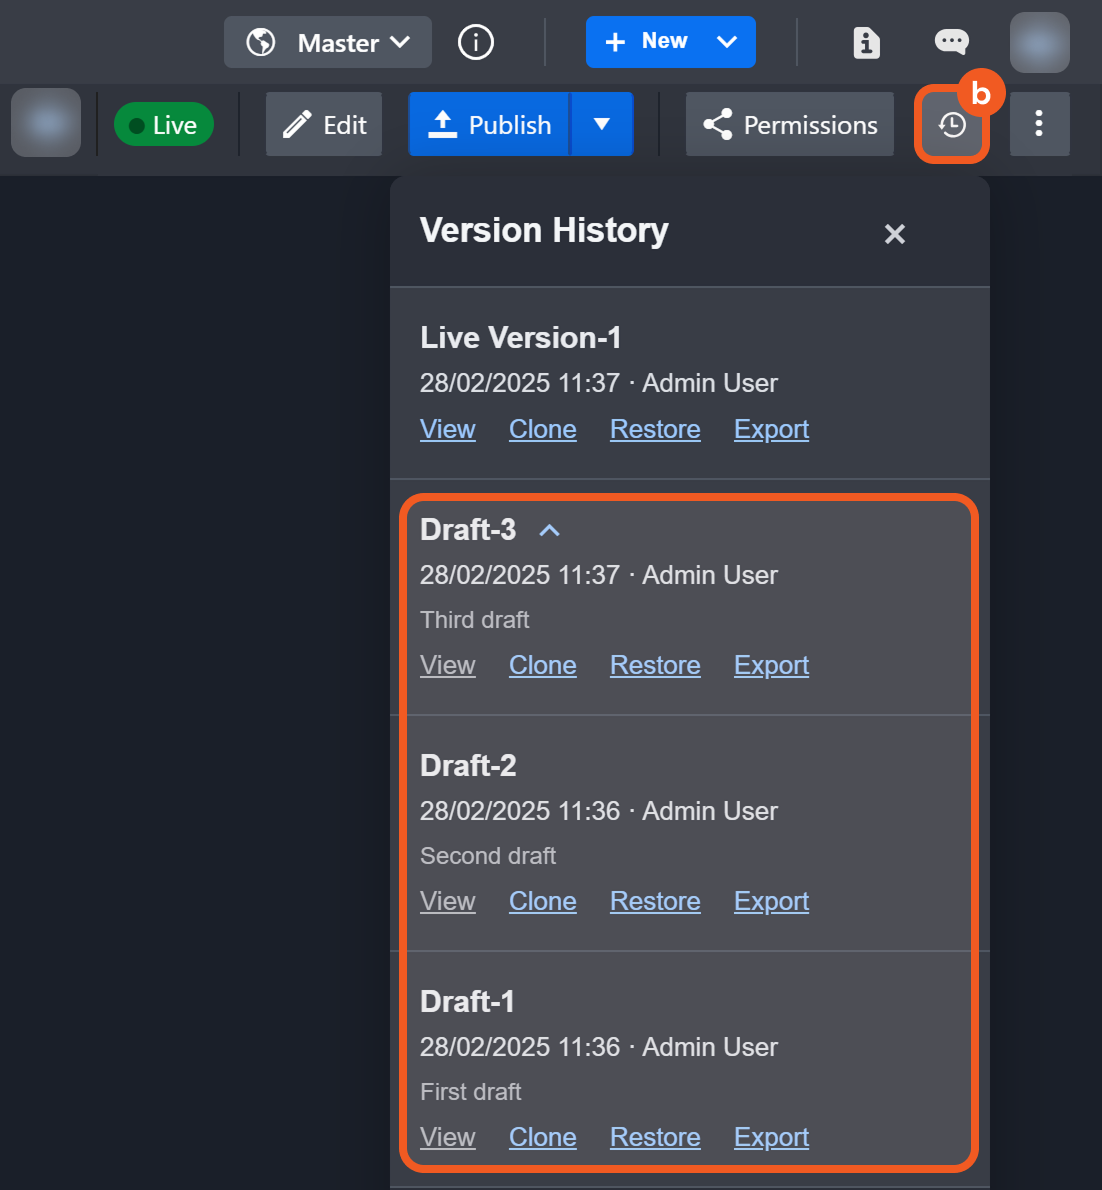
Save Draft
Previously, version history was limited to live playbooks. A Save Draft button has been introduced for playbooks and user-defined commands, allowing users to save progress without submitting changes.
Before
After

Playbook Dashboard Filters
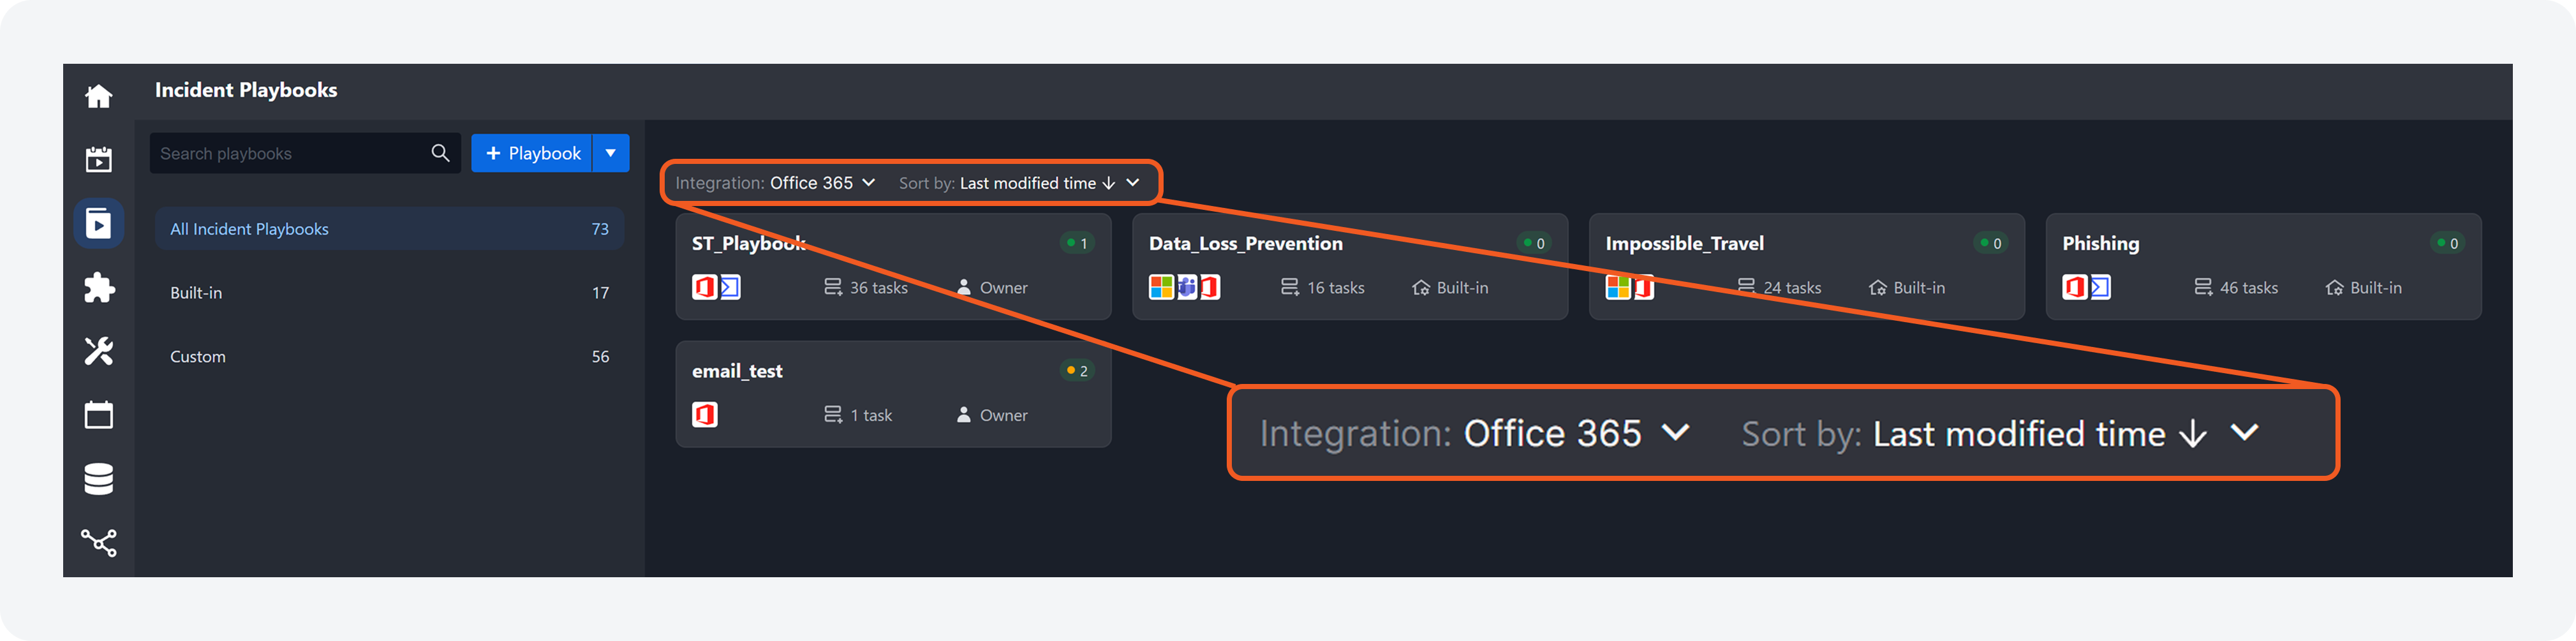
Users can now filter playbooks by integrations used and last modified time on the Incident Playbook and Event Playbook dashboards. These filters are available as dropdown options.
Notification for Triage Updates
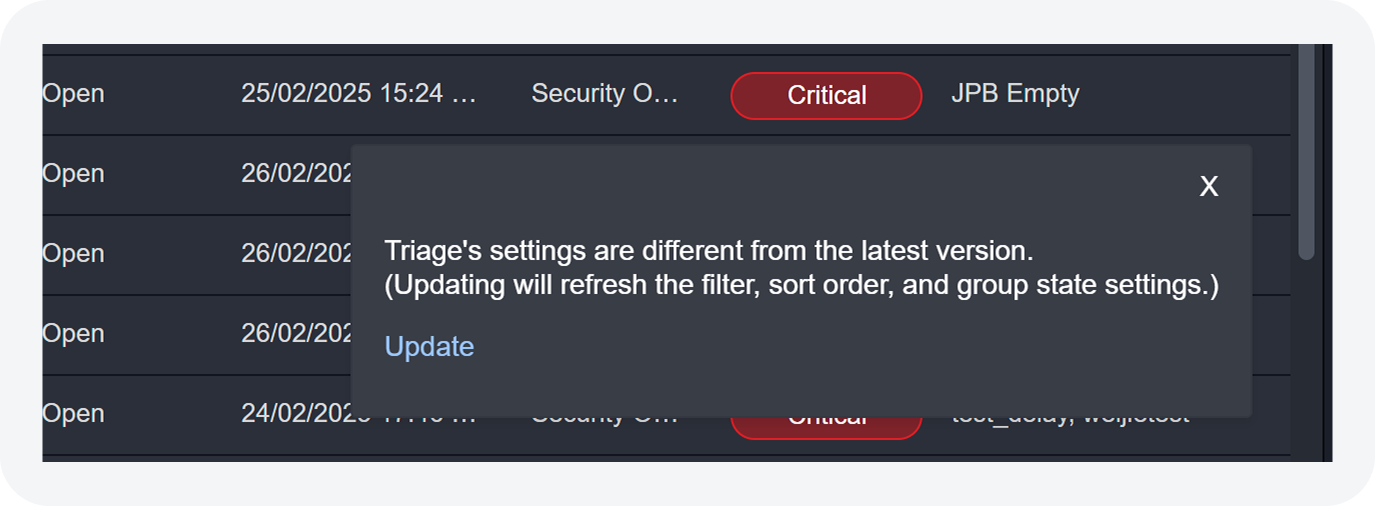
Users viewing a custom triage they do not own will now receive a notification when it is updated or removed by the triage owner. Refer to Editing and Deleting Custom Views for details.
Enhancements
General Enhancements
Investigation Dashboard Custom Triage
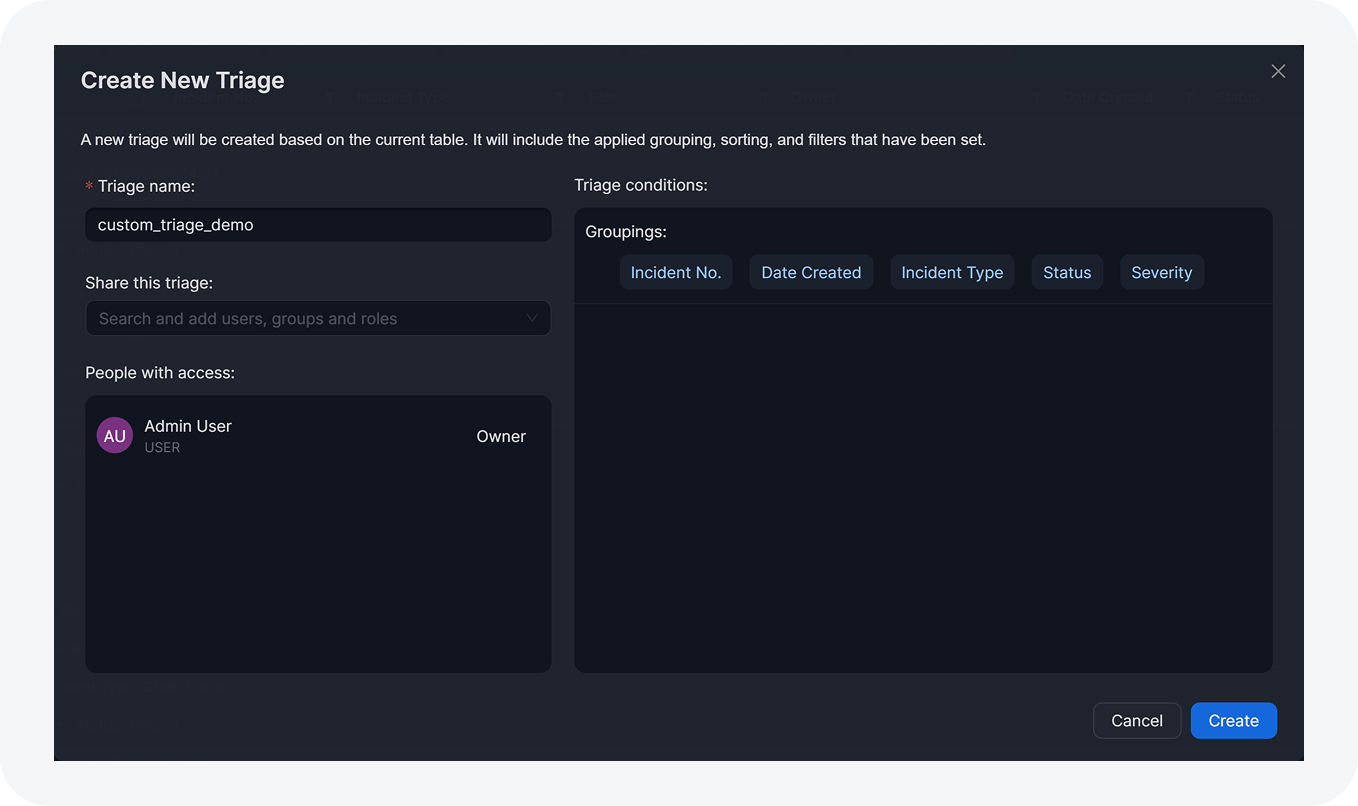
The process for creating and reordering custom triages has been refined for a smoother experience. Refer to Setting Up a Custom Triage for details.
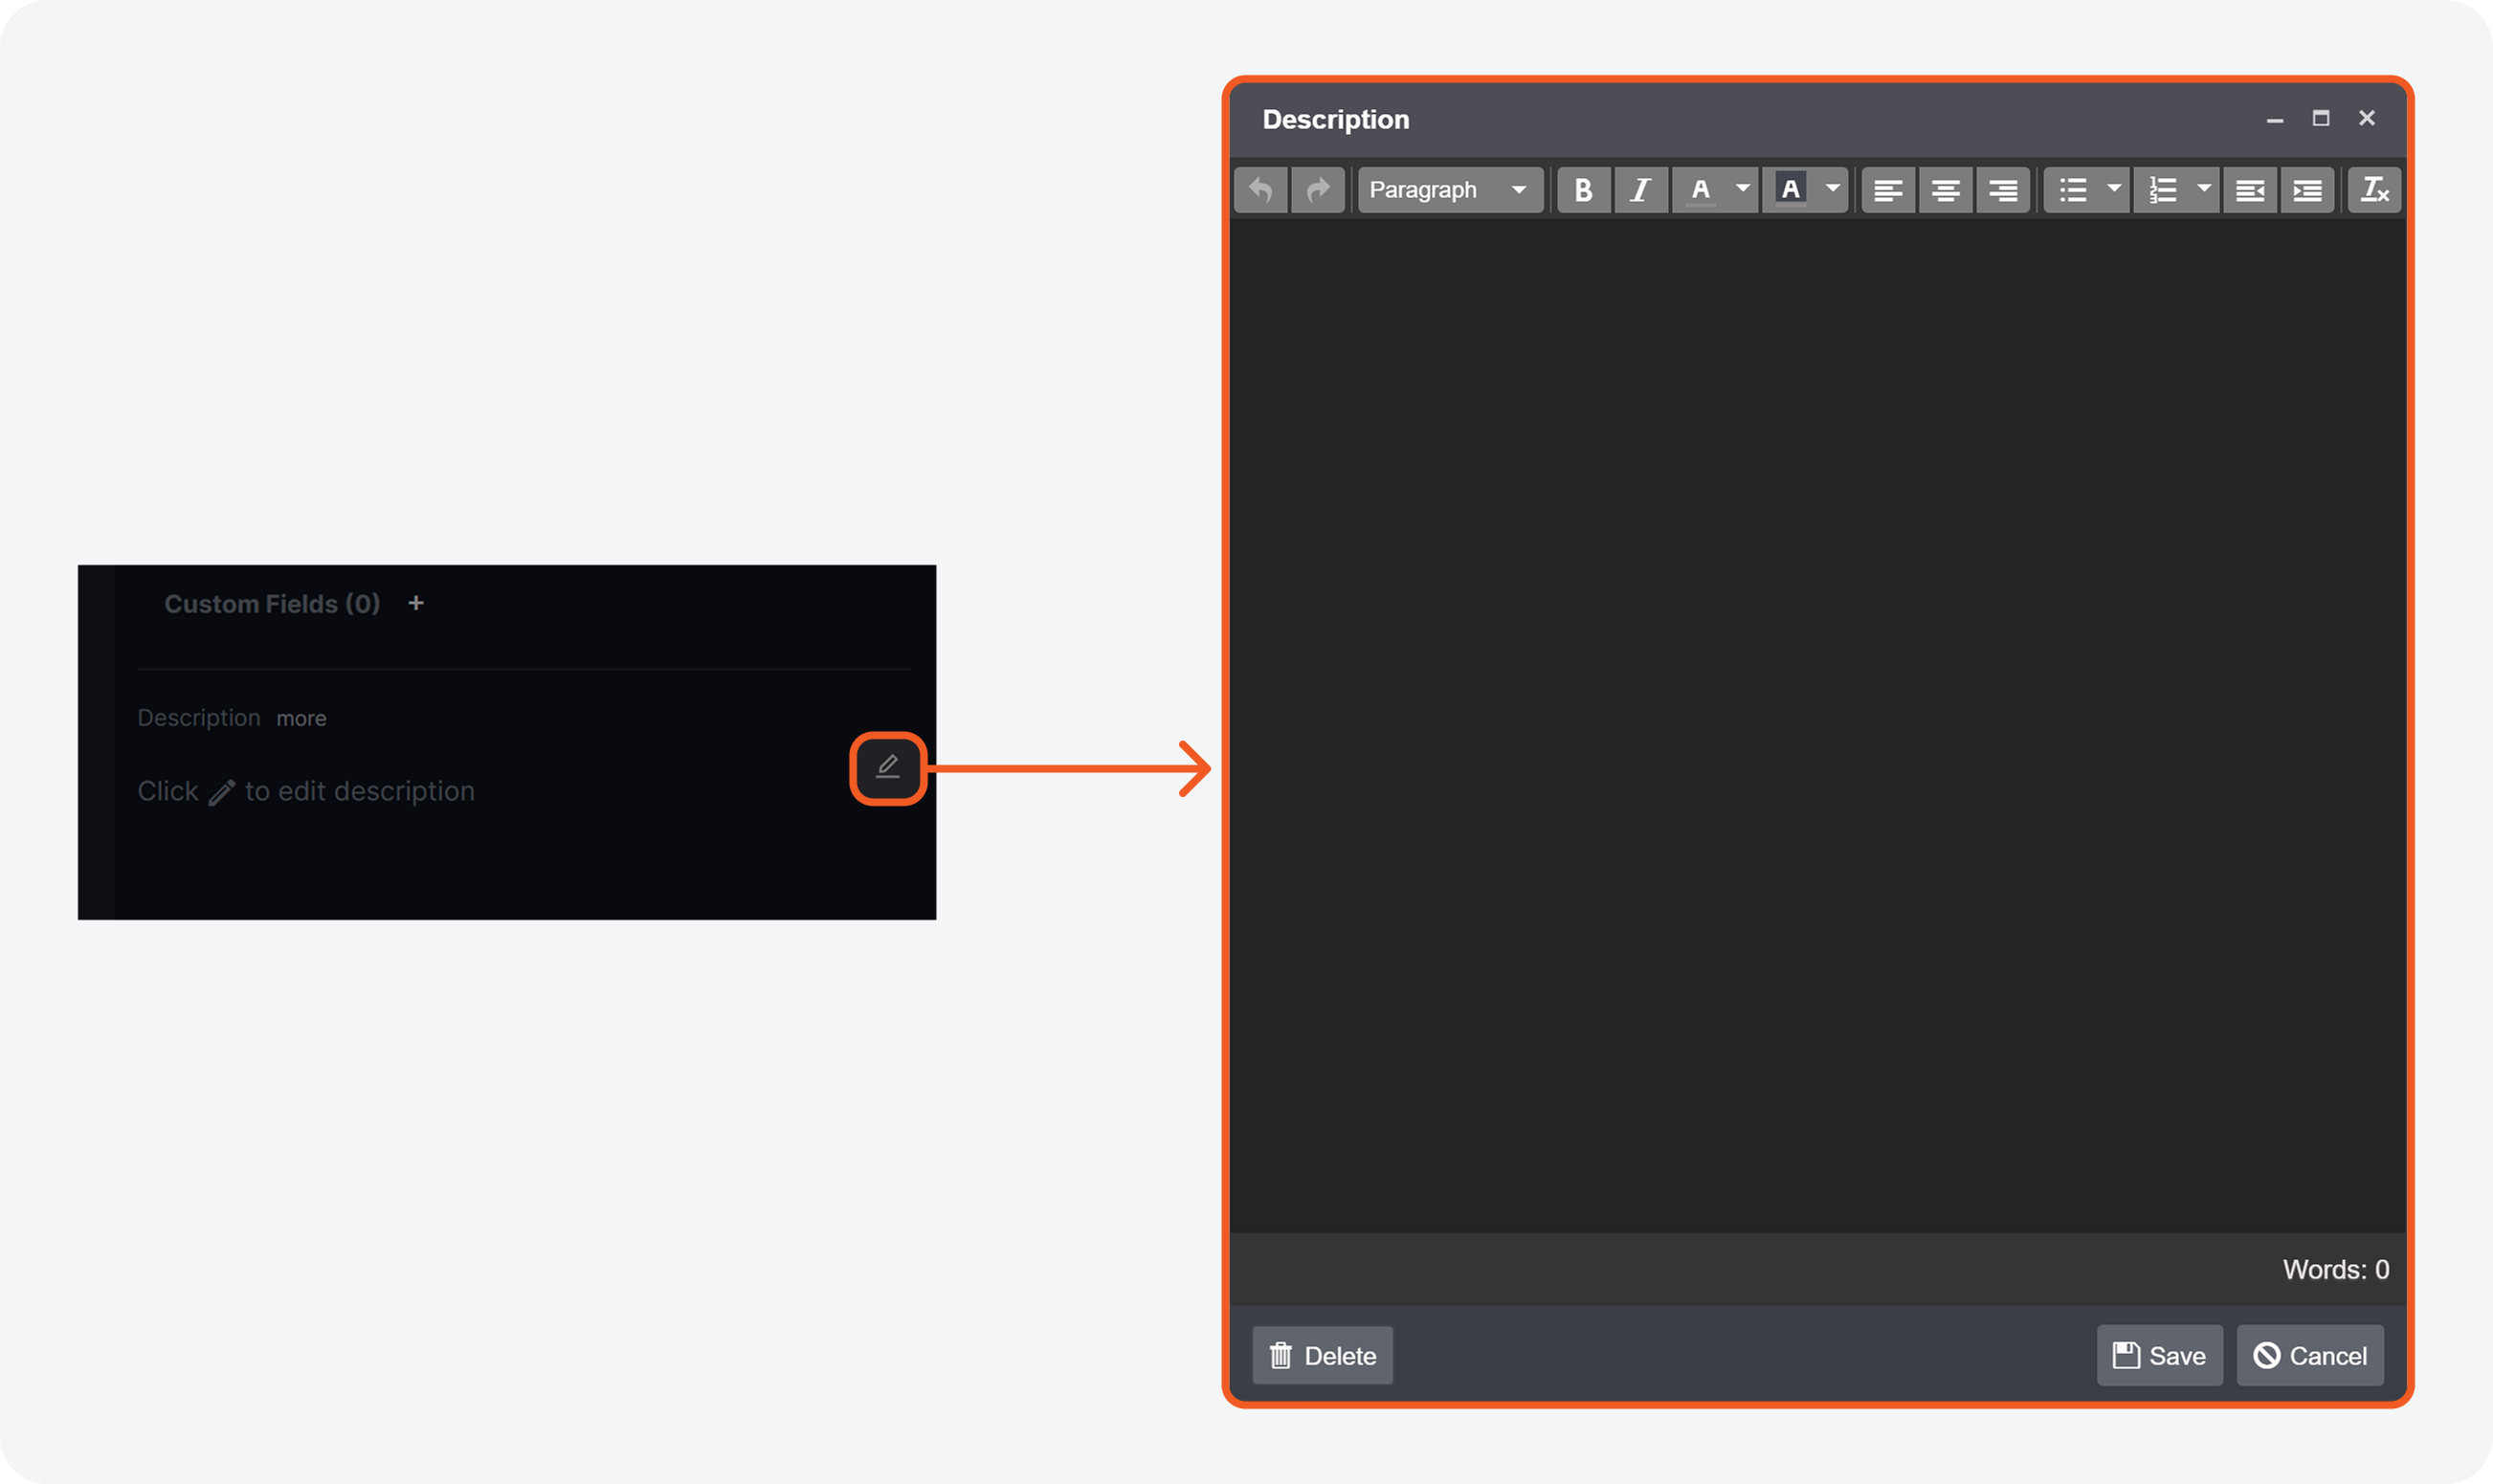
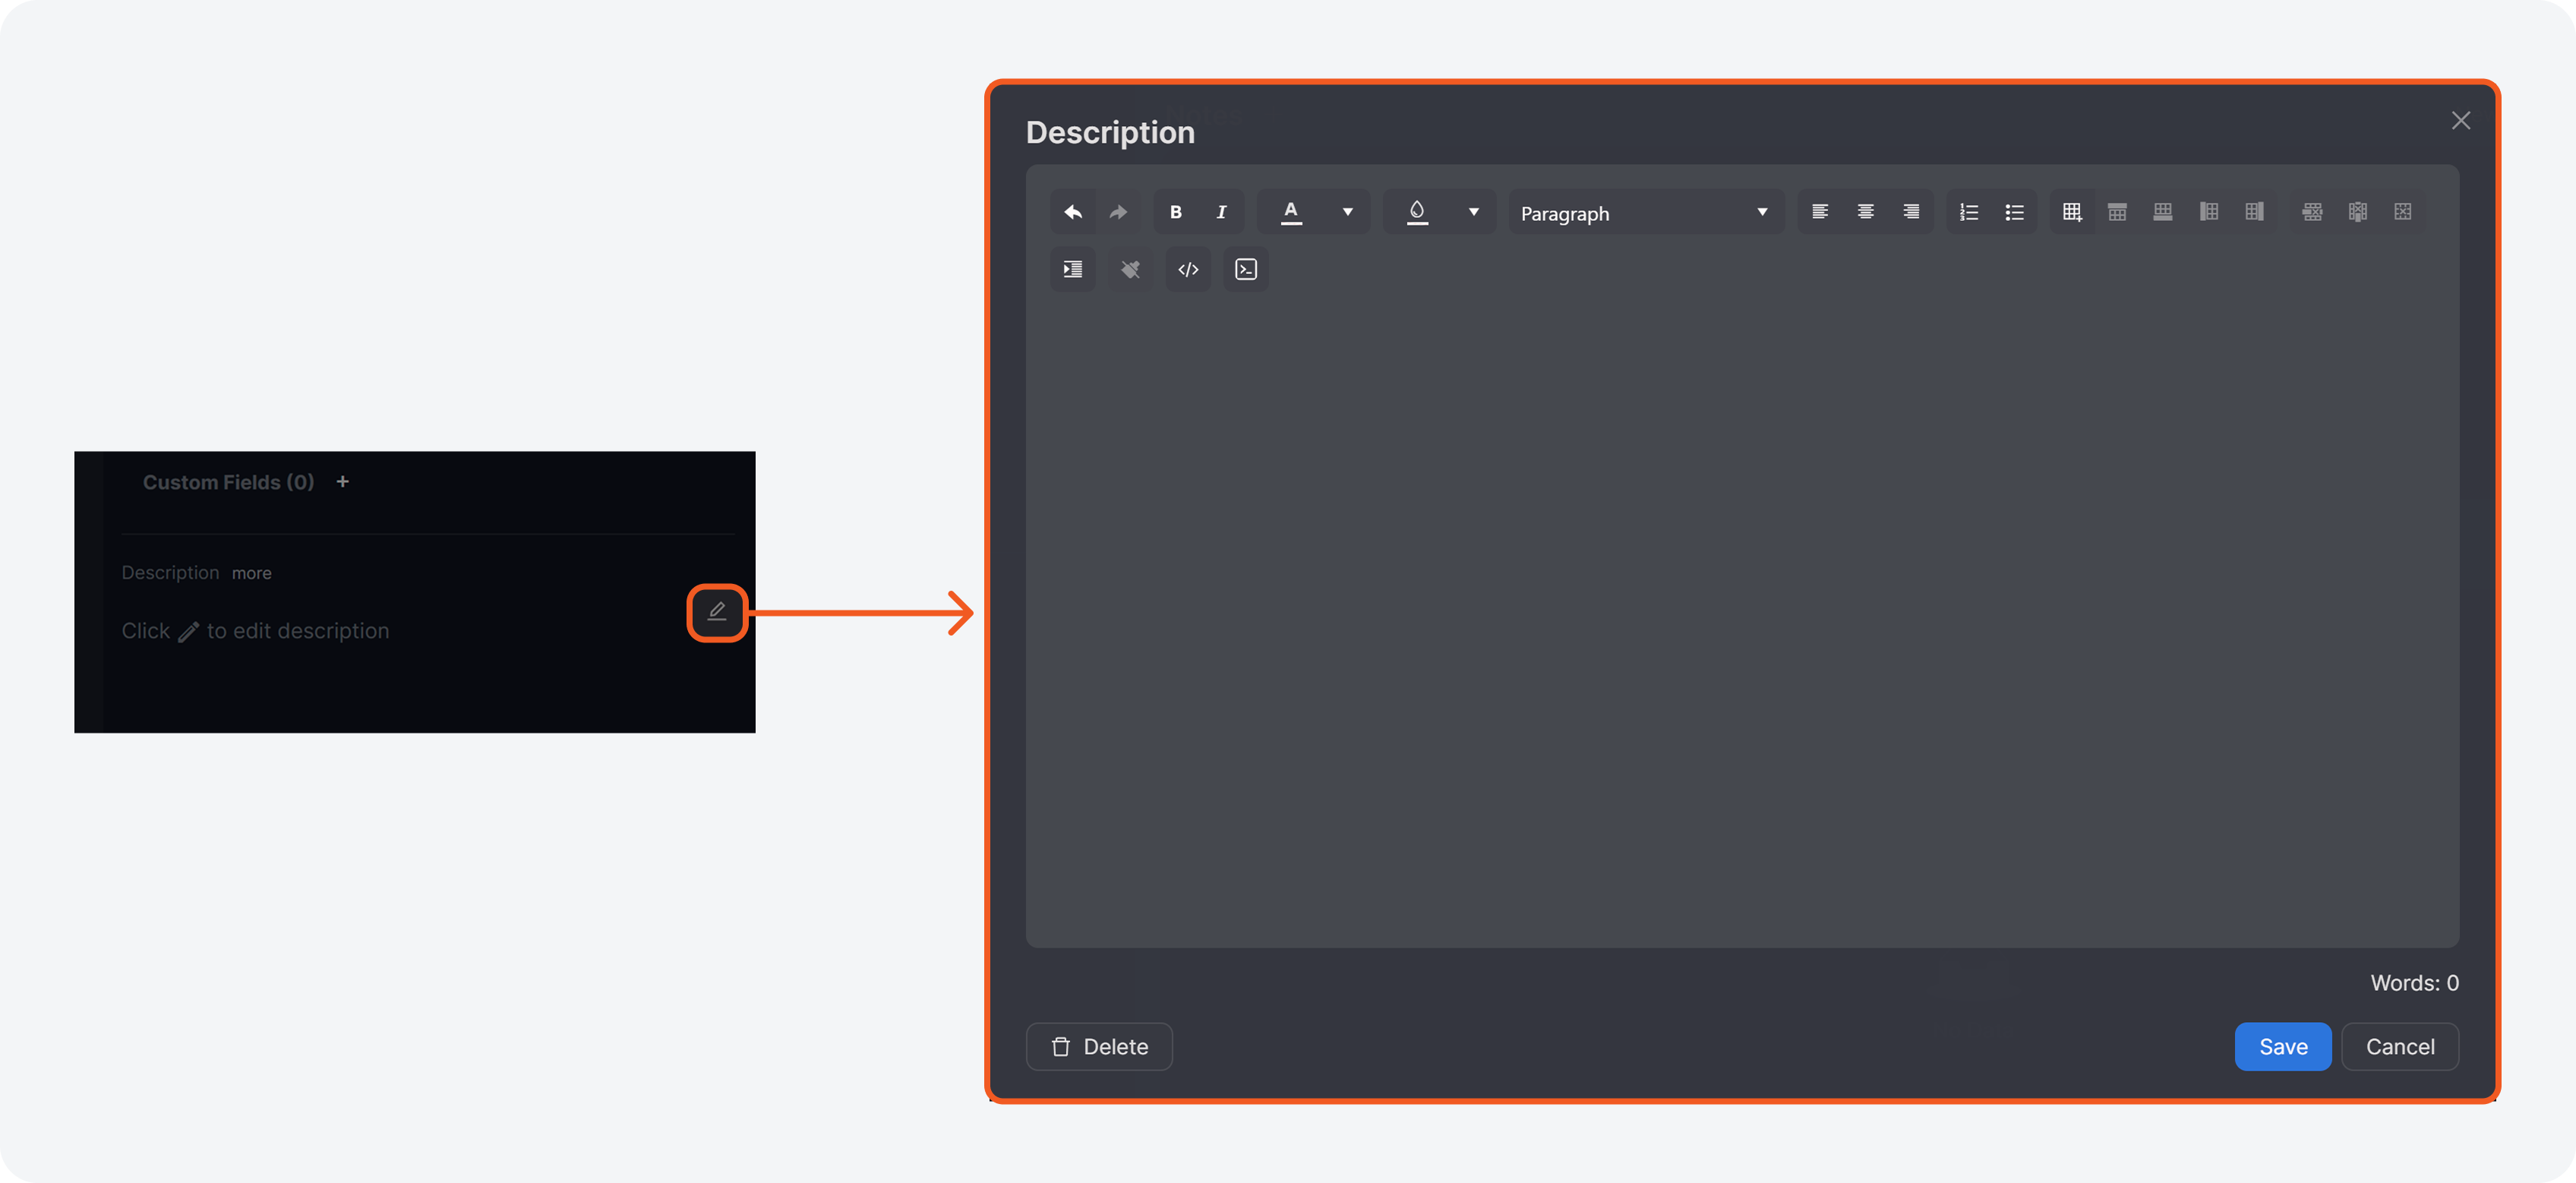
Incident Workspace Description Editor
The incident description editor has been enhanced for improved usability and performance.
Before
After
Artifact Enhancements
Adding Artifacts from Overview
.png?inst-v=a6d380fe-ff29-4bbc-9b46-e2545b975c77)
Users can add artifacts from the Overview tab in the incident workspace using the Linked Artifacts widget.
Users can click the  button to link an existing artifact to the incident or create a new artifact to link to the incident.
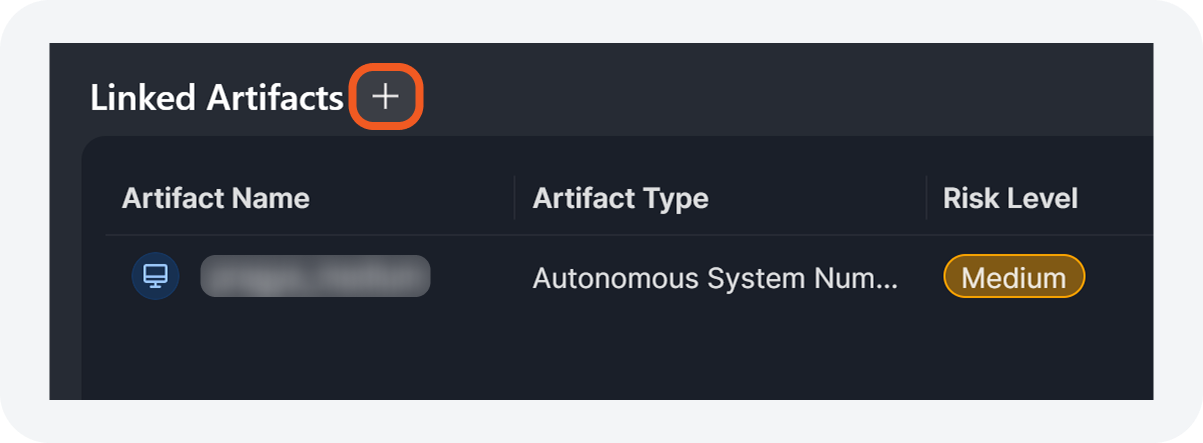
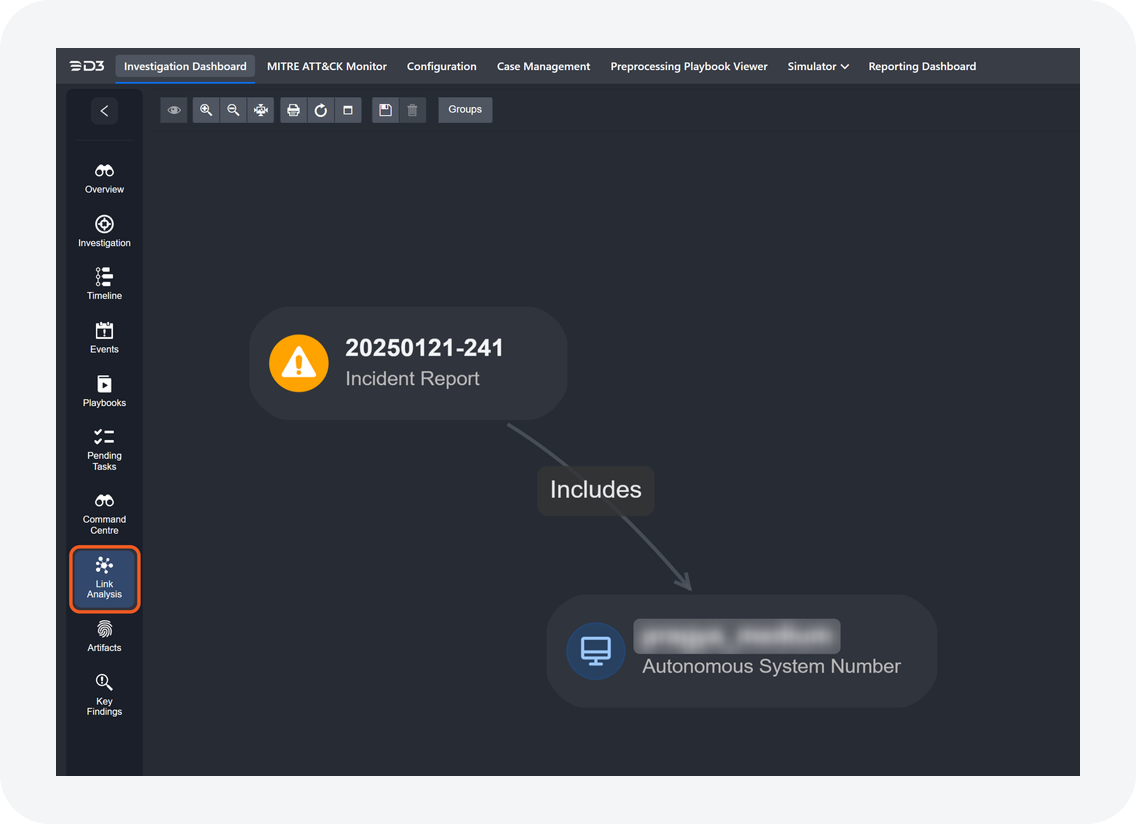
After linking artifacts to the incident, users can access their details and execute commands on them. Linked artifacts are also displayed in the Link Analysis tab.
Retrieve Real-Time Reputation Results
A new checkbox option allows users to always retrieve real-time reputation data when running check reputation integration commands.
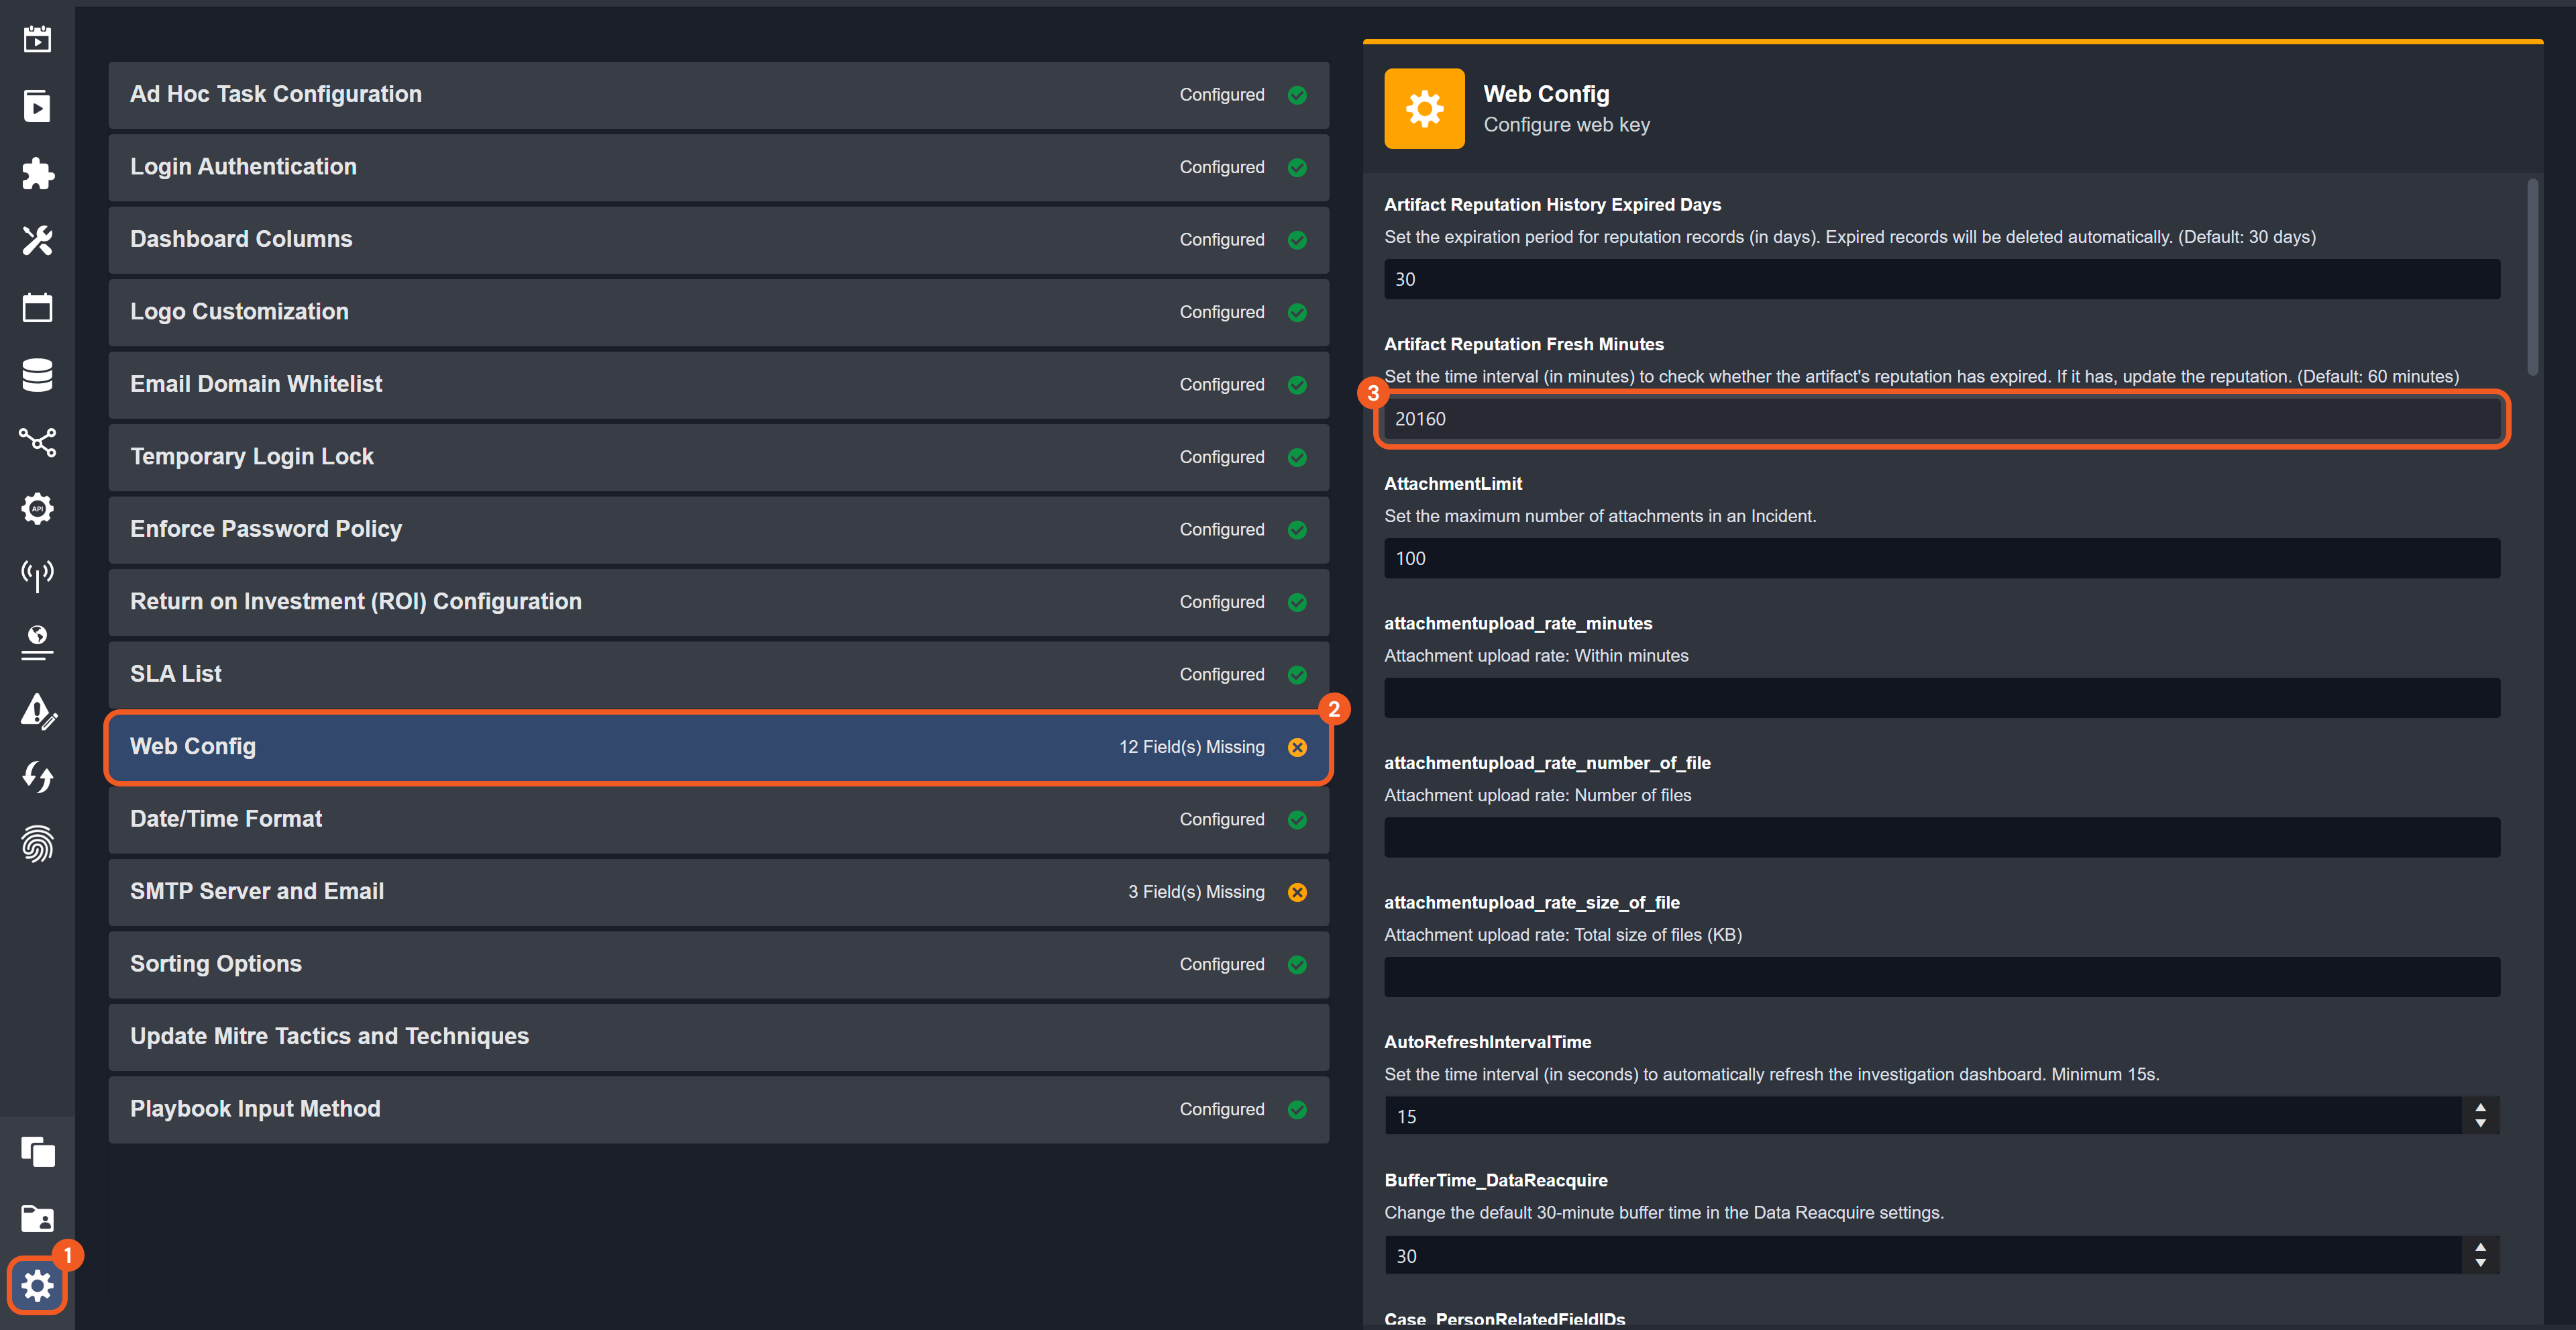
If unchecked, the first execution makes an API call, while following runs within the timeframe specified in the Artifact Reputation Fresh Minutes field will retrieve cached data from that last API call made within the set time period. Once that timeframe has passed, the artifact reputation is treated as expired, and the next execution will call the API again.
If checked, every execution retrieves live data—or makes an API call in real-time—instead of retrieving the cached reputation data.
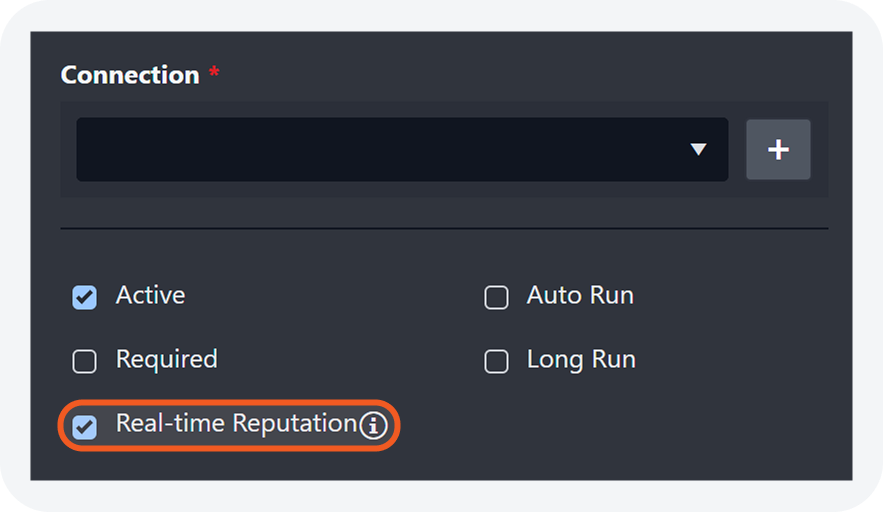
The checkbox within the command task configuration in a playbook.
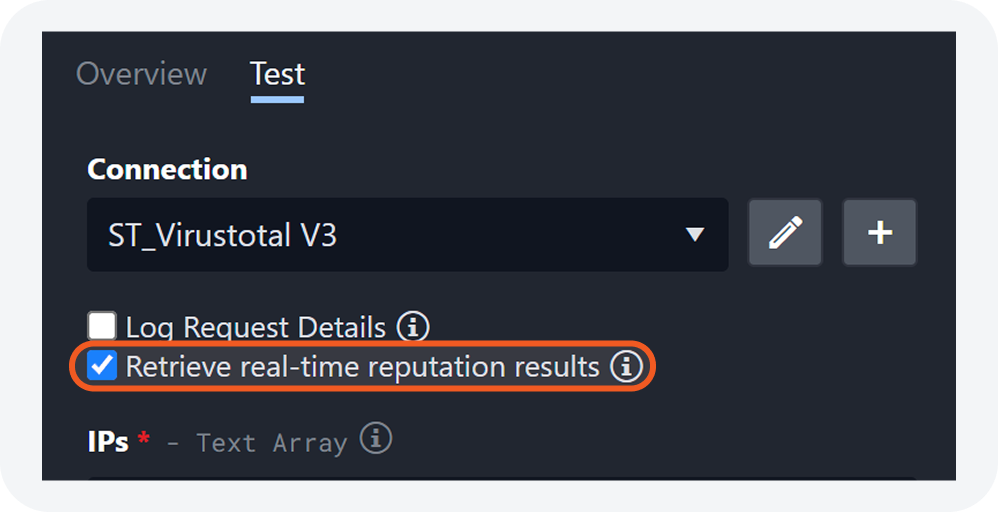
The checkbox within the Test tab of a check reputation integration command.
In Configuration > Application Settings > Web Config, users can configure the duration (in minutes) after which an artifact's reputation is considered expired and should be updated. By default, this value is set to 60 minutes.
READER NOTE
The Retrieve real-time reputation results checkbox is controlled by a Web Config token. This role token is hidden by default. Contact D3 Security to enable visibility.
Check reputation commands from Spamhaus and Maltiverse do not include the checkbox, as they always retrieve real-time reputation data by default.
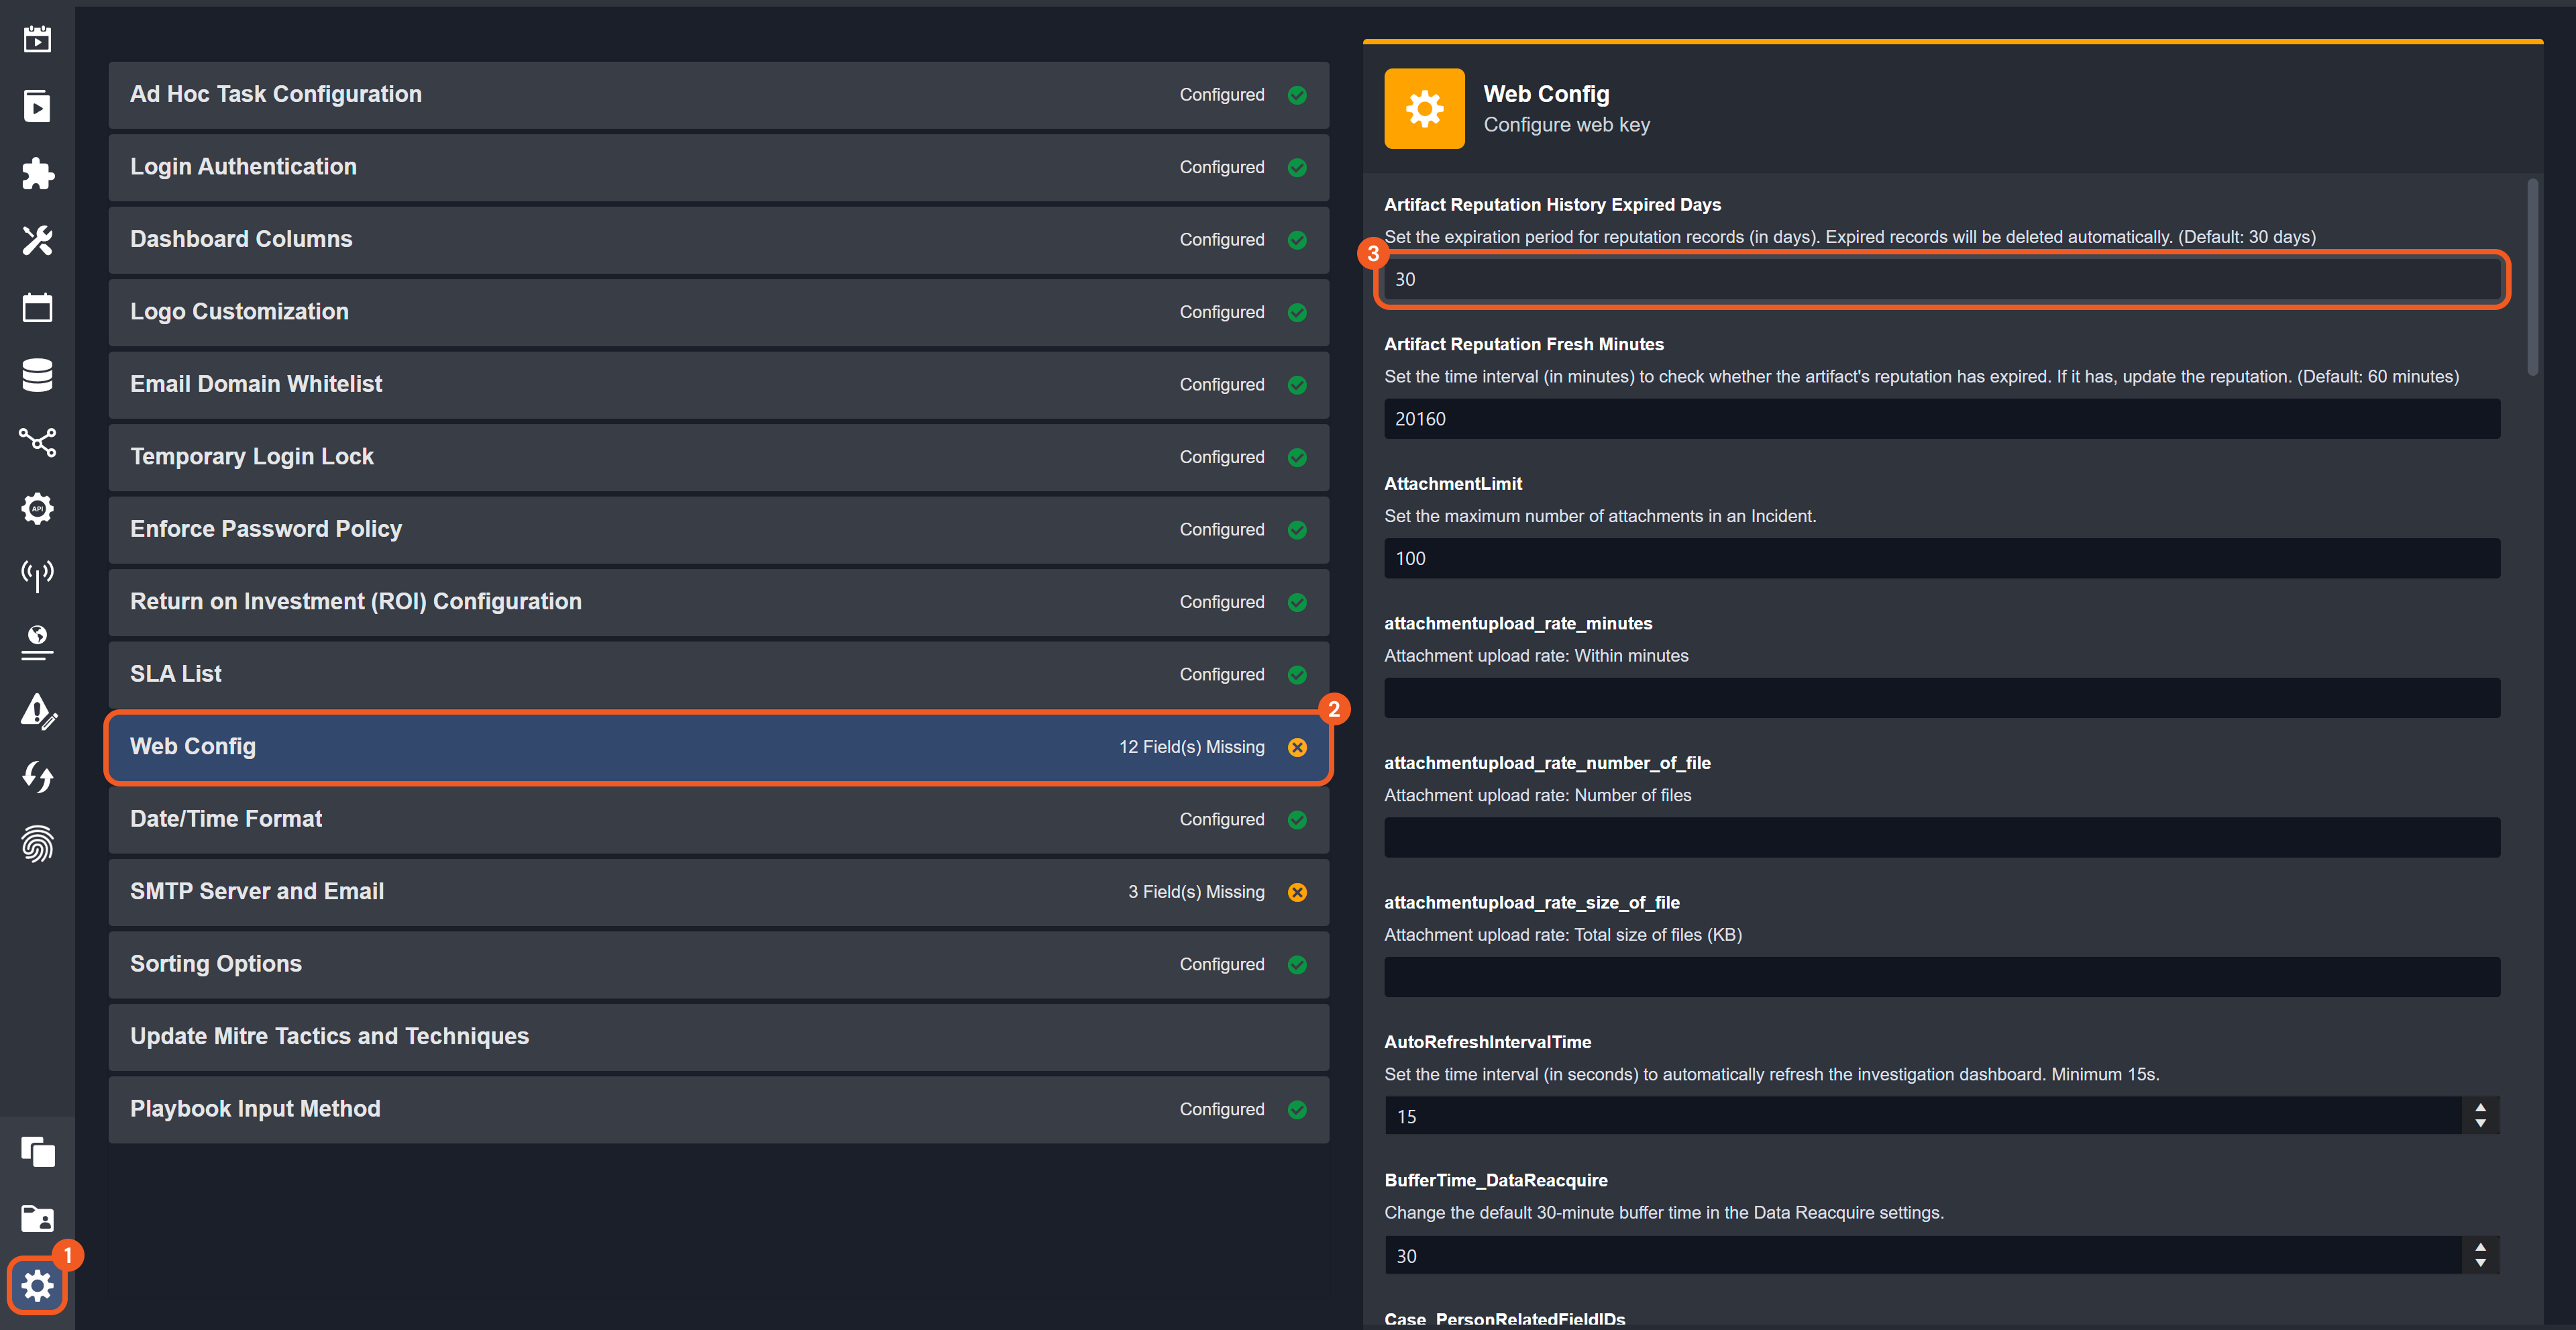
Configurable Retention for Artifact Reputation Records
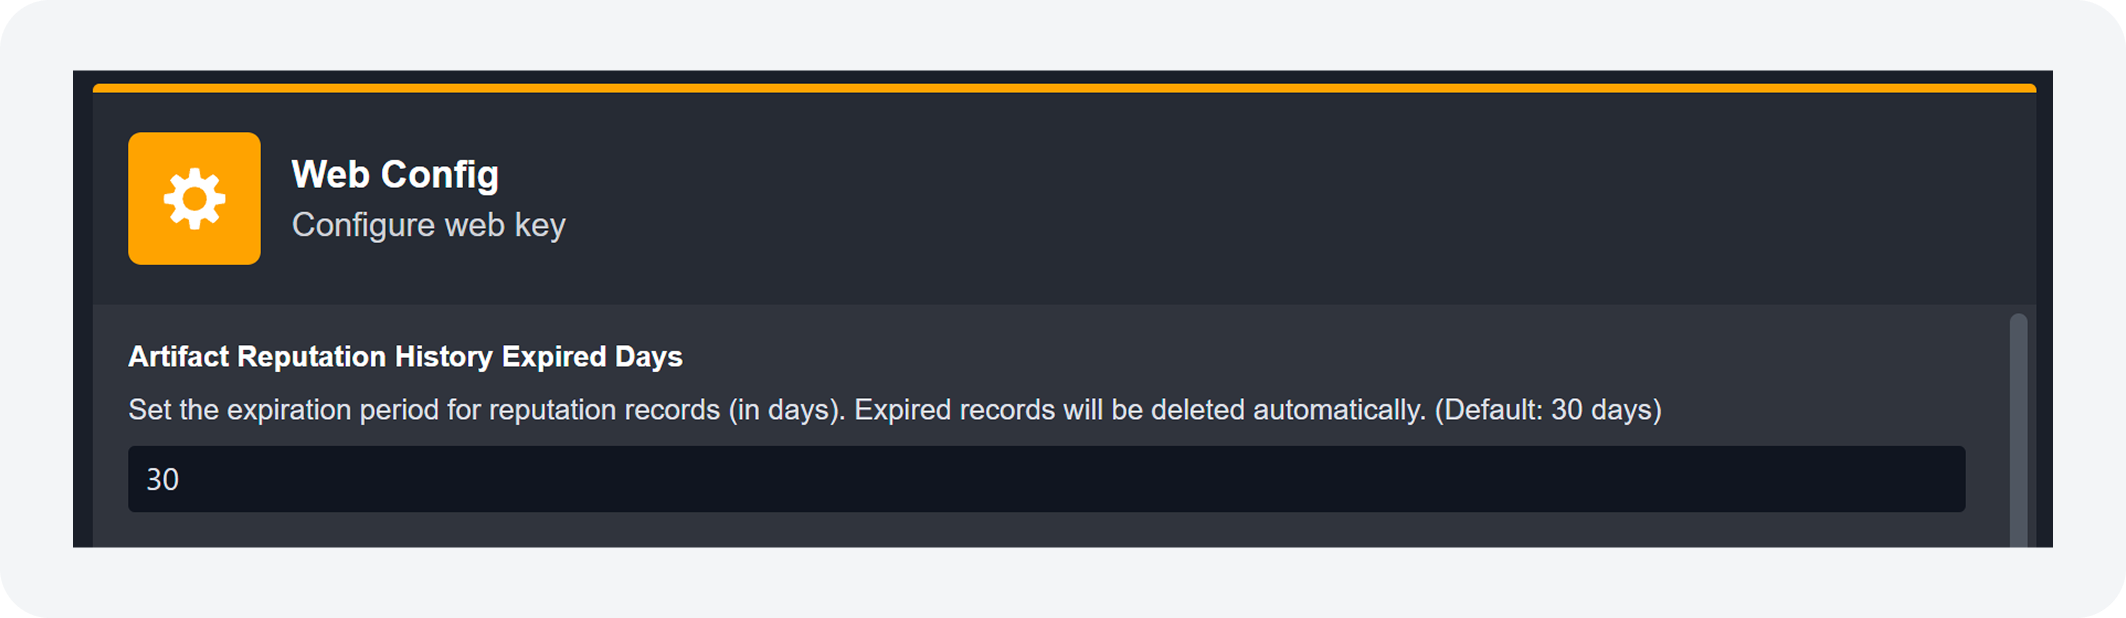
Users can now configure how long artifact reputation records are retained with the Artifact Reputation History Expired Days setting. After the specified period, the reputation records of artifacts are automatically deleted. The artifacts themselves will not be deleted. By default, records are retained for 30 days.
READER NOTE
The Artifact Reputation History Expired Days setting is hidden by default. Contact D3 to enable its visibility.
To remove artifact reputation records, a purge data script must be set up. If not already configured, contact D3 Support for assistance with scheduled data purges.
Users can navigate to Configuration > Application Settings > Web Config to modify the retention period (in days) for artifact reputation history. By default, reputation records are removed after 30 days.
Playbook Enhancements
Playbook Dashboards UI
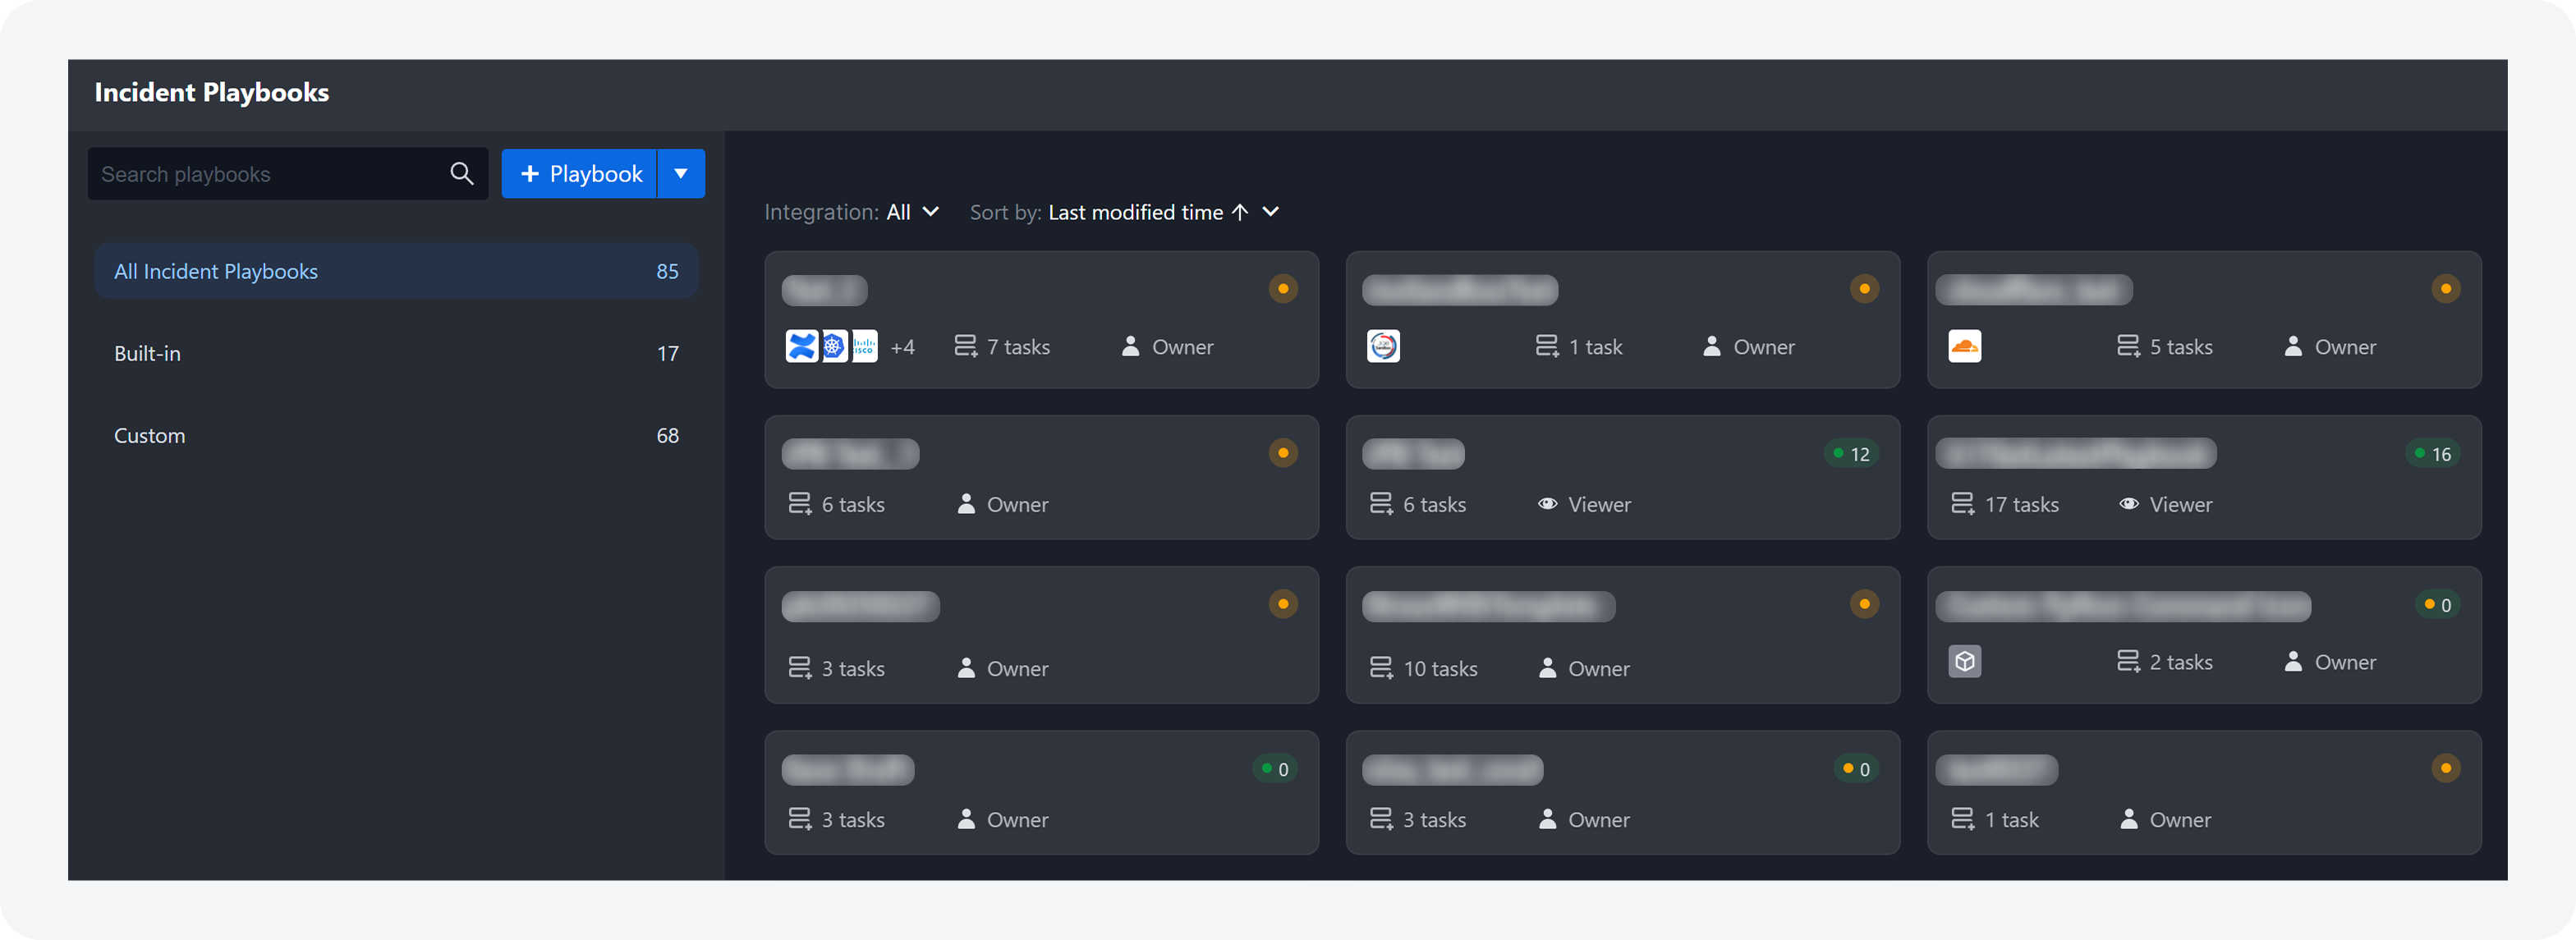
The Incident Playbook and Event Playbook dashboards now feature a folder structure on the left with filters to view all, built-in, or custom playbooks. On the right, users can see playbook details, including name, live or draft status, task count, top three integrations (if any), and user permissions.
Custom Python Command Icon
.png?inst-v=a6d380fe-ff29-4bbc-9b46-e2545b975c77)
All custom Python commands in a playbook are now marked with a  icon. Commands using a previous version without the latest Python updates applied are marked with the
 icon.
Clicking on the and icons will render the code and code comparison windows respectively.
Code Window
Code Comparison Window
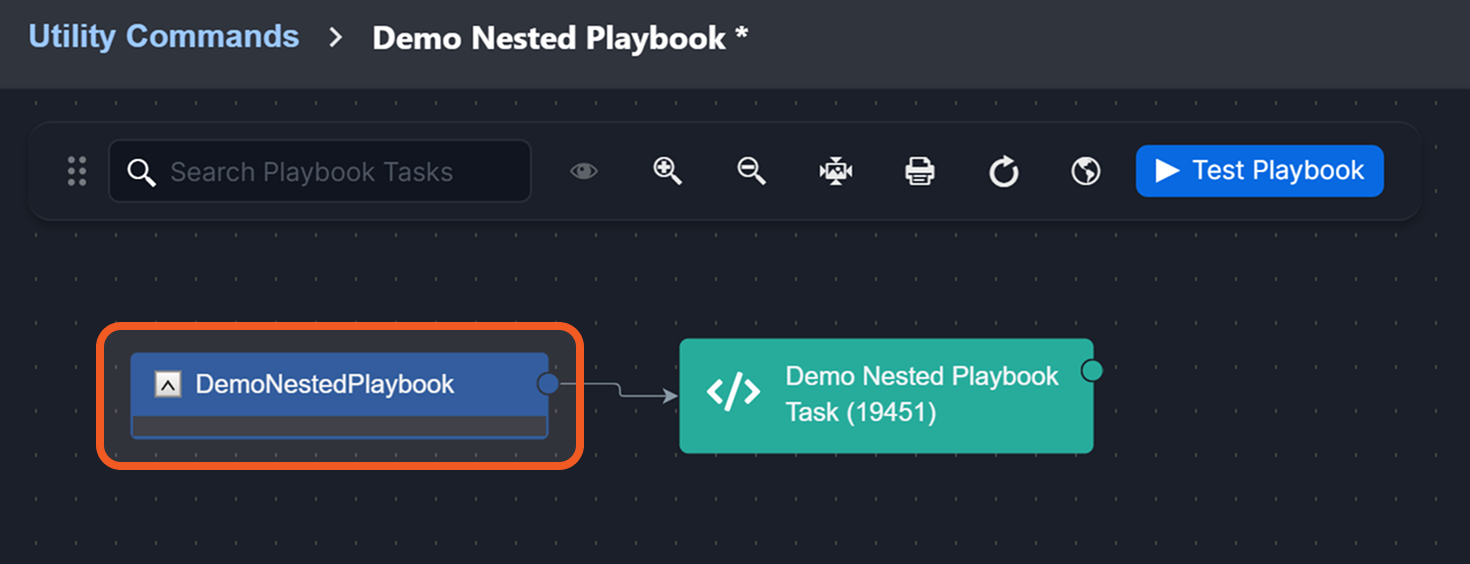
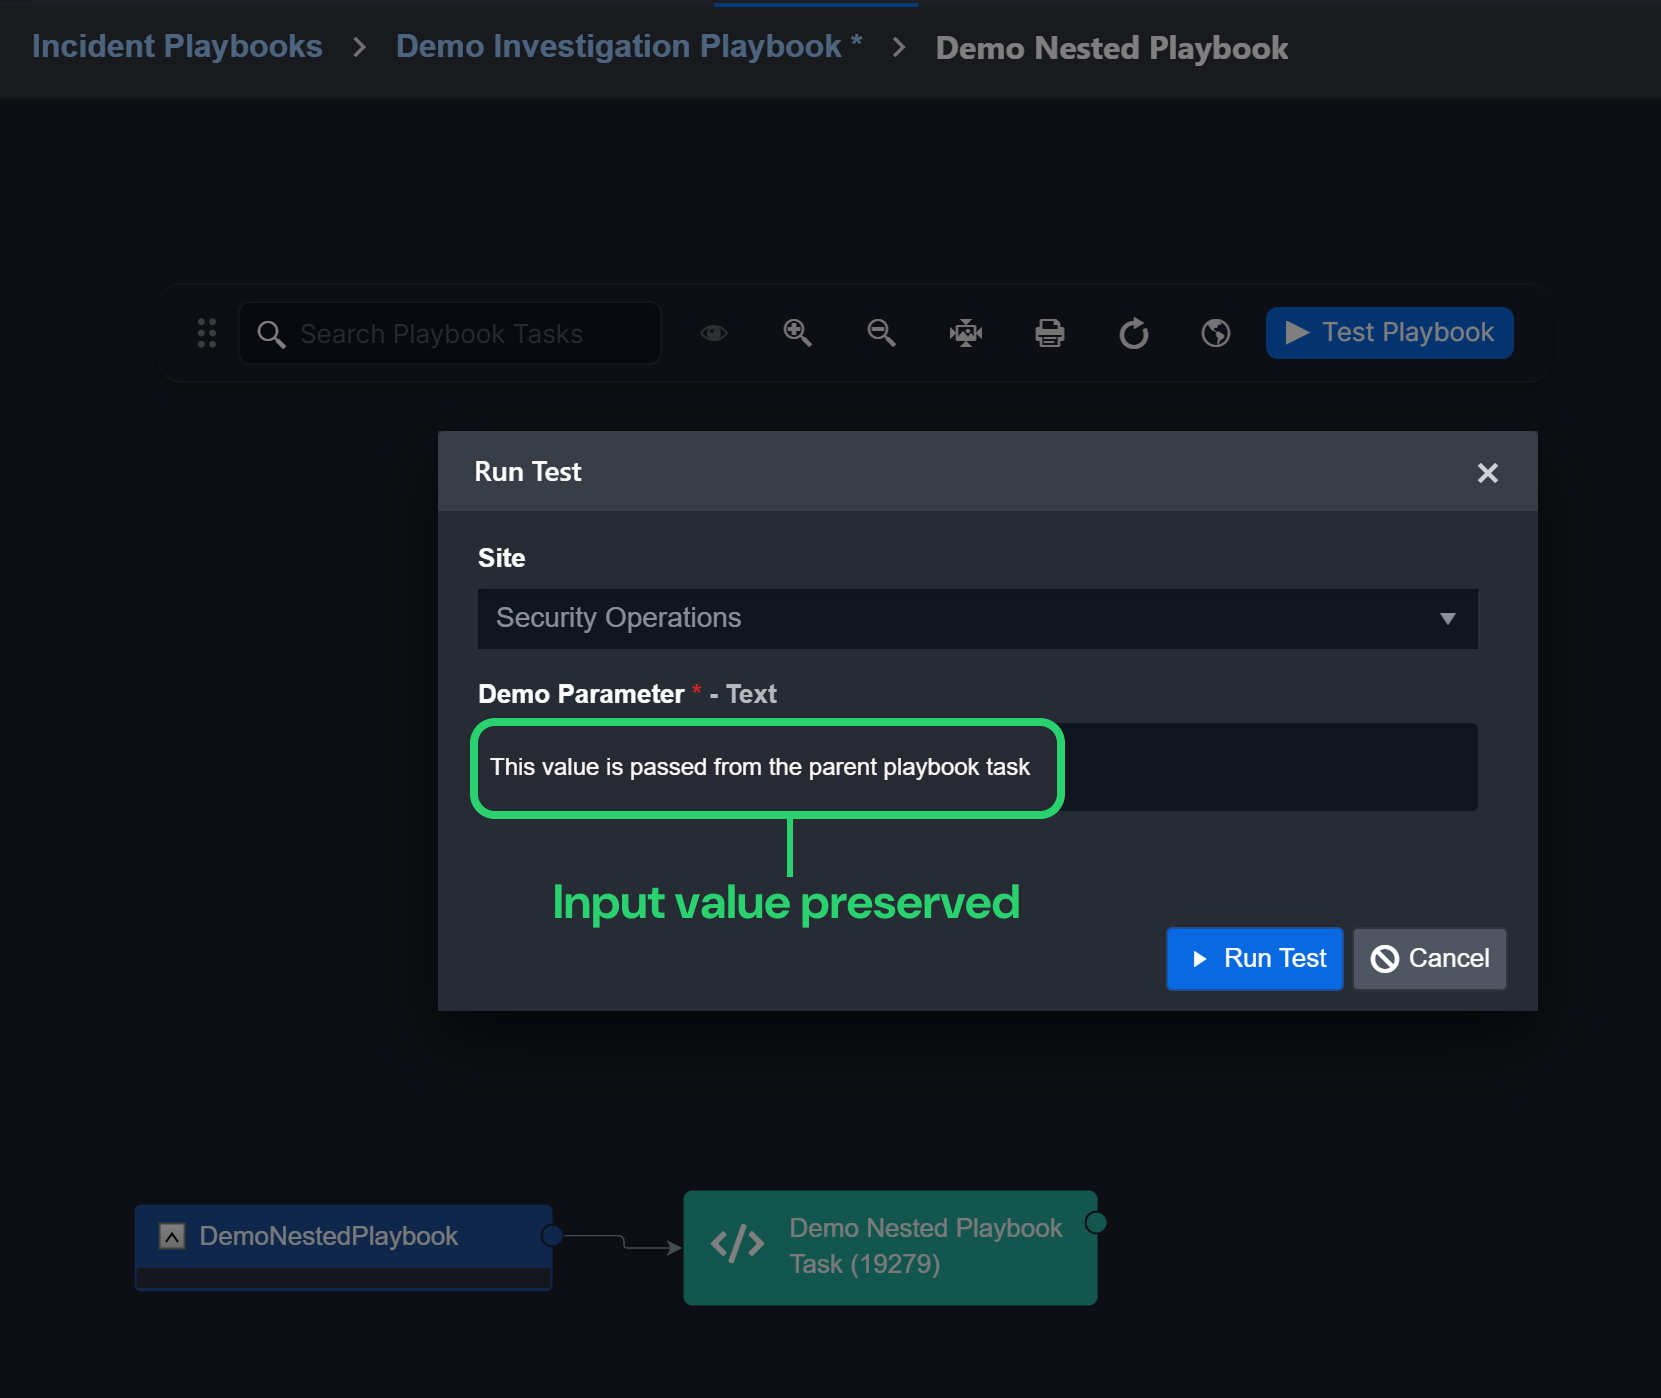
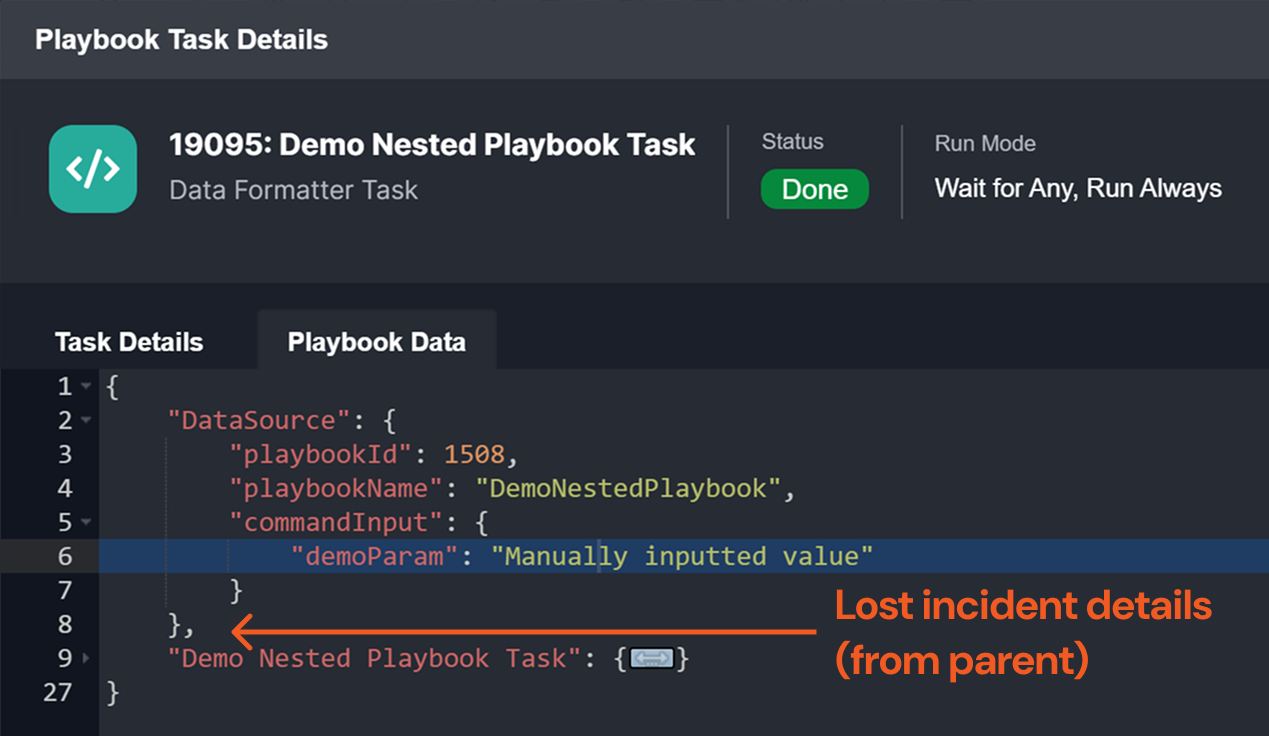
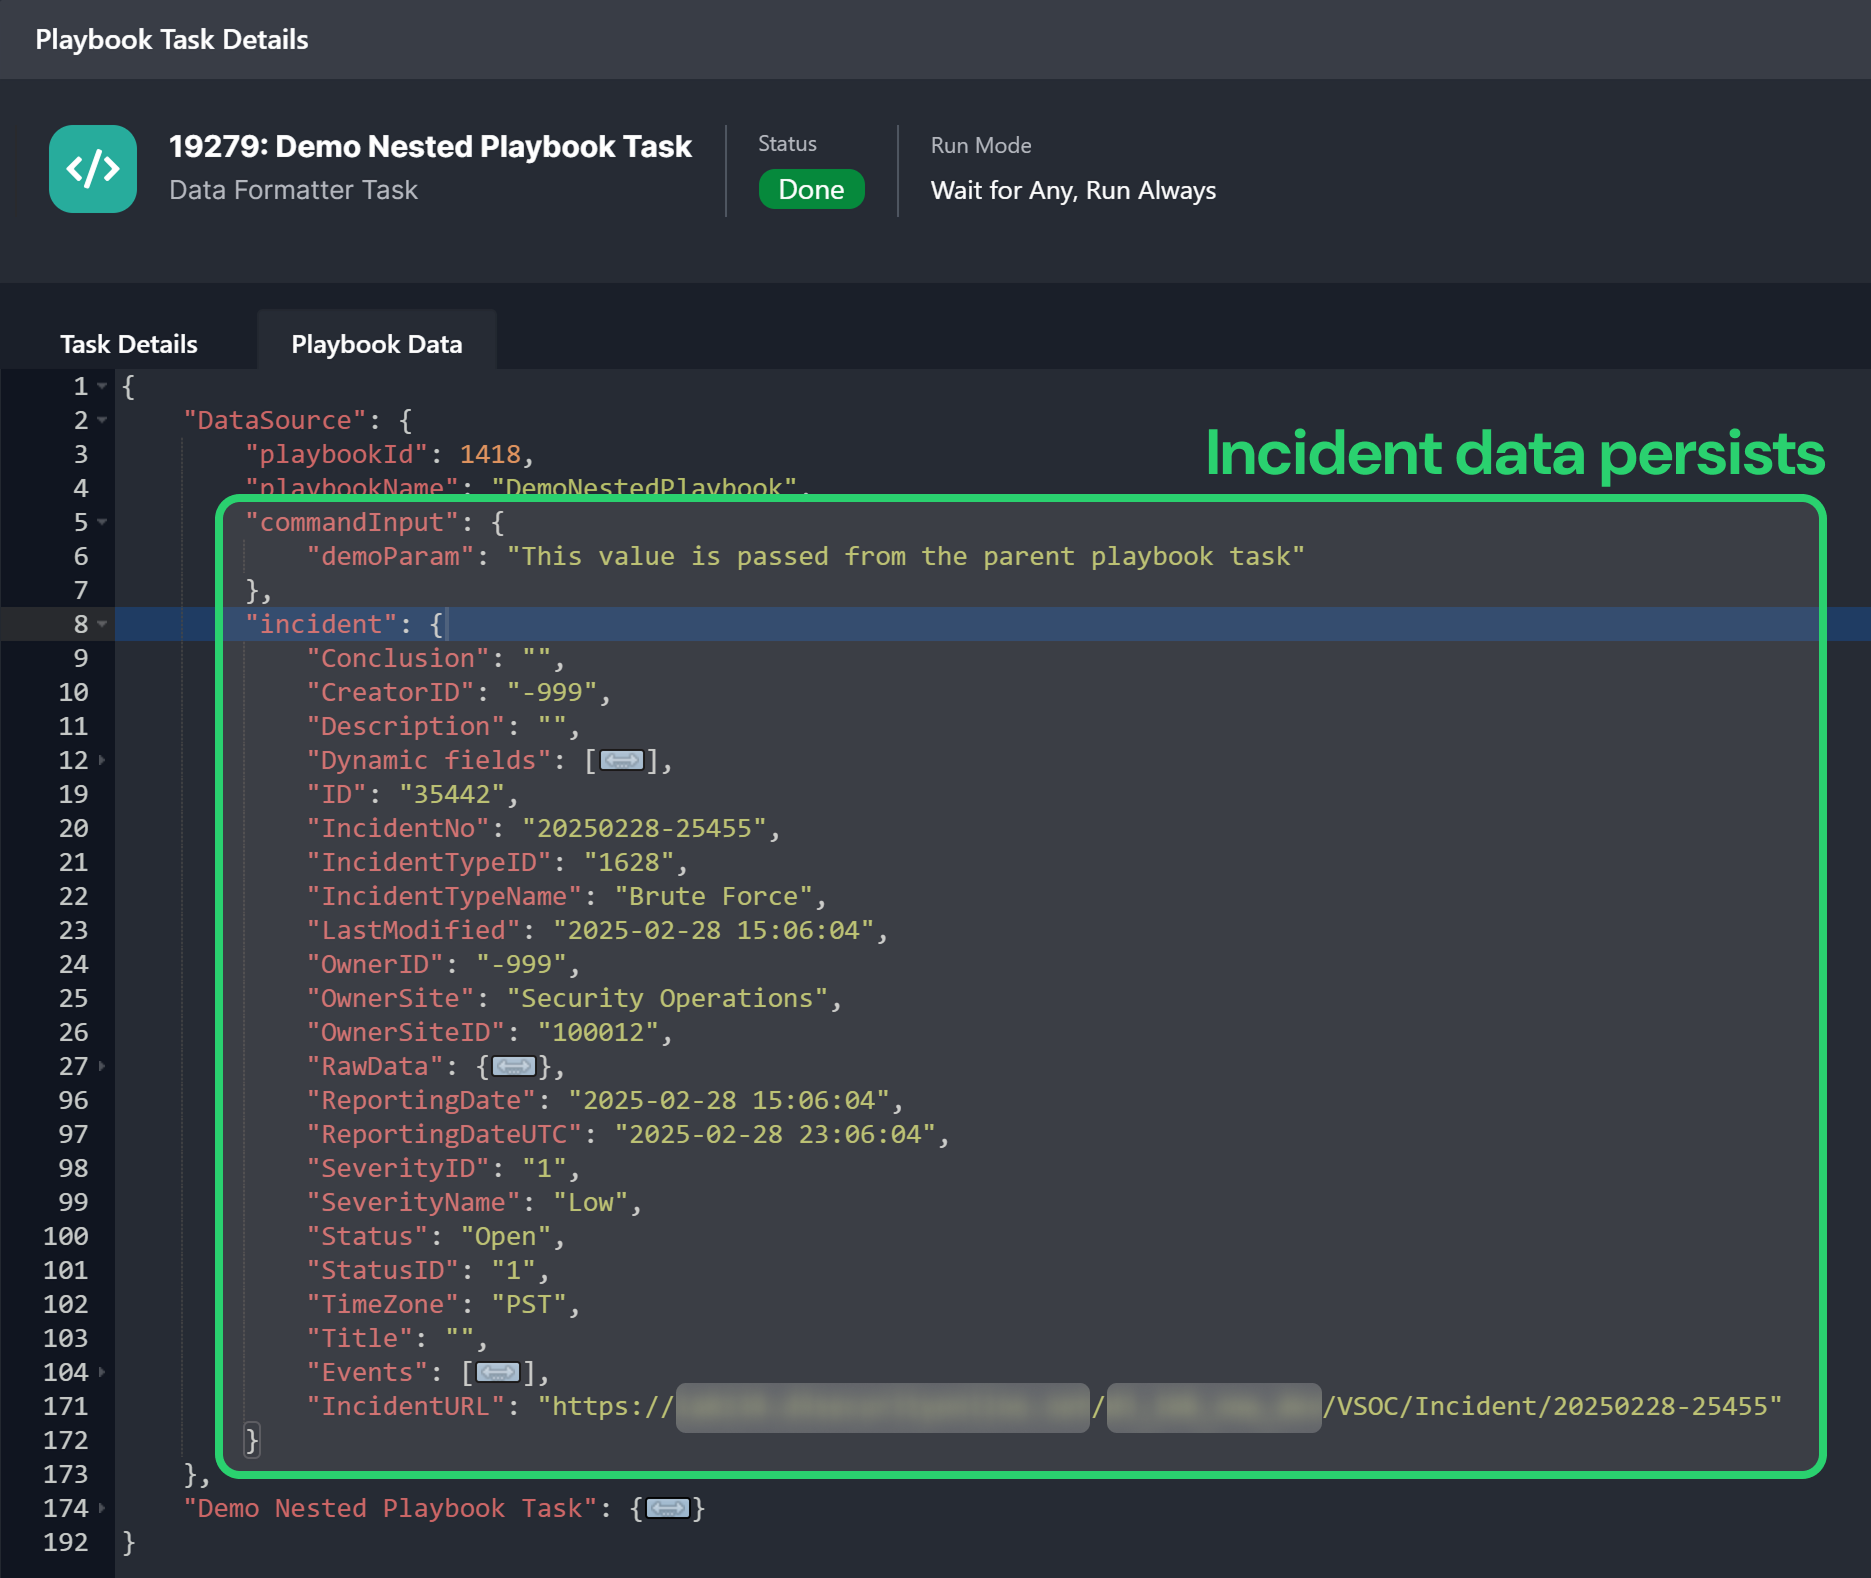
Parent-to-Child Playbook Incident Data and Command Input Persistence
Previously, retesting a child playbook command required re-entering input, and separately caused the loss of incident data from the parent playbook. Now, users can retest a nested playbook while preserving both command input and incident data.
Create a simple playbook utility command, then click on the root node.
Enable the Command Task setting to use this playbook utility command within a parent playbook.
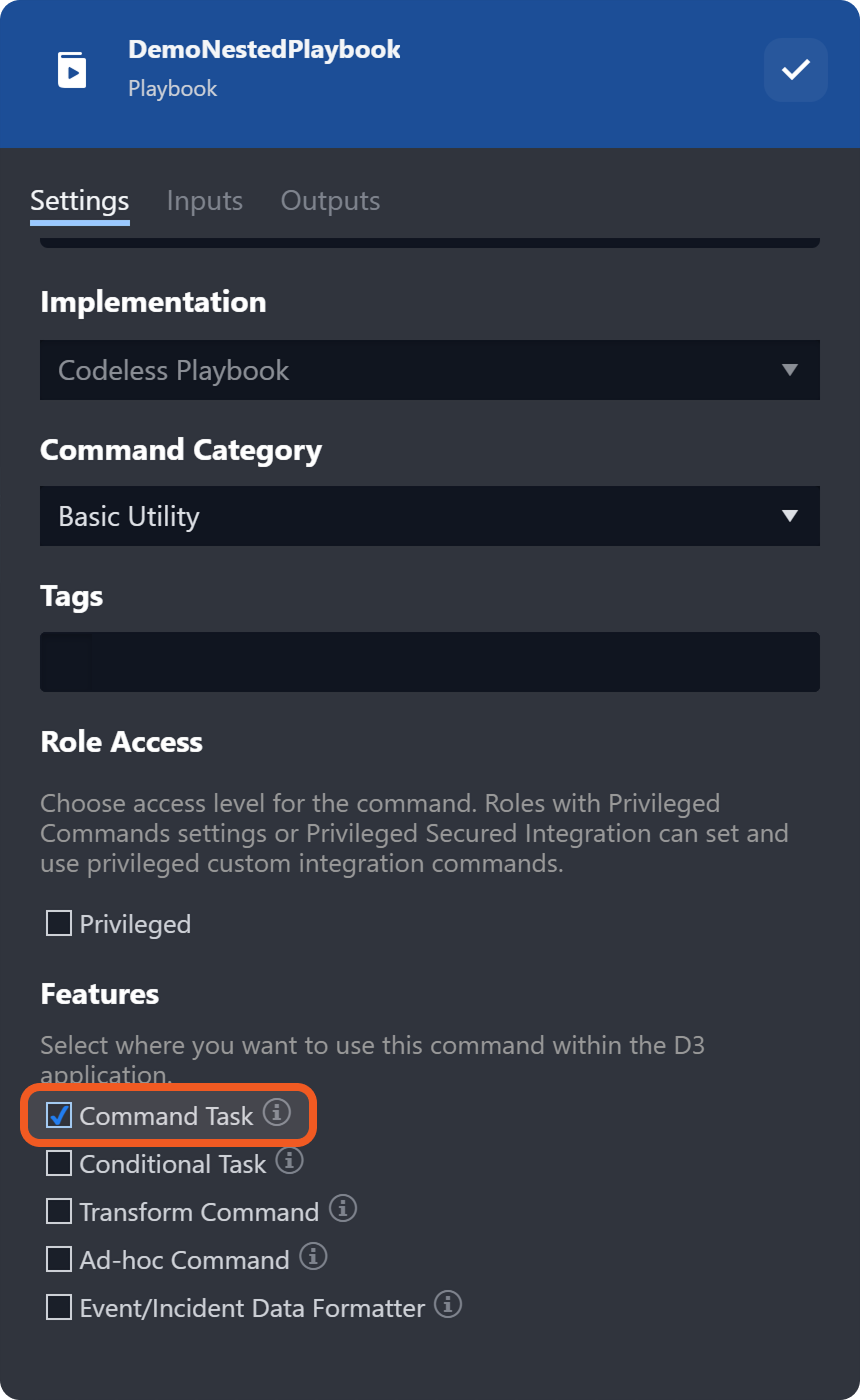
Configure a command input parameter.
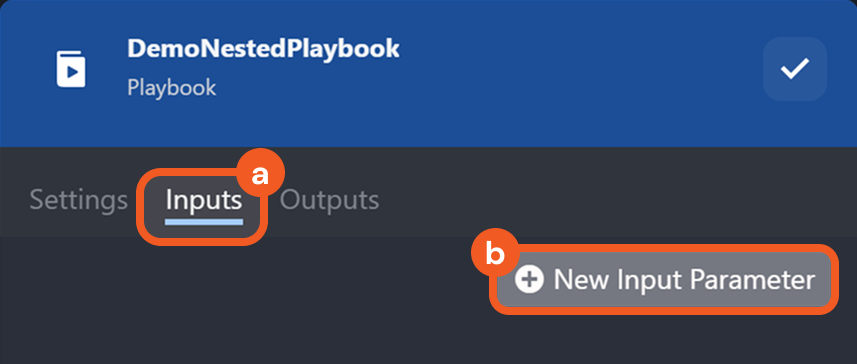
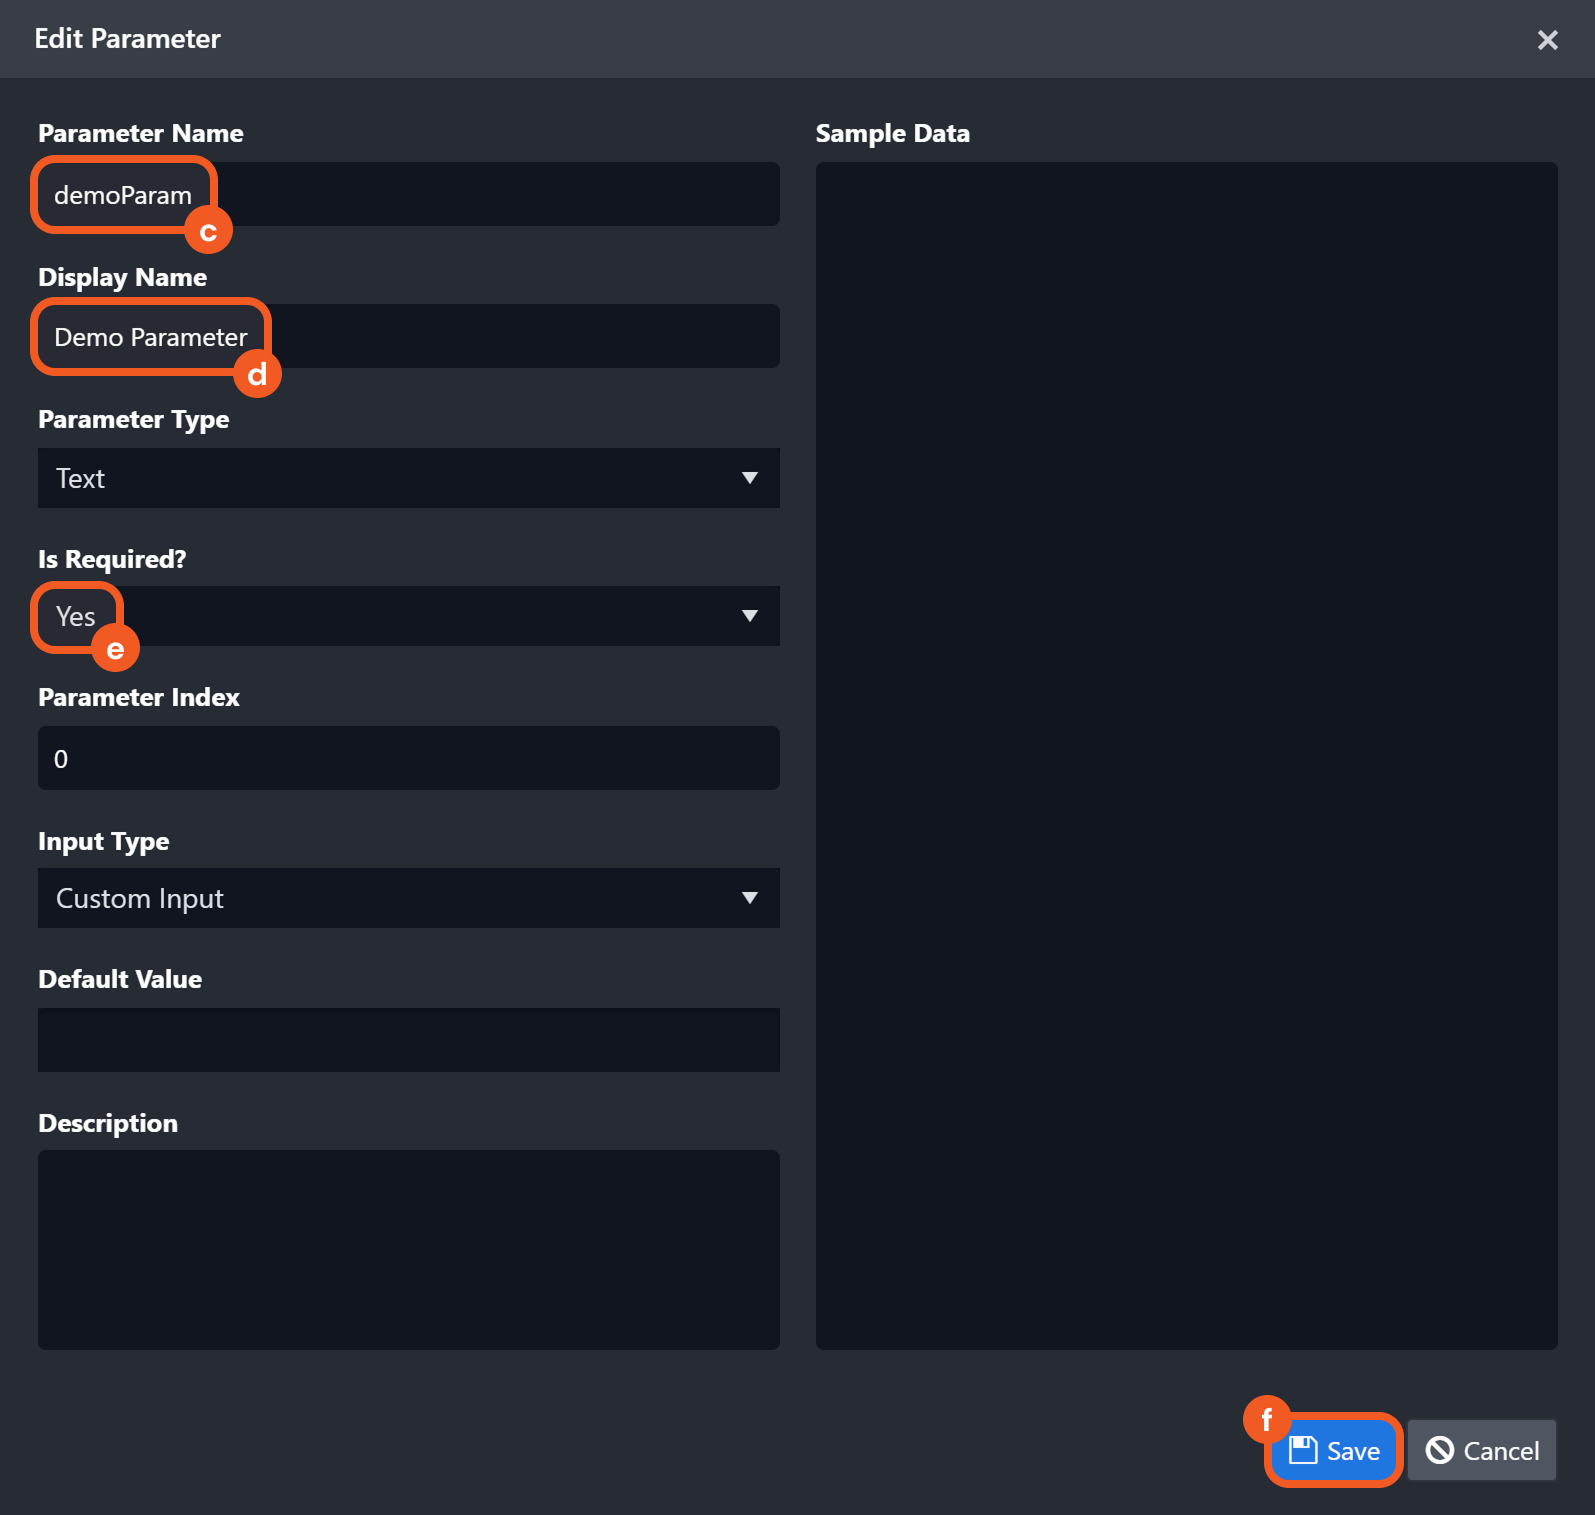
Submit this playbook utility command.
.png?inst-v=a6d380fe-ff29-4bbc-9b46-e2545b975c77)
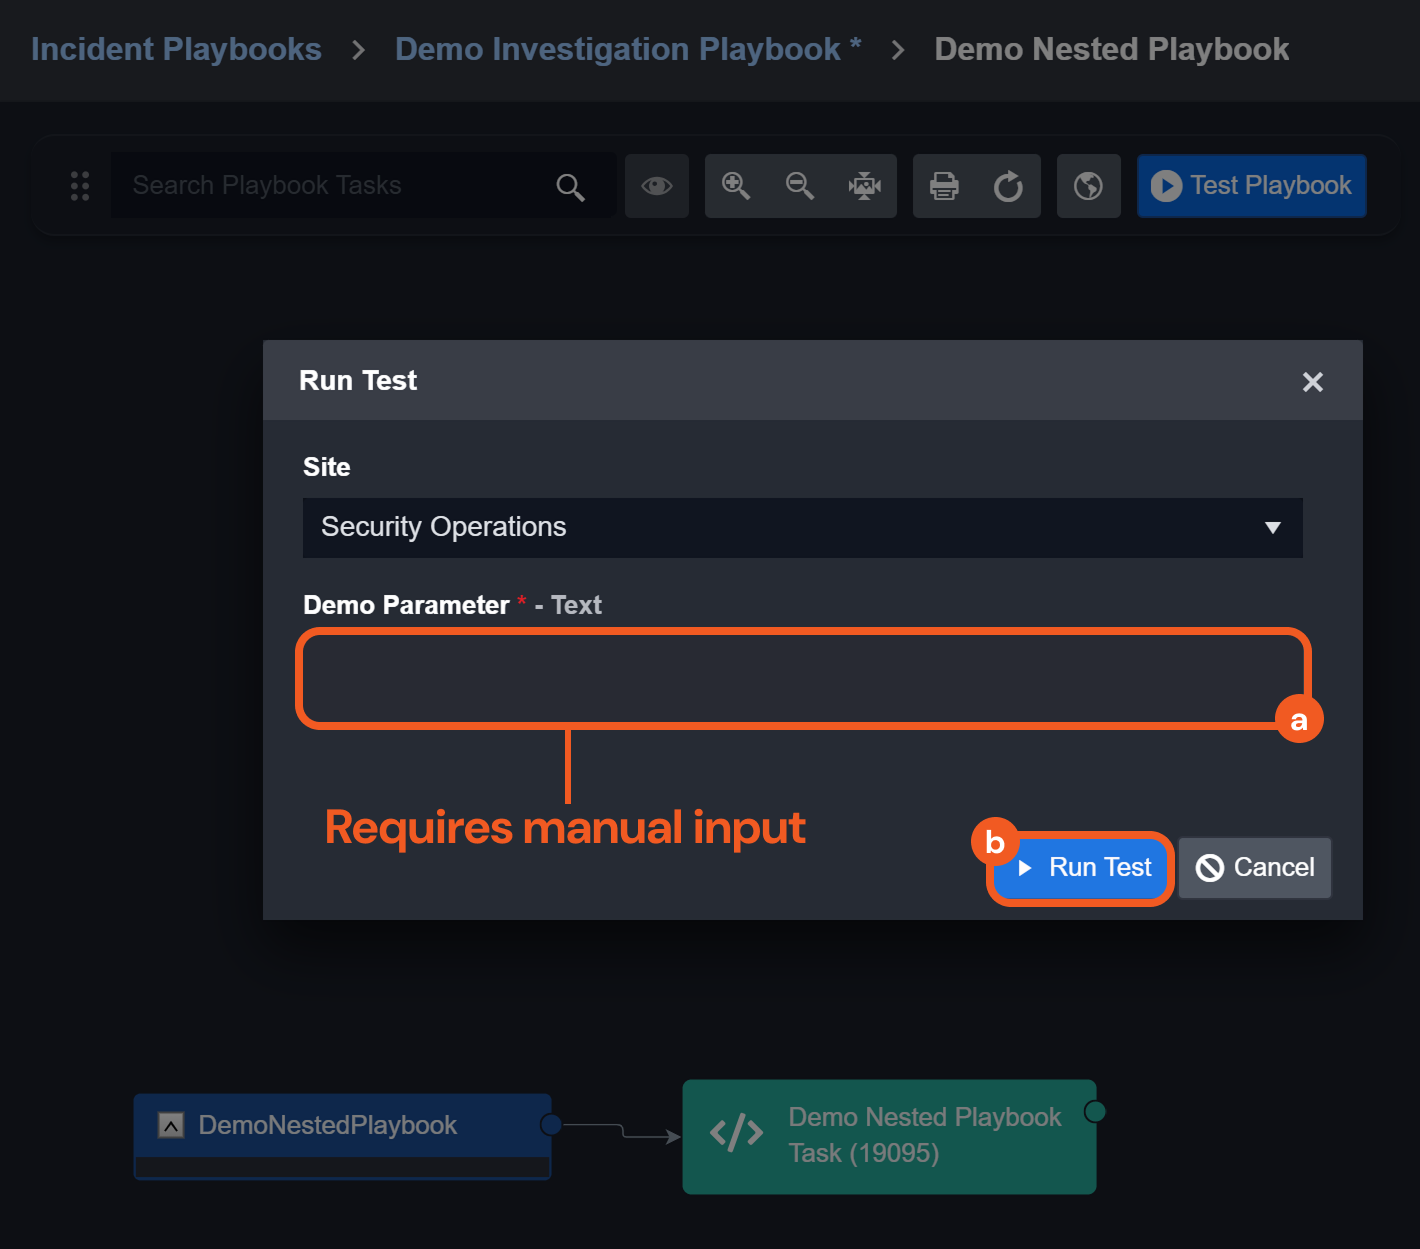
Create an investigation playbook incorporating the previously submitted playbook utility command, providing a sample value for the configured input parameter, then click on the
 button.
.png?inst-v=a6d380fe-ff29-4bbc-9b46-e2545b975c77)
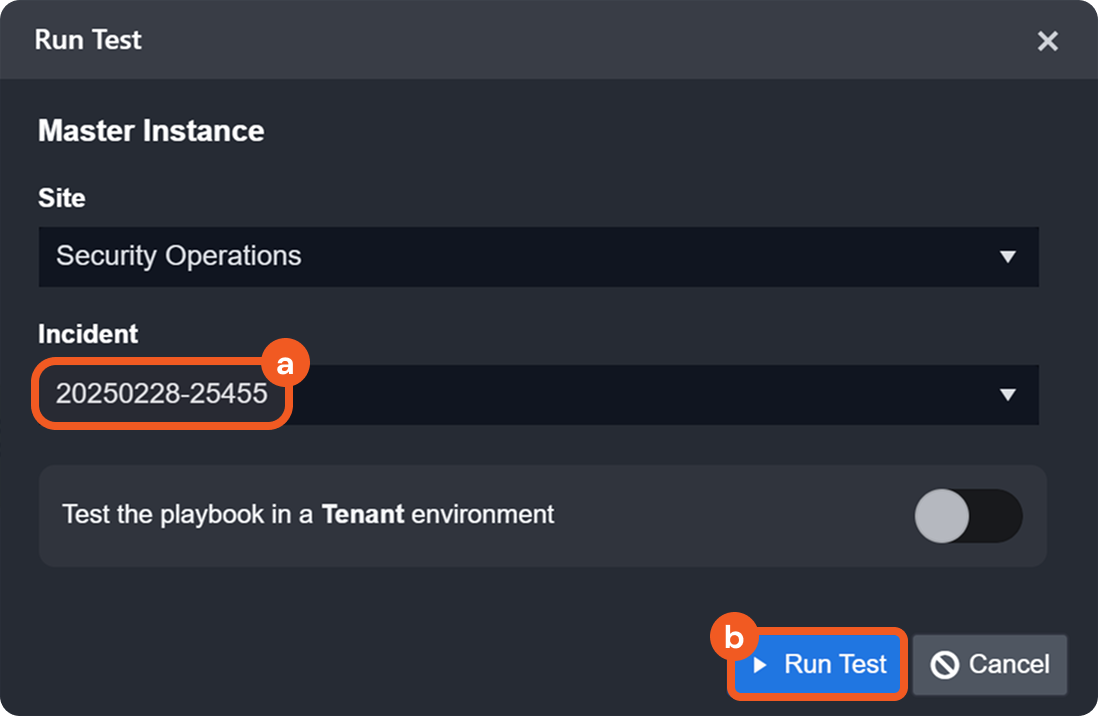
Select an incident, then click on the Run Test button.
Click on the
-20250415-173231.png?inst-v=a6d380fe-ff29-4bbc-9b46-e2545b975c77) icon to view the executed playbook utility command.
icon to view the executed playbook utility command.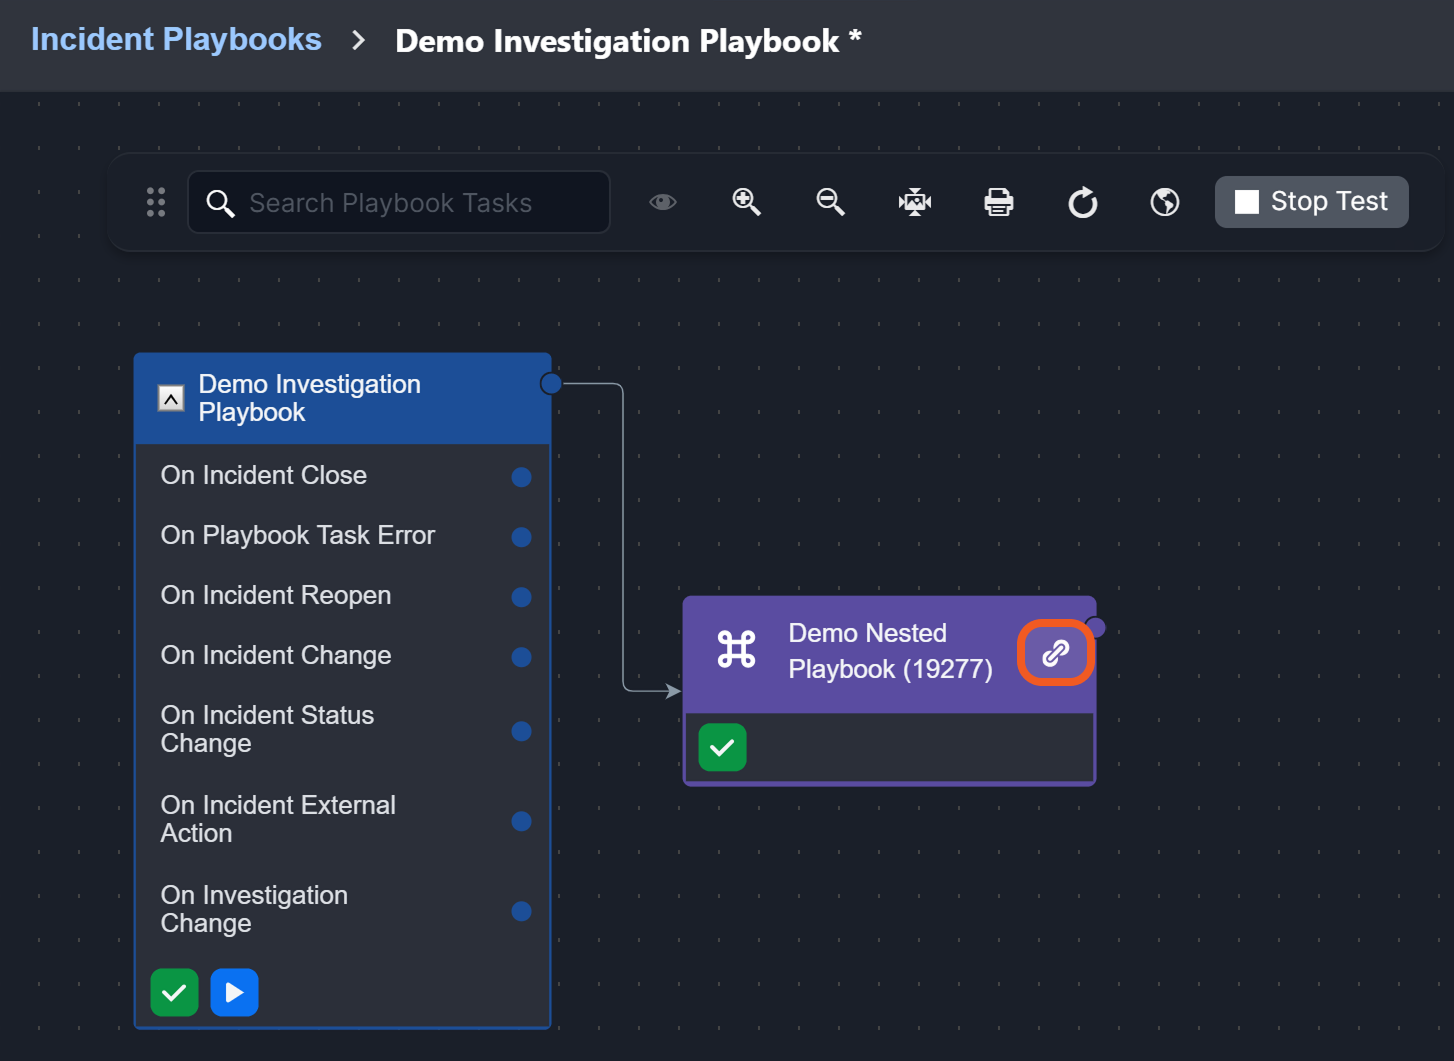
Click on
%202-20250225-202524.png?inst-v=a6d380fe-ff29-4bbc-9b46-e2545b975c77) then within the nested playbook.
then within the nested playbook. 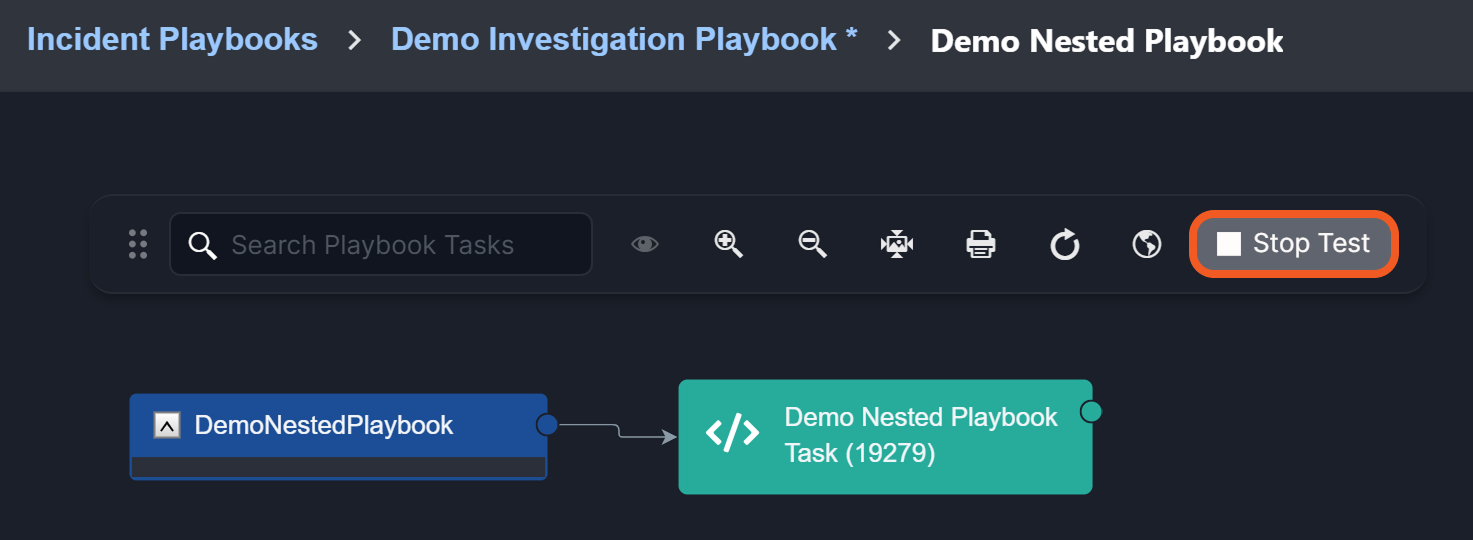
Before version 16.9
Starting from version 16.9
Click on the
icon of any task node. 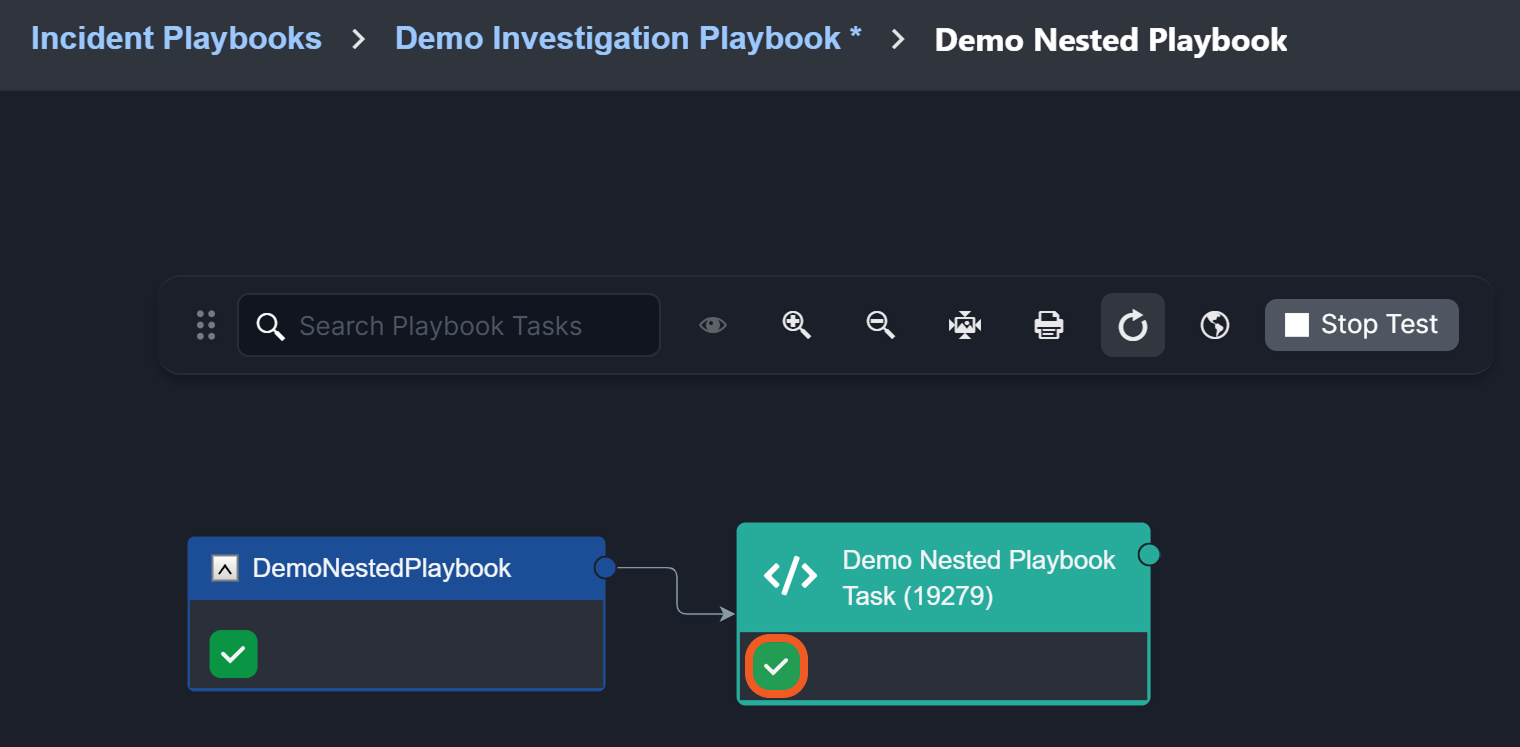
Before version 16.9
Starting from version 16.9
Playbook Execution Path Performance Enhancement
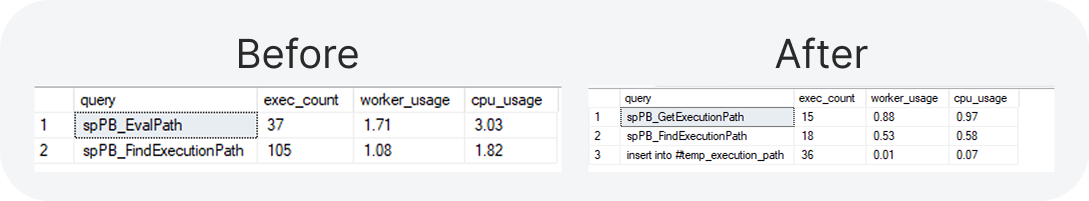
Before optimization (“Before”), frequent query executions increased CPU and worker usage. Now (“After”) repeated executions are reduced, optimizing SQL Server performance.
Playbook execution paths are now cached in memory, reducing SQL Server load by minimizing repetitive calculations. This optimization enhances performance, making large playbook executions faster and more efficient.
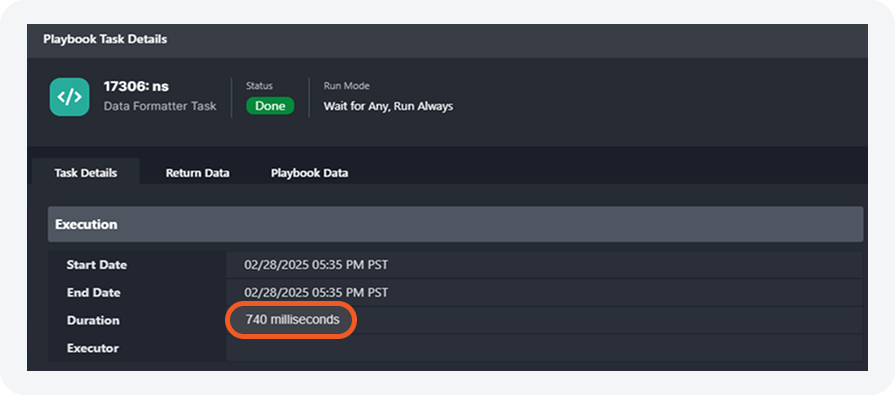
Incident Data Retrieval
Incident data retrieval has been enhanced for more efficient data handling. When using JSON paths to retrieve incident data, playbooks fetch only the fields used during execution, rather than loading the entire dataset into memory. If a user references a broad dataset (e.g., {{ PlaybookData | jsonpath('$.DataSource.incident') }}) but only utilizes a specific key-value pair within it, only that required field is fetched in real time.
Before
After
READER NOTE
It is recommended that users explicitly define specific JSON paths whenever possible to retrieve only necessary field values and avoid loading large datasets.
Utility Commands
New Commands
The following utility commands have been added to this release of D3 SOAR.
Commands | Functionality |
Add or Update Artifact Reputation | Adds or updates an artifact's reputation based on the selected type and specified name. Reputation details can be viewed in the Overview or Reputation tab within the Artifact Details pop-up window. Refer to Add or Update Artifact Reputation for more information. |
Get Global List MetaData | Retrieves the metadata of global lists, including ID, name, description, site list, status, and last modified time, based on global list names, global list IDs, or site names. |
Get Site Connections | Retrieves all configured connections for a specified Site, including integration name, connection name, connection status, automated health check status, last test timestamp, and last test result. The returned data enables dynamic connection selection, status monitoring, and management. |
Integrations
New Integrations
The following integrations have been added to this release of D3 SOAR.
Integration Name | Description |
Acronis | Acronis is a provider of cybersecurity and data protection solutions, offering a suite of products designed to secure and manage data for individuals, small businesses, and enterprises. This integration allows organizations to ingest alerts into D3 vSOC, as well as create and dismiss alerts. |
Big Panda | BigPanda is an IT operations management (ITOM) platform designed to help organizations monitor, analyze, and resolve issues within their IT environments more efficiently. It primarily focuses on IT incident management and event correlation by aggregating alerts from various monitoring tools and systems into a single platform. |
Cisco Meraki | Cisco Meraki provides cloud-managed networking for Wi-Fi, routing, security, and IoT. This integration enables organizations to retrieve organization and network details, monitor security events, manage firewall rules, control destination lists, and fetch network alerts and event history. |
Cisco Umbrella Cloud Security | Cisco Umbrella Cloud Security is a cloud-based security platform that serves as the first line of defense against internet-based threats. It provides secure web gateways, DNS-layer security, and cloud-delivered firewall capabilities, ensuring comprehensive protection for users, devices, and data across various locations, both on and off the network. This integration enables organizations to manage destination lists, including adding or removing destinations from specified lists. |
Deep Instinct V2 | Deep Instinct V2 (using latest REST API version v1) is an endpoint security platform that aims to prevent, detect, and respond to zero-day malware, ransomware, and other advanced threats before they can compromise endpoints or networks. It functions as an endpoint detection and response (EDR) tool, among other capabilities, offering flexible and customizable cybersecurity solutions for modern security operations. |
ExtraHop Reveal(x) v2 | ExtraHop Reveal(x) uses wire data and artificial intelligence to analyze the behavior that impacts critical assets. |
F5 Application Security Manager (WAF) | F5 Application Security Manager (WAF) is a unified cloud security platform designed for both cloud security and development teams, offering capabilities for prevention, active detection and response. |
Grafana | Grafana is an open-source platform for monitoring, observability, and data visualization. It enables organizations to create dynamic, interactive dashboards that display metrics and logs from various sources. This integration enables clients to send Loki log messages and Metrics to Grafana. |
HaloPSA | HaloPSA (Professional Services Automation) is a cloud-based software platform designed to help Managed Service Providers (MSPs) and IT service businesses manage their operations efficiently. It provides tools to automate workflows, streamline service delivery, and manage client relationships. |
LimaCharlie | Limacharlie is a cloud-based cybersecurity platform designed to provide organizations with powerful tools for threat detection, response, and management. It functions as an endpoint detection and response (EDR) tool, among other capabilities, offering flexible and customizable cybersecurity solutions for modern security operations. |
Microsoft Purview eDiscovery V2 | Microsoft Purview eDiscovery V2 (formerly known as Microsoft 365 eDiscovery) is a comprehensive solution designed to help organizations locate, preserve, collect, and review electronically stored information (ESI) for compliance, legal, and investigative purposes. It is part of Microsoft's Purview suite of tools, which provide security, compliance, and risk management for organizations using Microsoft 365. This integration works with Microsoft Purview eDiscovery (Premium). |
Qualys Cloud Agent | The Qualys Cloud Agent integration enables the management of Cloud Agents, activation keys, and configuration profiles for the agents. |
SailPoint IdentityIQ | SailPoint IdentityIQ is an identity and access management software platform custom-built for complex enterprises. It delivers full lifecycle and compliance management for provisioning, access requests, access certifications, and separation of duties. |
Shodan | Shodan is a specialized search engine that scans and indexes internet-connected devices and systems. |
SOC Radar Incident V3 | SOCRadar is an Extended Threat Intelligence (XTI) SaaS platform that combines External Attack Surface Management (EASM), Digital Risk Protection Services (DRPS), and Cyber Threat Intelligence (CTI). SOCRadar Threat Intelligence is enriched with External Attack Surface Management and Digital Risk Protection, and maximizes the efficiency of your SOC team with false-positive free, actionable, and contextualized threat intelligence. This integration enables organizations to ingest and manage SOC Radar incidents(alarms). This integration is developed based on incident APIv3. |
TAXII 2 Threat Feed | Ingest threat indicator feeds from a TAXII 2 server using the Trusted Automated eXchange of Indicator Information (TAXII) protocol version 2.0 or 2.1. This integration enables organizations to retrieve threat intelligence data, which is typically represented in STIX (Structured Threat Information Expression) format. |
Vectra AI | Vectra Cognito with its new name Vectra Platform is an AI-driven cloud and network threat detection & response (NDR) platform provides customers a path to protect their journey to hybrid and multi-cloud, harness Security AI to help organizations build cyberattack resilience with broad attack coverage, clarity, and controls from the data center to the cloud. |
VulDB V2 | VulDB (Vulnerability Database) is an independent vulnerability intelligence platform that provides detailed information on security vulnerabilities across various software, hardware, and network components. |
Updated Integrations
The following integrations have been updated in this release of D3 SOAR.
Integration Name | Changes |
Fluency | New Command(s)
|
FortiGate | New Command(s)
|
Freshservice | New Command(s)
|
LogRhythm Rest | Enhanced Command(s)
|
Microsoft Entra ID Protection (Azure AD Identity Protection) | New Command(s)
|
Microsoft Entra ID (Azure Active Directory) | New Command(s)
|
Microsoft Intune | New Command(s)
|
Microsoft Sentinel | Enhanced Command(s)
|
Office 365 | New Command(s)
Enhanced Command(s)
|
Tenable.io | New Command(s)
|
Veeam Backup & Replication | New Command(s)
|
Deprecated Integrations
Integration Name | Replacement |
Github (Deprecated) | Github |
VulDB (Deprecated) | VulDB V2 |