
My Dashboards
LAST UPDATED: MARCH 4, 2025
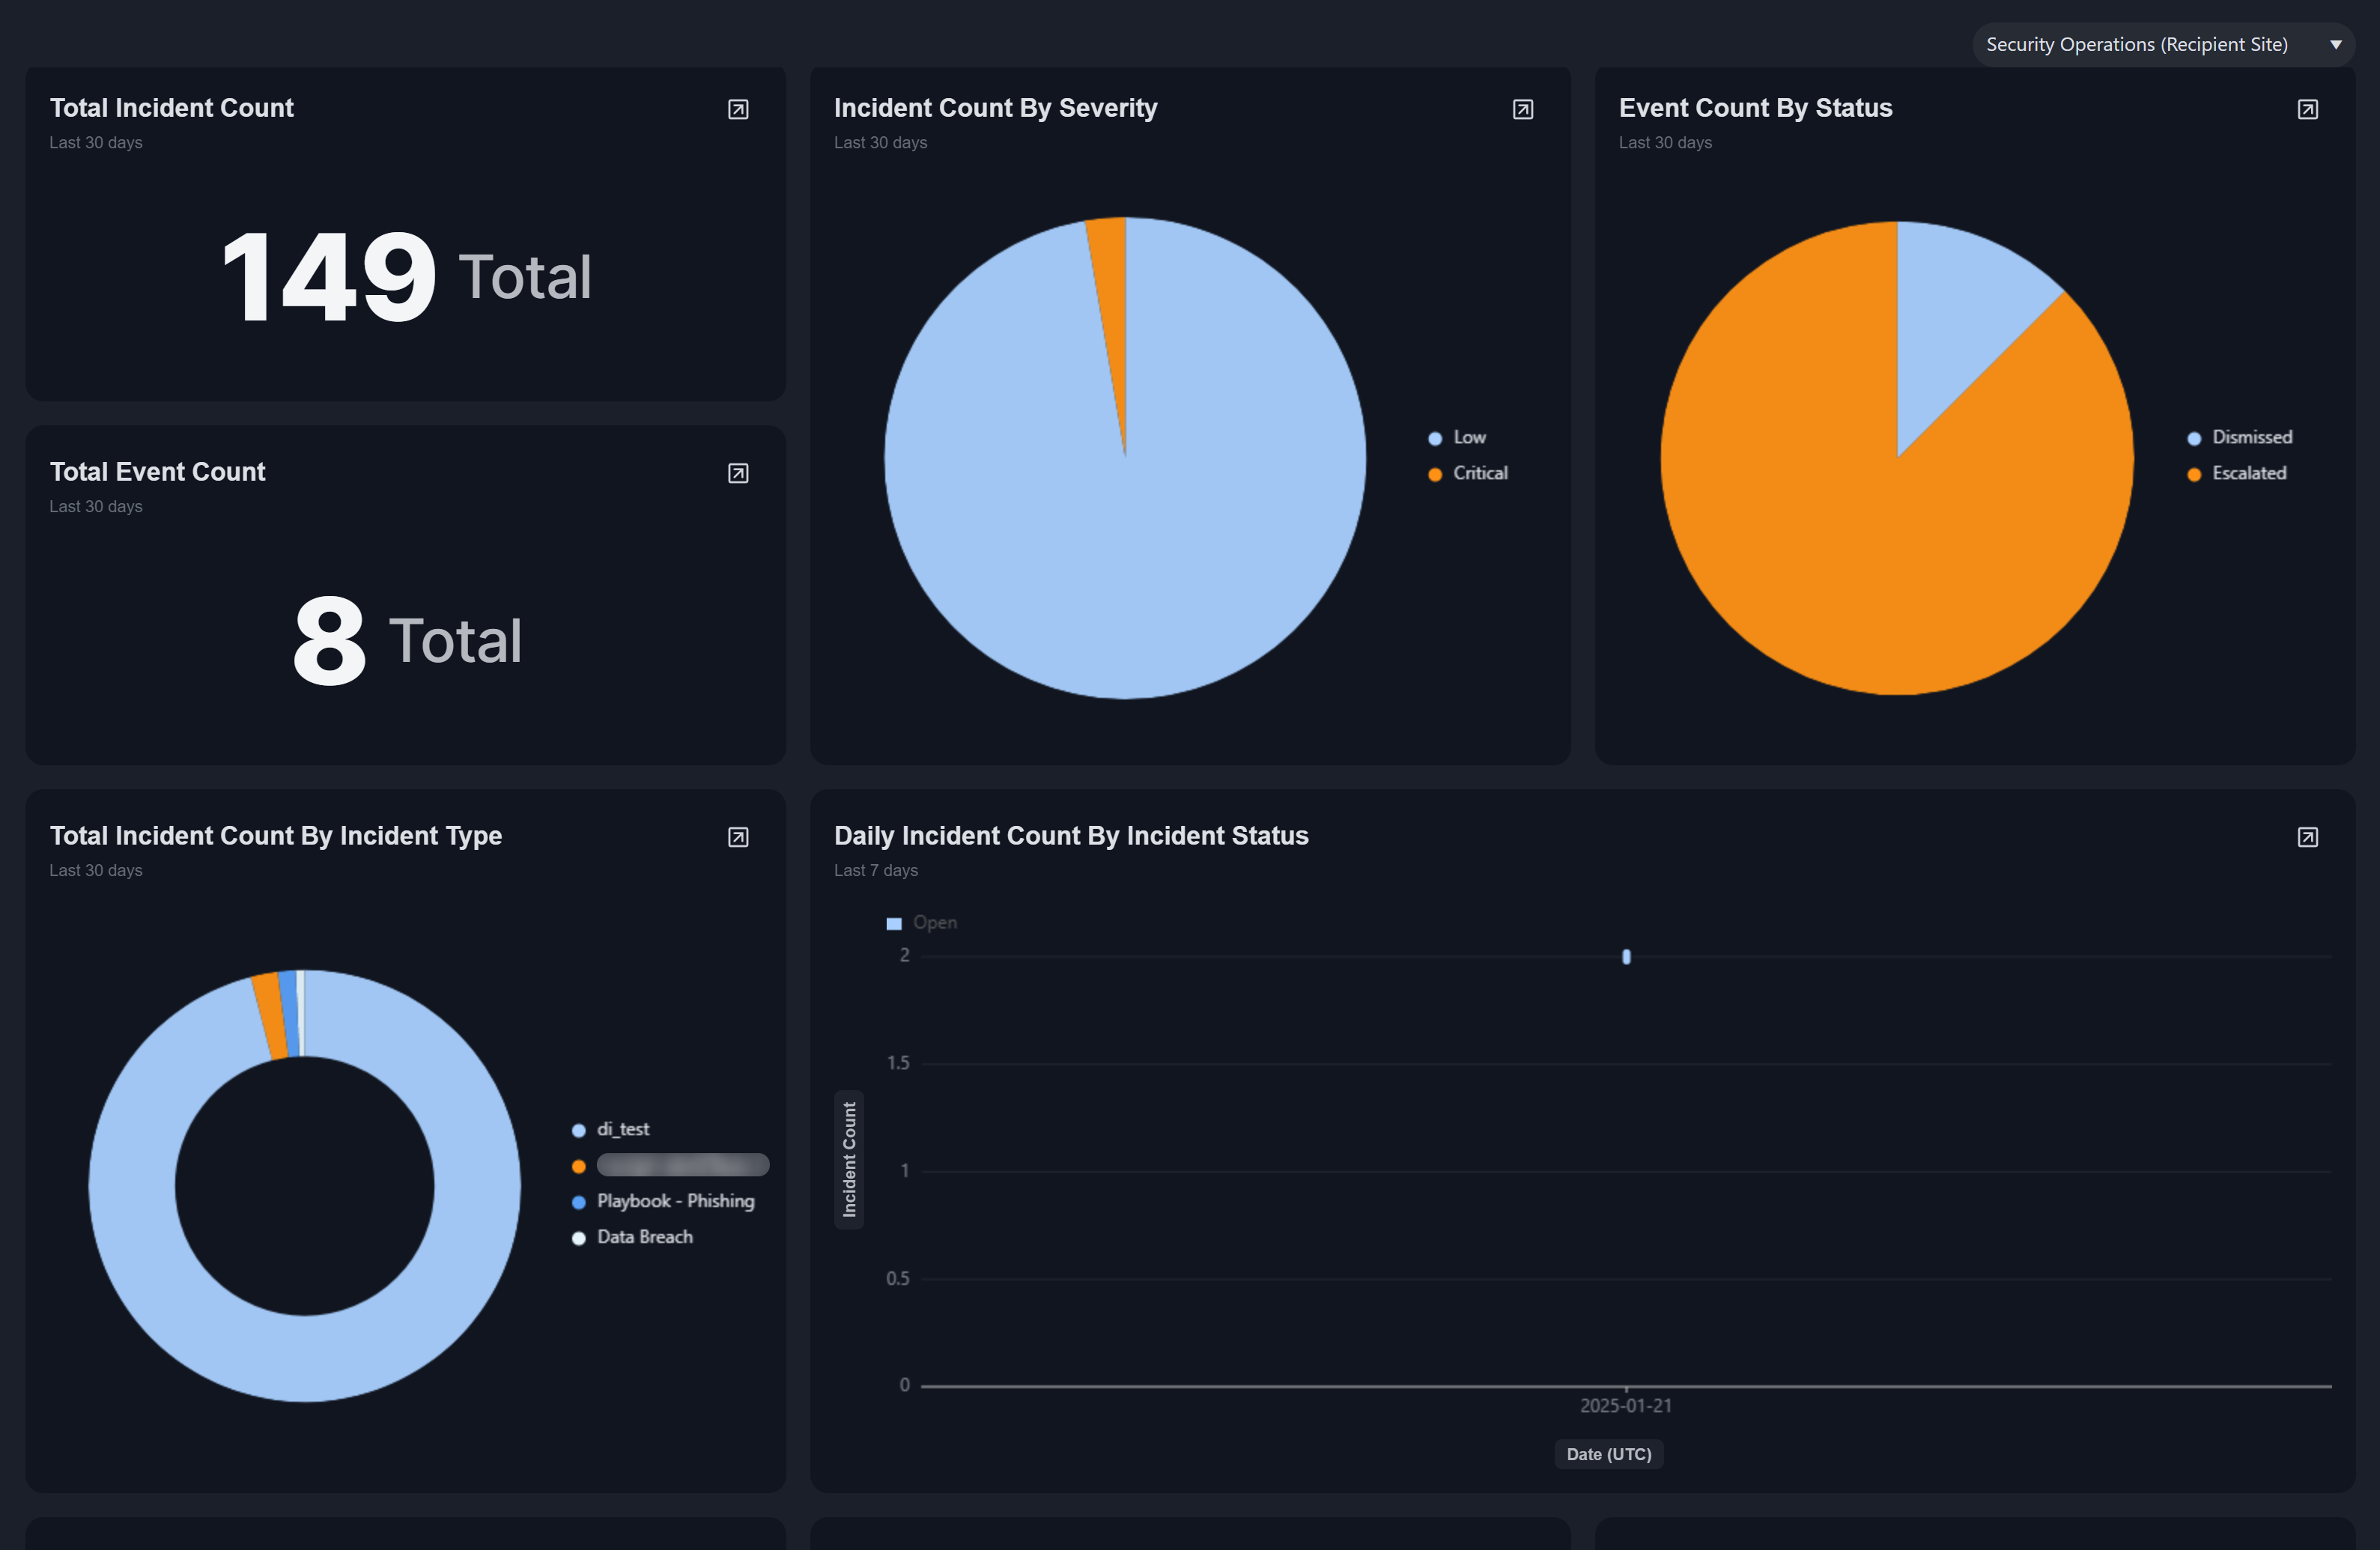
The new My Dashboards feature on the investigation dashboard enables users to add dashboards configured in the Reporting Dashboard tab, allowing them to personalize their data visualization to focus on the metrics most critical to their operational needs.
.png?inst-v=f0ae511a-7398-4e63-b935-74c903306443)
A dashboard is comprised of widgets that provide a high-level overview of metrics, such as the total number of incidents, the distribution of incidents by severity, and the status of events. This information can help users assess the overall health of the security system, enabling more informed decisions about resource allocation and incident mitigation strategies.
Adding a Dashboard
Users can add one or multiple dashboards to their investigation dashboard by following these steps:
Hover over the My Dashboards accordion, then click on the
.png?inst-v=f0ae511a-7398-4e63-b935-74c903306443) button.
button.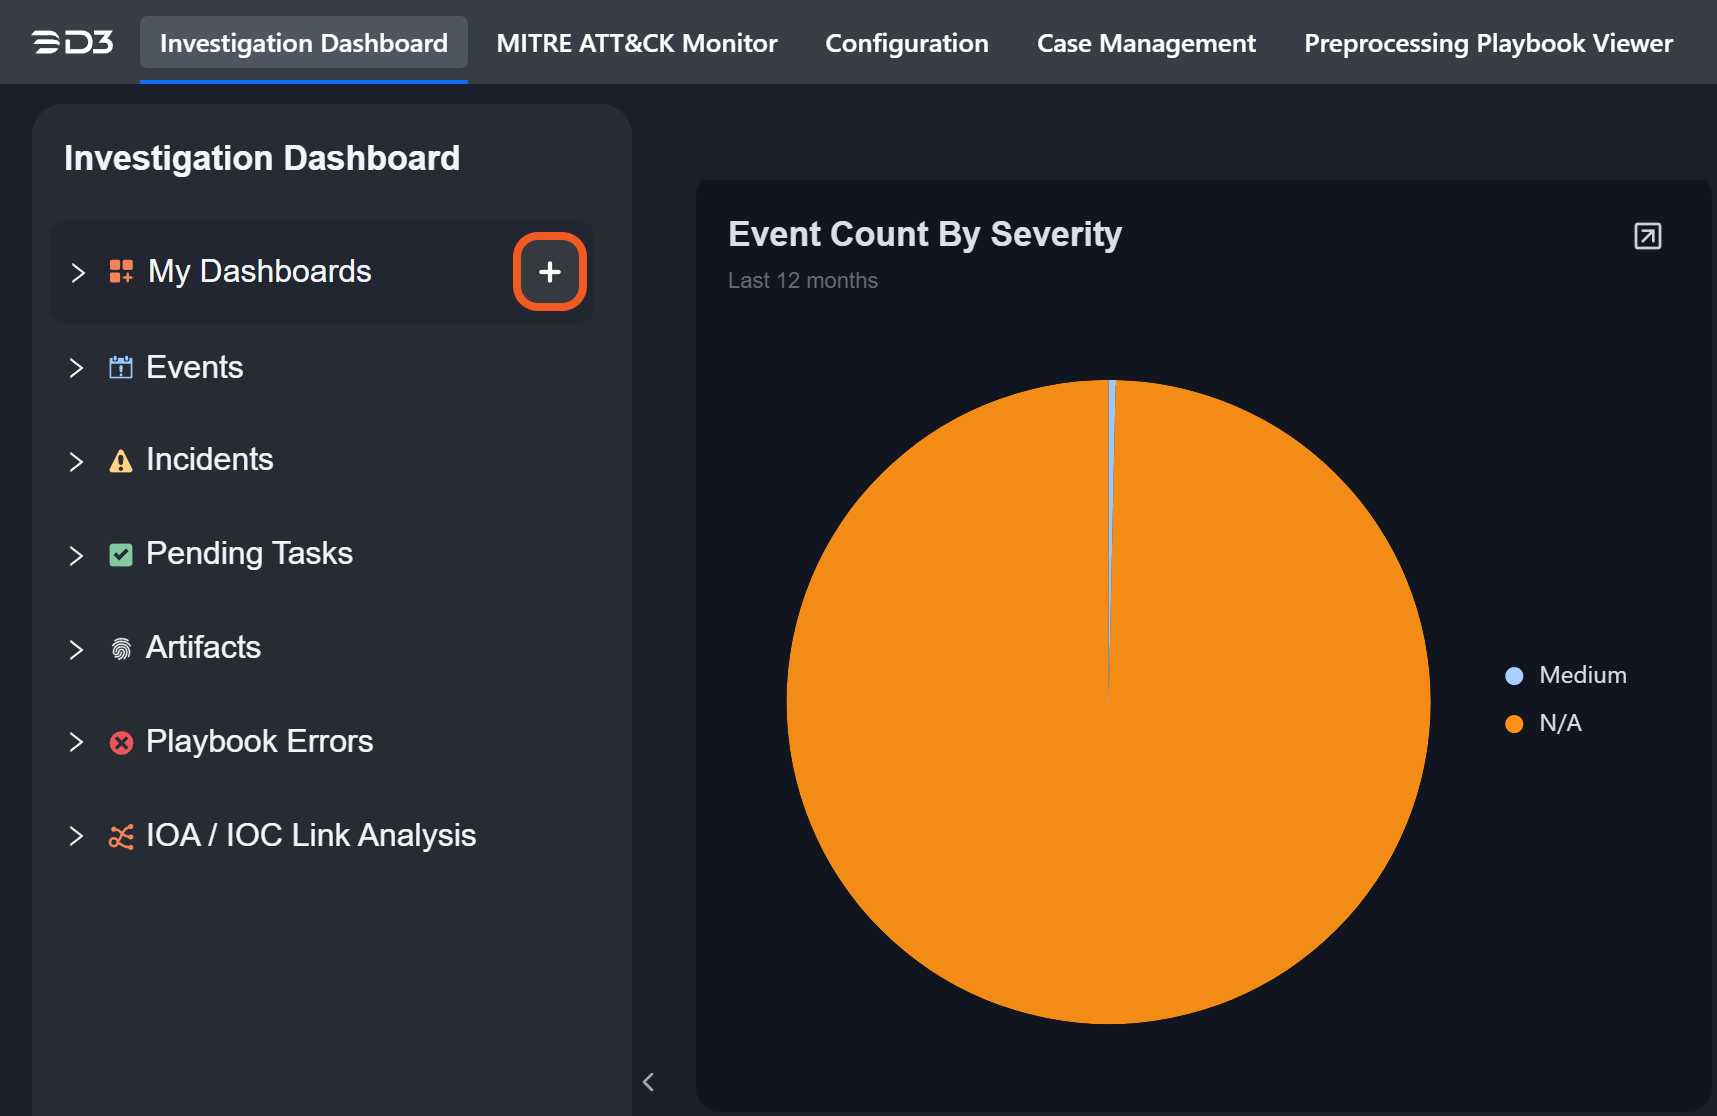
Search for and select one or multiple dashboards to add, then click on the Save button.
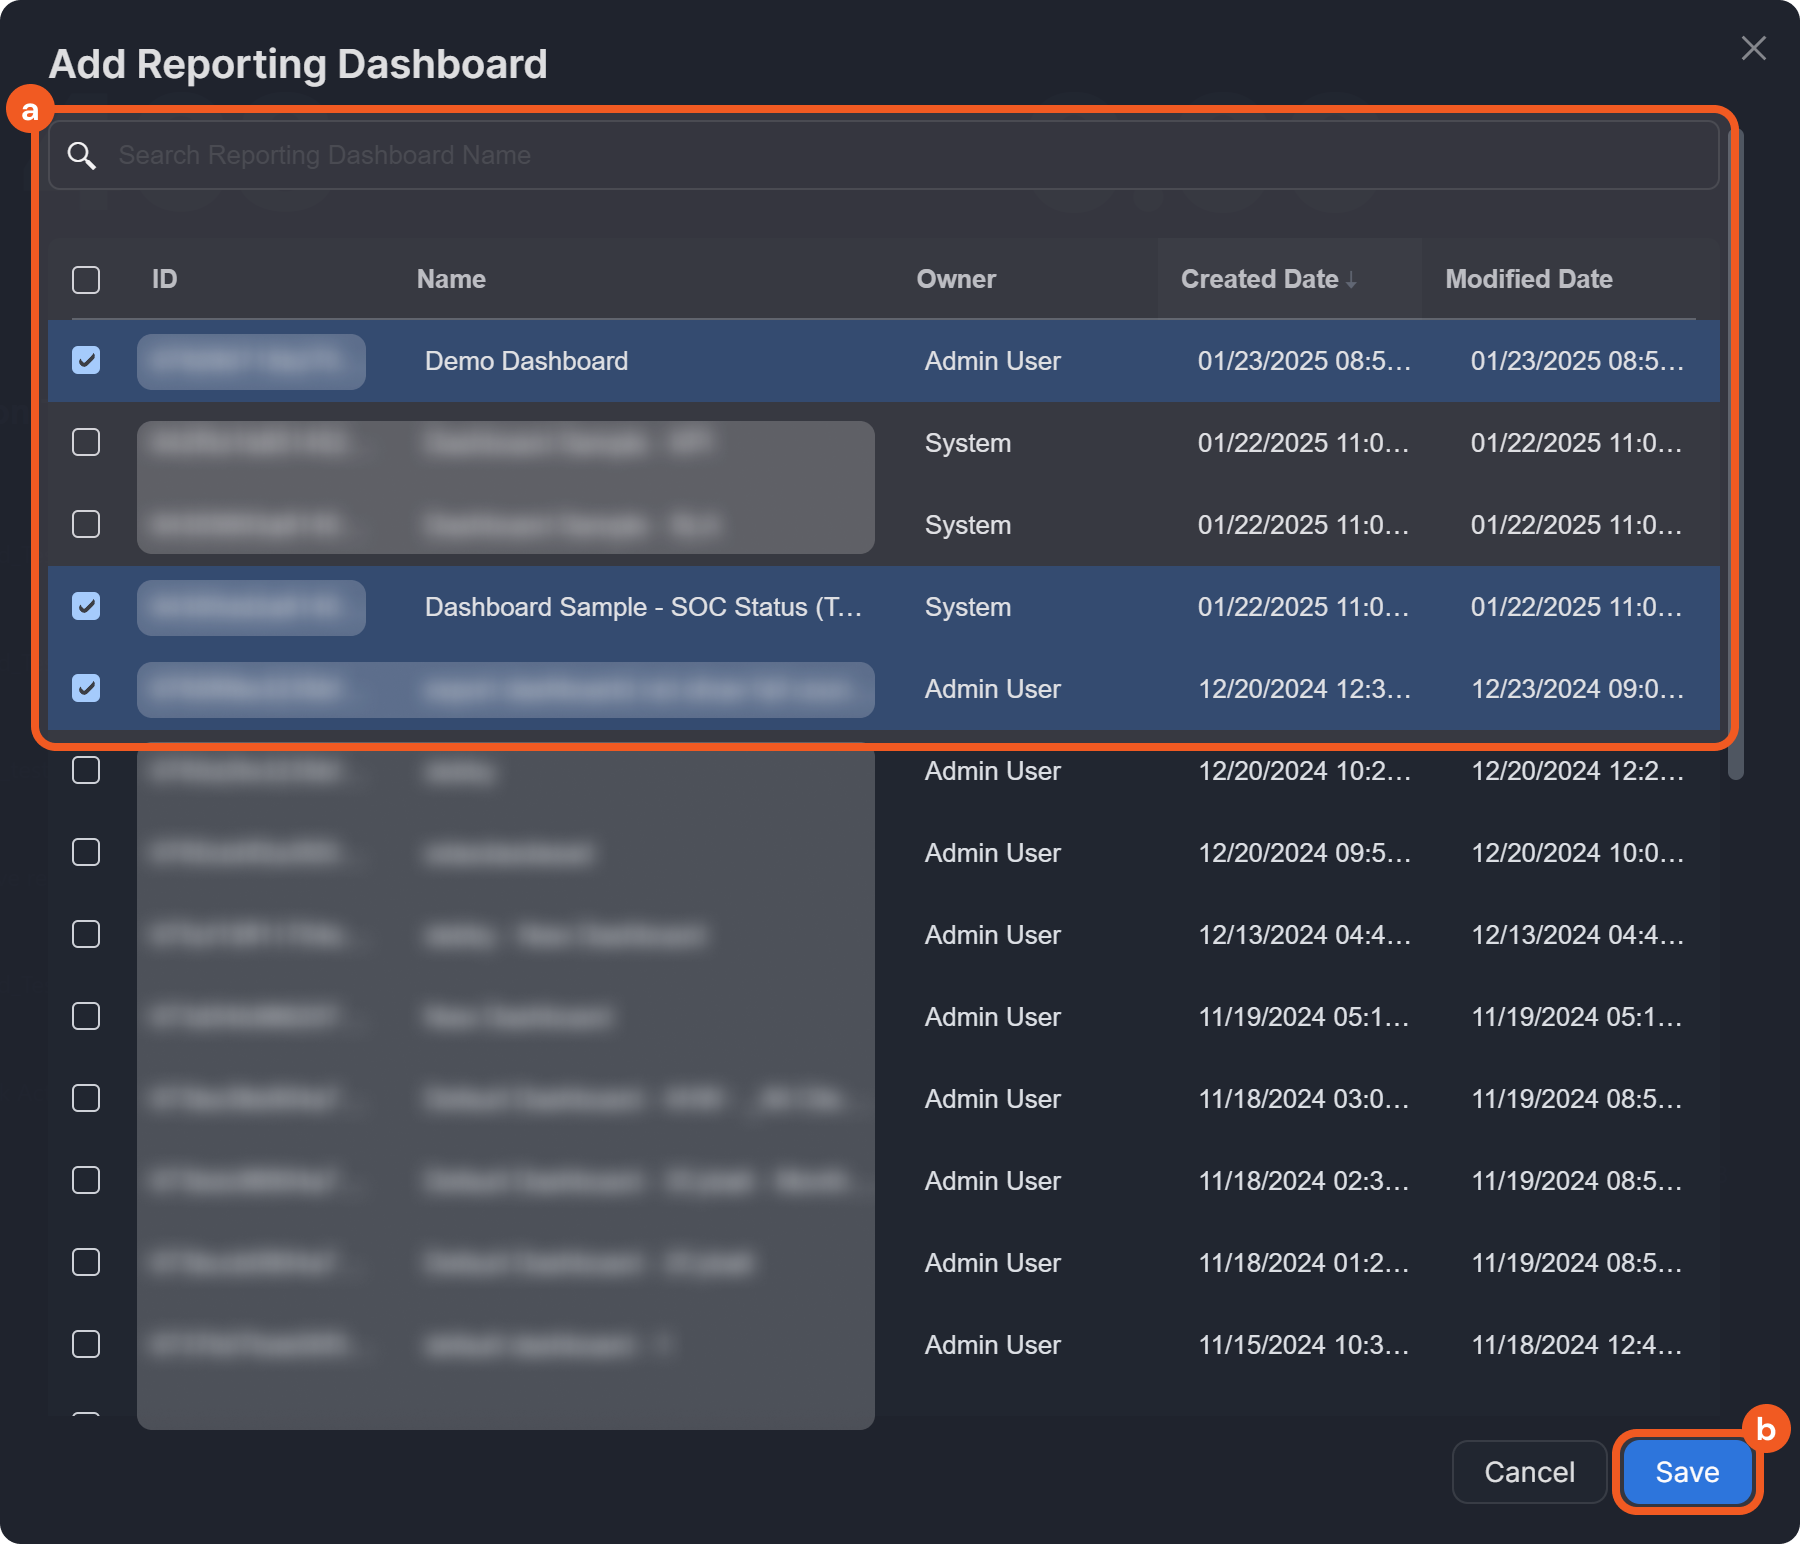
If multiple dashboards are selected, they will be added as separate dashboards.
Confirm that the dashboards have been added.
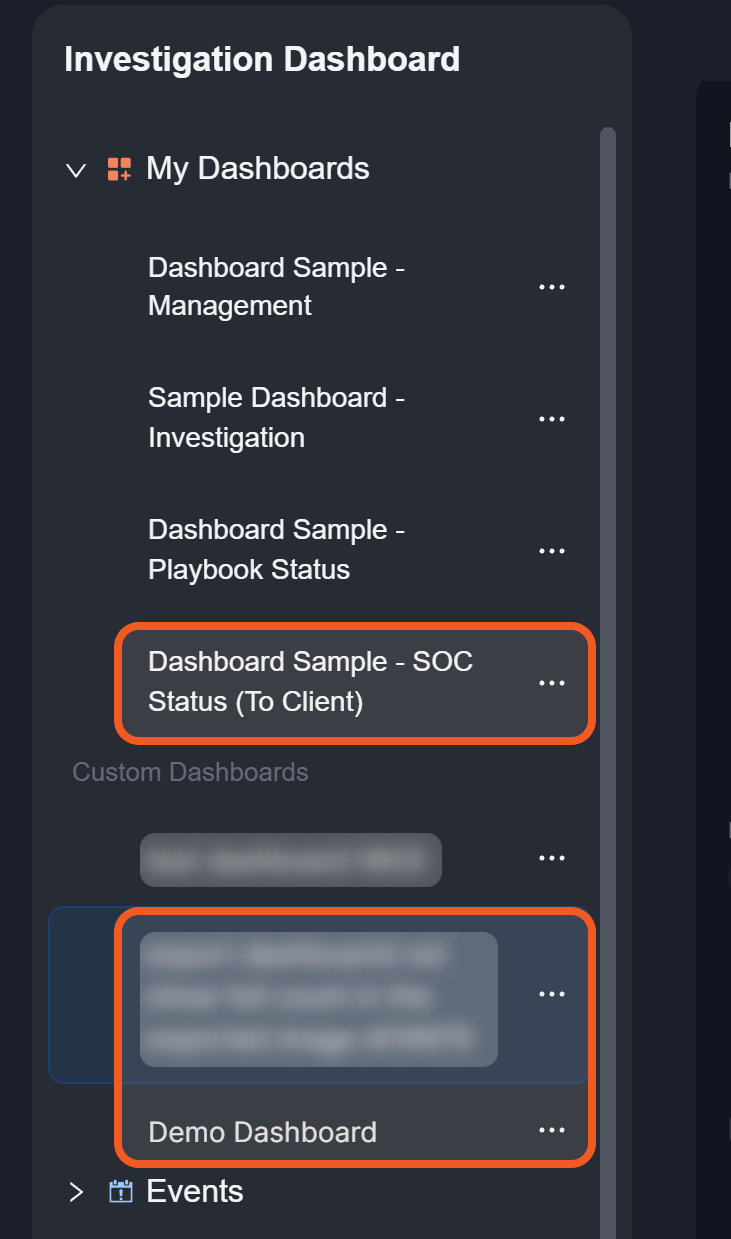
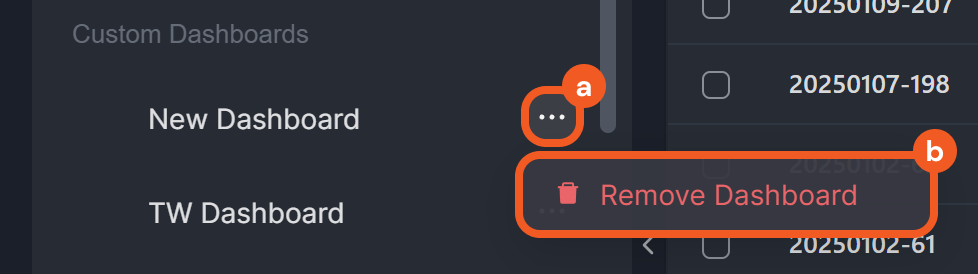
Built-in dashboards will appear at the top, while user-created dashboards will appear under the Custom Dashboards heading.
READER NOTE
Users can remove a dashboard by clicking on the  button, then clicking the Remove Dashboard button.
For information on creating and editing a custom dashboard, refer to the Reporting Dashboard documentation.