
Reporting Dashboard
LAST UPDATED: MAR 10, 2025
The Reporting Dashboard module enables security managers, SOC teams, and MSSPs to monitor operational KPIs, security posture, and SOC performance.
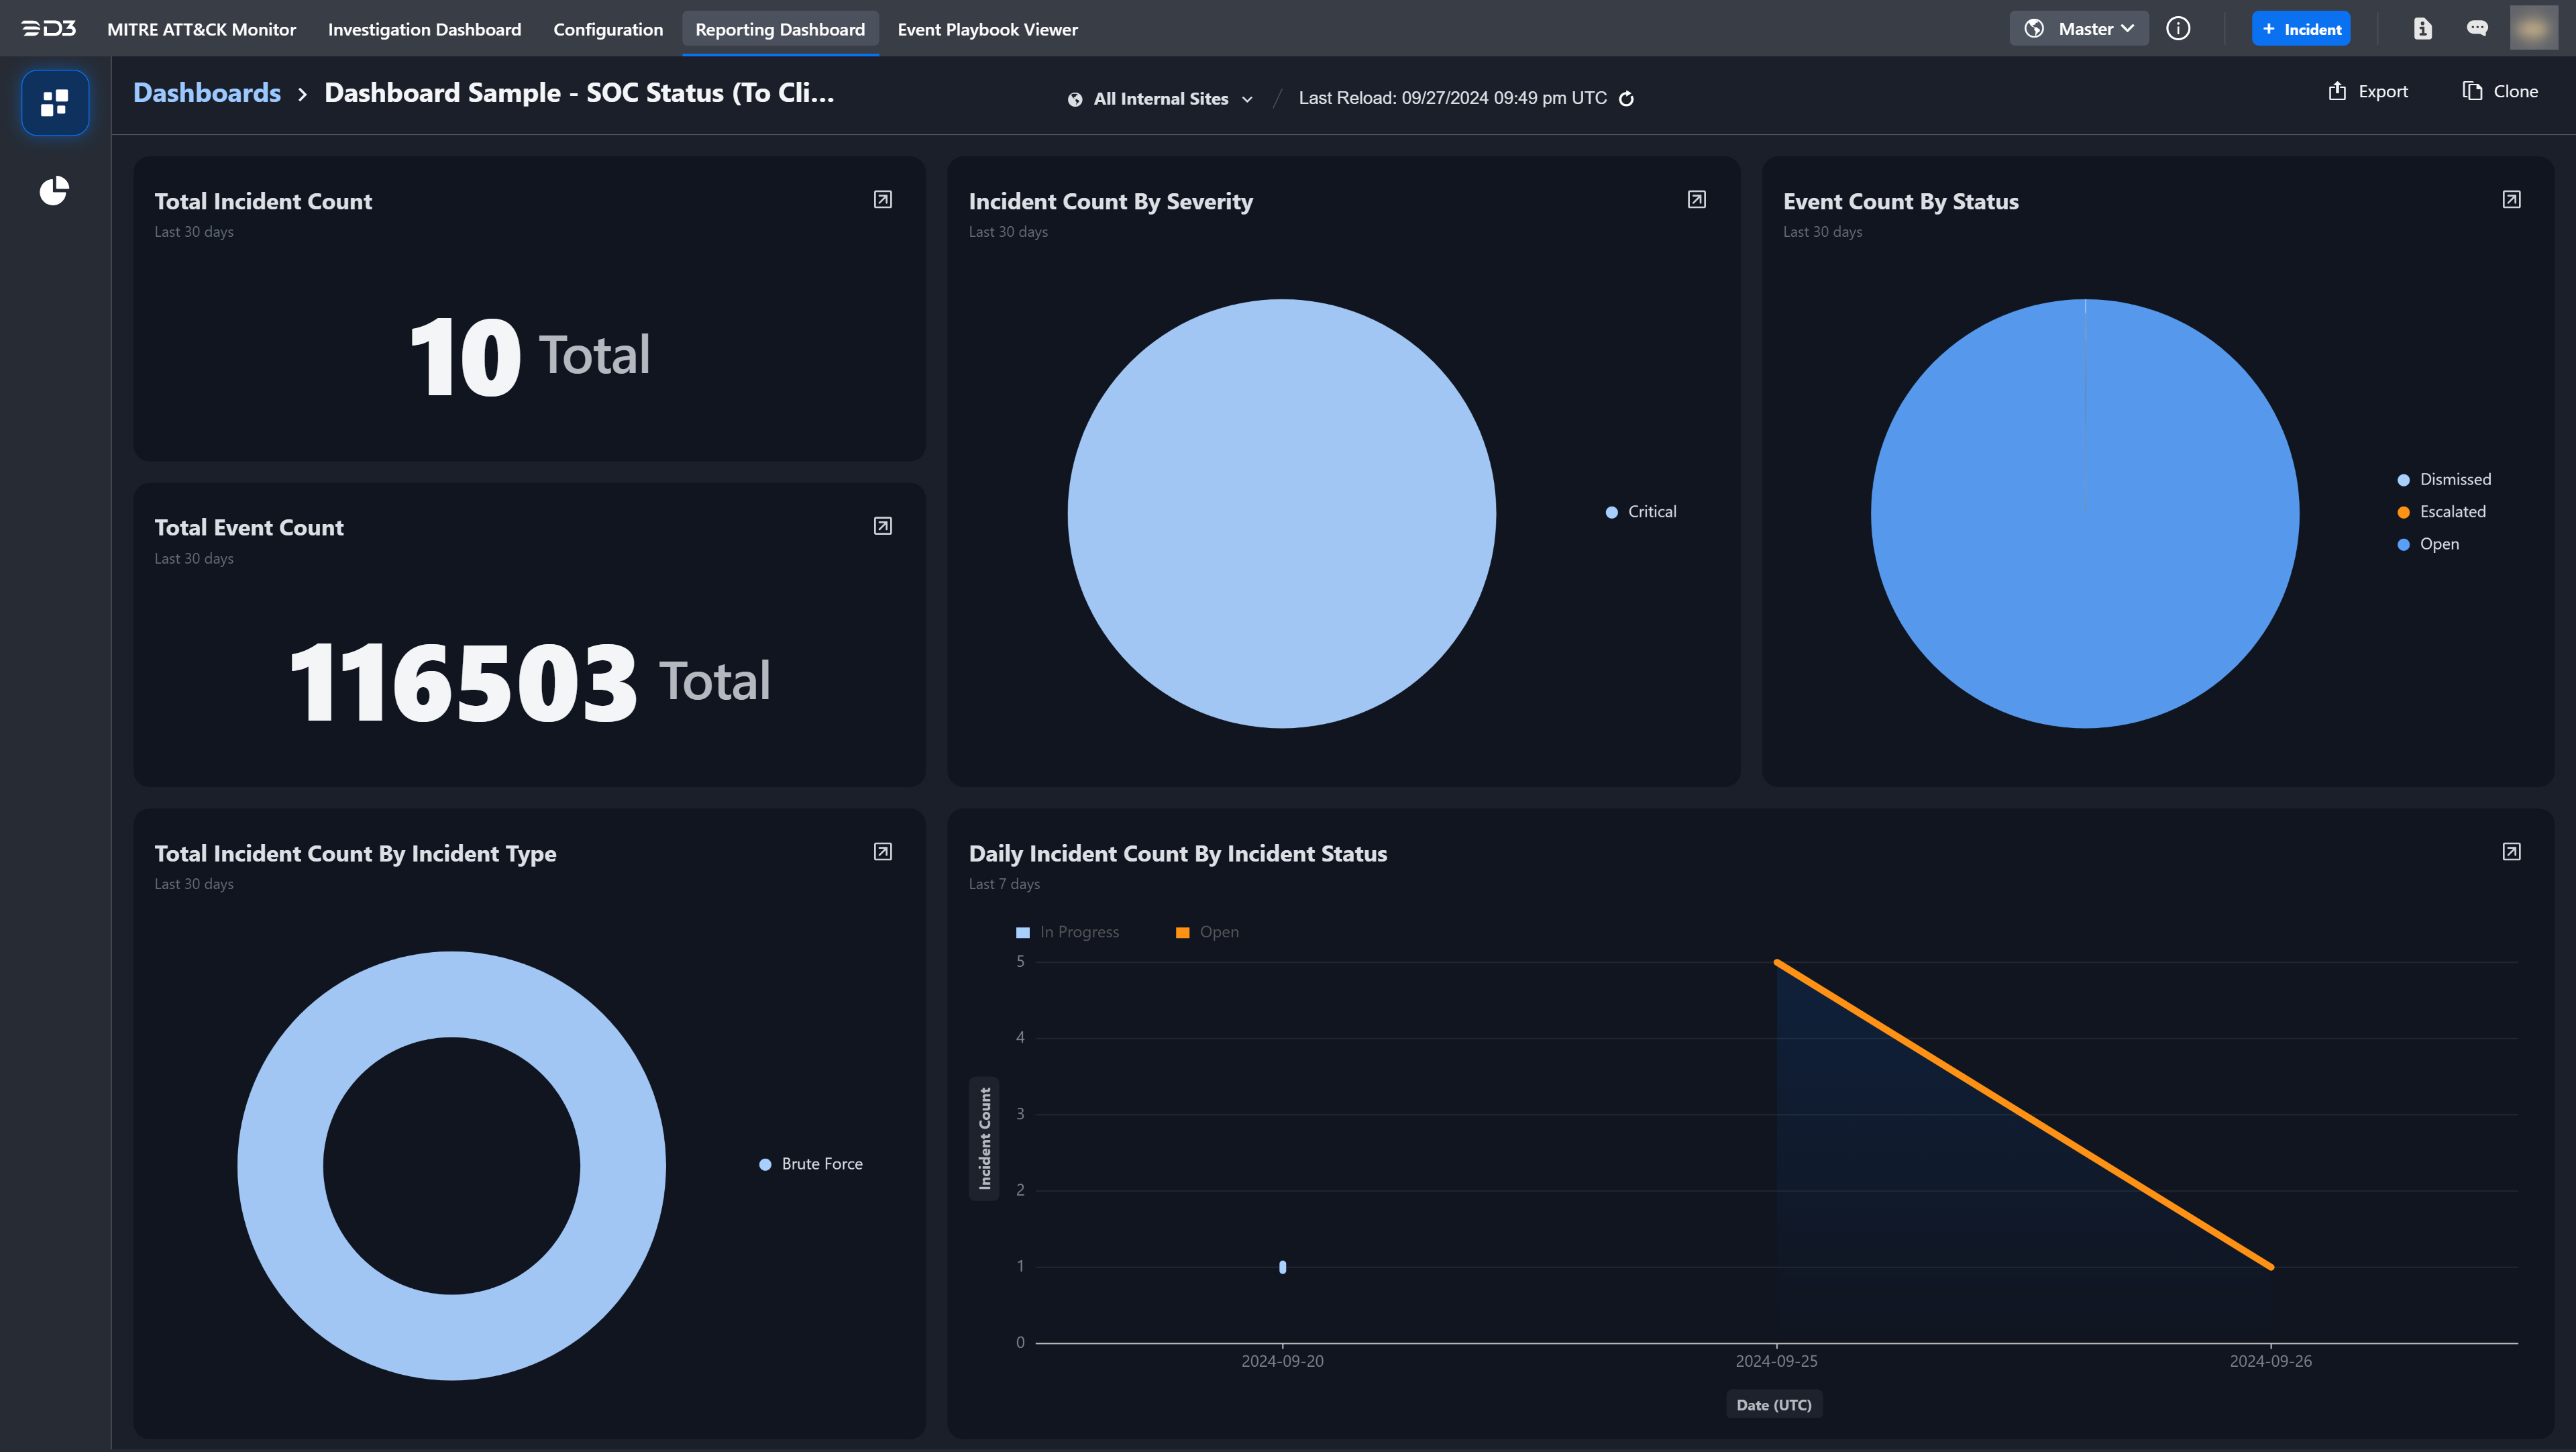
The Reporting Dashboard module is divided into two sub-modules: Dashboards and Widgets. The former provides a centralized interface for monitoring, while the latter serves as the building blocks by visually representing security data.
Each widget is created through a three-step process:
Running a Query: Use the codeless query builder to define the data source, filters, and logic.
Selecting a Visualization: Choose a format such as line charts, bar charts, pie charts, tables, or others.
Customizing the Widget: In the next-step configuration page, refine fields and display options based on the selected visualization, ensuring the data is presented in a clear and actionable format.