RD Dashboards
LAST UPDATED: MAR 10, 2025
Dashboards are collections of widgets consolidated into a single display. Widgets must be configured before they can be added to a dashboard. Once a dashboard is created, you have the option to clone it, schedule email notifications to share the dashboard through a viewable link, export it as a PNG image, and set specific viewing permissions.
Viewing a Dashboard
Dashboards you have created or have viewing or editing permissions for live under the Dashboard tab. To view a specific dashboard, simply select it from the list.
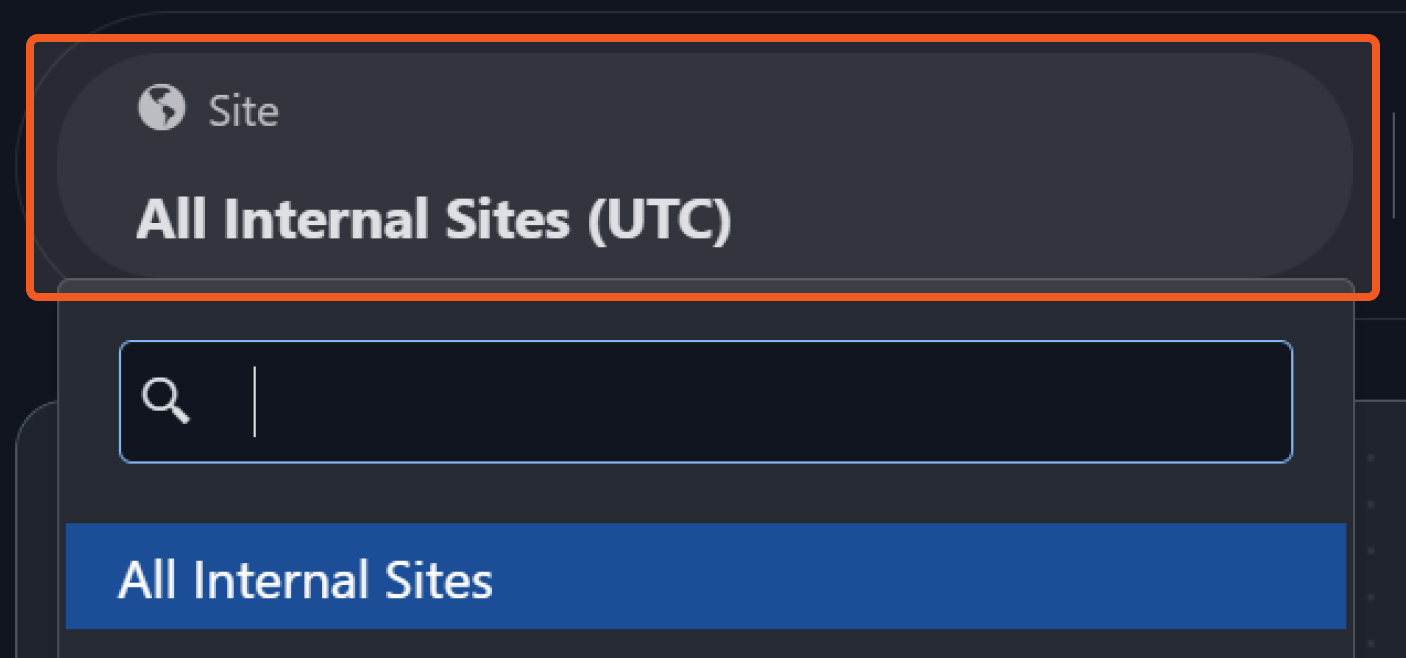
Once inside a dashboard, you can customize the displayed data by using the dropdown site filter located in the top toolbar. This allows you to focus on specific sites, such as all internal sites or all client sites, providing a more targeted view of the data.
%201.png?inst-v=f0ae511a-7398-4e63-b935-74c903306443)
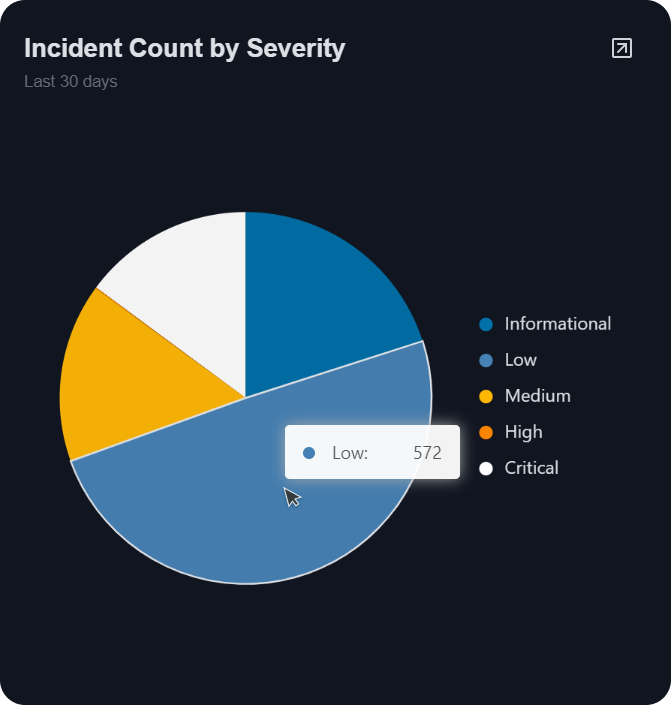
When you hover your cursor over data points on widgets within a dashboard, you will reveal additional information. For example, hovering your cursor over a slice on a pie chart will display the aggregation value of that slice.
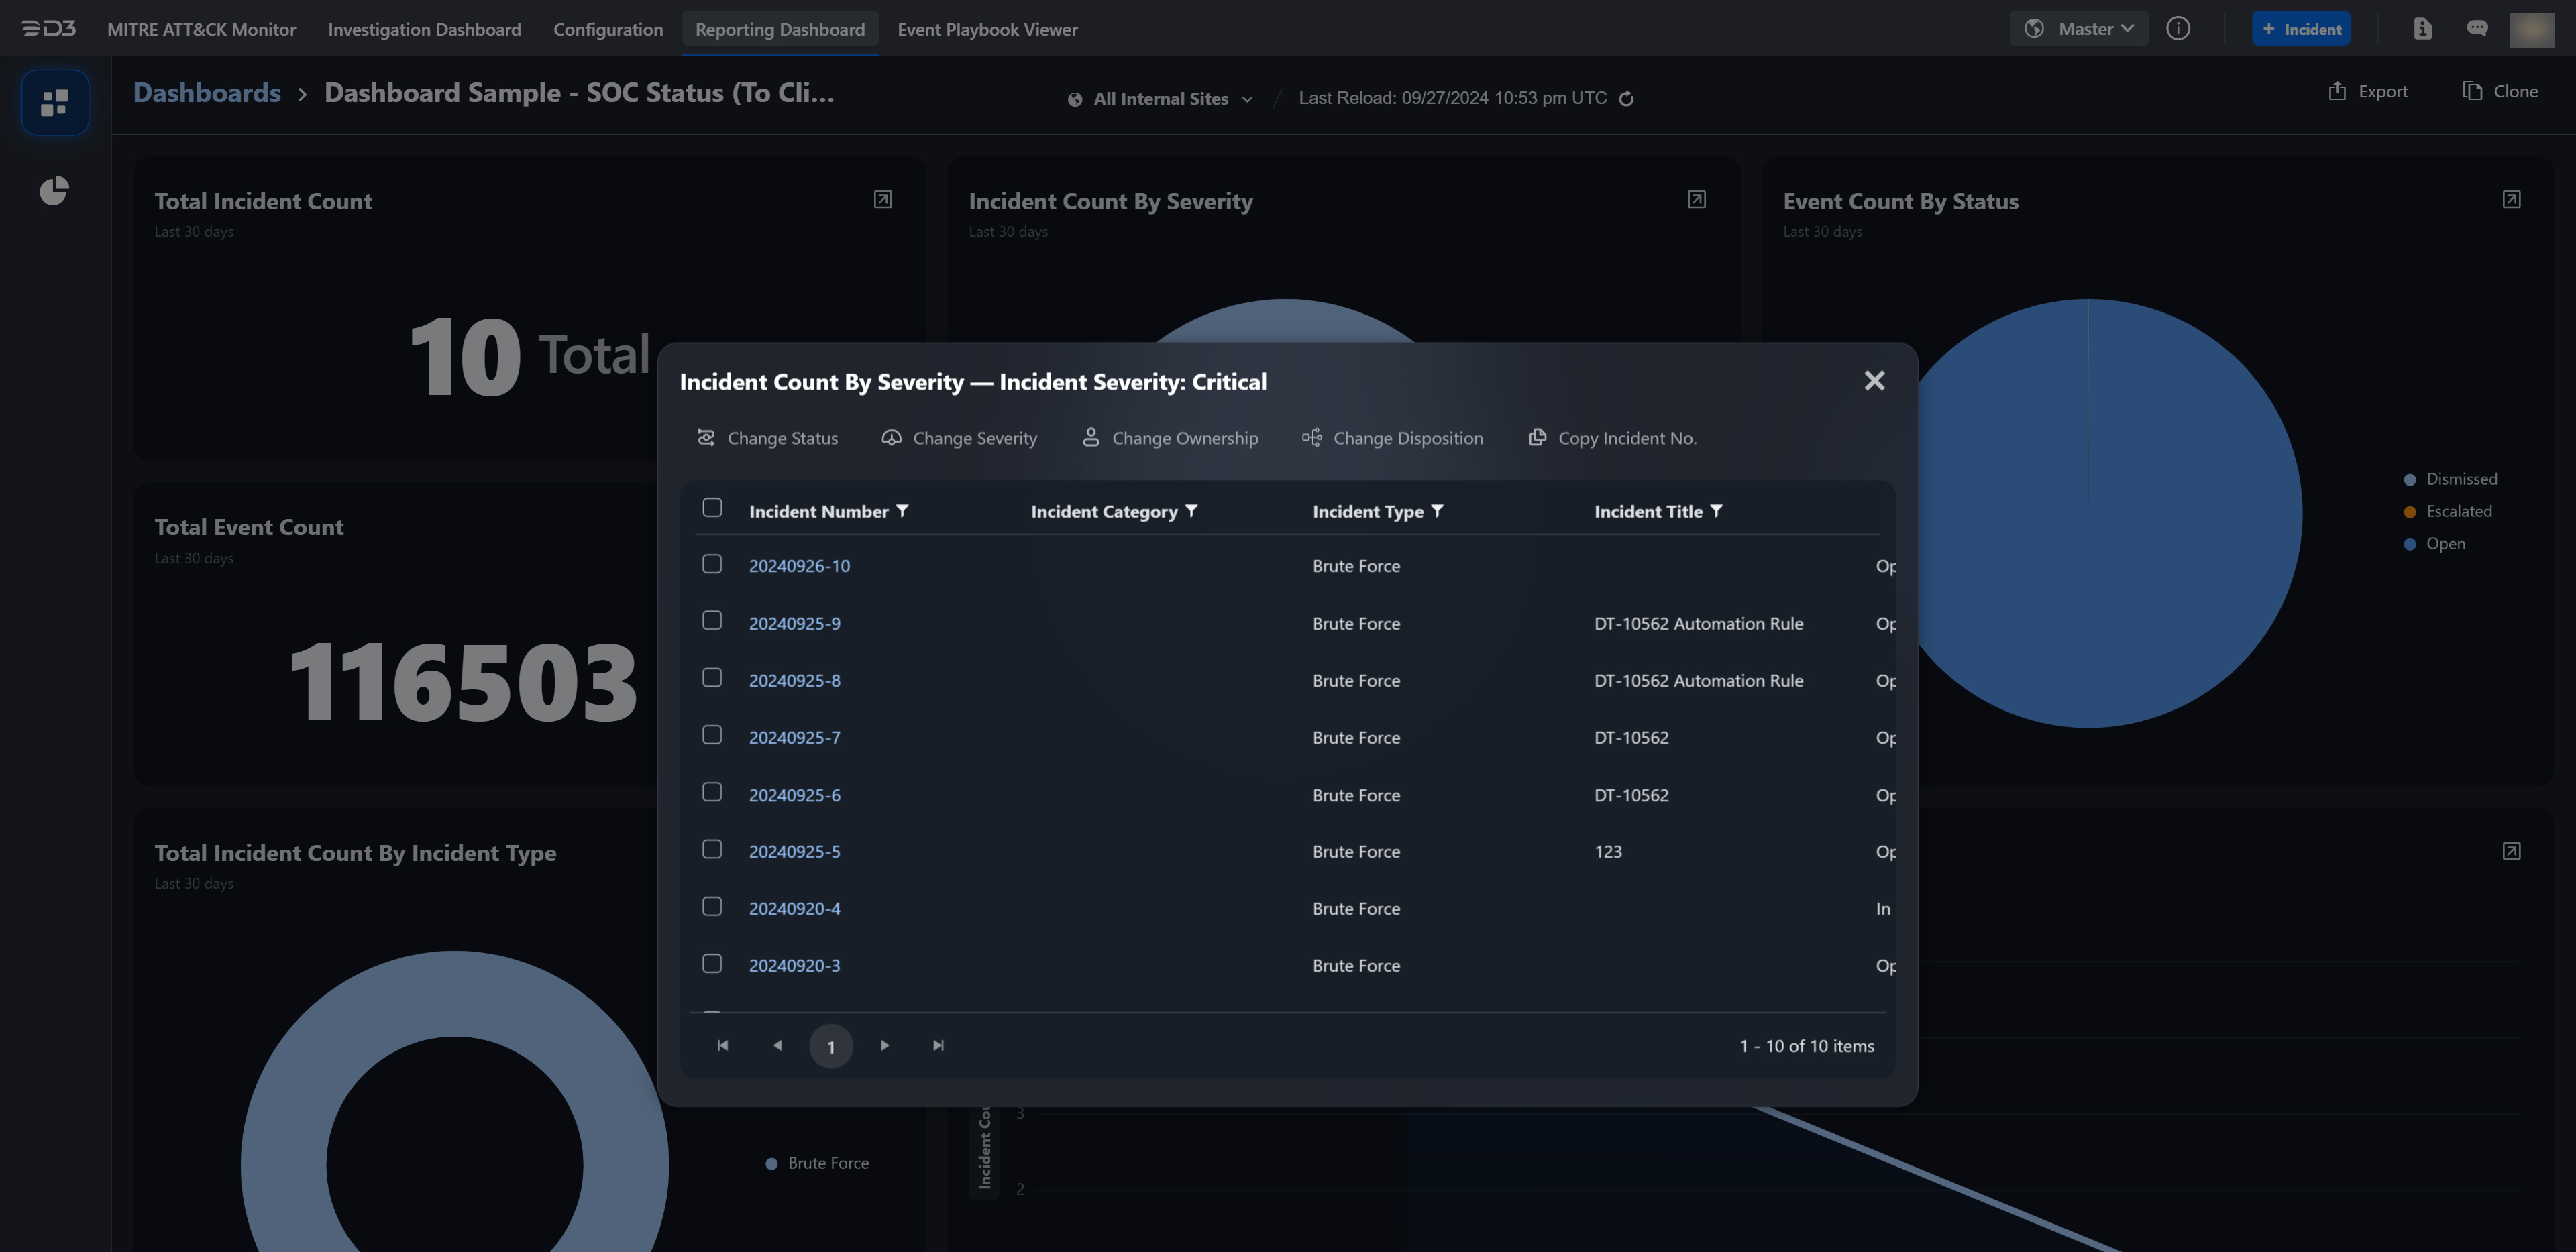
You can view the widget's original data by clicking on it. This allows you to delve deeper into the details and explore the data behind the visualization.
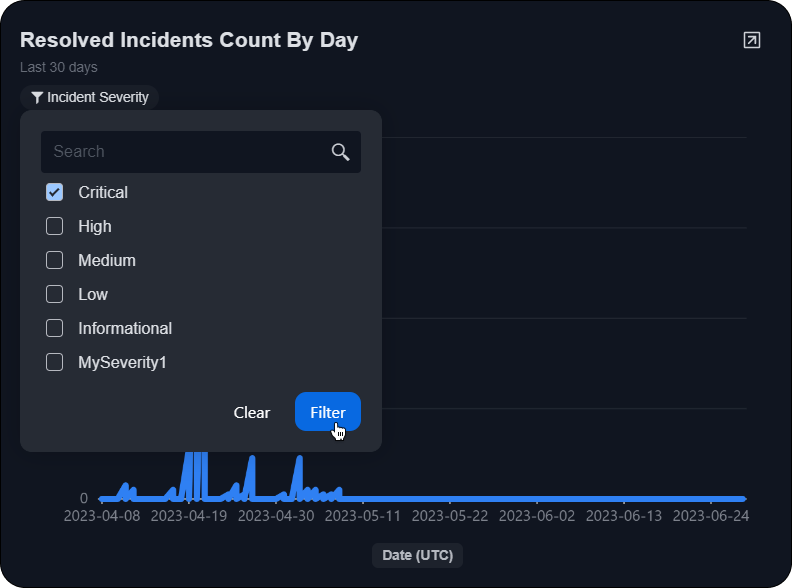
Certain widget types can be configured with filters to enable you to refine the displayed data further. You can add filters by configuring the "Filterable Columns" field when setting up a widget. For example, with a line chart widget showing the number of resolved incidents in the past 30 days, you can click on the severity level filter to include or exclude specific severity levels from the chart's display.
Creating a Dashboard
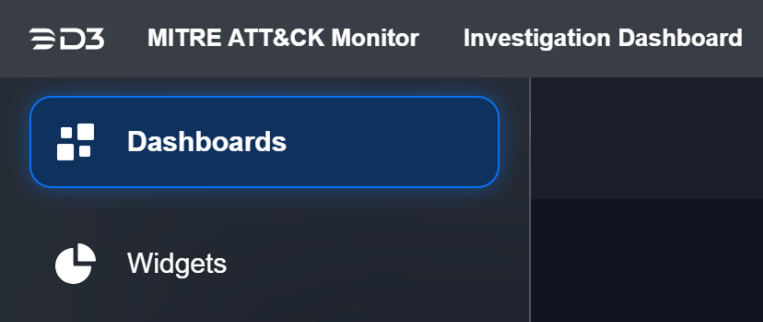
Open the Dashboards tab from the left sidebar.
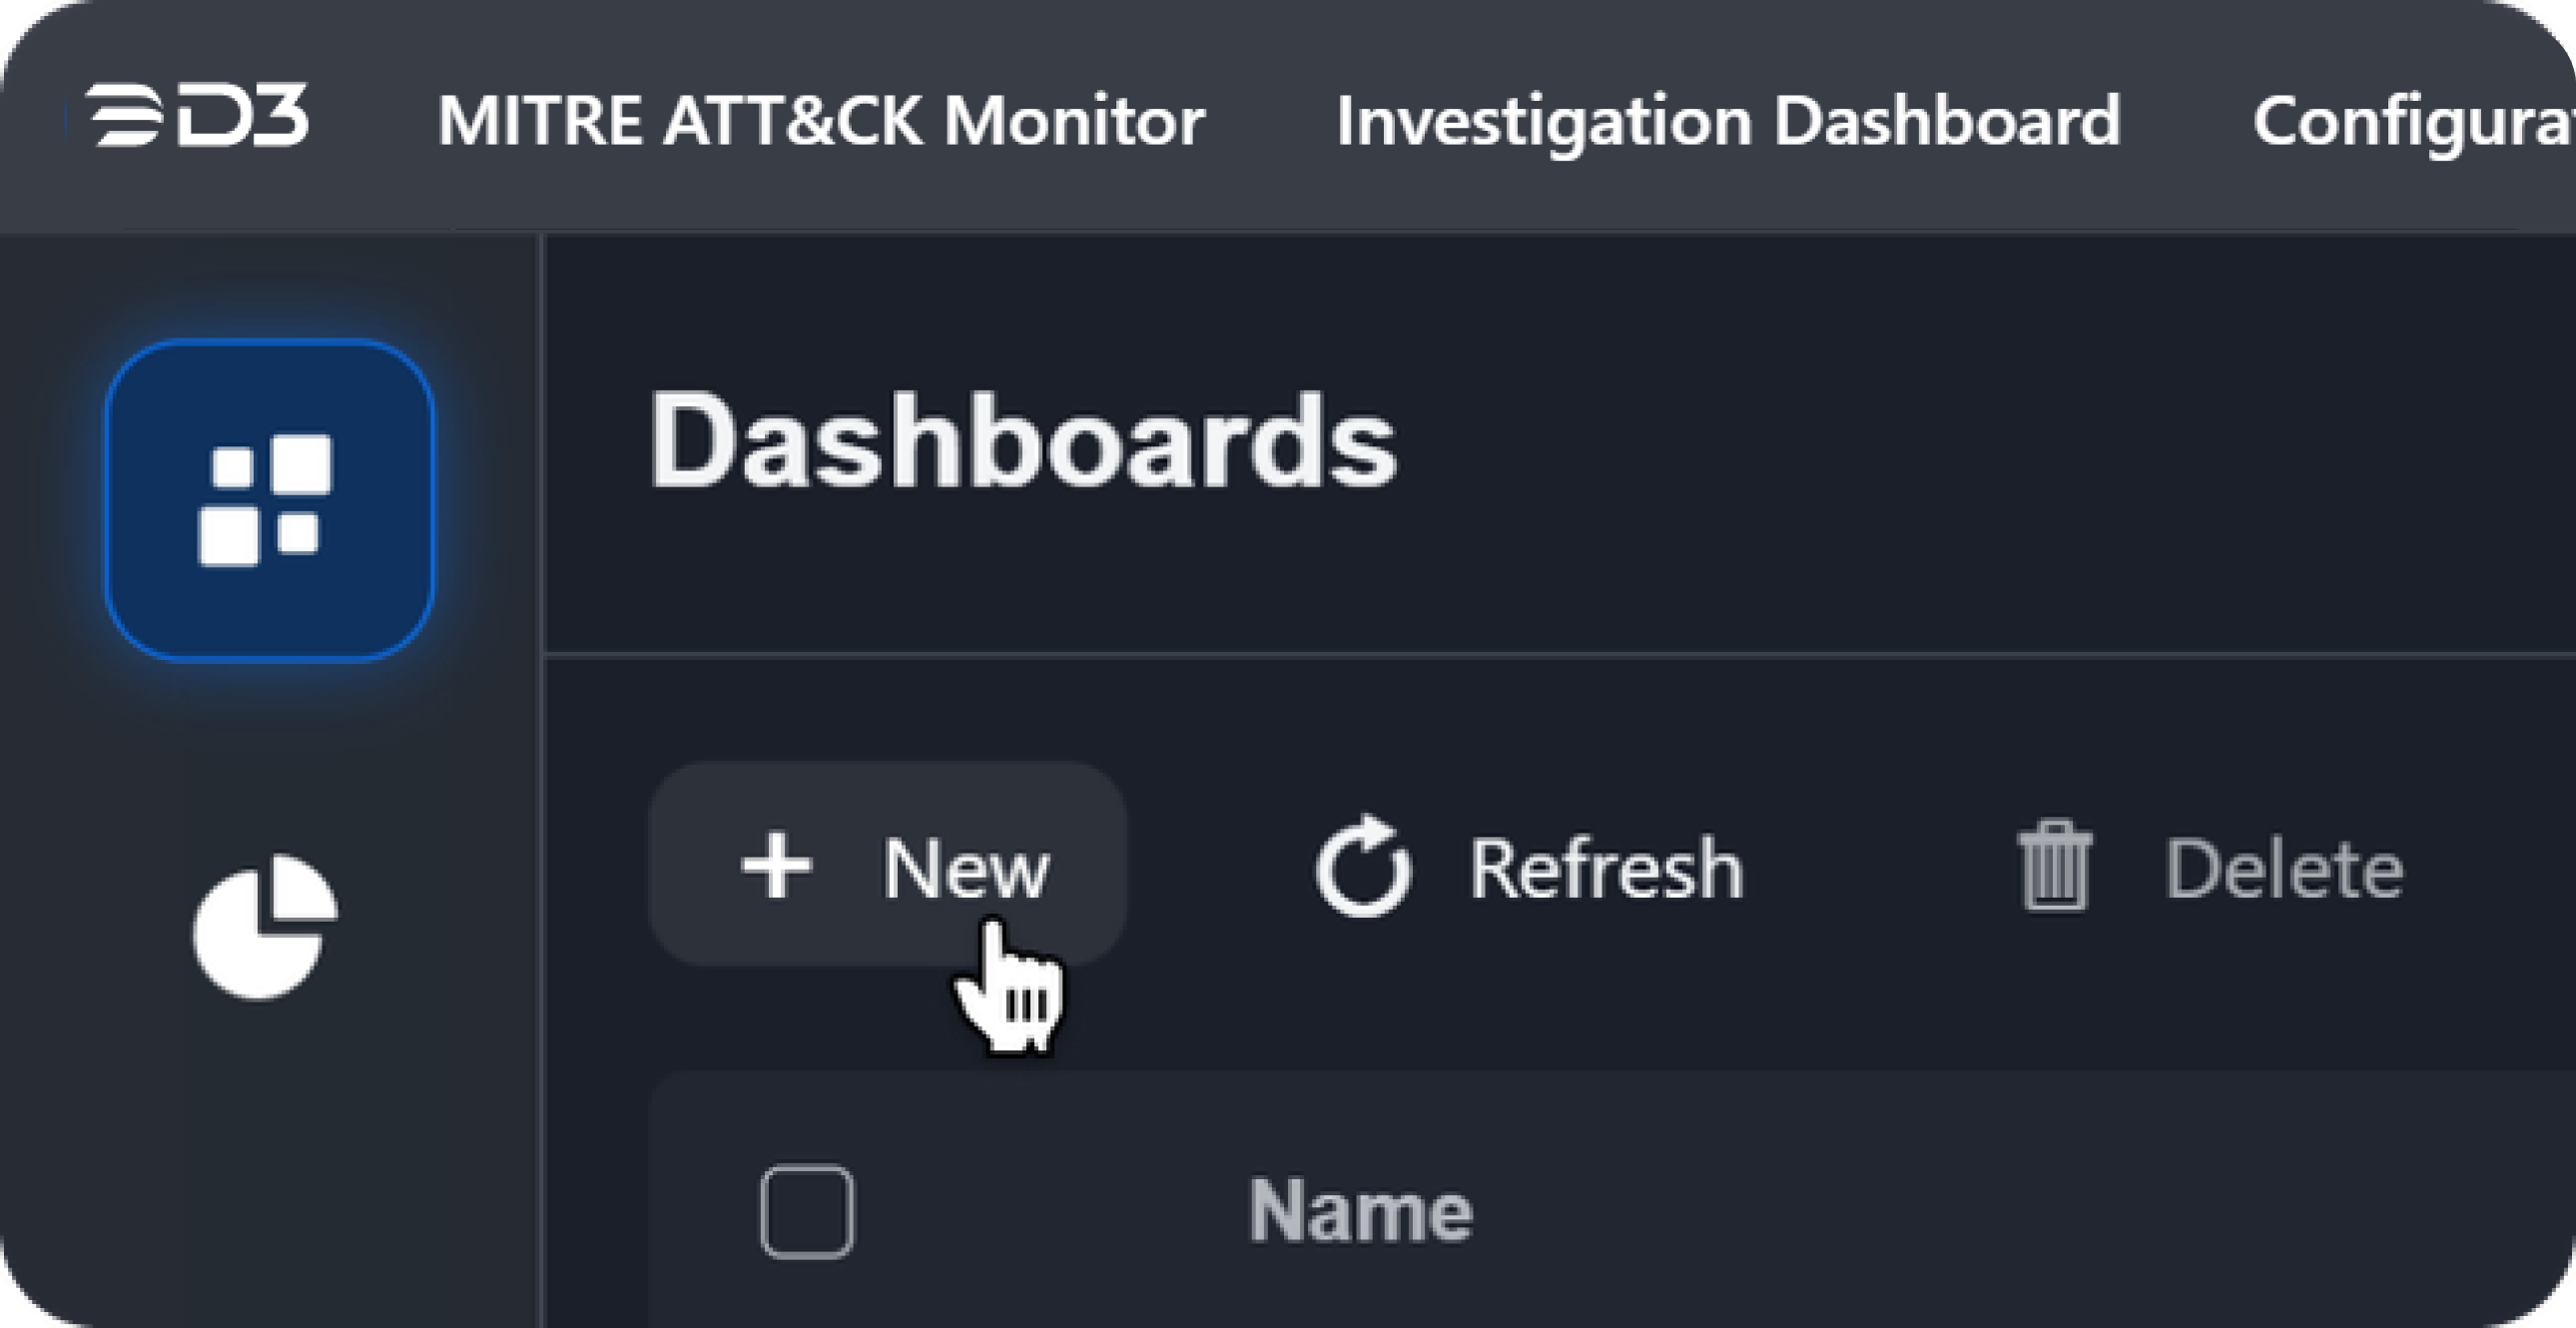
Click on the +New button on the dashboards page to begin creating a new dashboard.
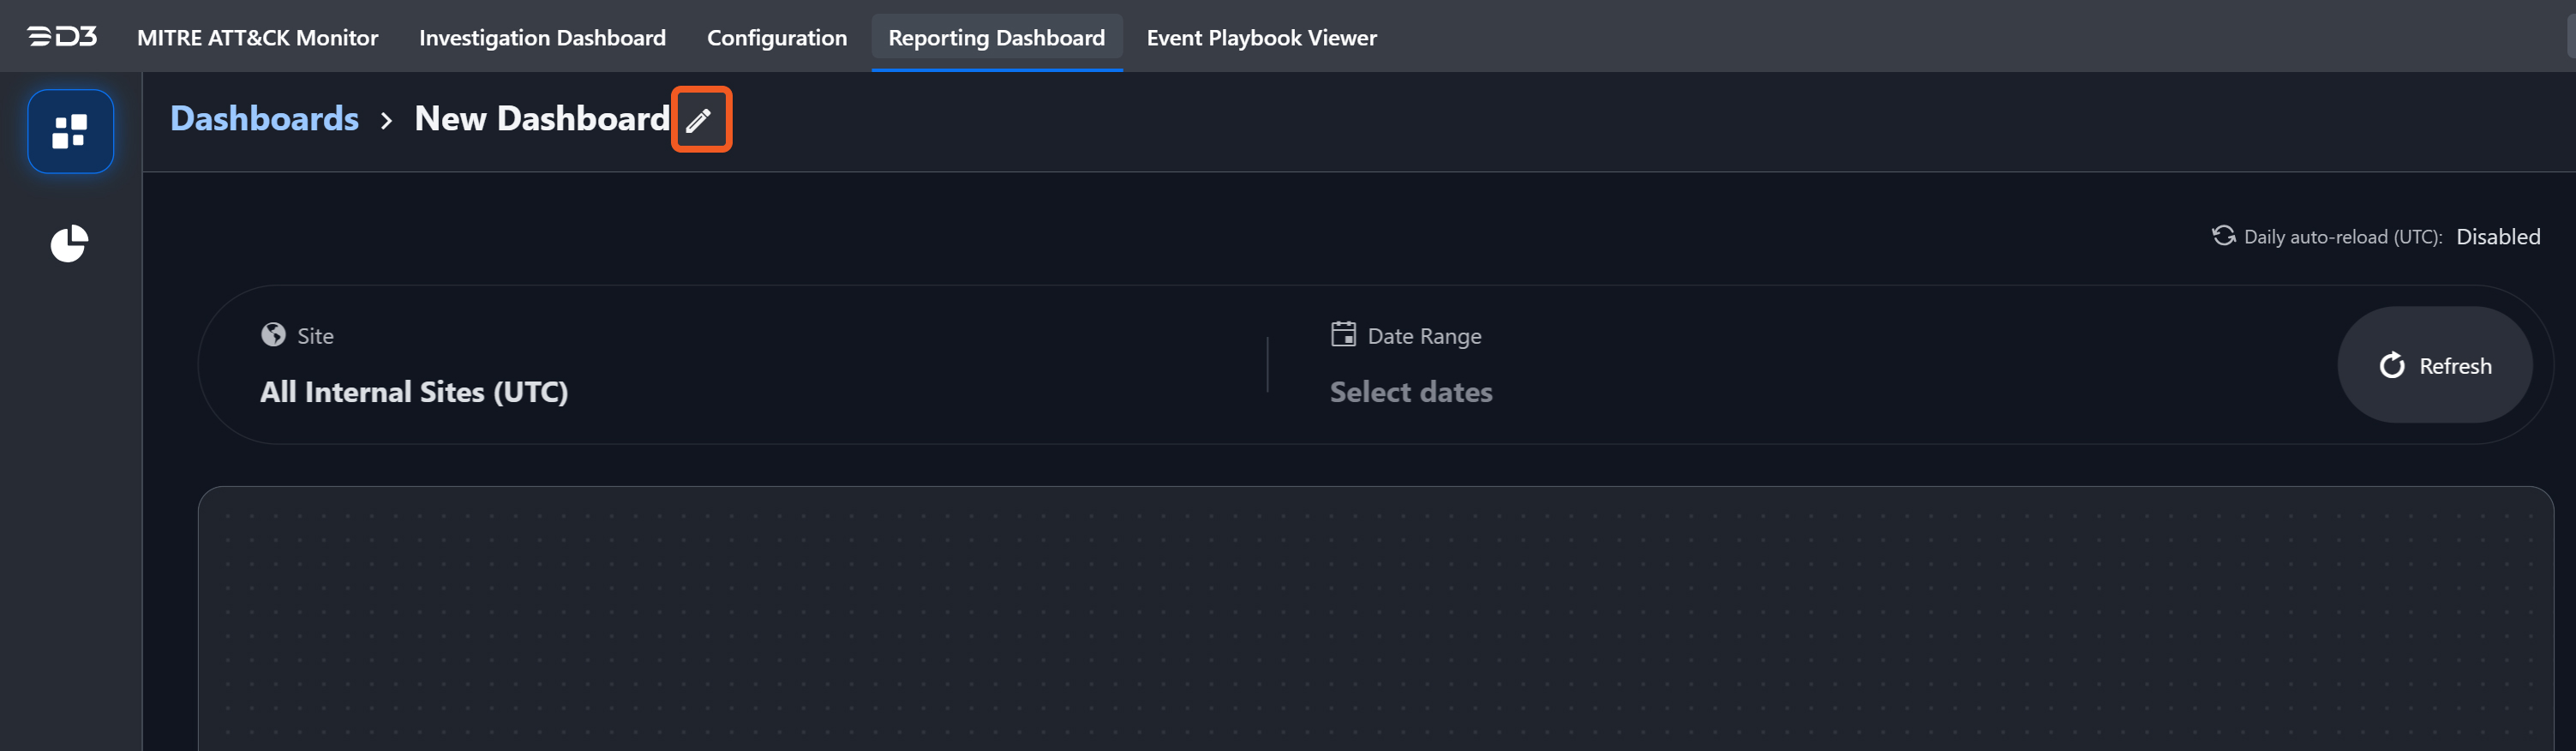
The dashboard builder will appear. Start by naming the widget by clicking on the pencil icon.
Select the site to retrieve the data from.
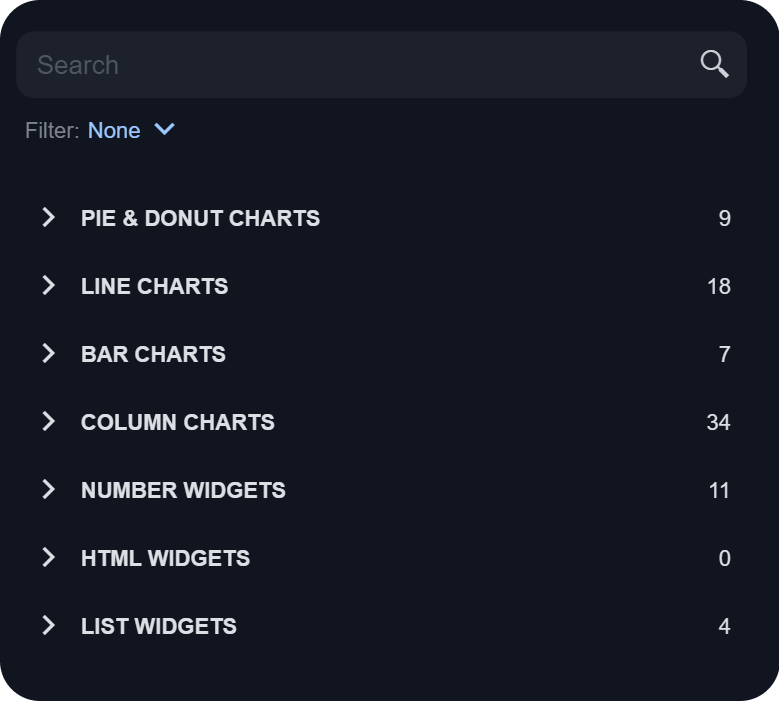
The available widgets are organized by type on the right-hand side. If you have a specific widget in mind, you can easily locate it by using the search bar. Once you find the desired widget, simply drag and drop it onto the dashboard canvas. Repeat this process to add multiple widgets to your dashboard. You can also resize each widget by hovering your cursor over the edge of the widget and drag it to the desired size.
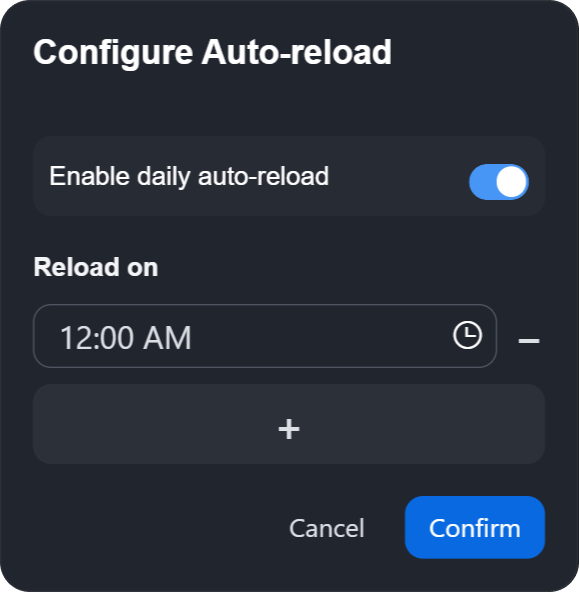
(Optional) Configure auto-reload for the dashboard by clicking Daily auto-reload (UTC) at the top. This option lets you set the recurring time that the dashboard will reload with updated information.
(Optional) Set the viewing permissions for the dashboard by clicking on Permissions located in the upper right corner.
There are two main ways to configure permissions:By Site:
Default Role Configuration: Each added site allows you to specify a default permission role, which can be set to either "Viewer", "Editor", or "Not Set". When a new site is added to the list, its default role is automatically set to "Viewer".
Role or Group within a Site: Roles or groups that are defined under a site can override the site's default permission role. The more specific configuration will always take precedence over a general one. For example, if Site A's default is set to "Viewer", but Group A within Site A is designated as "Editor", then users within Group A will have editor permissions.
By User:
Each added user allows you to specify a permission role, which can be set to either "Viewer", "Editor", or "Not Set". When a new user is added to the list, its default role is automatically set to "Viewer".
Understanding the Permission Roles
Editors: Can edit and modify dashboards, and set up email schedules for sharing.
Viewers: Limited to viewing the dashboard.
Private Mode
When Private Mode is activated, only the original creator of the dashboard will have the permissions to view and edit it.
READER NOTE
How can permissions be leveraged for the use cases of Managed Security Services Providers (MSSPs)?
For Managed Security Service Providers (MSSPs), configuring a standardized reporting dashboard that can be applied to multiple client sites can be achieved by adding the desired sites to the permissions settings of the dashboard. This eliminates the need to clone or create a new dashboard for each client site. With this approach, users, roles, or groups associated with each specific site will only be able to view the dashboard for the sites they have access to. In most cases, users or groups within an MSSP's environment will only have access to their designated site. This segregation of data ensures that users, groups, or roles can only view the dashboard to display data relevant to the sites they have access to.
Click Save after all configurations are complete. Your dashboard is now available to be viewed under the Dashboards tab.
READER NOTE
Only editors of a dashboard have the permission to make changes to it. Even if viewing permissions have been granted to other users, groups or roles, only editors authorized to edit the dashboard.
Exporting a Dashboard
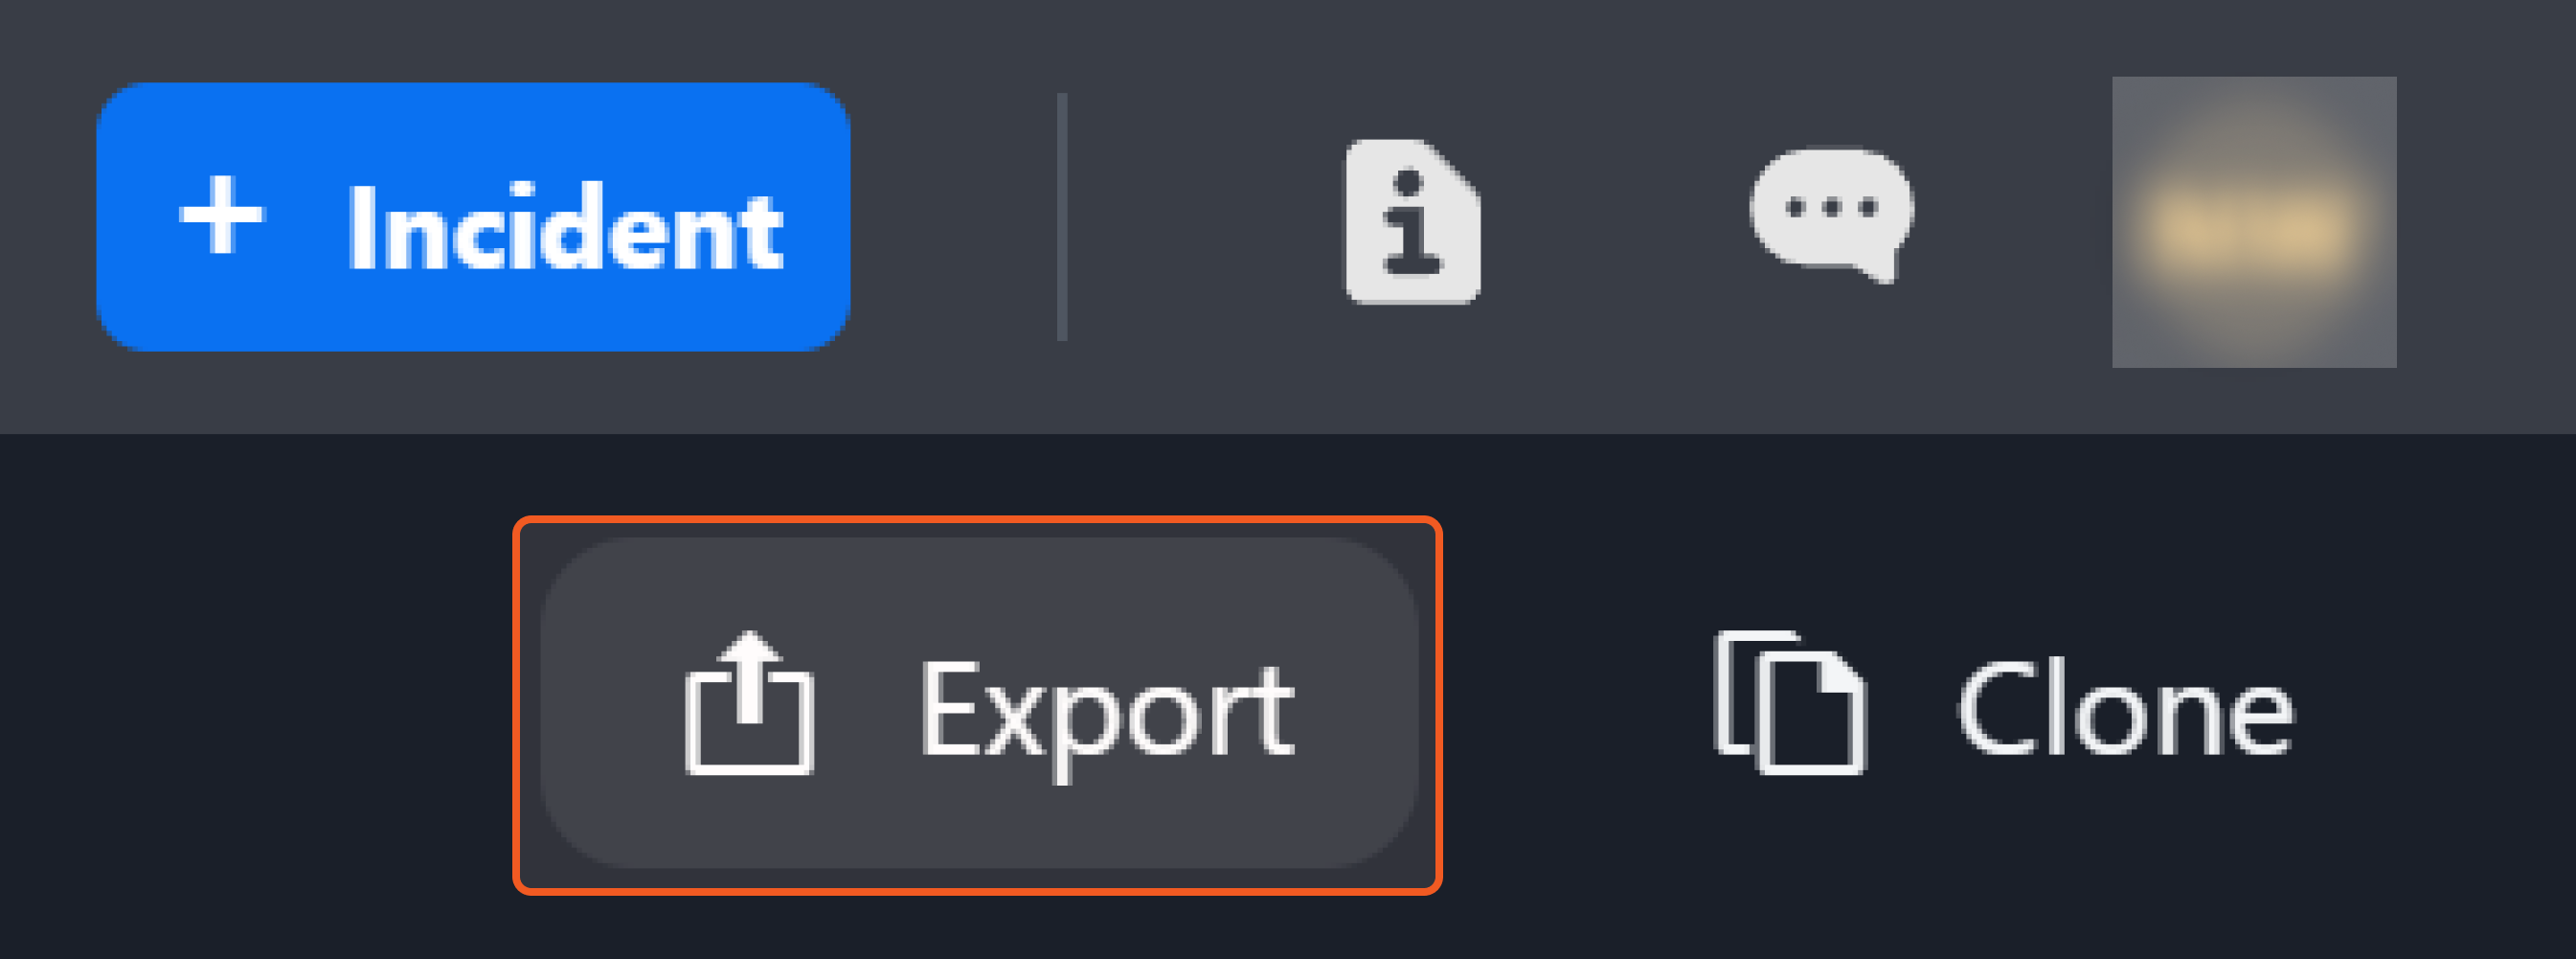
To export a dashboard, select it from the list of created dashboards. You can export any dashboard you have created or have permission to view. If you select a dashboard you did not create but have viewing permissions for, you will see the Export button located near the upper right corner.
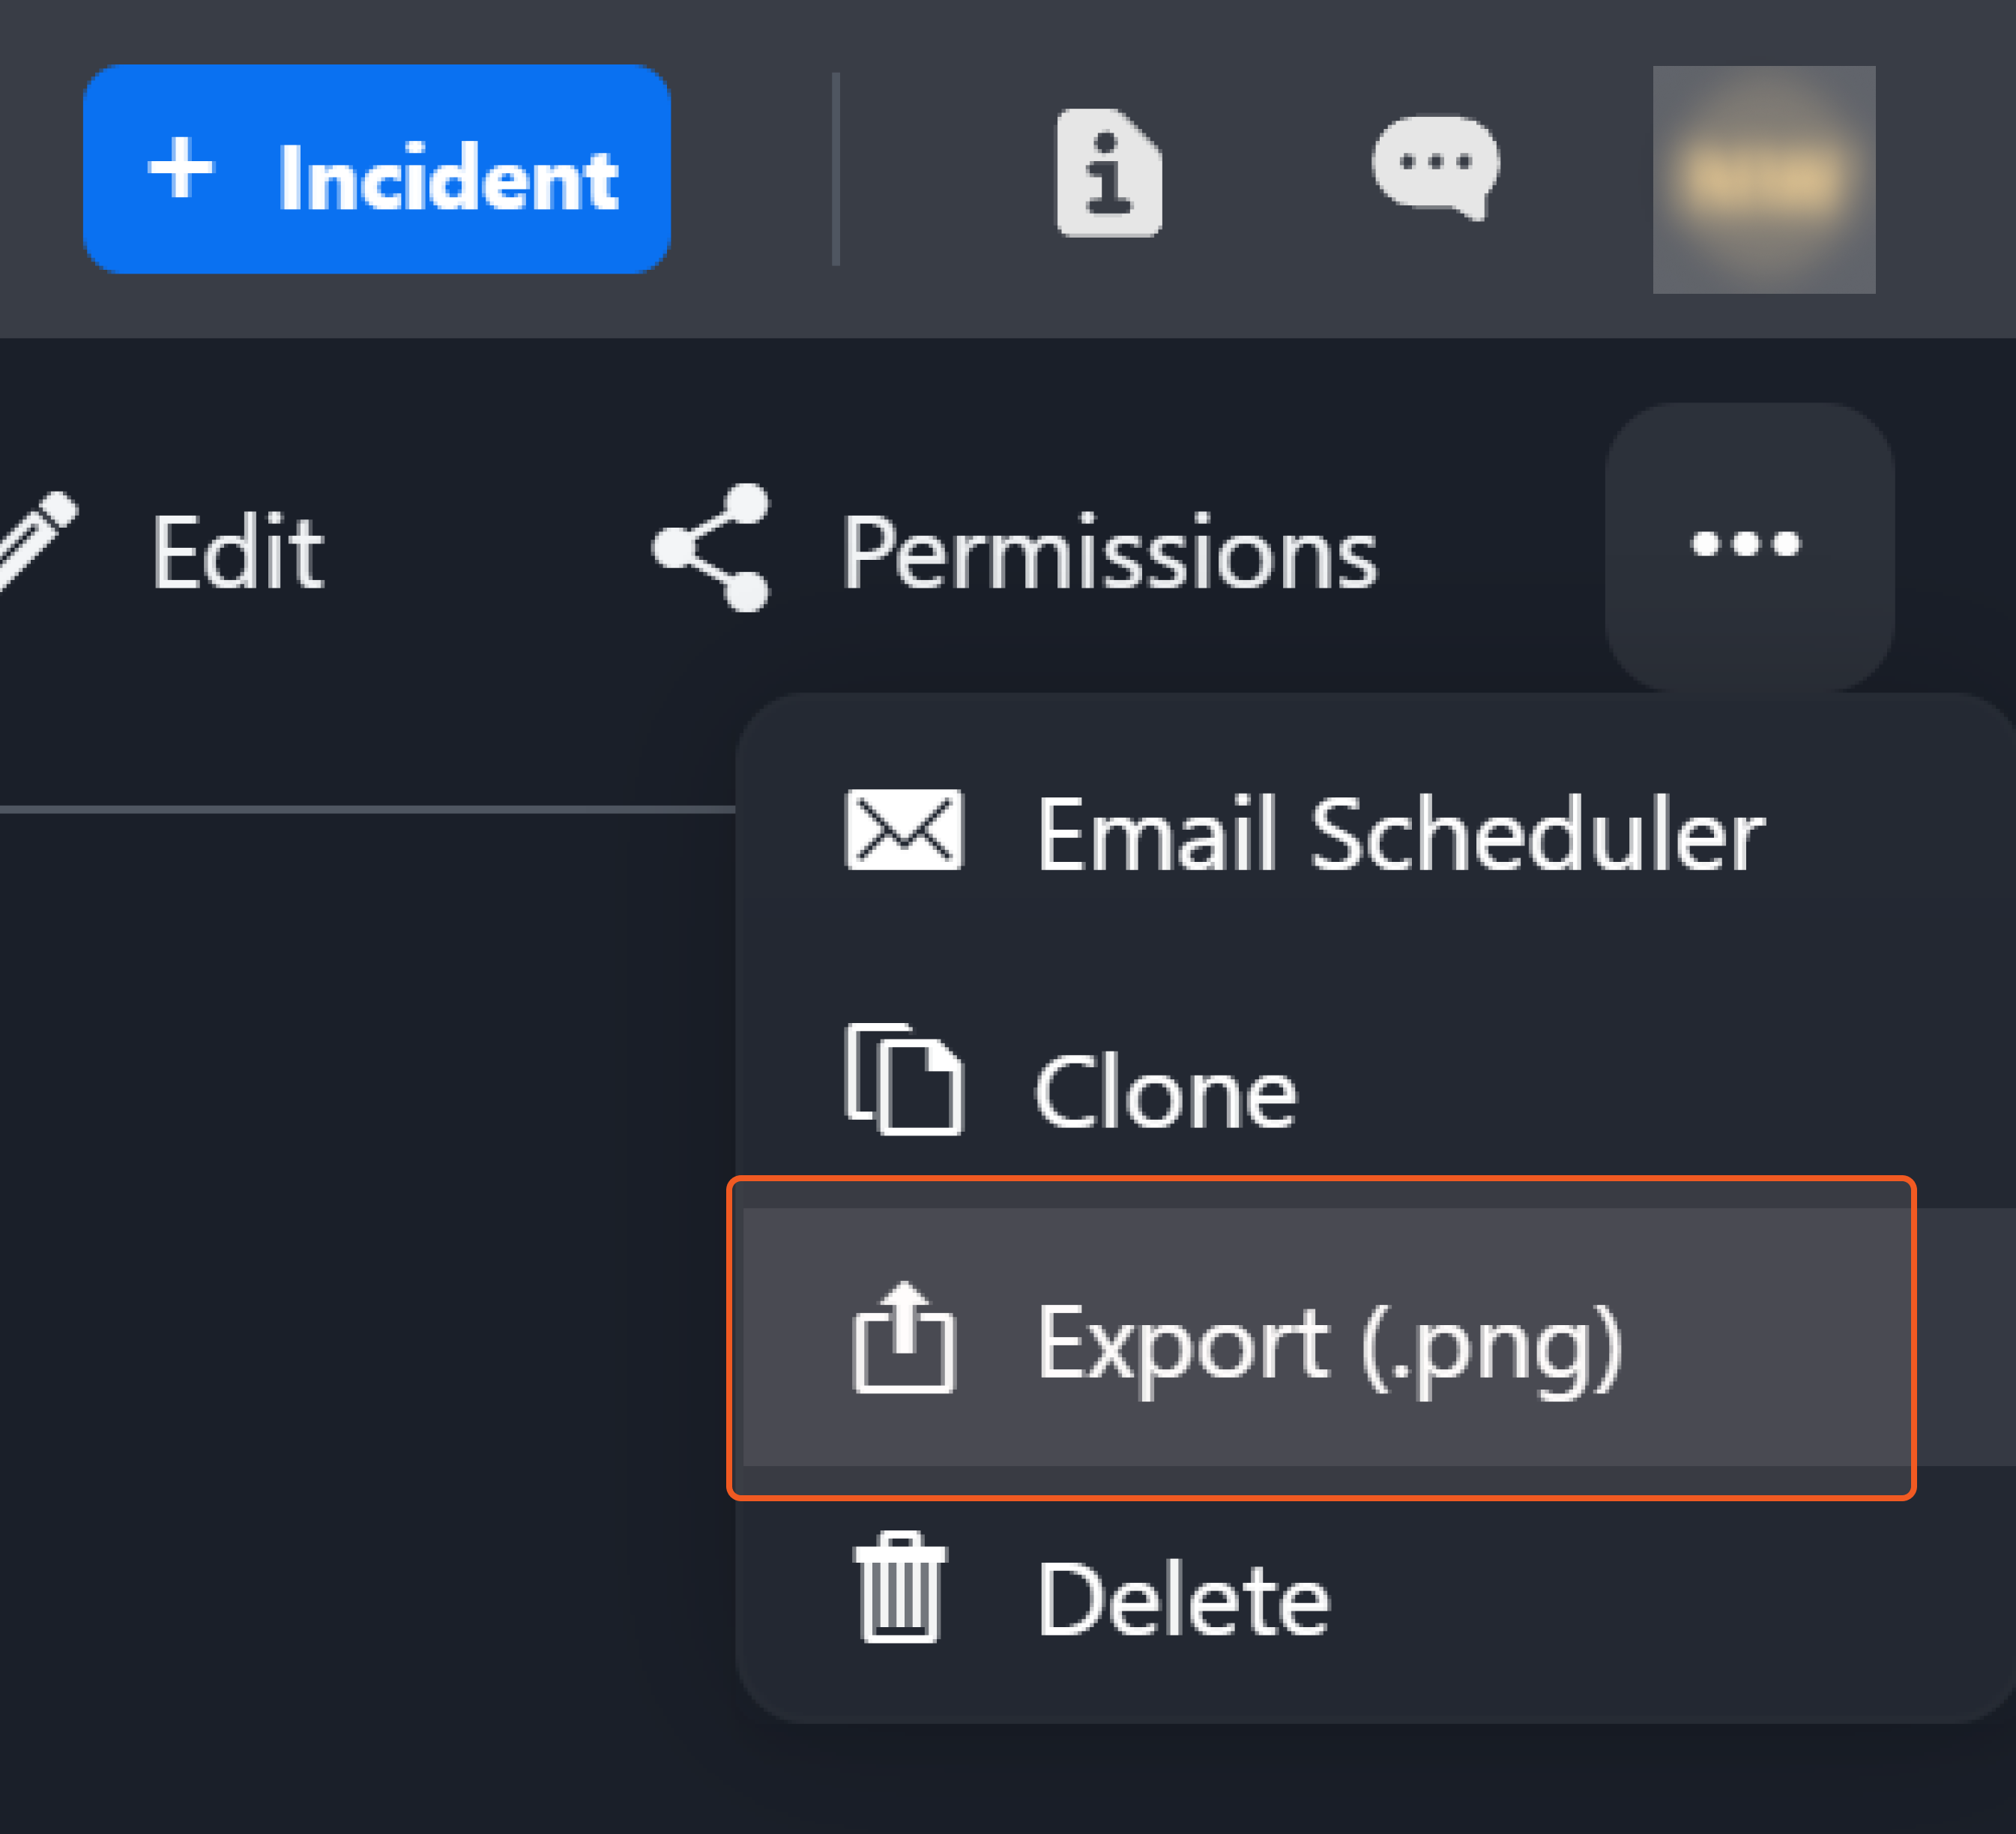
For dashboards you have created, the Export option is within a three dot menu, also located near the upper right corner.
Once you click on Export, a PNG image of the dashboard will be immediately downloaded to your computer. Navigate to your browser's system download folder to locate the exported PNG.
Email Scheduler
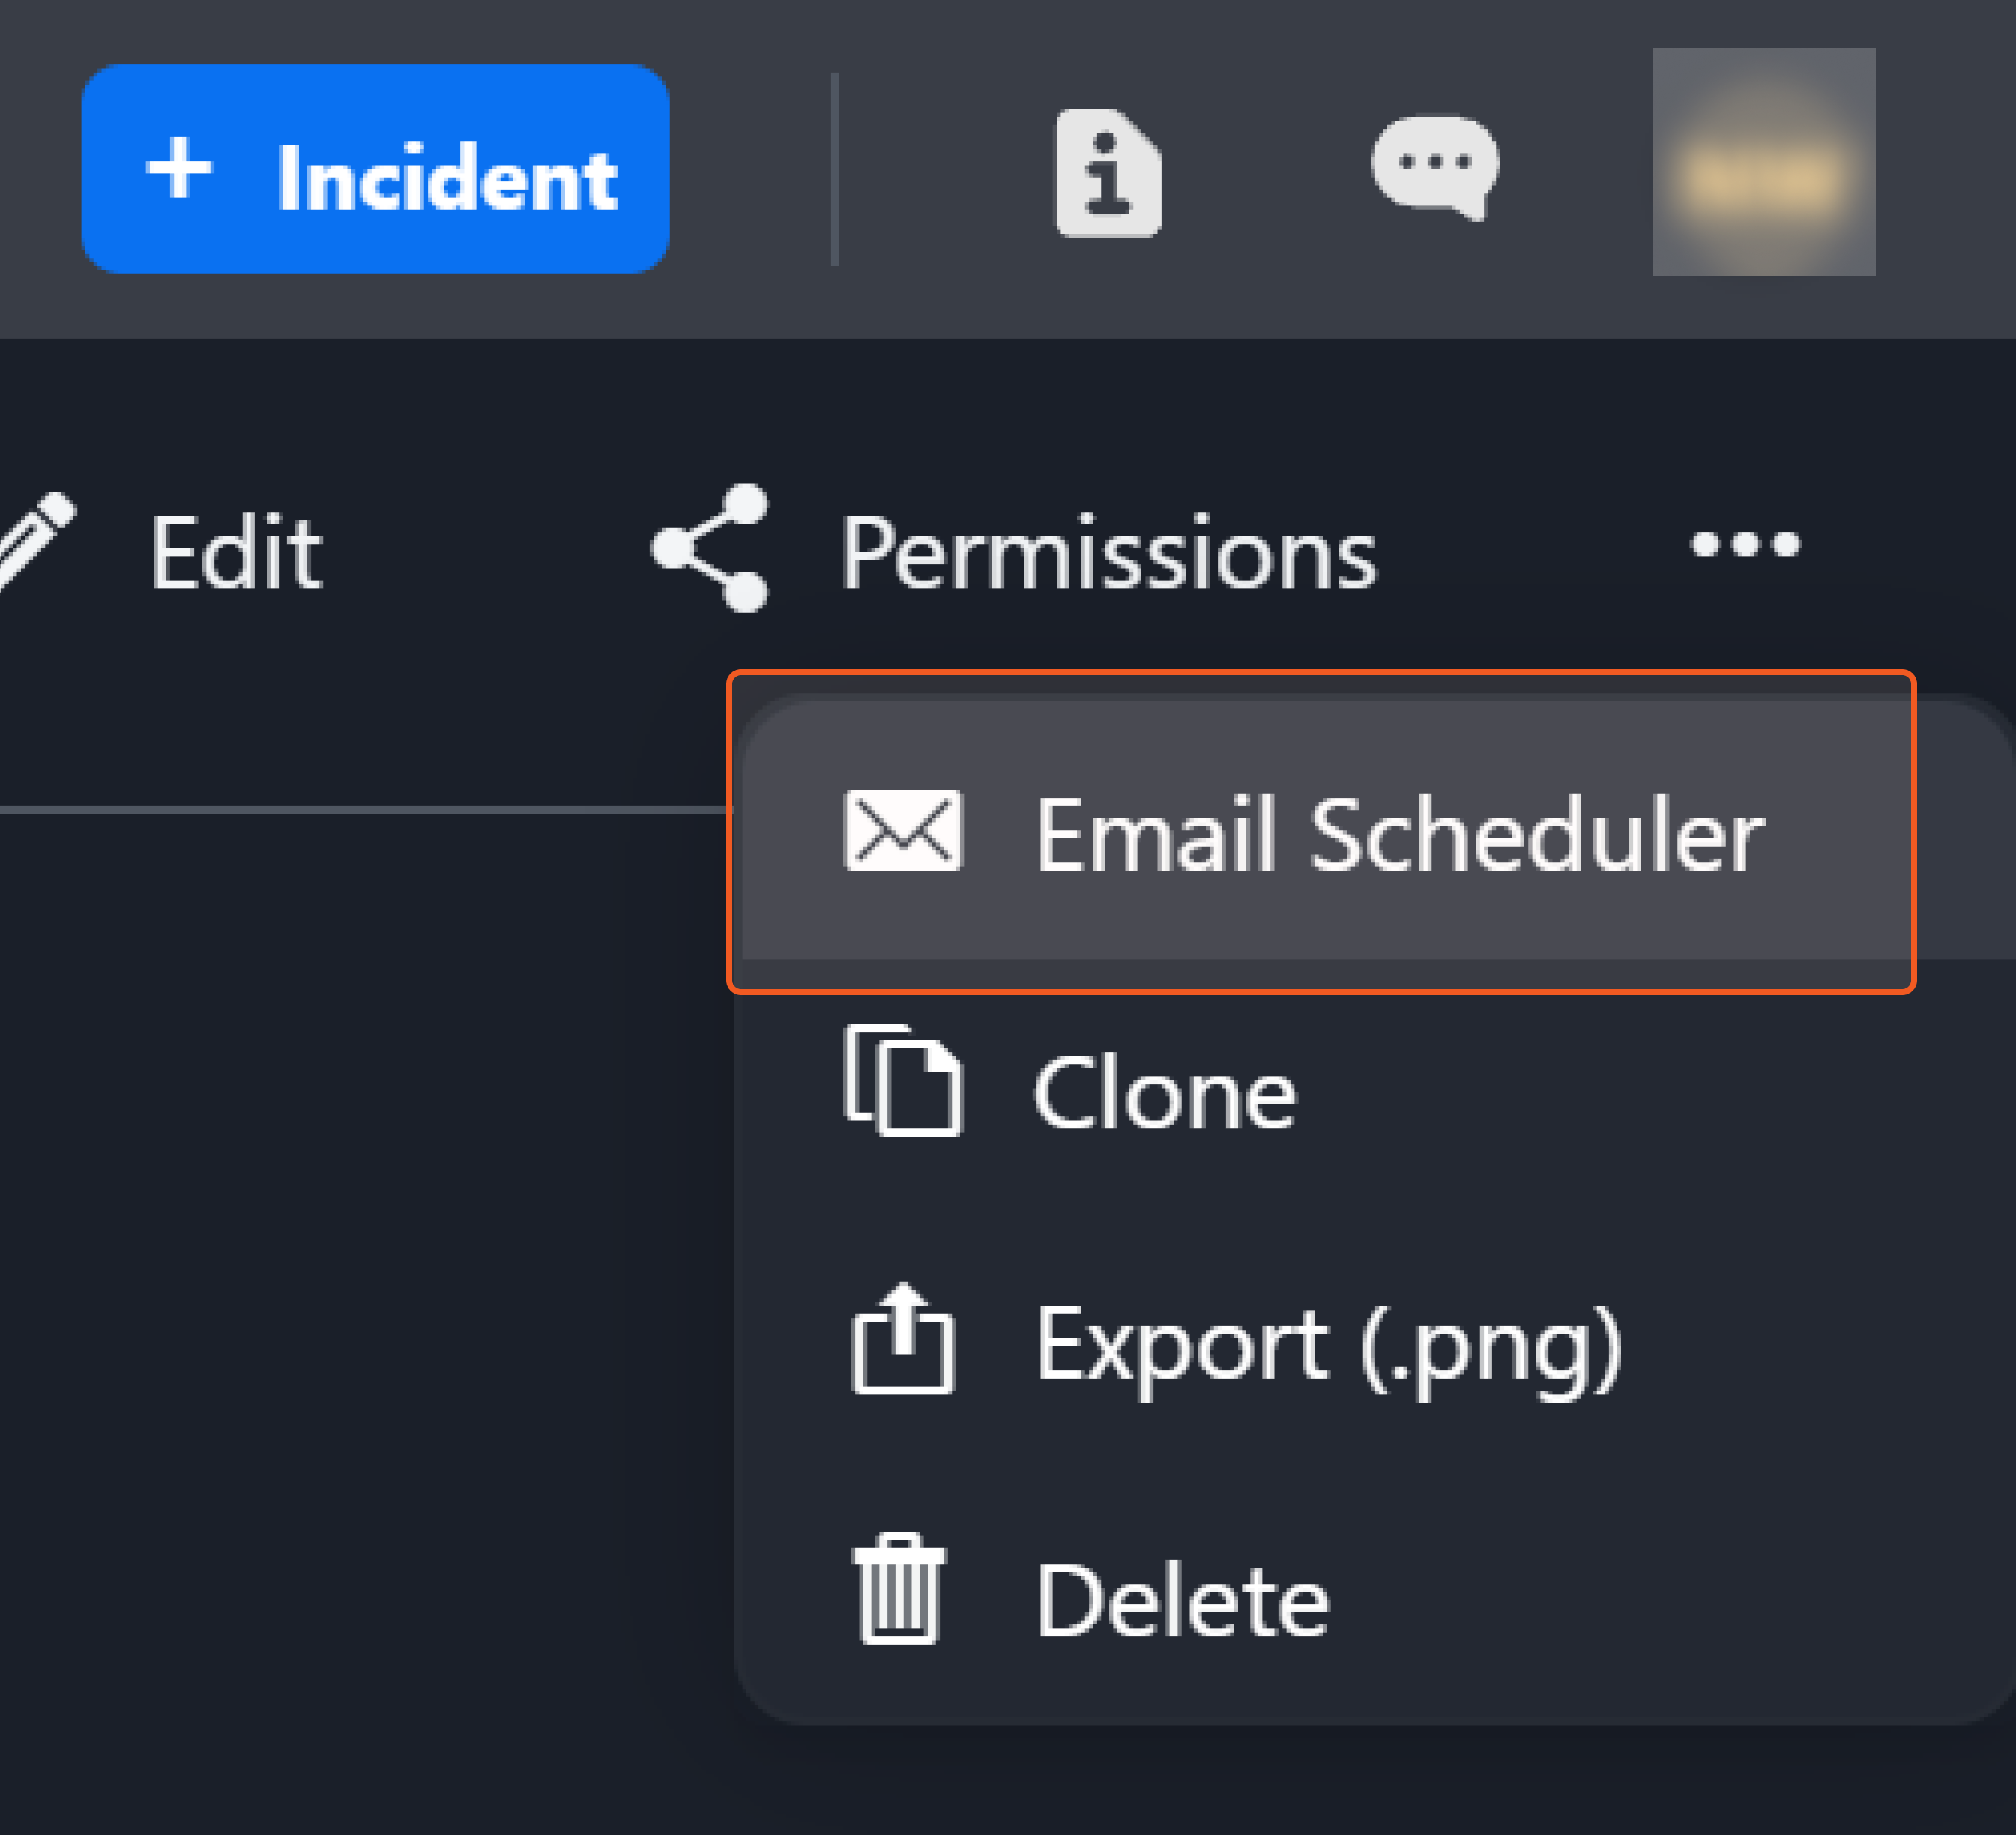
The email scheduler enables you to set up one-time or recurring sharing of dashboards with a viewable link emailed to recipients. Within a dashboard page you have created, the Email Scheduler option can be accessed from the three dot menu, located near the upper right corner.
In Email Scheduler, you can set up email schedules to share your dashboard, or view and edit previous schedules you have created.
READER NOTE
Only editors of a dashboard have the permission to set up an email schedule. Assign Edit permissions to a user or site in order to allow Dashboard email scheduling. See Step 7 of Creating a Dashboard.
Creating a New Email Schedule
Ensure the SMTP Server and Email settings are configured for your instance of D3 SOAR. You can do this by navigating to Configuration > Application Settings > SMTP Server and Email. This is required for the Email Scheduler to function.
In the Email Scheduler of a dashboard you have created, click New Email. Input the recipient email addresses for the scheduled emails, and optionally add other email fields such as CC, BCC, Subject, and body.
(Optional) Set up a scheduled delivery by enabling the Set as a scheduled delivery option. Use the DateTime selector to choose the scheduled delivery time for the email. If you want this schedule to recur, enable the Repeat option and configure the frequency at which the email will be sent.
Once you have finished configuring your email schedule, click Send to complete the process.
Managing Email Schedules
To manage your email schedules, navigate to the email scheduler on your dashboard's main page. The scheduler displays a list of schedules categorized as either Scheduled or Past. The Scheduled tab shows all email schedules that are pending to be sent. You can delete or clone any pending schedules from this tab. The Past tab displays previously sent schedules. Here, you also have the option to delete or clone past schedules.
Cloning a Dashboard
To duplicate an existing dashboard you have created or have permission to view, select it from the list of dashboards. If you select a dashboard you did not create but have viewing permissions for, you will see the Clone button located near the upper right corner.
.png?inst-v=f0ae511a-7398-4e63-b935-74c903306443)
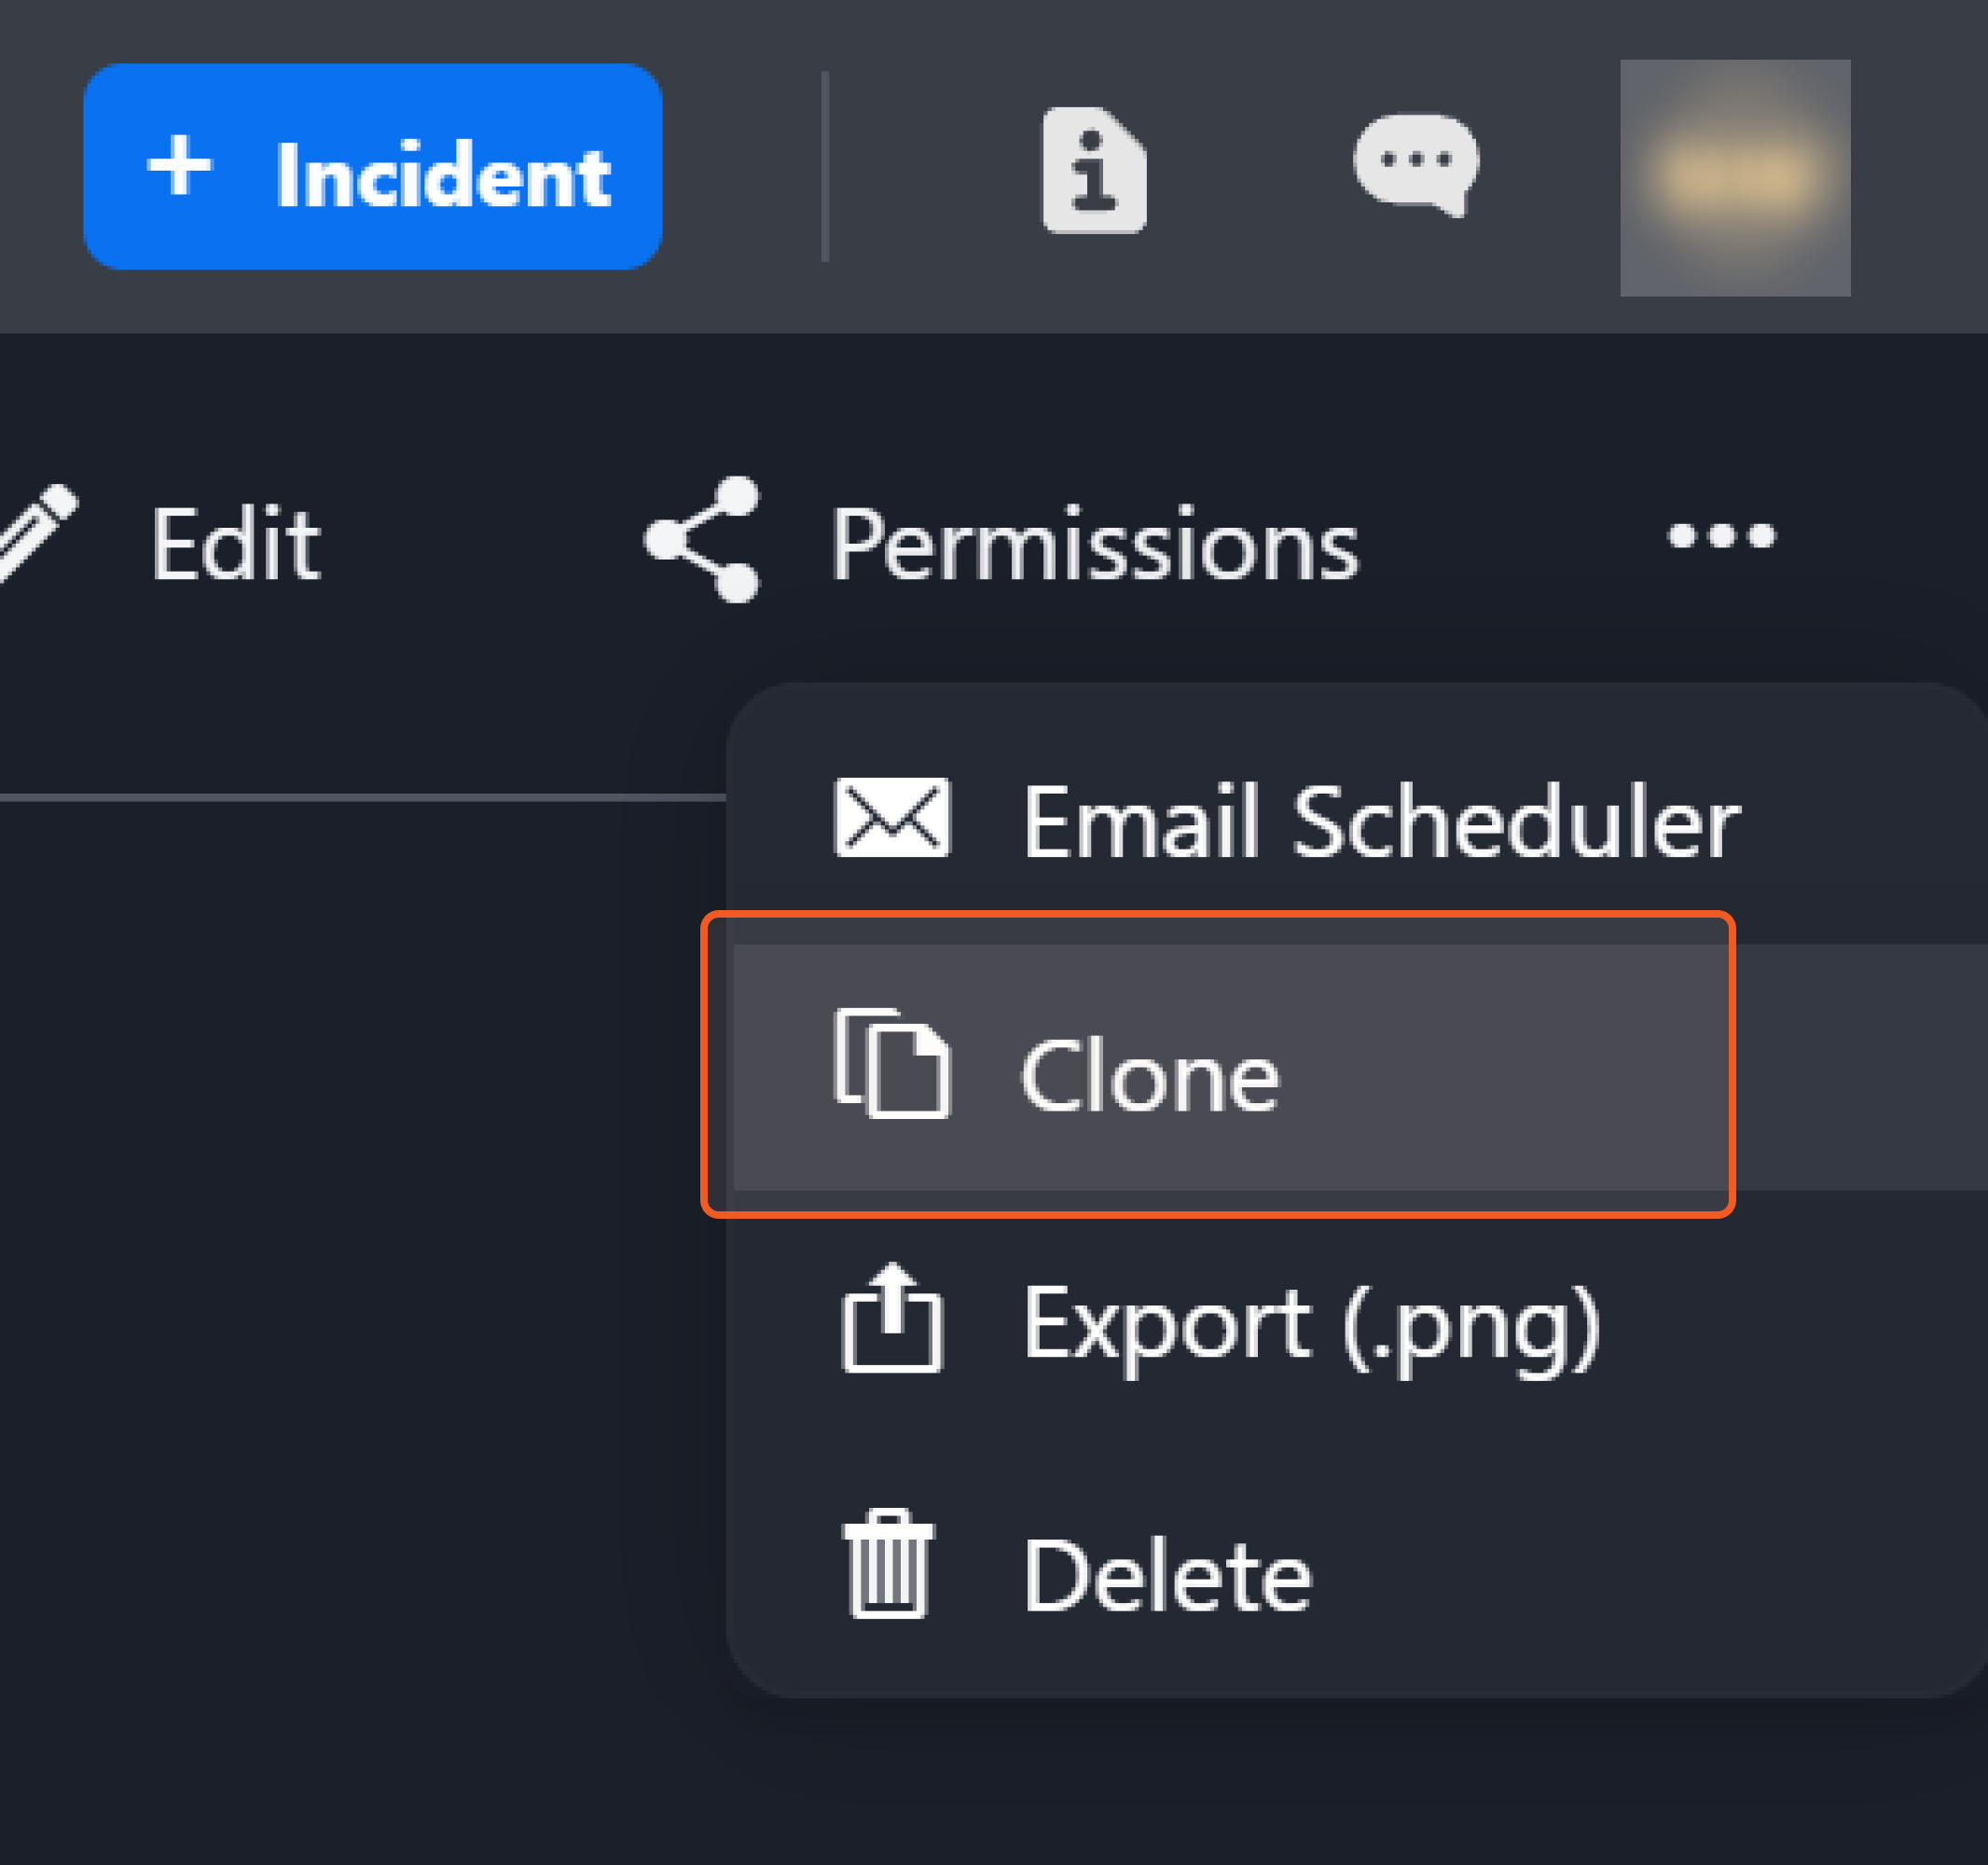
For dashboards you have created, the Clone option is within a three dot menu, also located near the upper right corner.
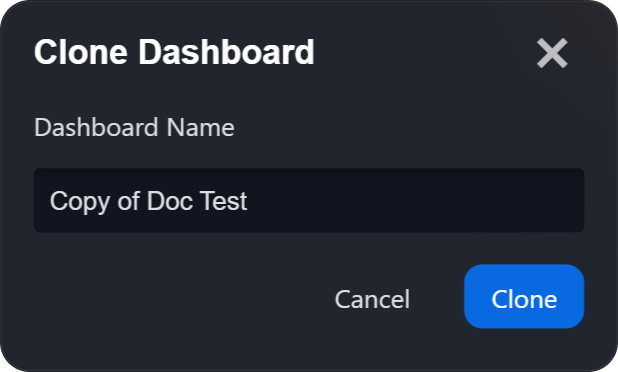
Once you click on Clone, you will be prompted to name the duplicated copy of the dashboard. Click Clone to duplicate the dashboard. Return to the main page of the Dashboards tab to locate the cloned dashboard.