
Last updated: mar 21, 2025
Overview
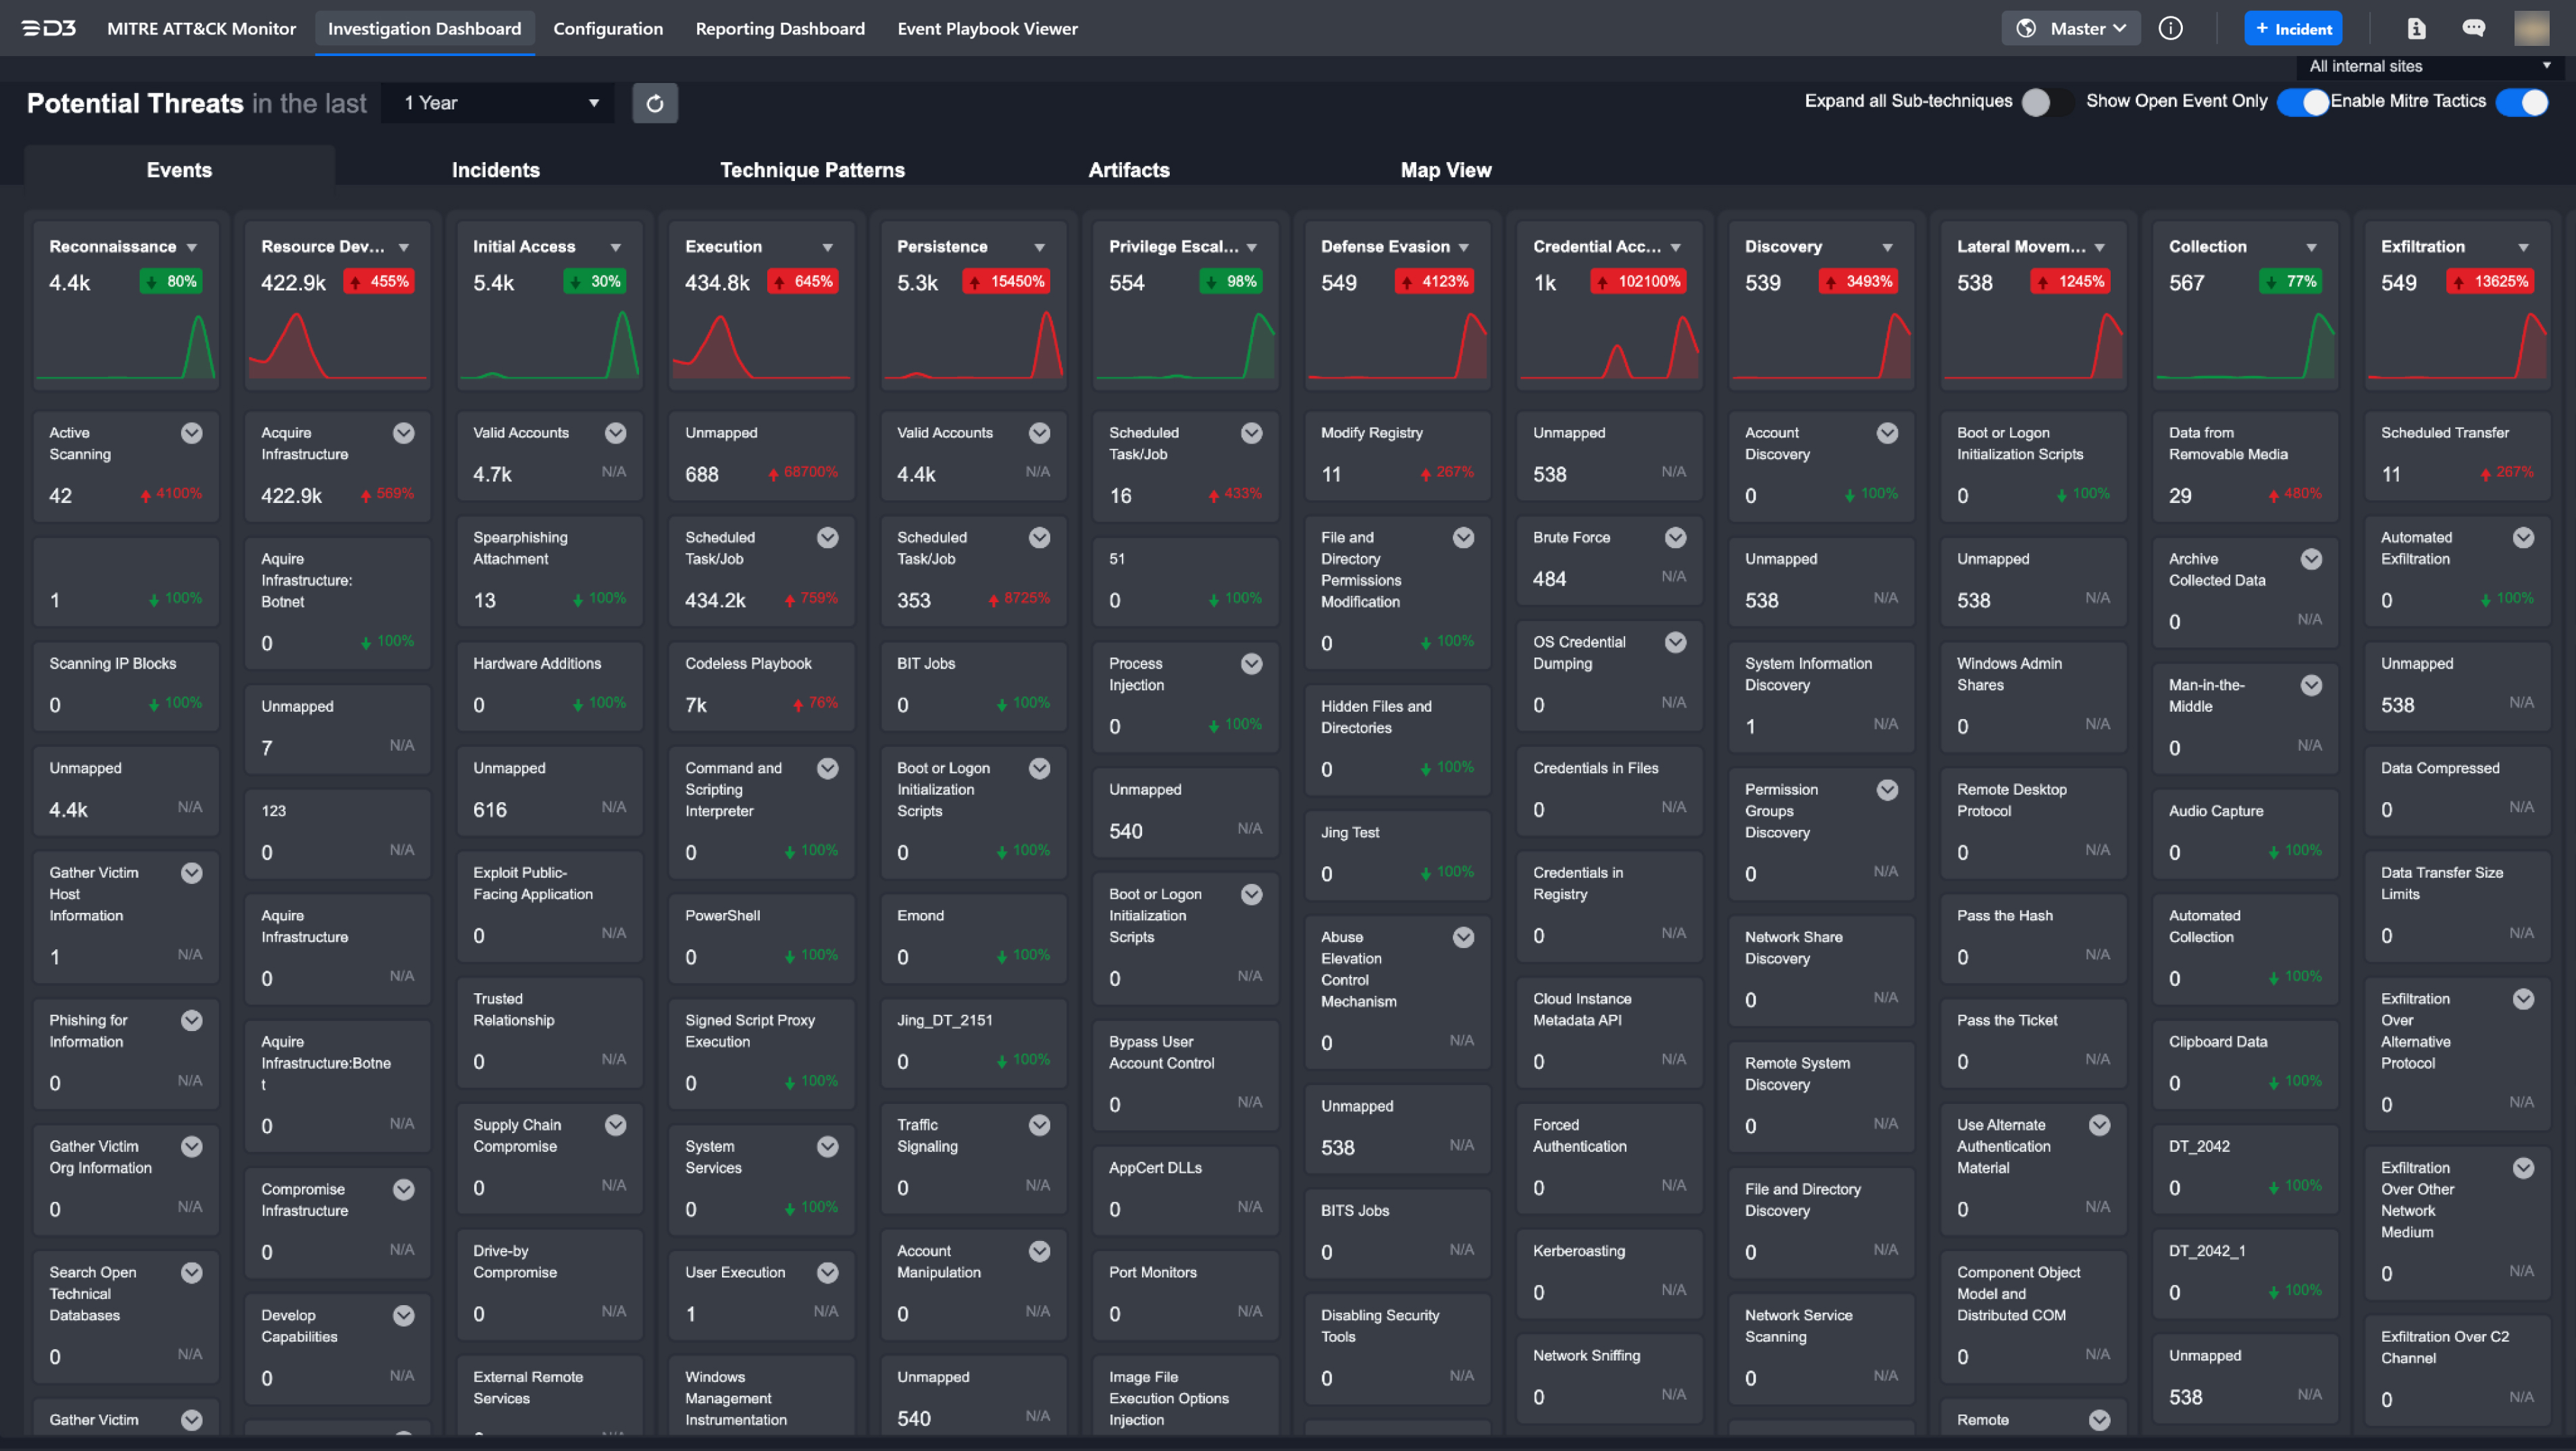
The Monitor workspace is designed around the MITRE ATT&CK framework and provides a centralized view of the organization's security posture.
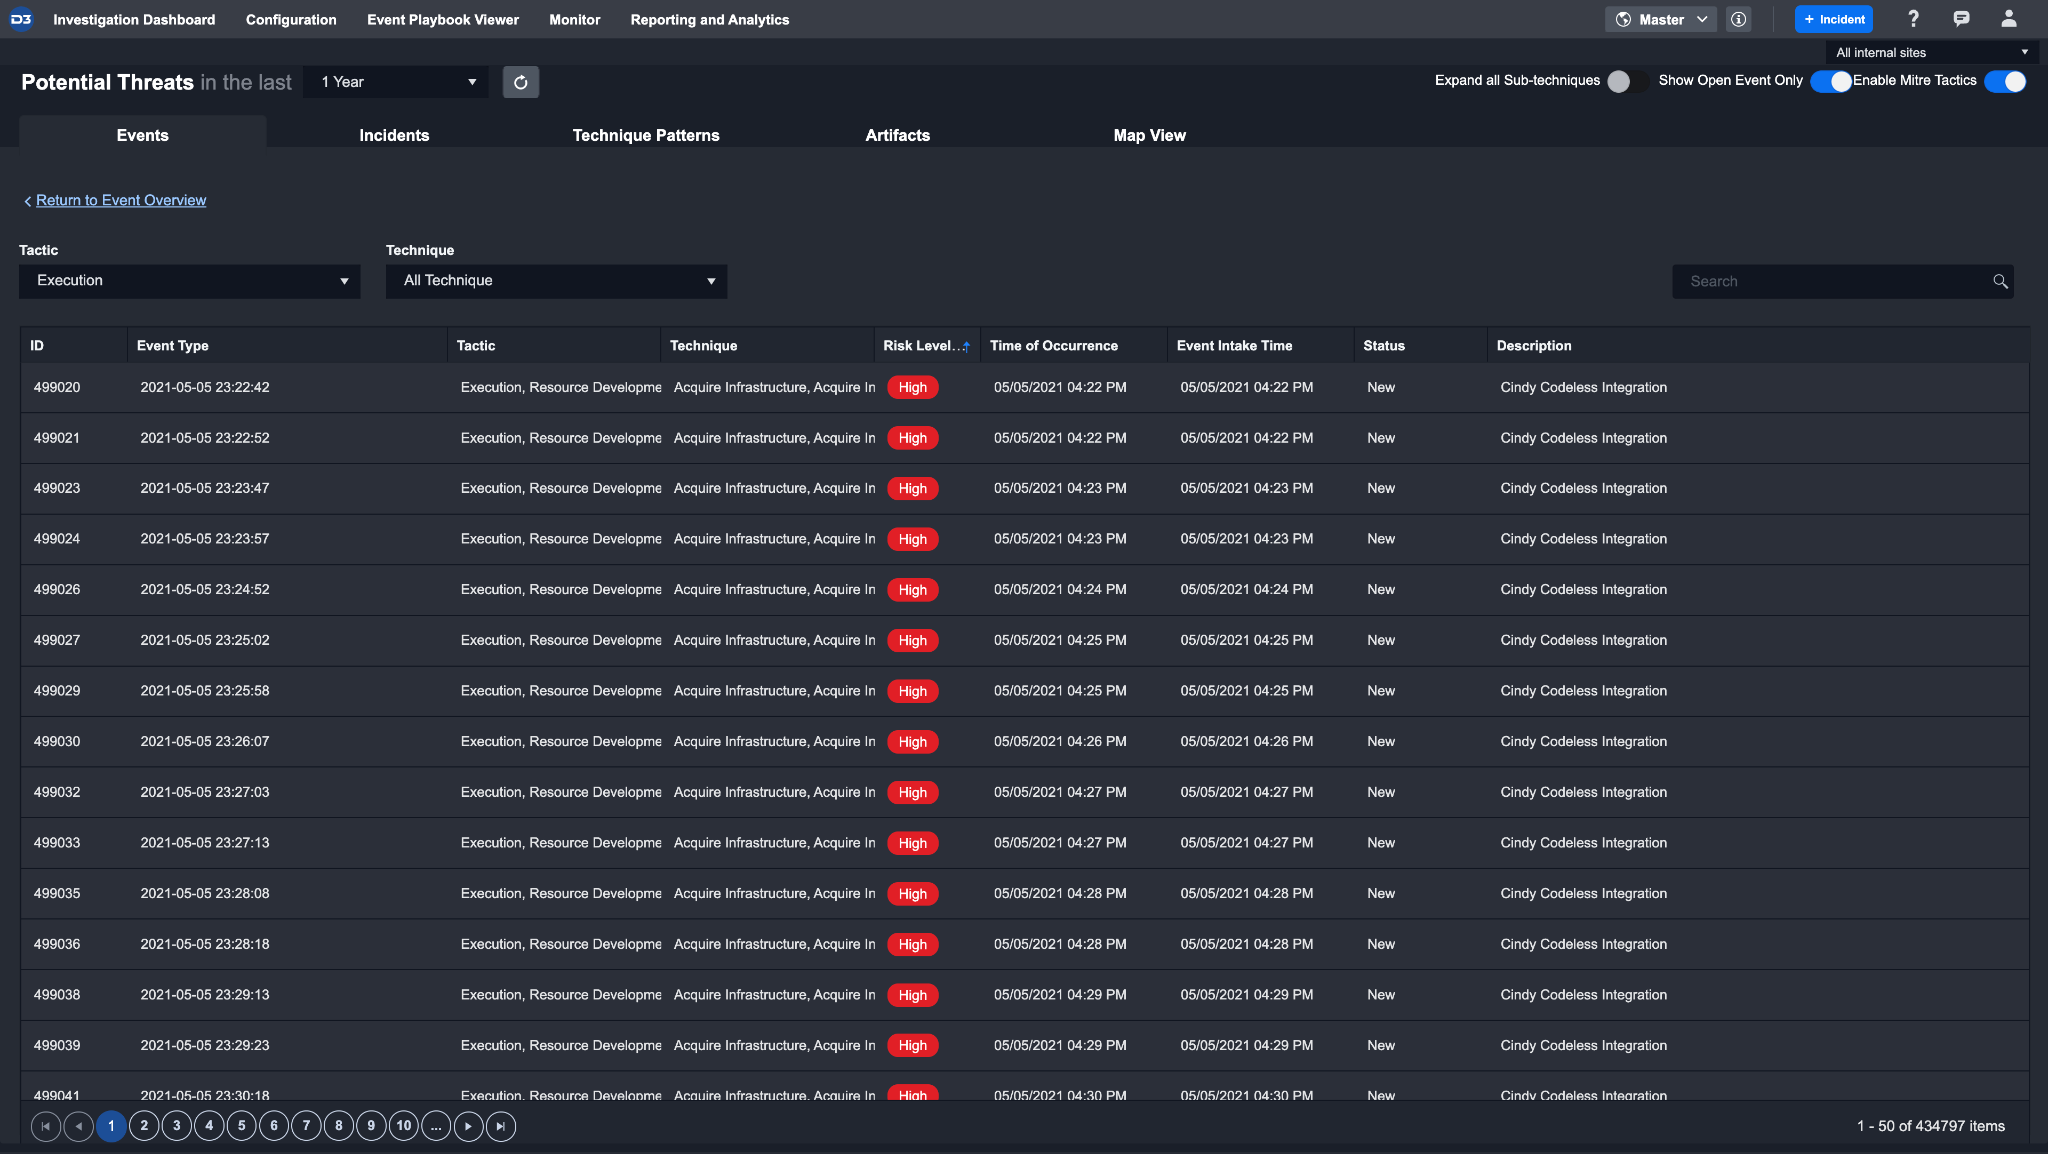
The tabs across the top of the Monitor screen allow users to analyze data through five views: Events, Incidents, Technique Patterns, Artifacts, and Map View. The following screenshot shows the MITRE ATT&CK matrix view for Events.
READER NOTE
The count and display of Events, Artifacts and Technique Patterns on each of these tabs will vary depending on the site selected.
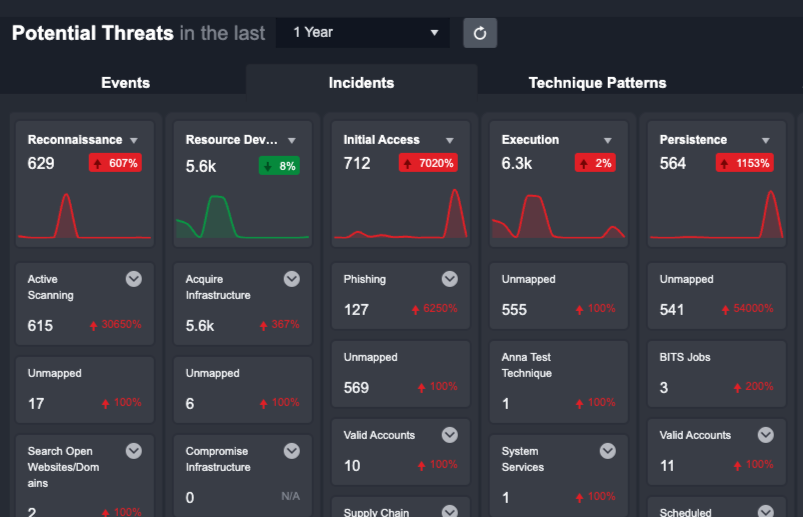
MITRE ATT&CK Matrix
All potential threats in the Events & Incidents tabs are categorized in a MITRE ATT&CK matrix view based on their framework found, underlined in ATT&CK Matrix for Enterprise. This view highlights large-scale attacks at a glance and helps users identify critical threats that require immediate attention.
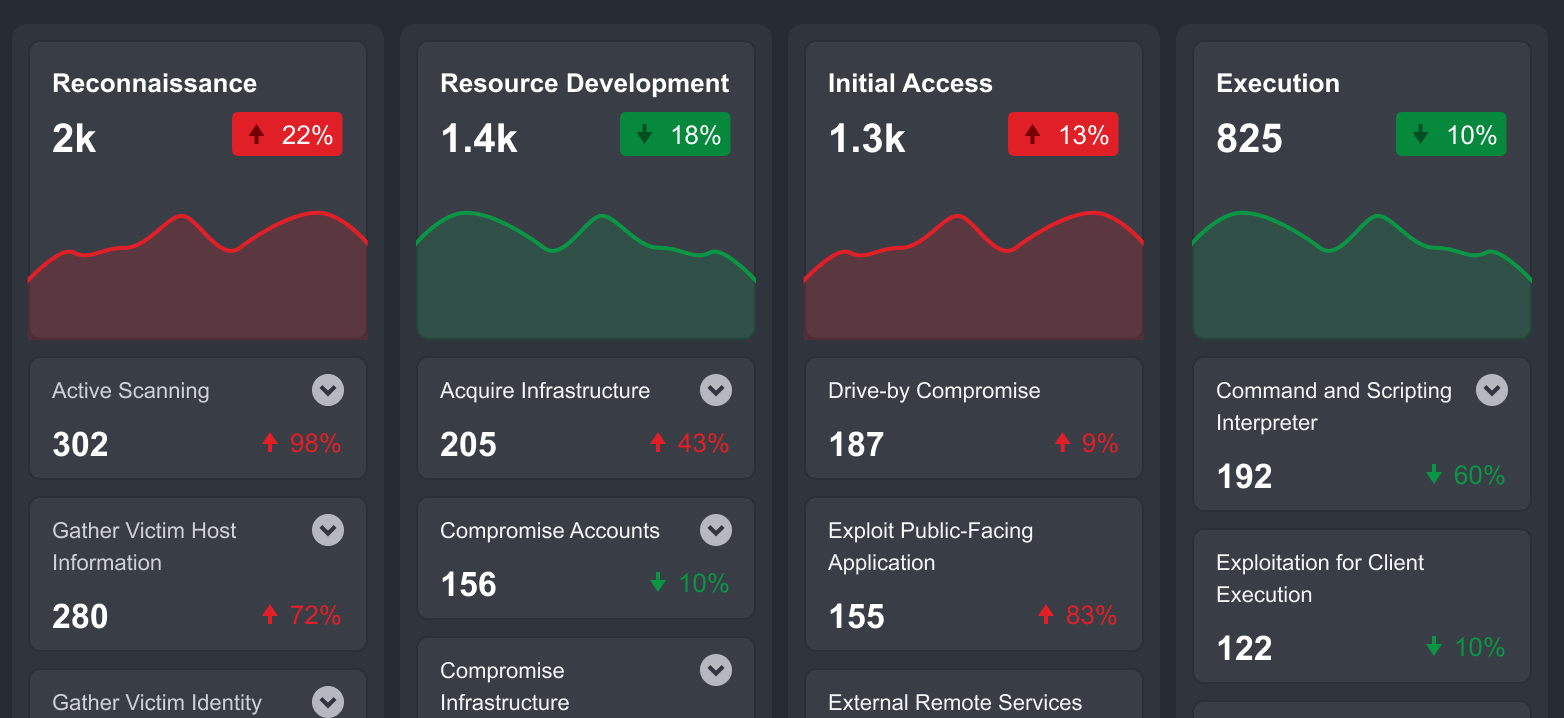
The Tactics row visualization provides a high-level overview of the organization's security posture. It helps users quickly identify threat volume and technique activity trends over a selected time period. Users can also create custom tactics, techniques, and search conditions for more refined categorization, which are covered later in this document.
Customize the Monitor Dashboard view using the toggles in the upper-right corner, below site selection. These toggles allow users to expand sub-techniques, show only open events, and enable or disable MITRE tactics.
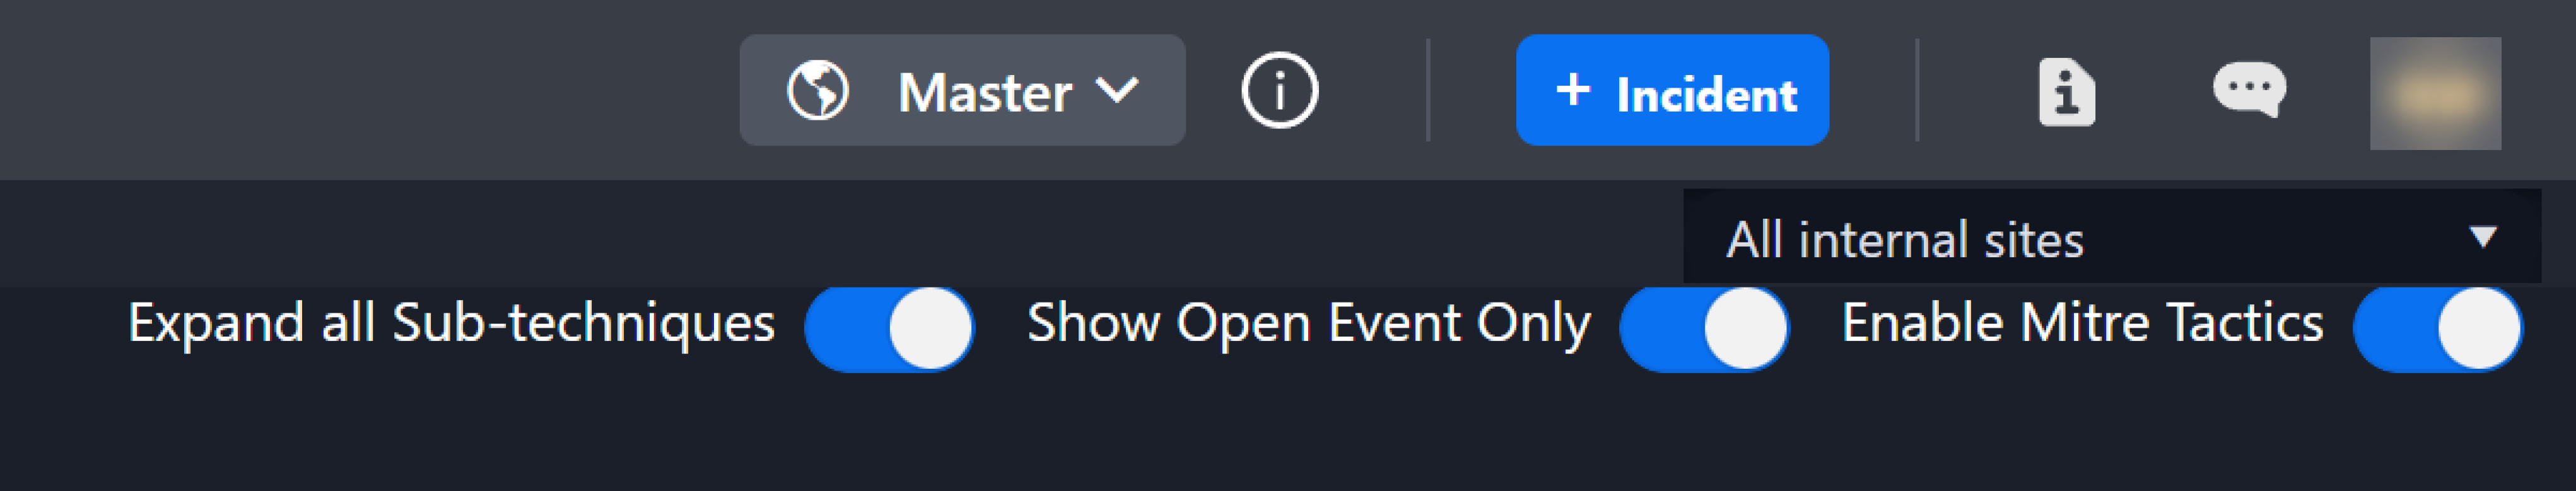
READER NOTE
The Enable MITRE Tactics toggle is applied globally; if it is toggled off, the user will not be able to use the tactic elsewhere including tagging incidents with tactics.
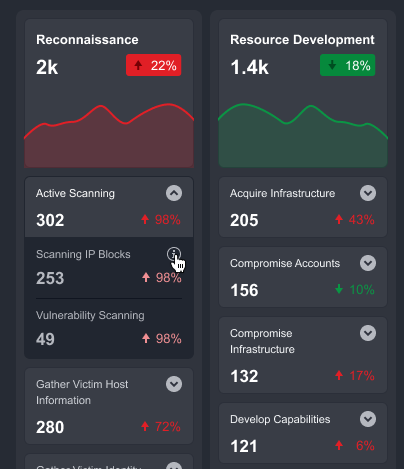
Techniques & Sub-Techniques
Techniques and sub-techniques below the Tactics section display event counts and change velocity. By default, sub-techniques are hidden. Expand a technique to view its underlying sub-techniques. Click a tactic, technique, or sub-technique to configure search criteria.
Events
Clicking on a specific Tactic or Technique from the MITRE ATT&CK matrix view will reveal a list of all underlying events. All events in the events list are sorted by their time of occurrence, and the time they were ingested into the platform. Select an event to investigate it. Then escalate the event to an incident or dismiss it.
Creating a New Tactic
The Monitor workspace is fully customizable and adaptive to the user's environment. Users can create a tactic to support investigations.
-
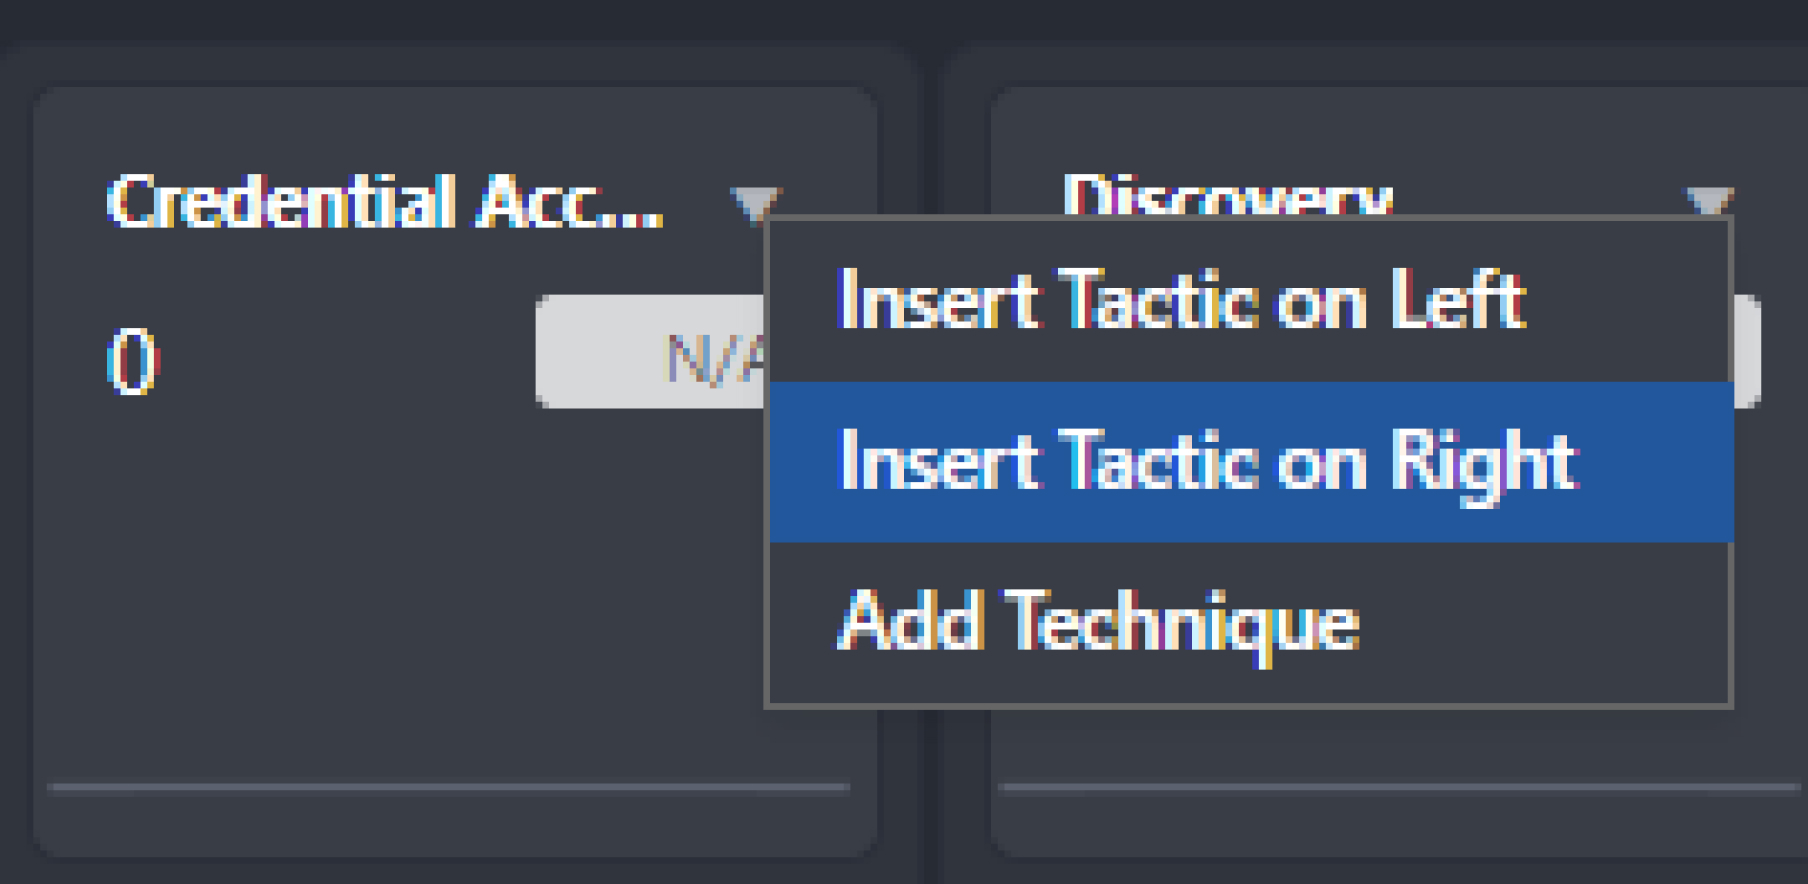
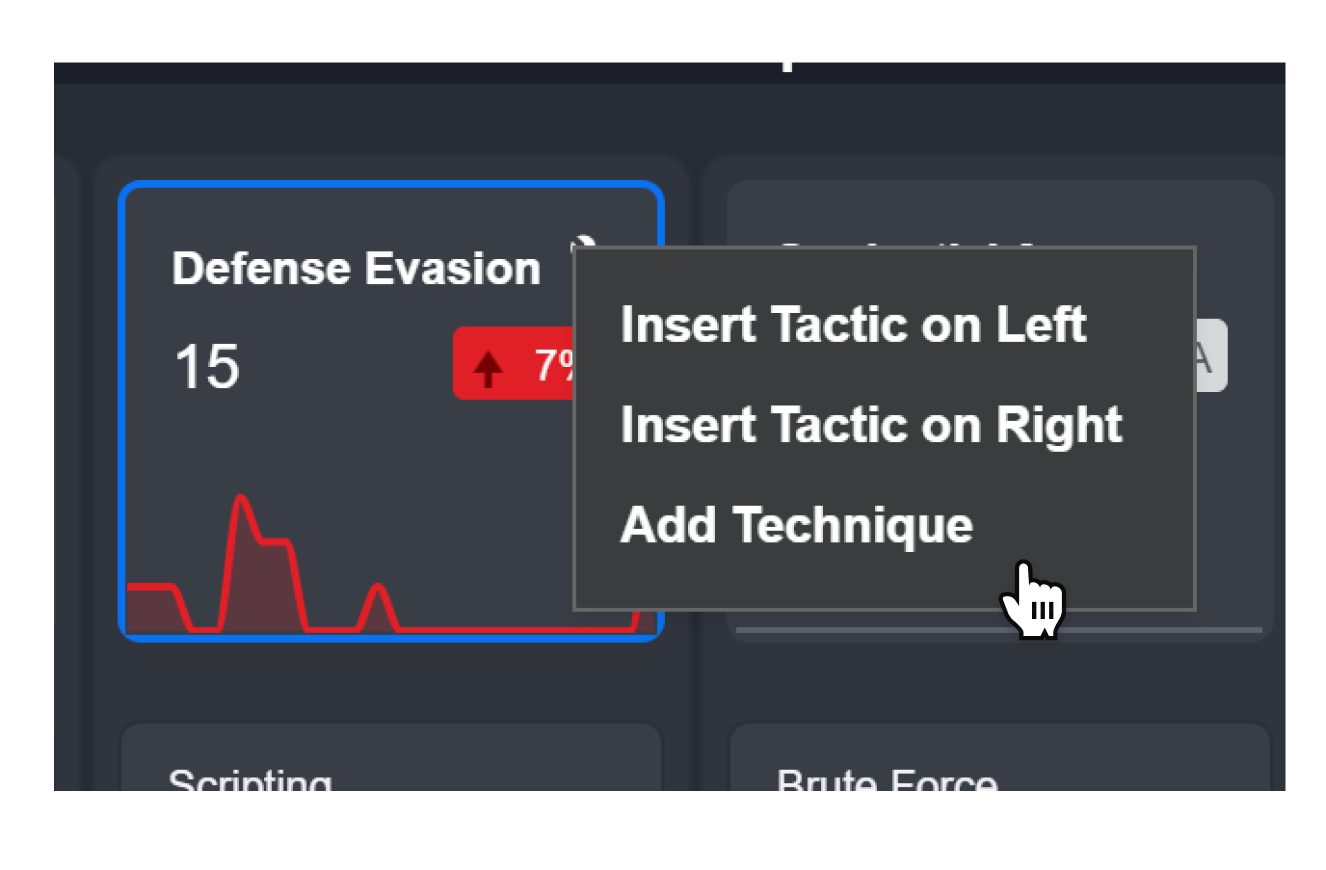
Hover over a Tactic and click on ▼
-
Select Insert Tactic on Right (or Insert Tactic on Left) from the dropdown menu.
-
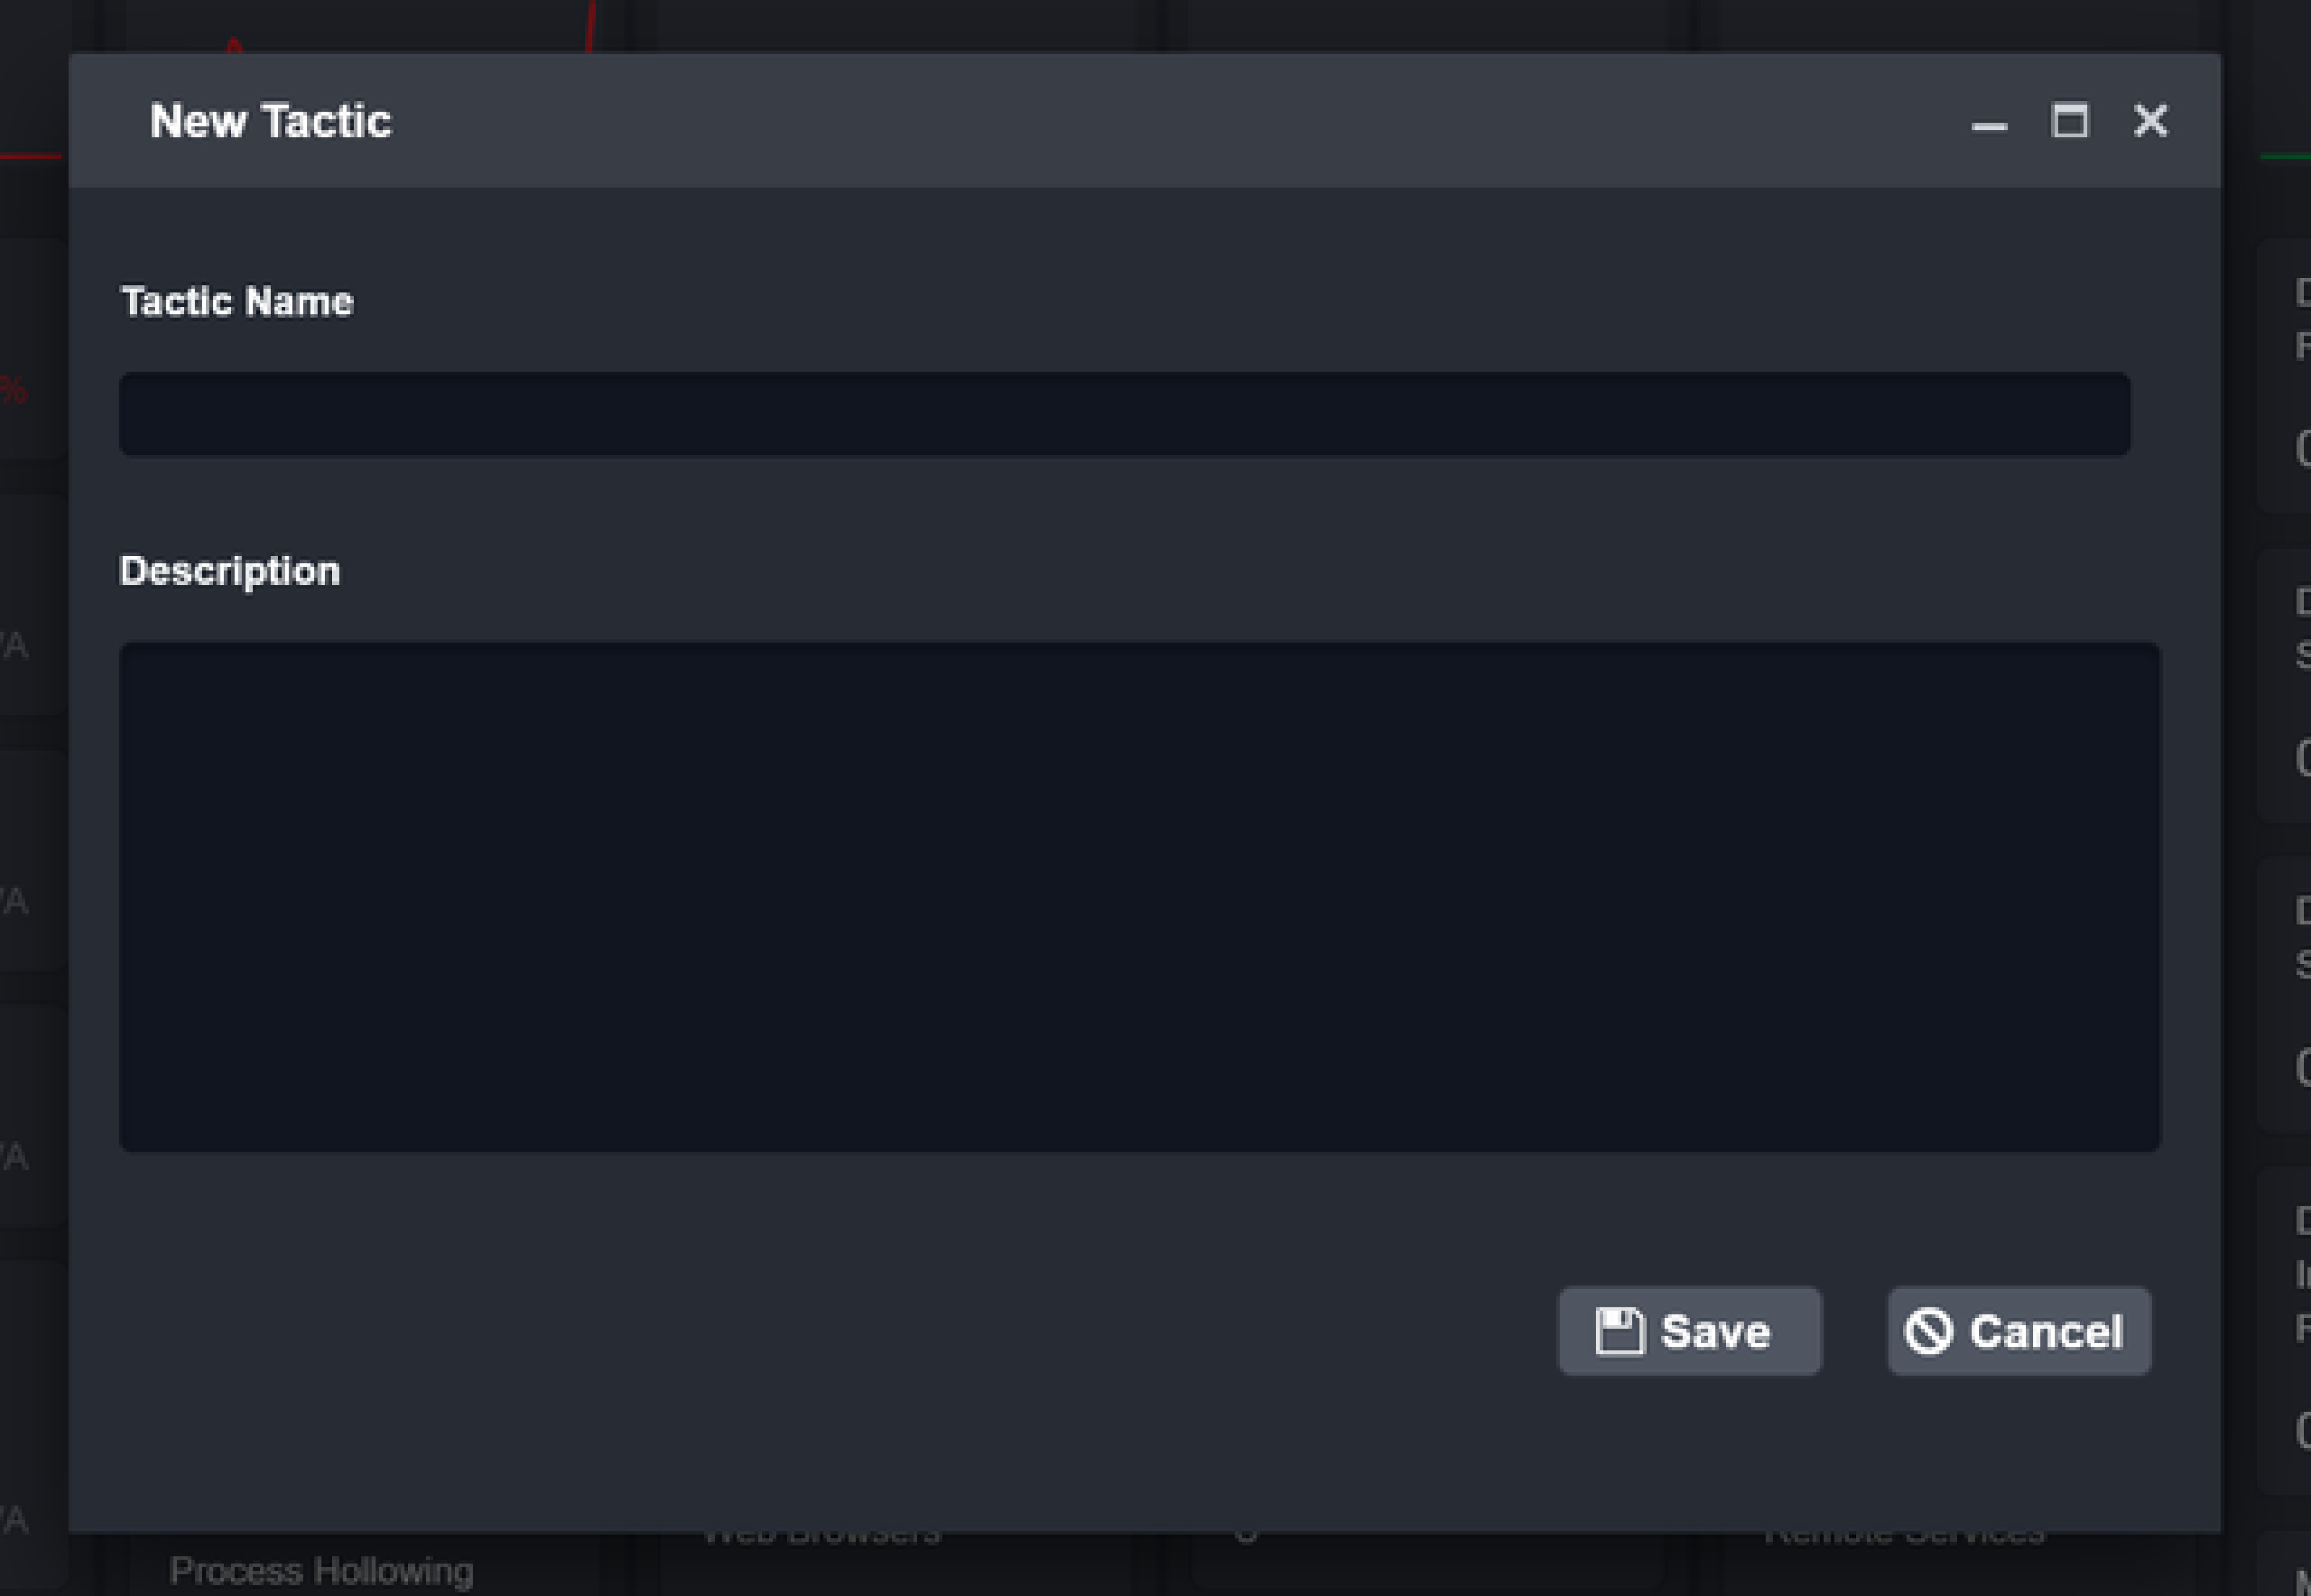
In the New Tactic window, enter the following details:
-
Tactic Name
-
Description
-
READER NOTE
Add procedure information for a MITRE tactic and technique under the Group and Software sections.
-
Click Save.
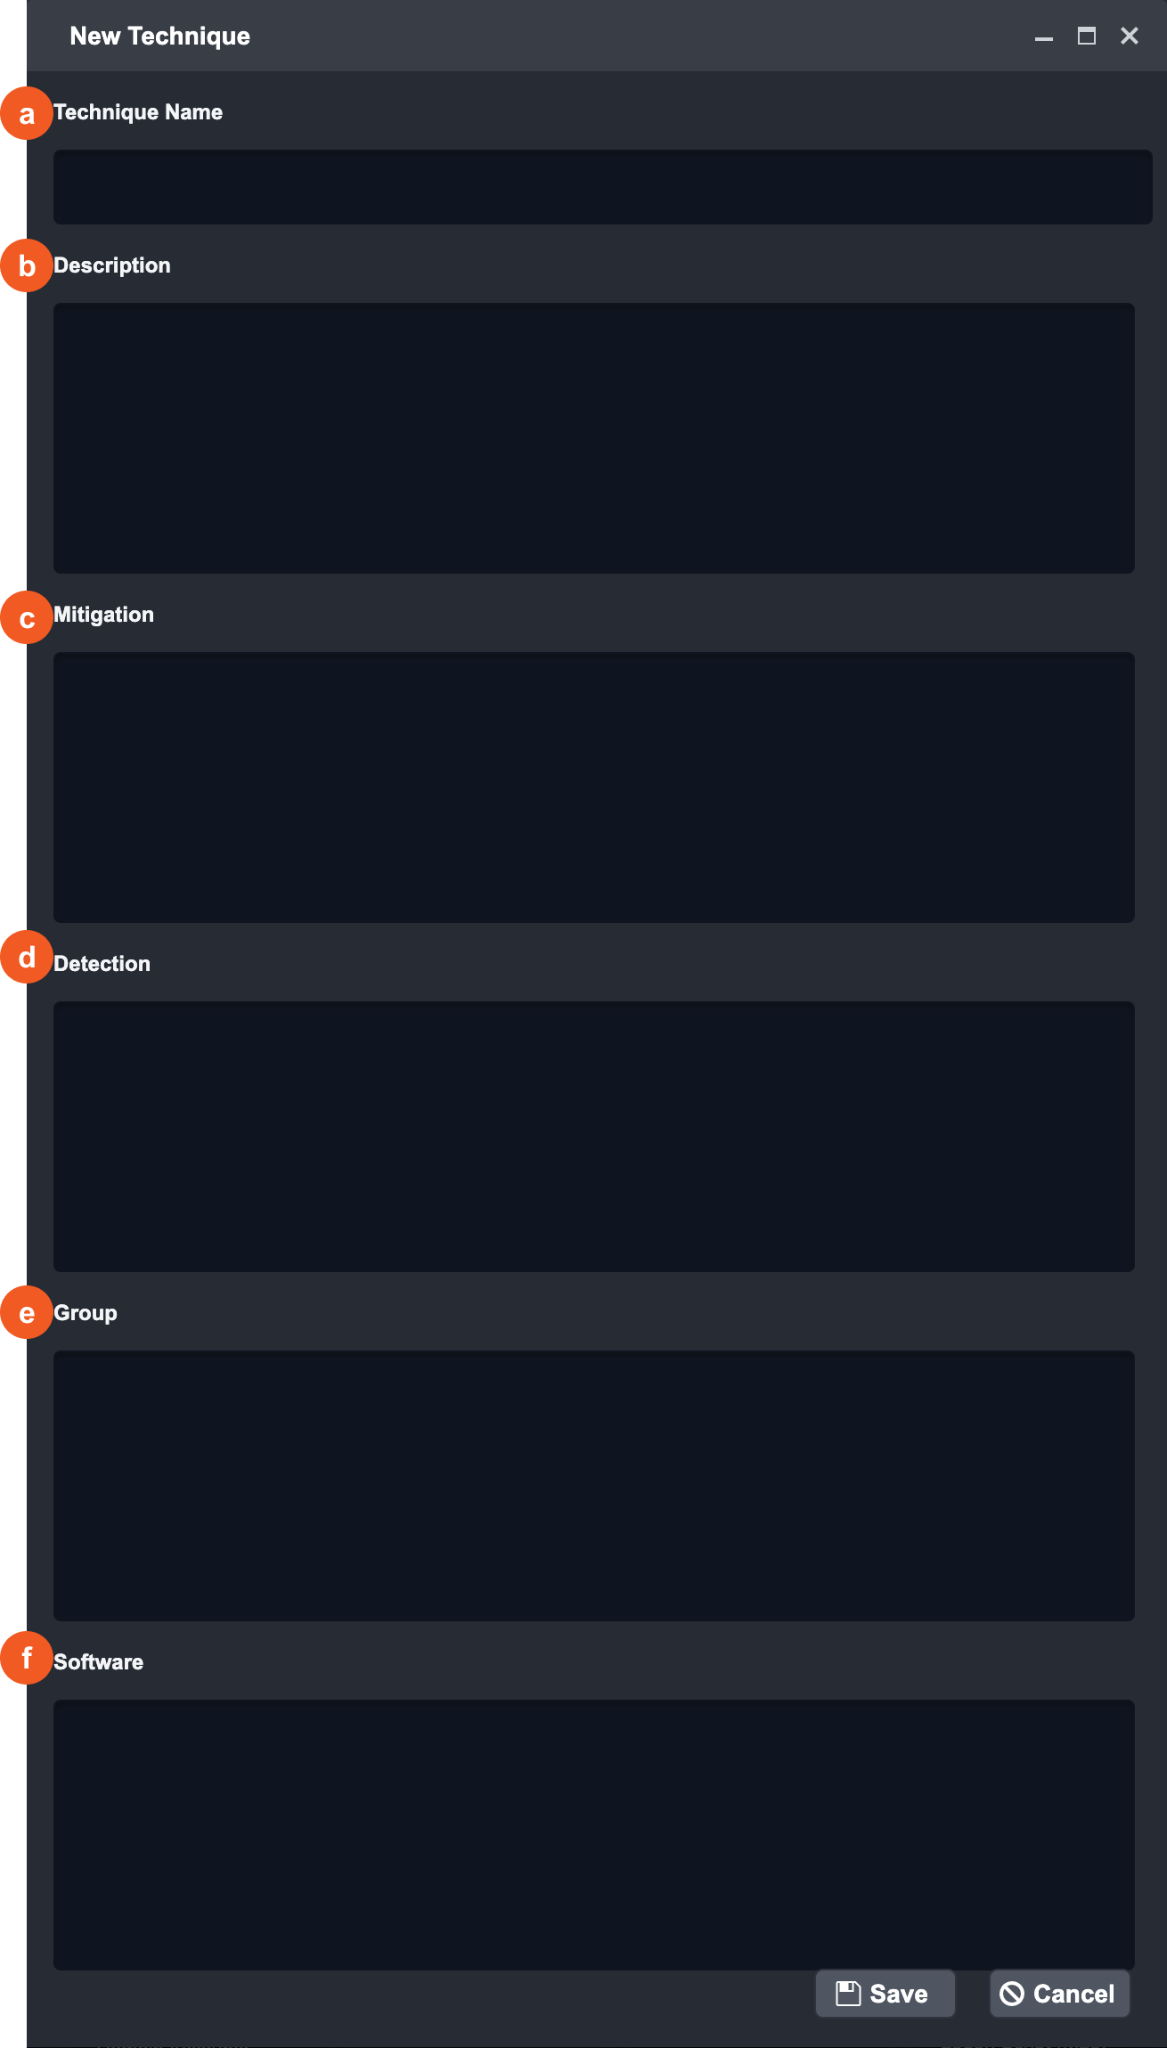
Creating a New Technique and Procedure
After creating a tactic, add a technique under it. Optionally, add procedure information for the technique.
|
|
READER NOTE Add procedure information for a MITRE tactic and technique under the Group and Software sections.
|
|
Creating a Technique Search Criteria
Add search criteria to system or custom tactic-technique-procedures. The search criteria determine an event's TTP label during ingestion. After criteria are created, newly ingested events that match the criteria are labeled with the corresponding TTP.
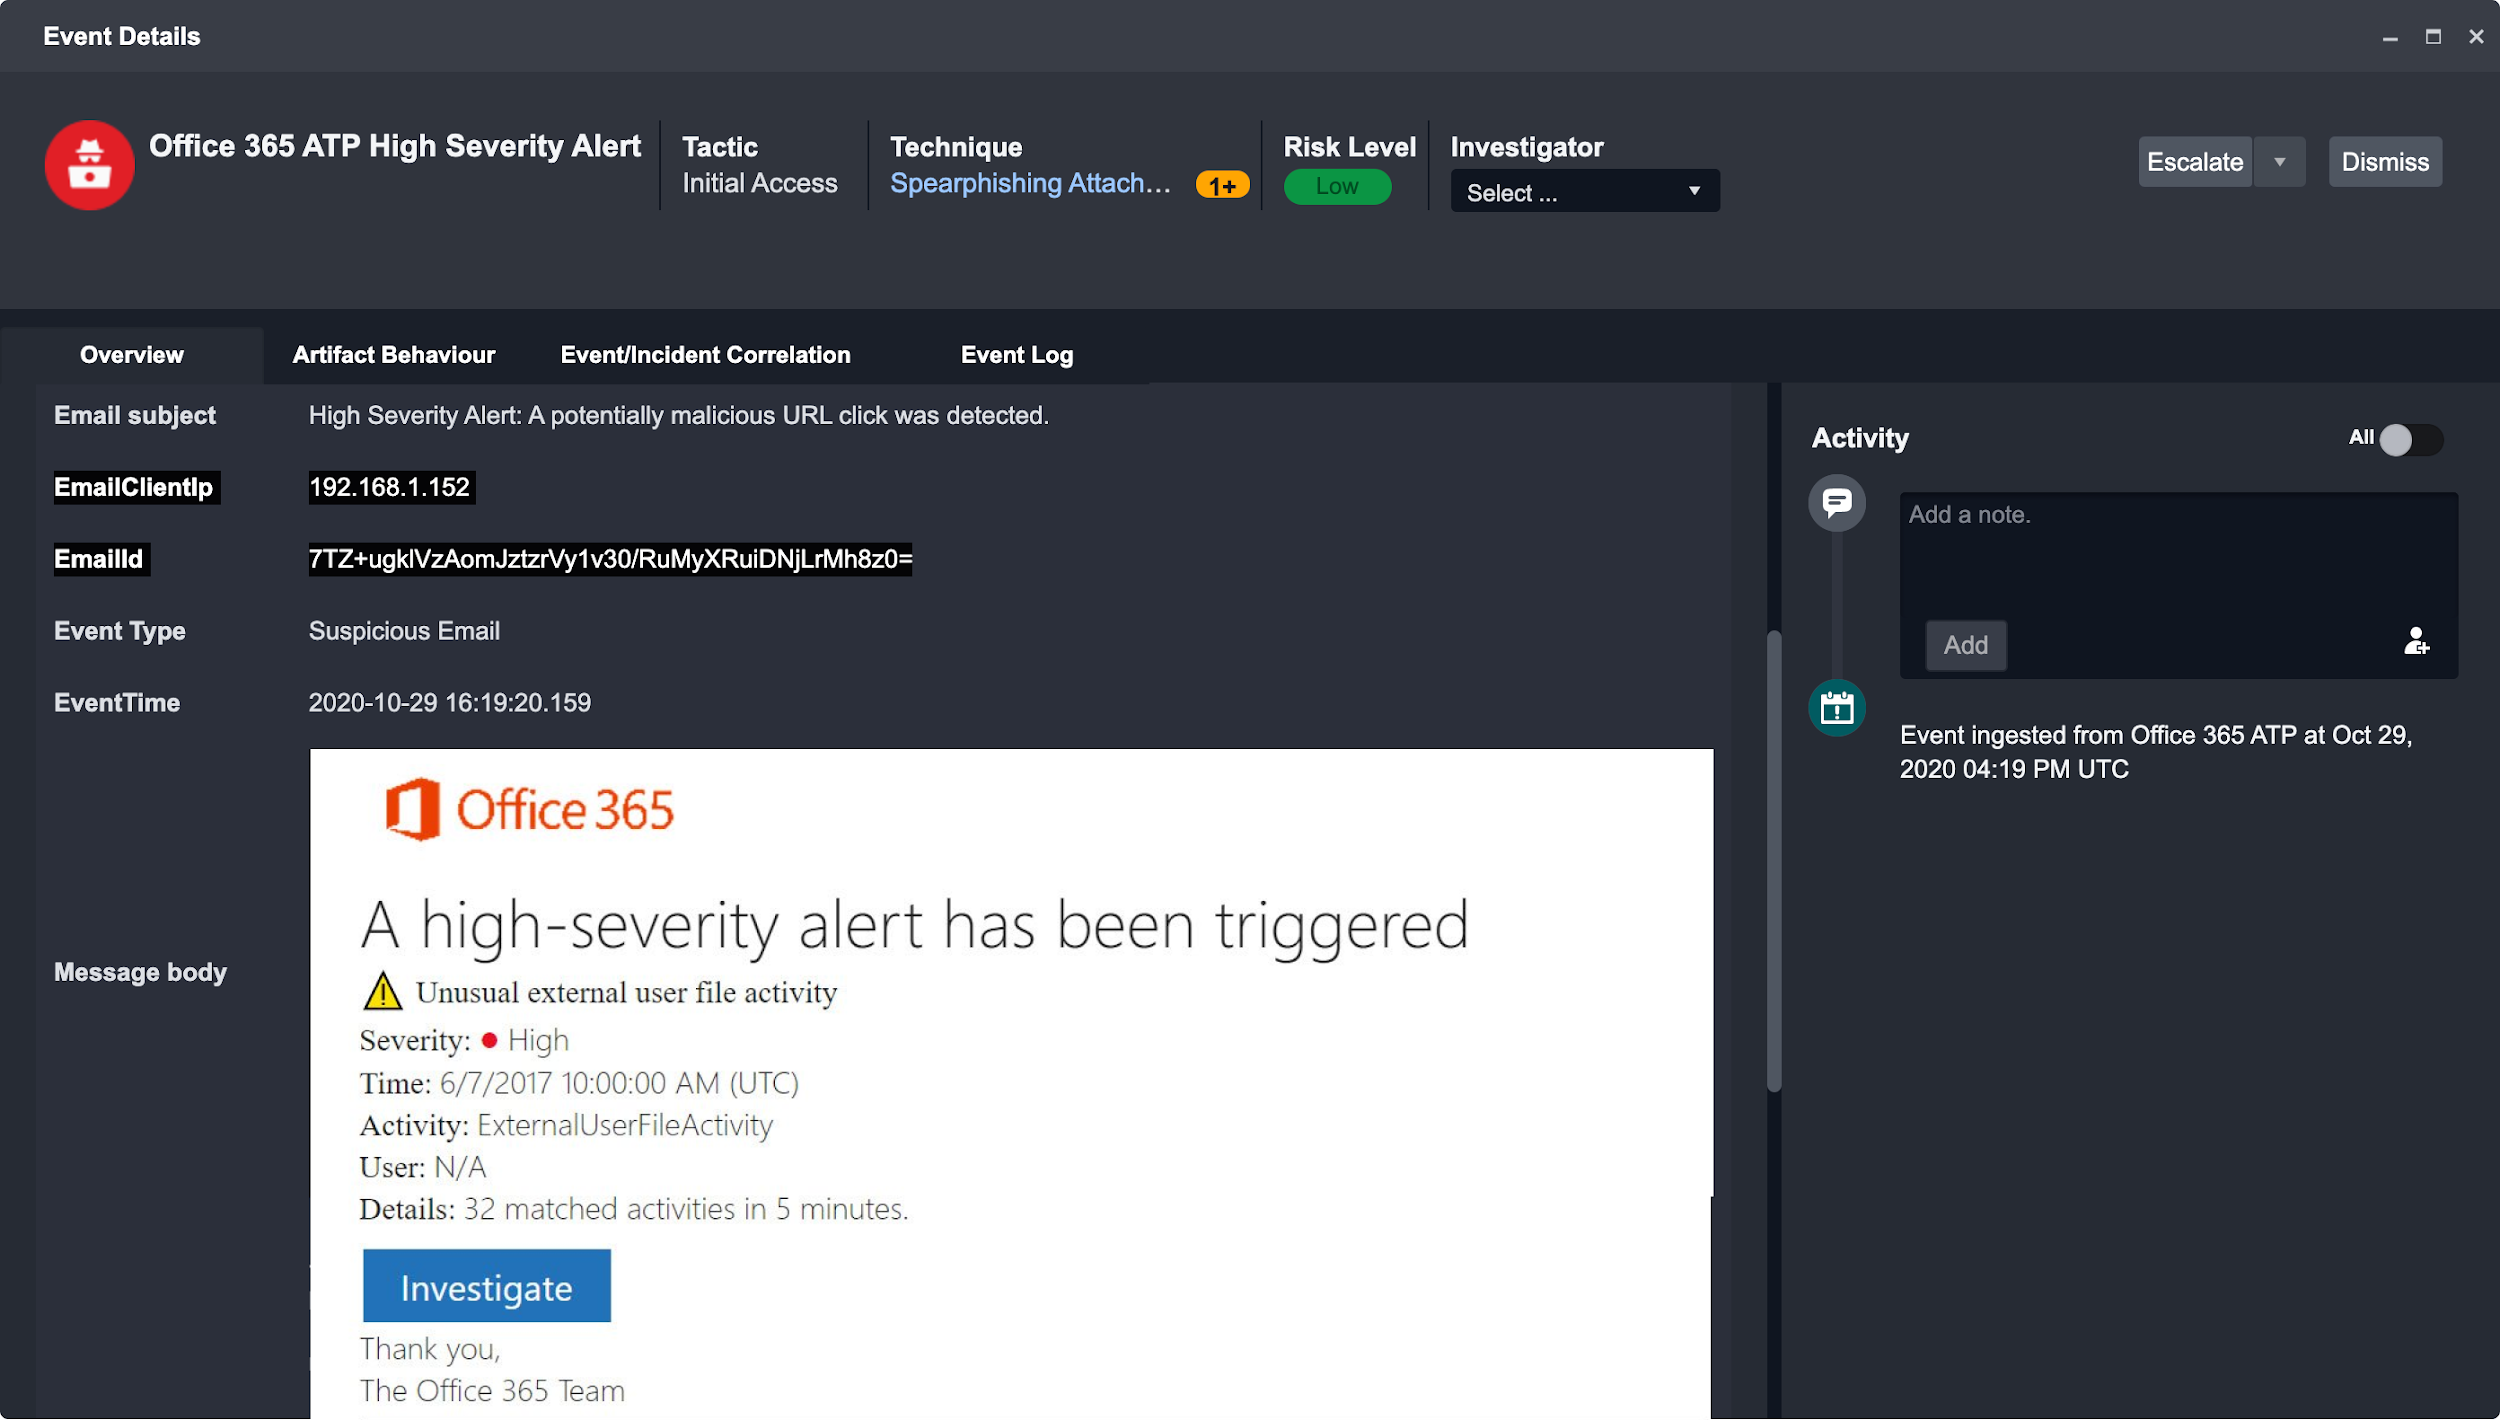
The example below outlines the steps to add a search criteria to the Spearphishing Link technique for Office 365 ATP alerts.
In this example, Office 365 ATP alerts are being automatically ingested to D3 to create an Event. The search criteria will be looking for a Spearphishing Link Event that generally has the description in the Email Subject as "A potentially malicious URL click was detected."
To map all new email alerts of this type to the Spearphishing Link technique:
-
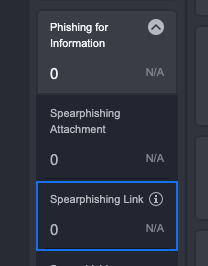
Expand Phishing for Information under the Reconnaissance Tactic in the Events tab.
-
Hover over the Spearphishing Link Technique and click on ⓘ to open up the Search Criteria editor.
-
Click + Create a New Search.

-
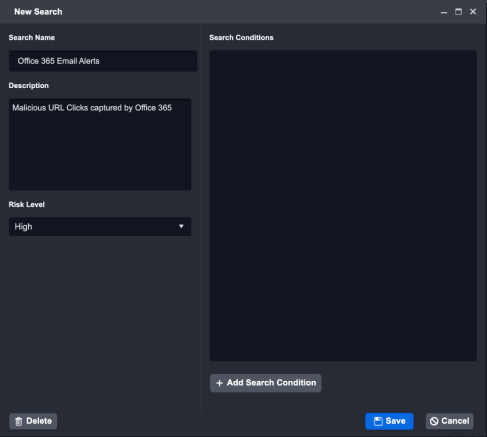
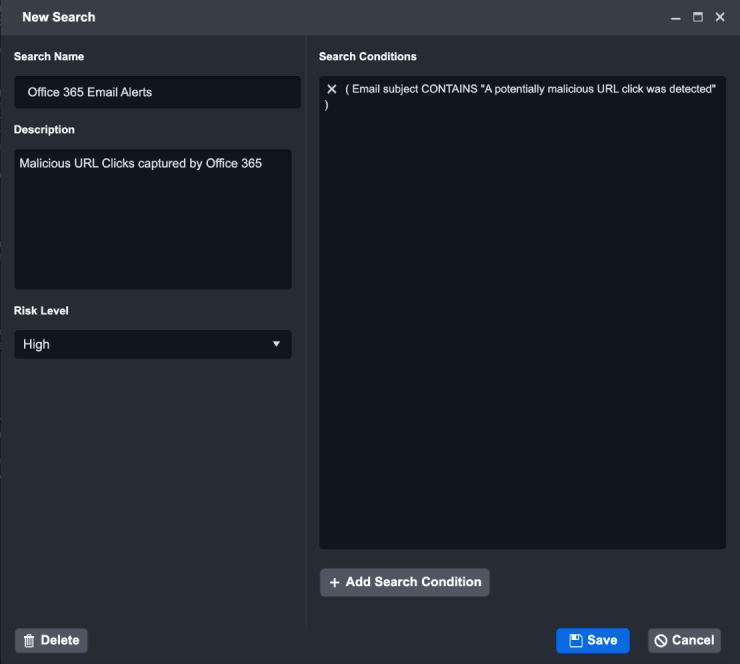
In the New Search window:
Search Name: Enter a name for the Integration.
Example - Office 365 Email Alerts
(Optional) Description: Enter a short description for this query.
Example - Malicious URL Clicks captured by Office 365
Risk Level: Set the risk level for this query.
Example - High
-
Click + Add Search Condition
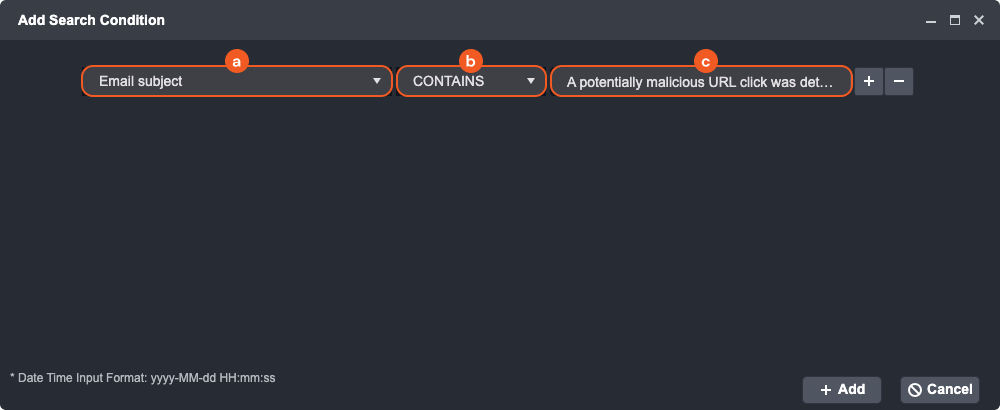
In the Add Search Condition window:-
Click on the Field dropdown and select Email Subject
-
For the Operator dropdown, select CONTAINS.
-
Type "A potentially malicious URL click was detected" into the Value input field.
-
-
After adding all search queries, click the + Add button.
READER NOTE
The observable condition operators are dependent on the event field type selected.
-
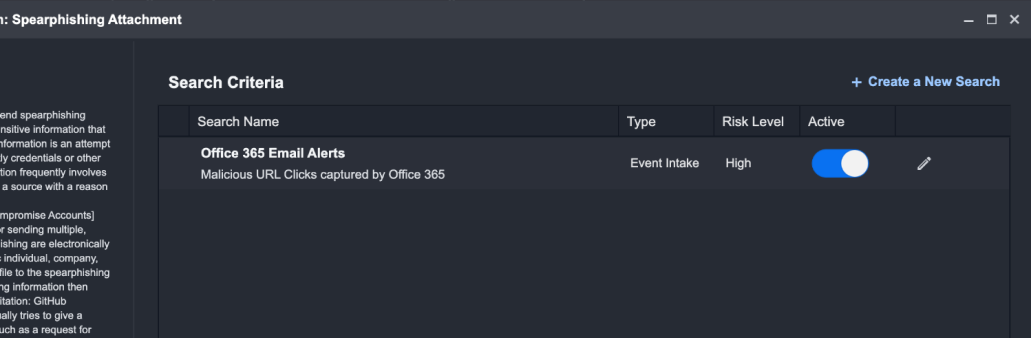
Review all the search queries in the New Search window, then click Save.
-
Activate this new search query by enabling the Active toggle.
READER NOTE
As a best practice, when building a custom Tactic-Technique-Procedure (TTP) search criteria, first analyze a few sample events. From the event data, look for specific fields and values that help generalize the characteristics of the events to then mark as a certain TTP group.
Viewing and Editing a Technique Search Criteria
View the search criteria for existing techniques by clicking ⓘ on a technique card. This view provides visibility into the criteria used to surface events.
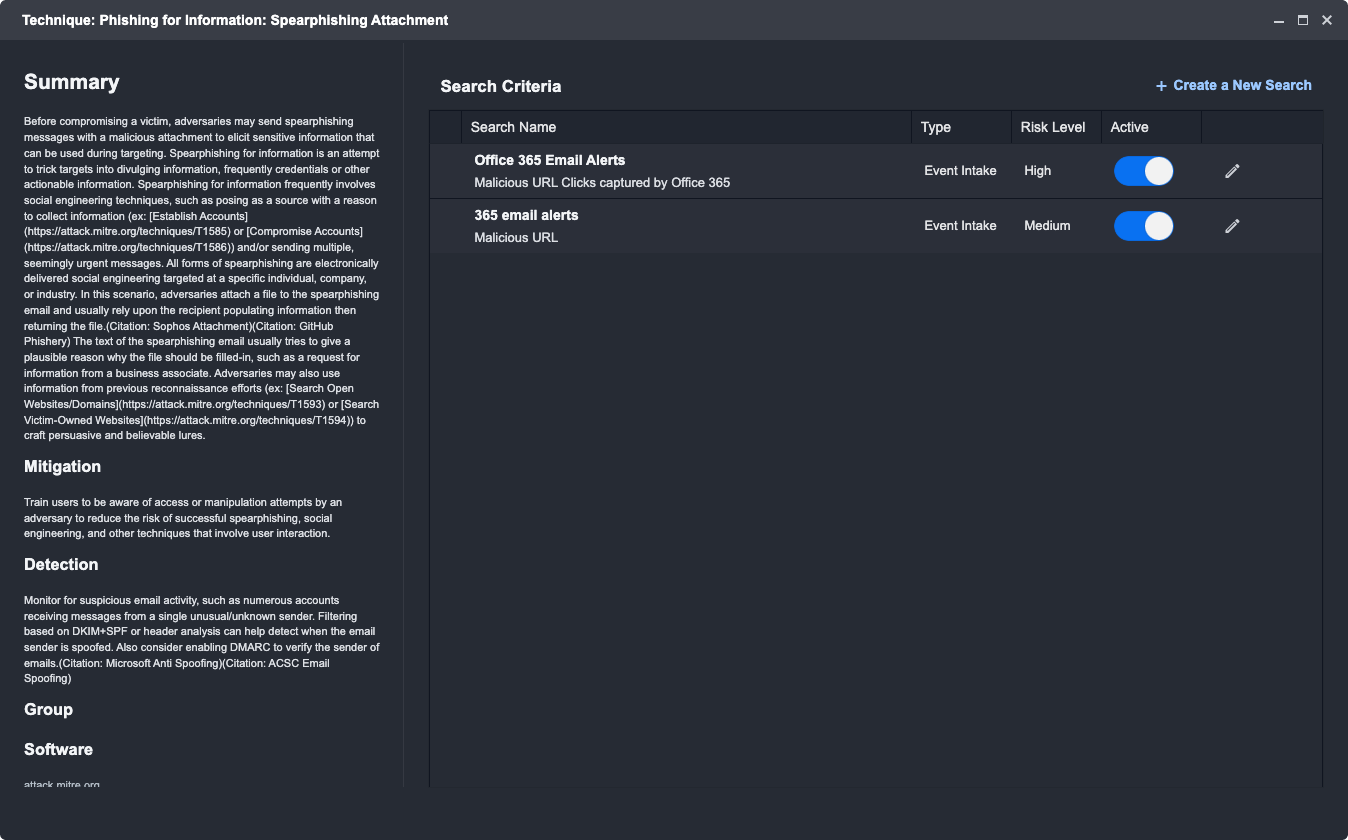
Edit or enable and disable existing search criteria. Clicking the pencil icon opens the same Search Query window described earlier.
READER NOTE
All system search criteria are view-only; user-created criteria can be edited.
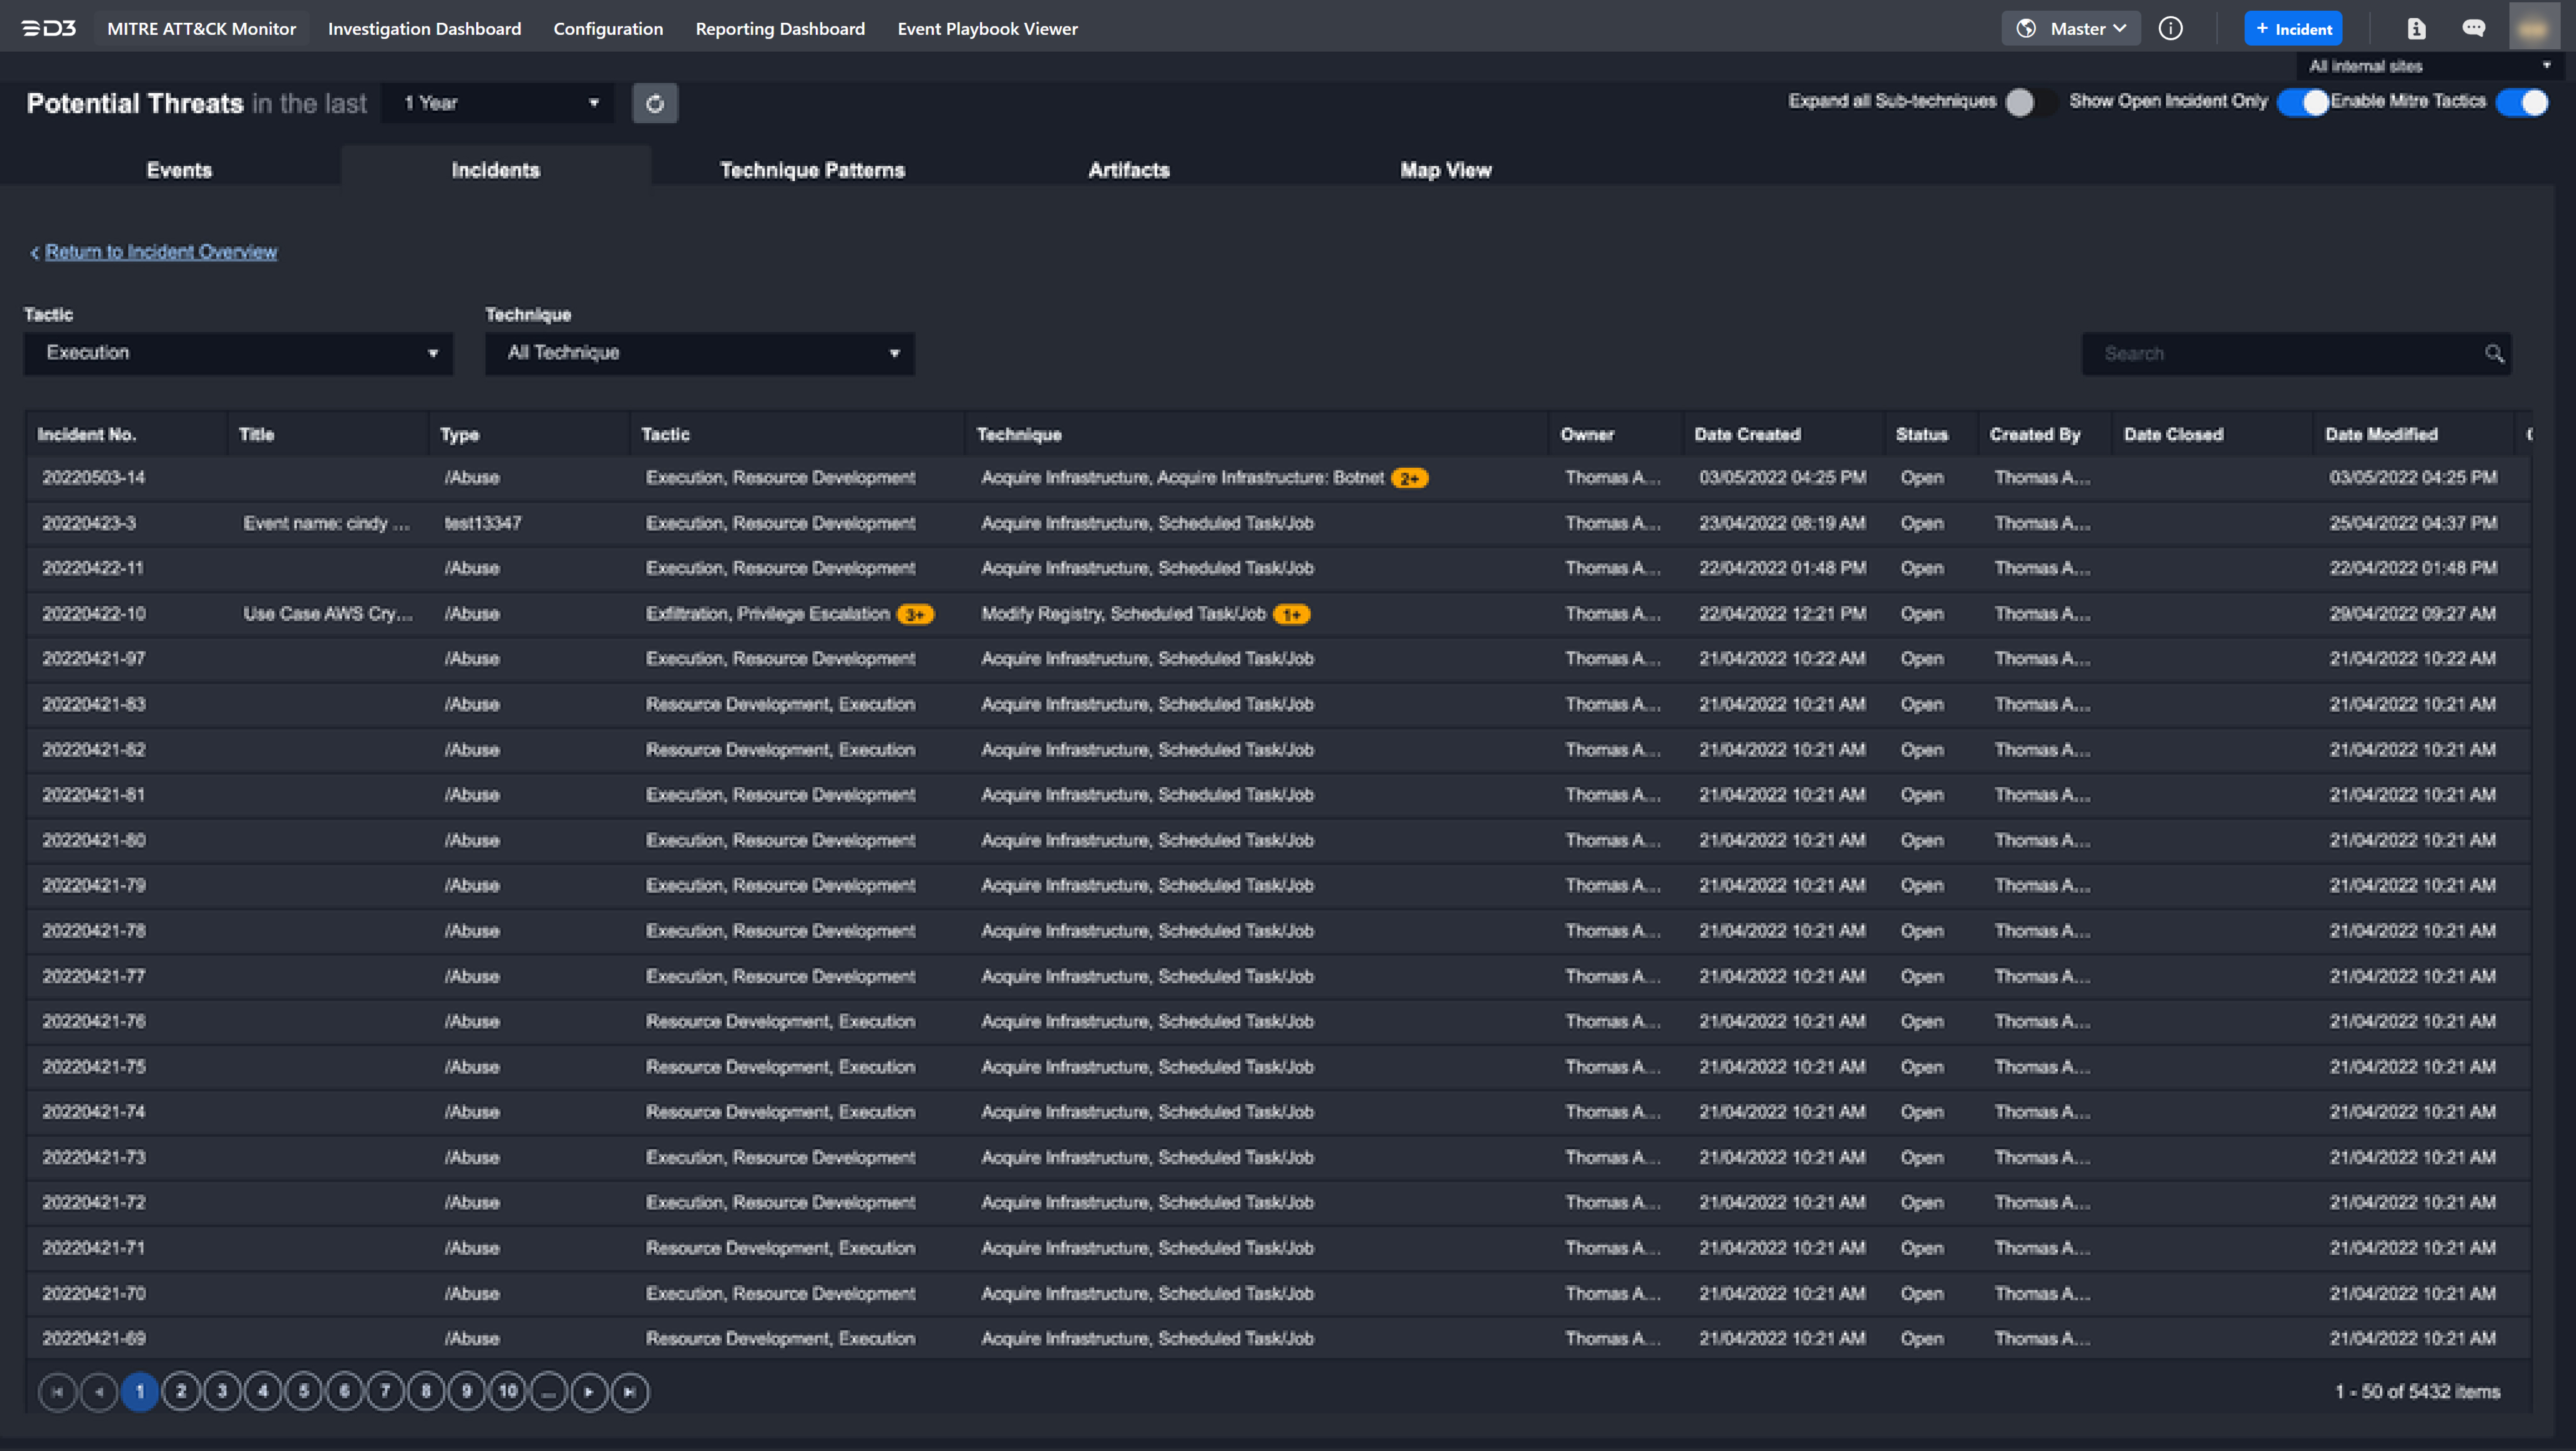
Incidents
The second tab provides the MITRE ATT&CK framework from the incident perspective. In this view, the displayed threats have been validated by users or automated event escalation rules.
Click a tactic or technique in this view to display the underlying incidents. Select an incident from the list to investigate it.
Investigating an Incident
Selecting an incident from the list opens the Incident Workspace, which provides the tools required to respond to an incident in one place.
For more information on this workspace, refer to Incident Workspace.
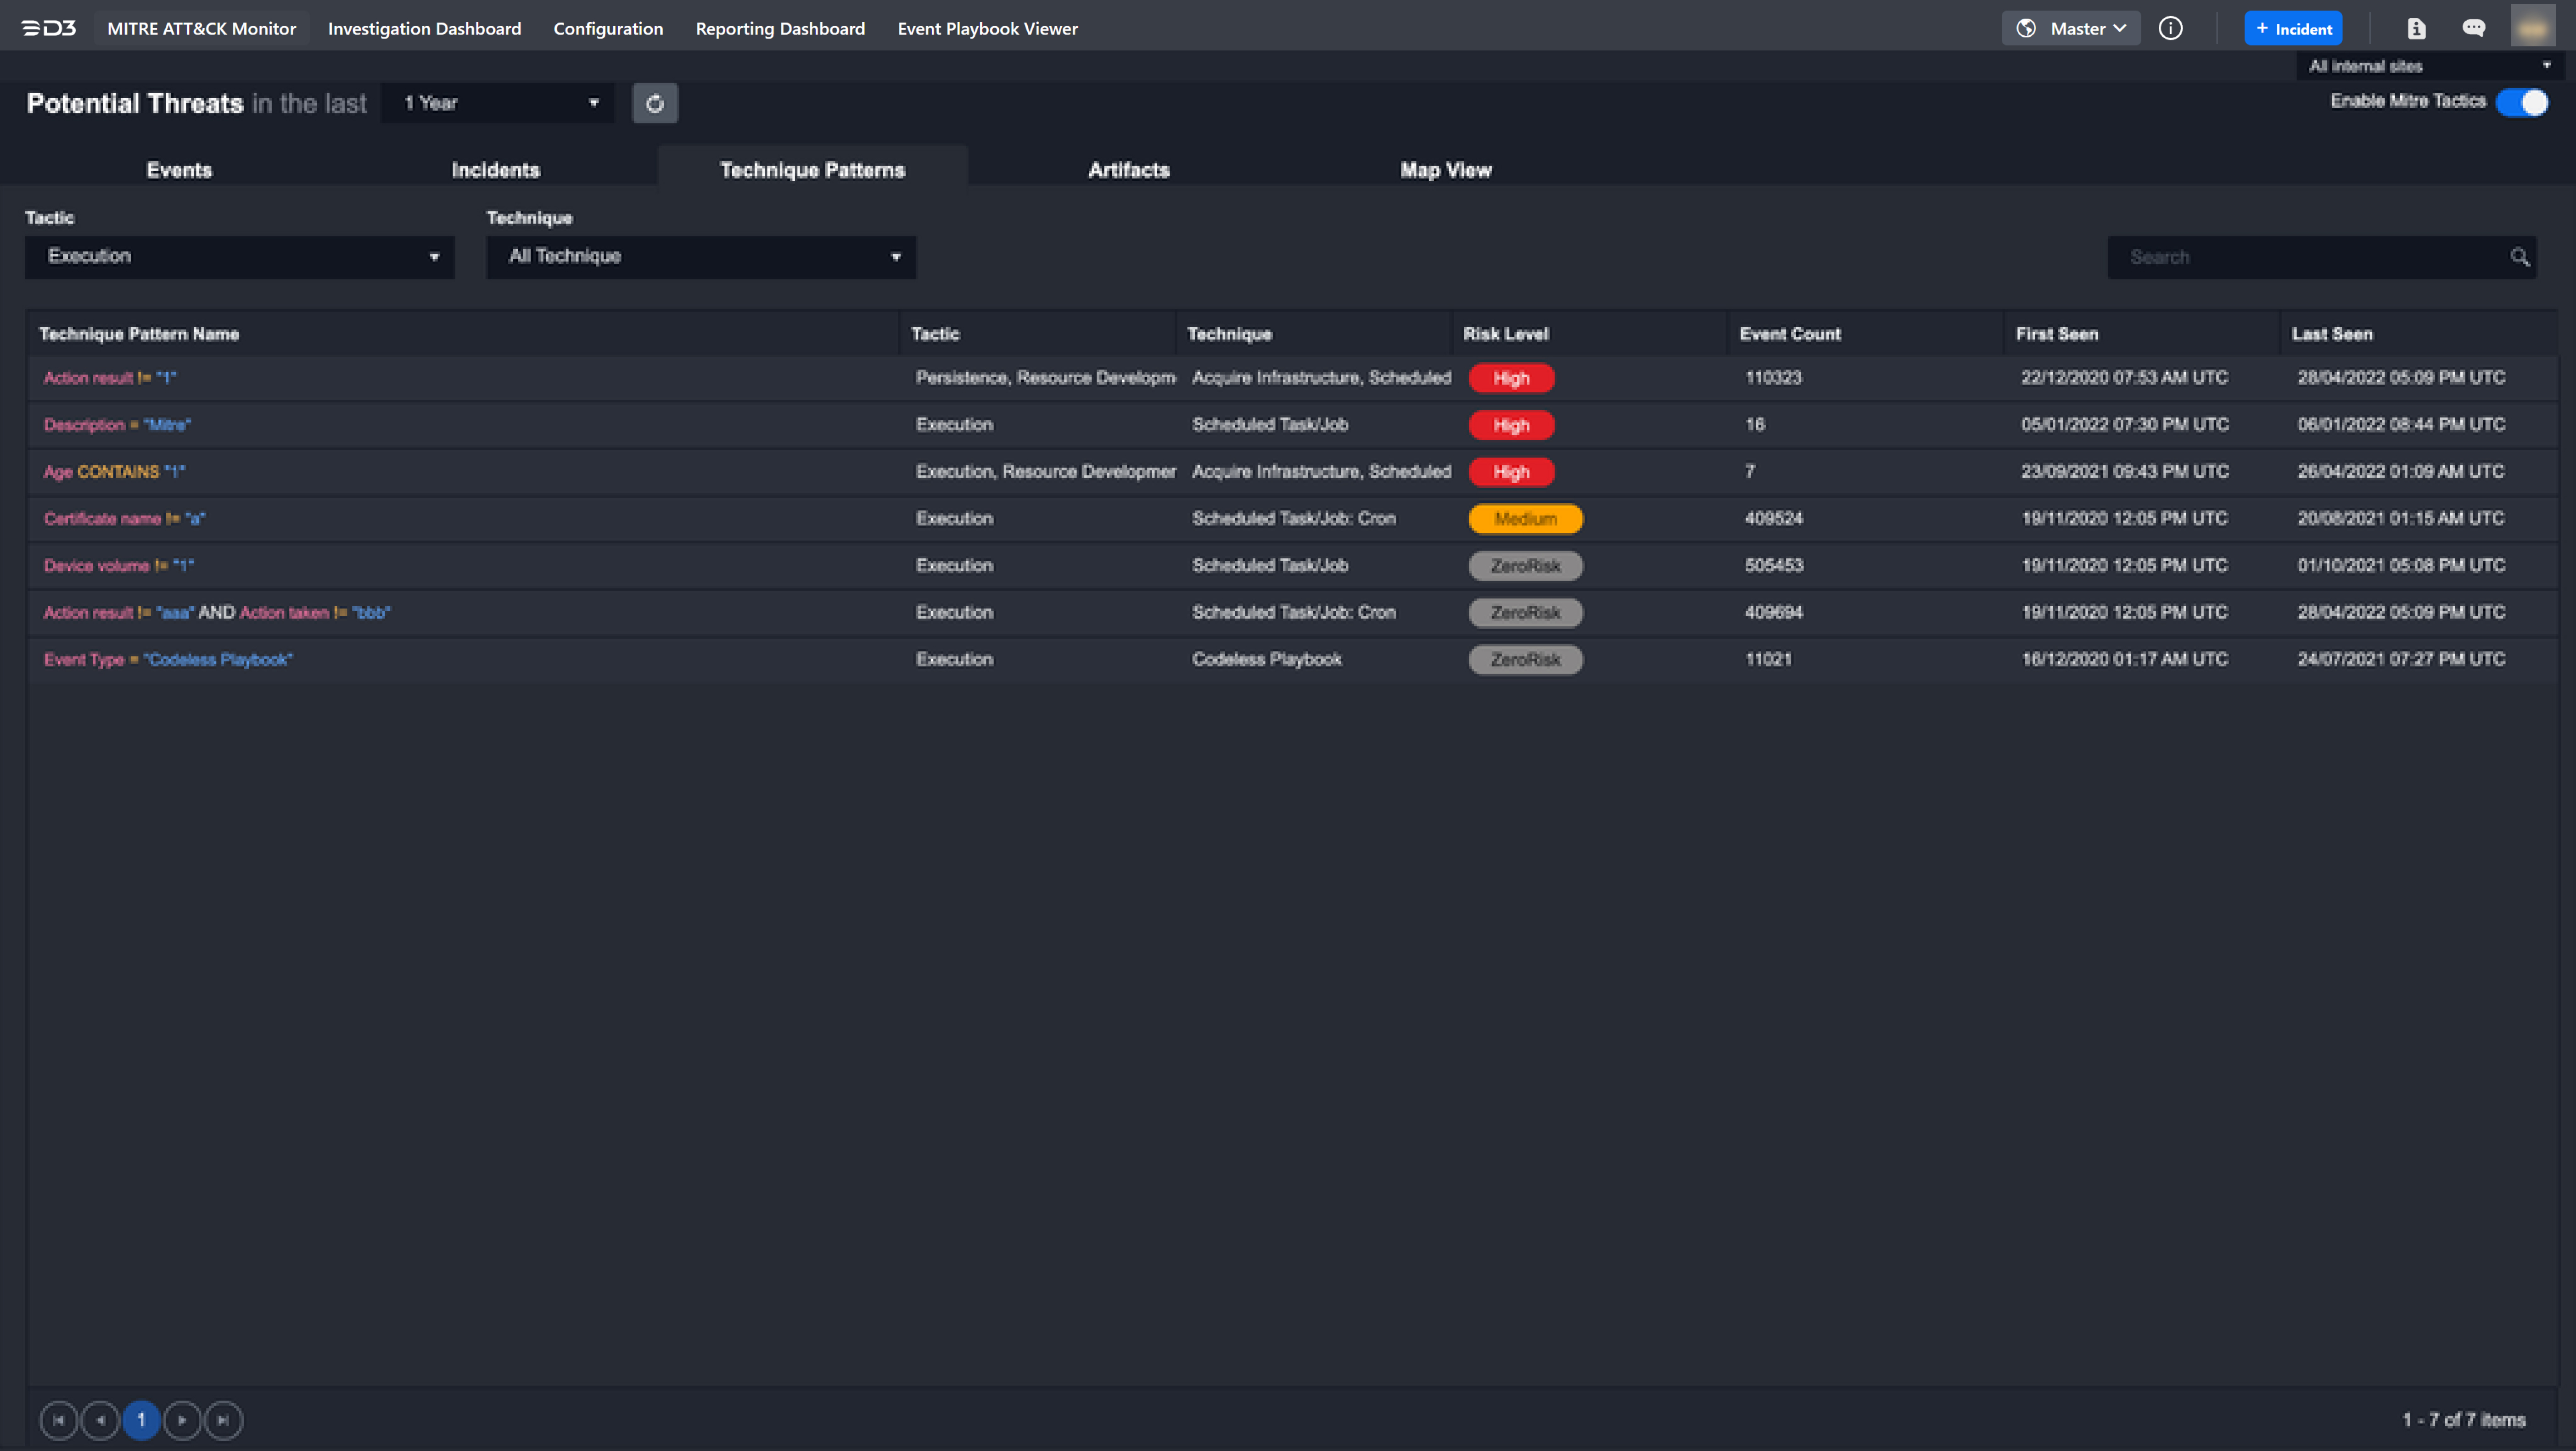
Technique Patterns
The Technique Patterns tab groups events based on the specific search criteria that were used to tag the event with the appropriate tactics and techniques. Use the condensed view to quickly identify attack patterns and frequency. Technique Patterns relevant to specific incidents can also be accessed in the Incident Workspace.
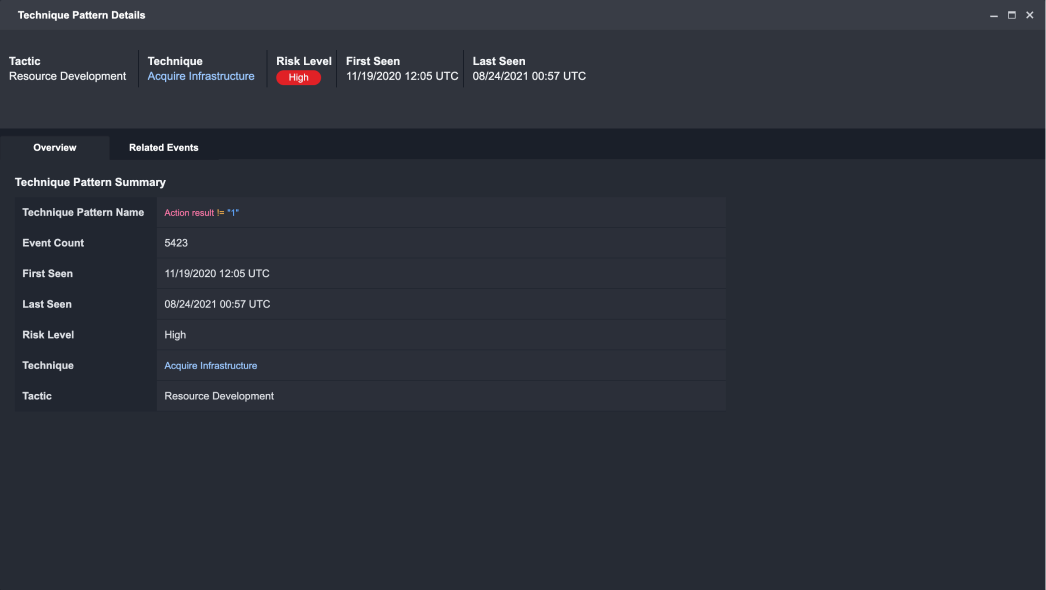
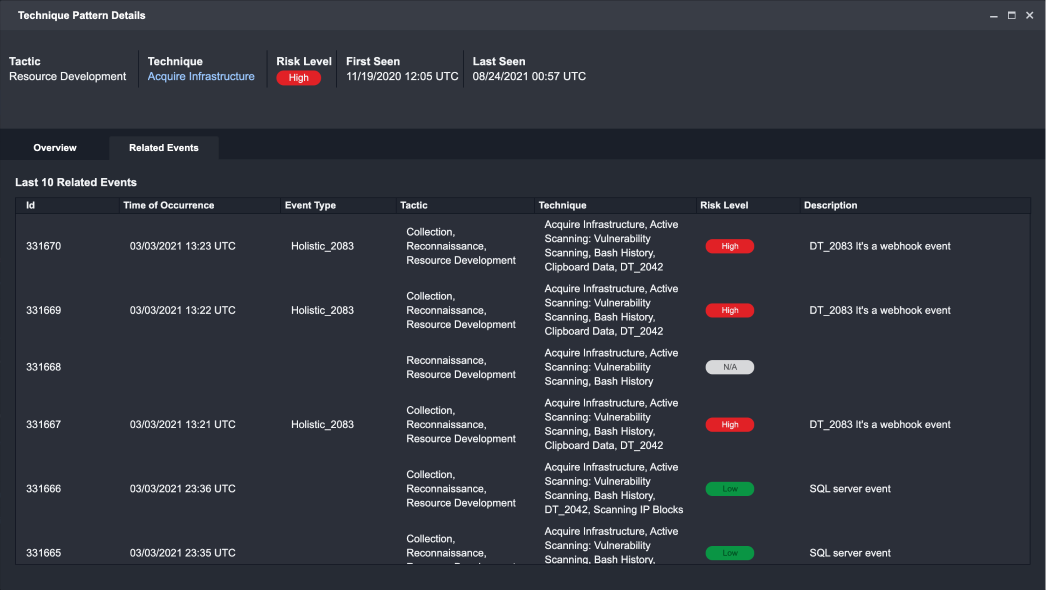
Technique Pattern Details
Click a technique pattern from the list to open the Technique Pattern Details window, where users can view additional details about the selected pattern and its associated events. Two key views are available in Technique Pattern Details.
-
Overview: Provides all relevant information for the selected technique pattern.
-
Related Events: Provides a list of all instances where the selected Technique Pattern appears in an event. Clicking on an event will expand to an Events Details window.
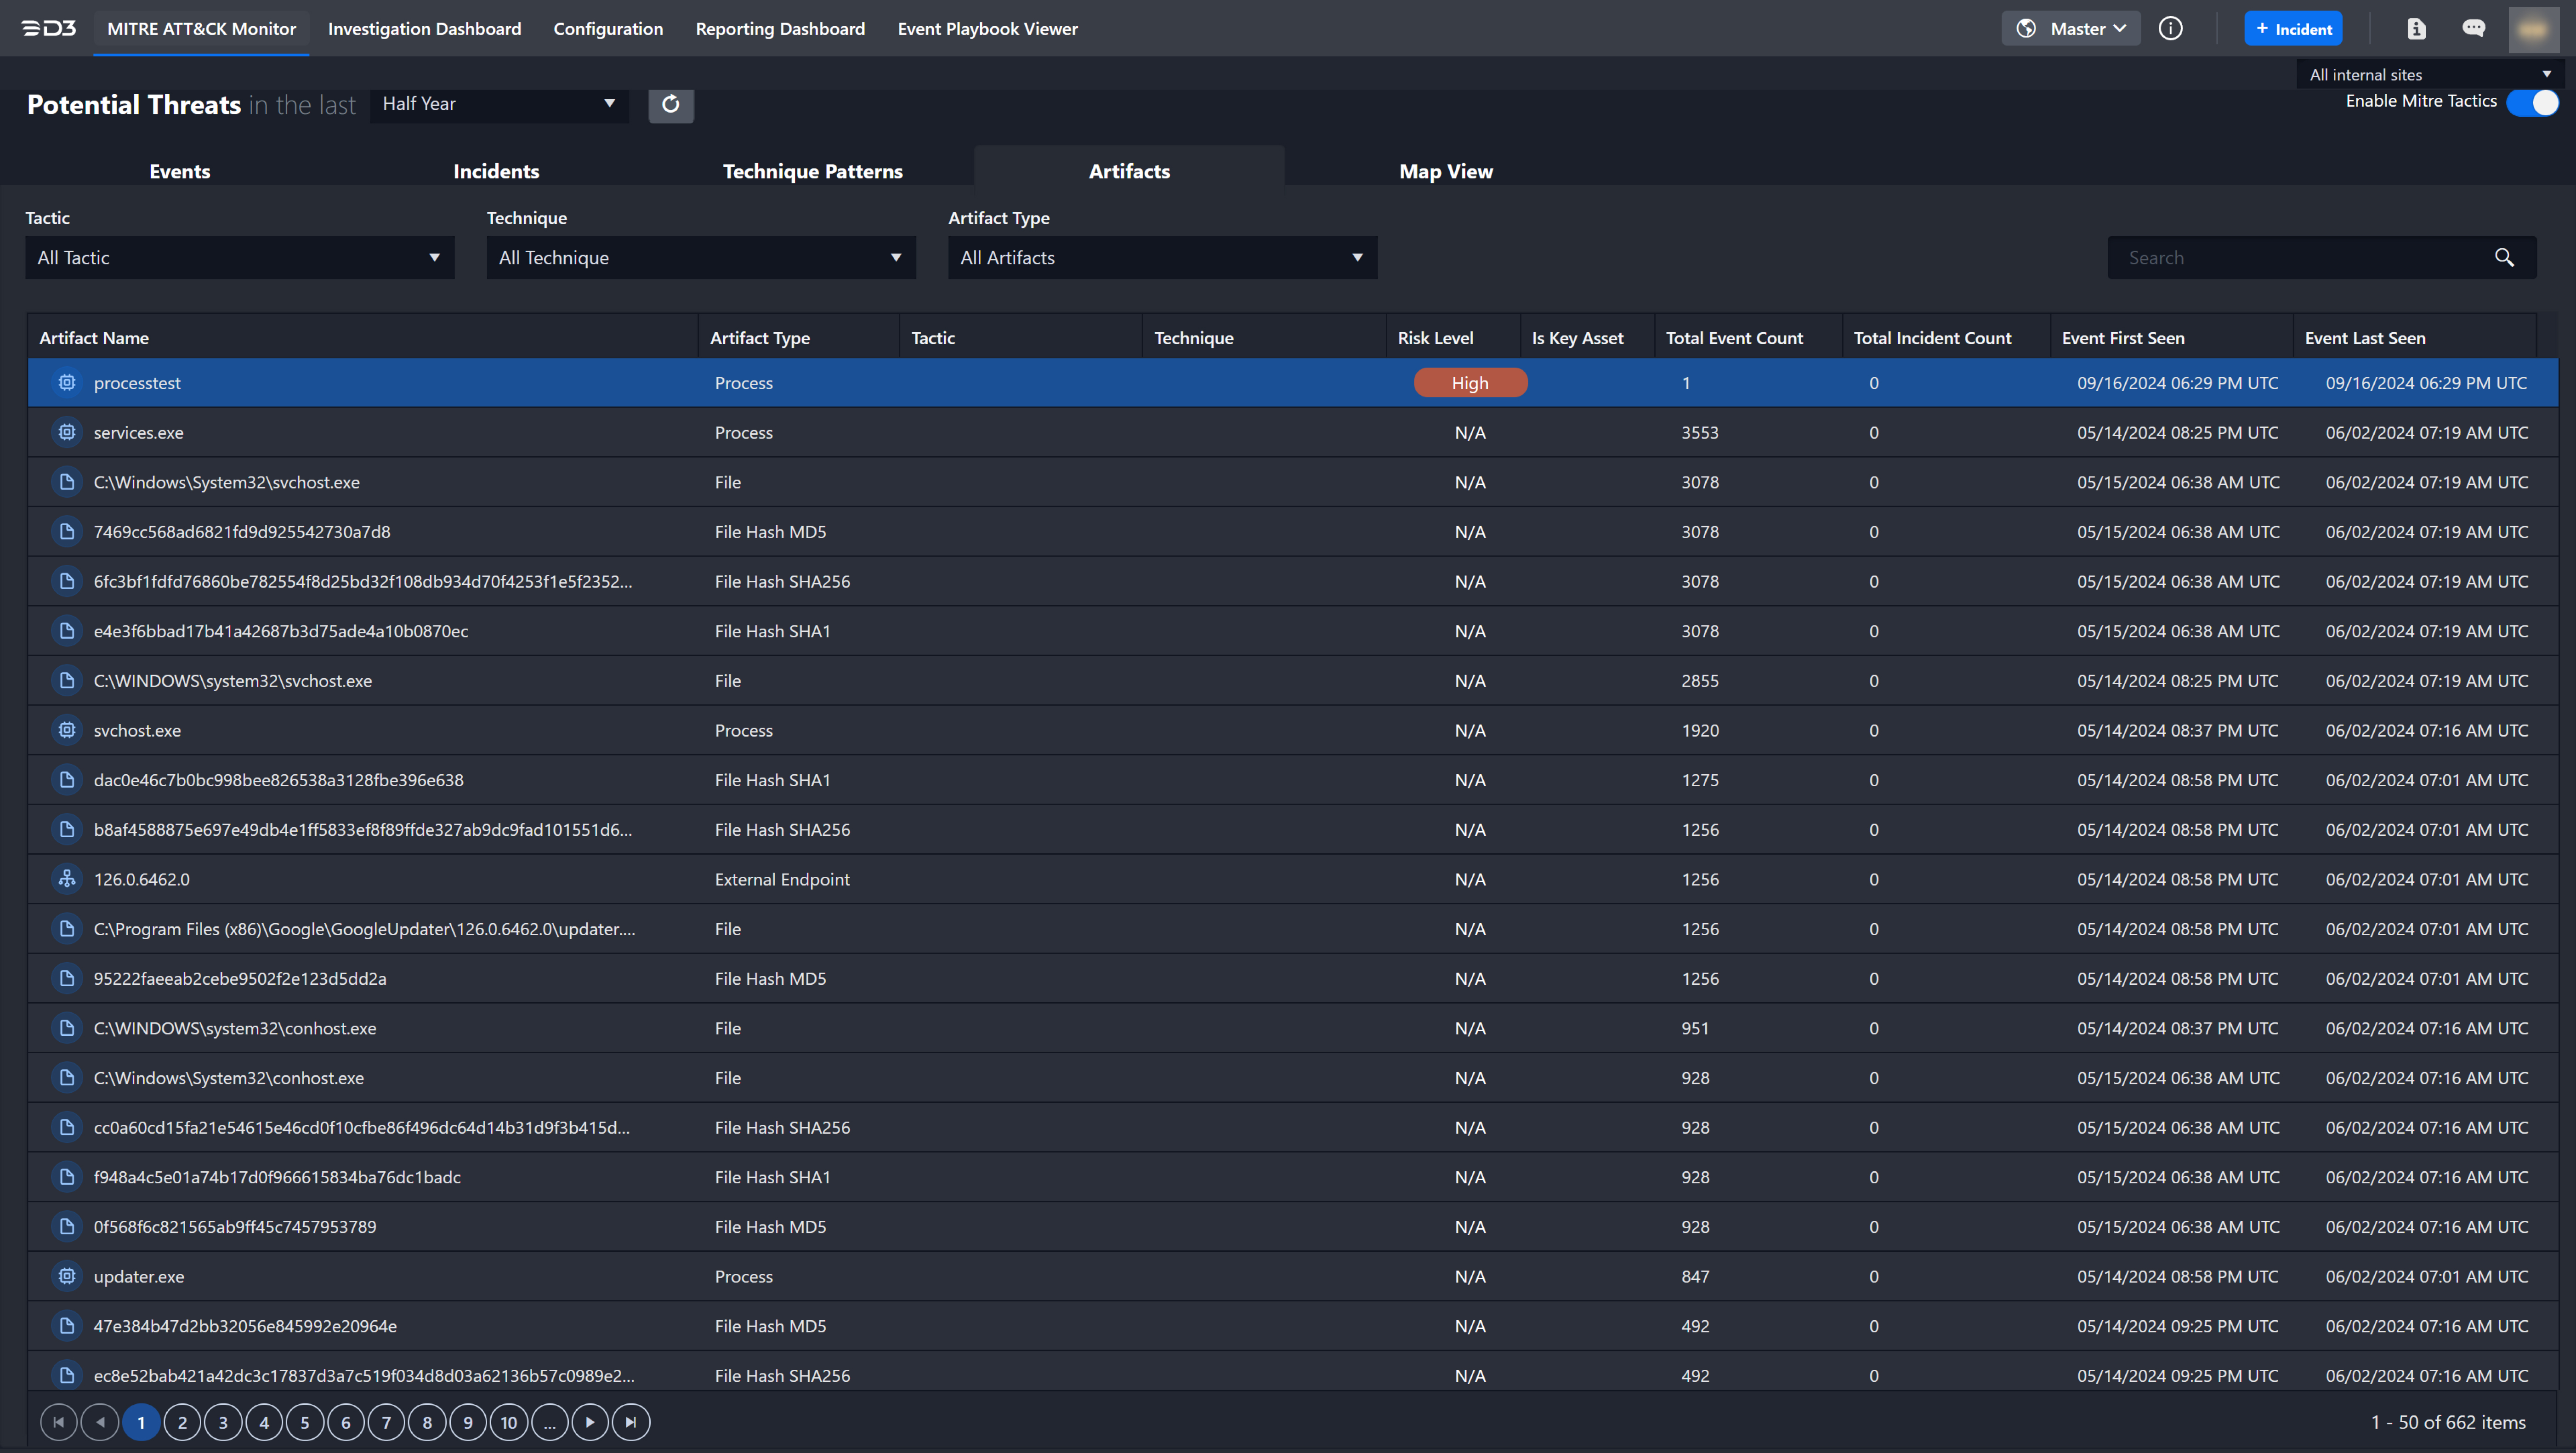
Artifacts
The Artifacts tab displays artifacts extracted from the events shown in the Events tab. Users can sort artifacts by importance level, such as identifying high-profile artifacts like critical servers. Artifacts related to specific incidents can be accessed in the Incident Workspace.
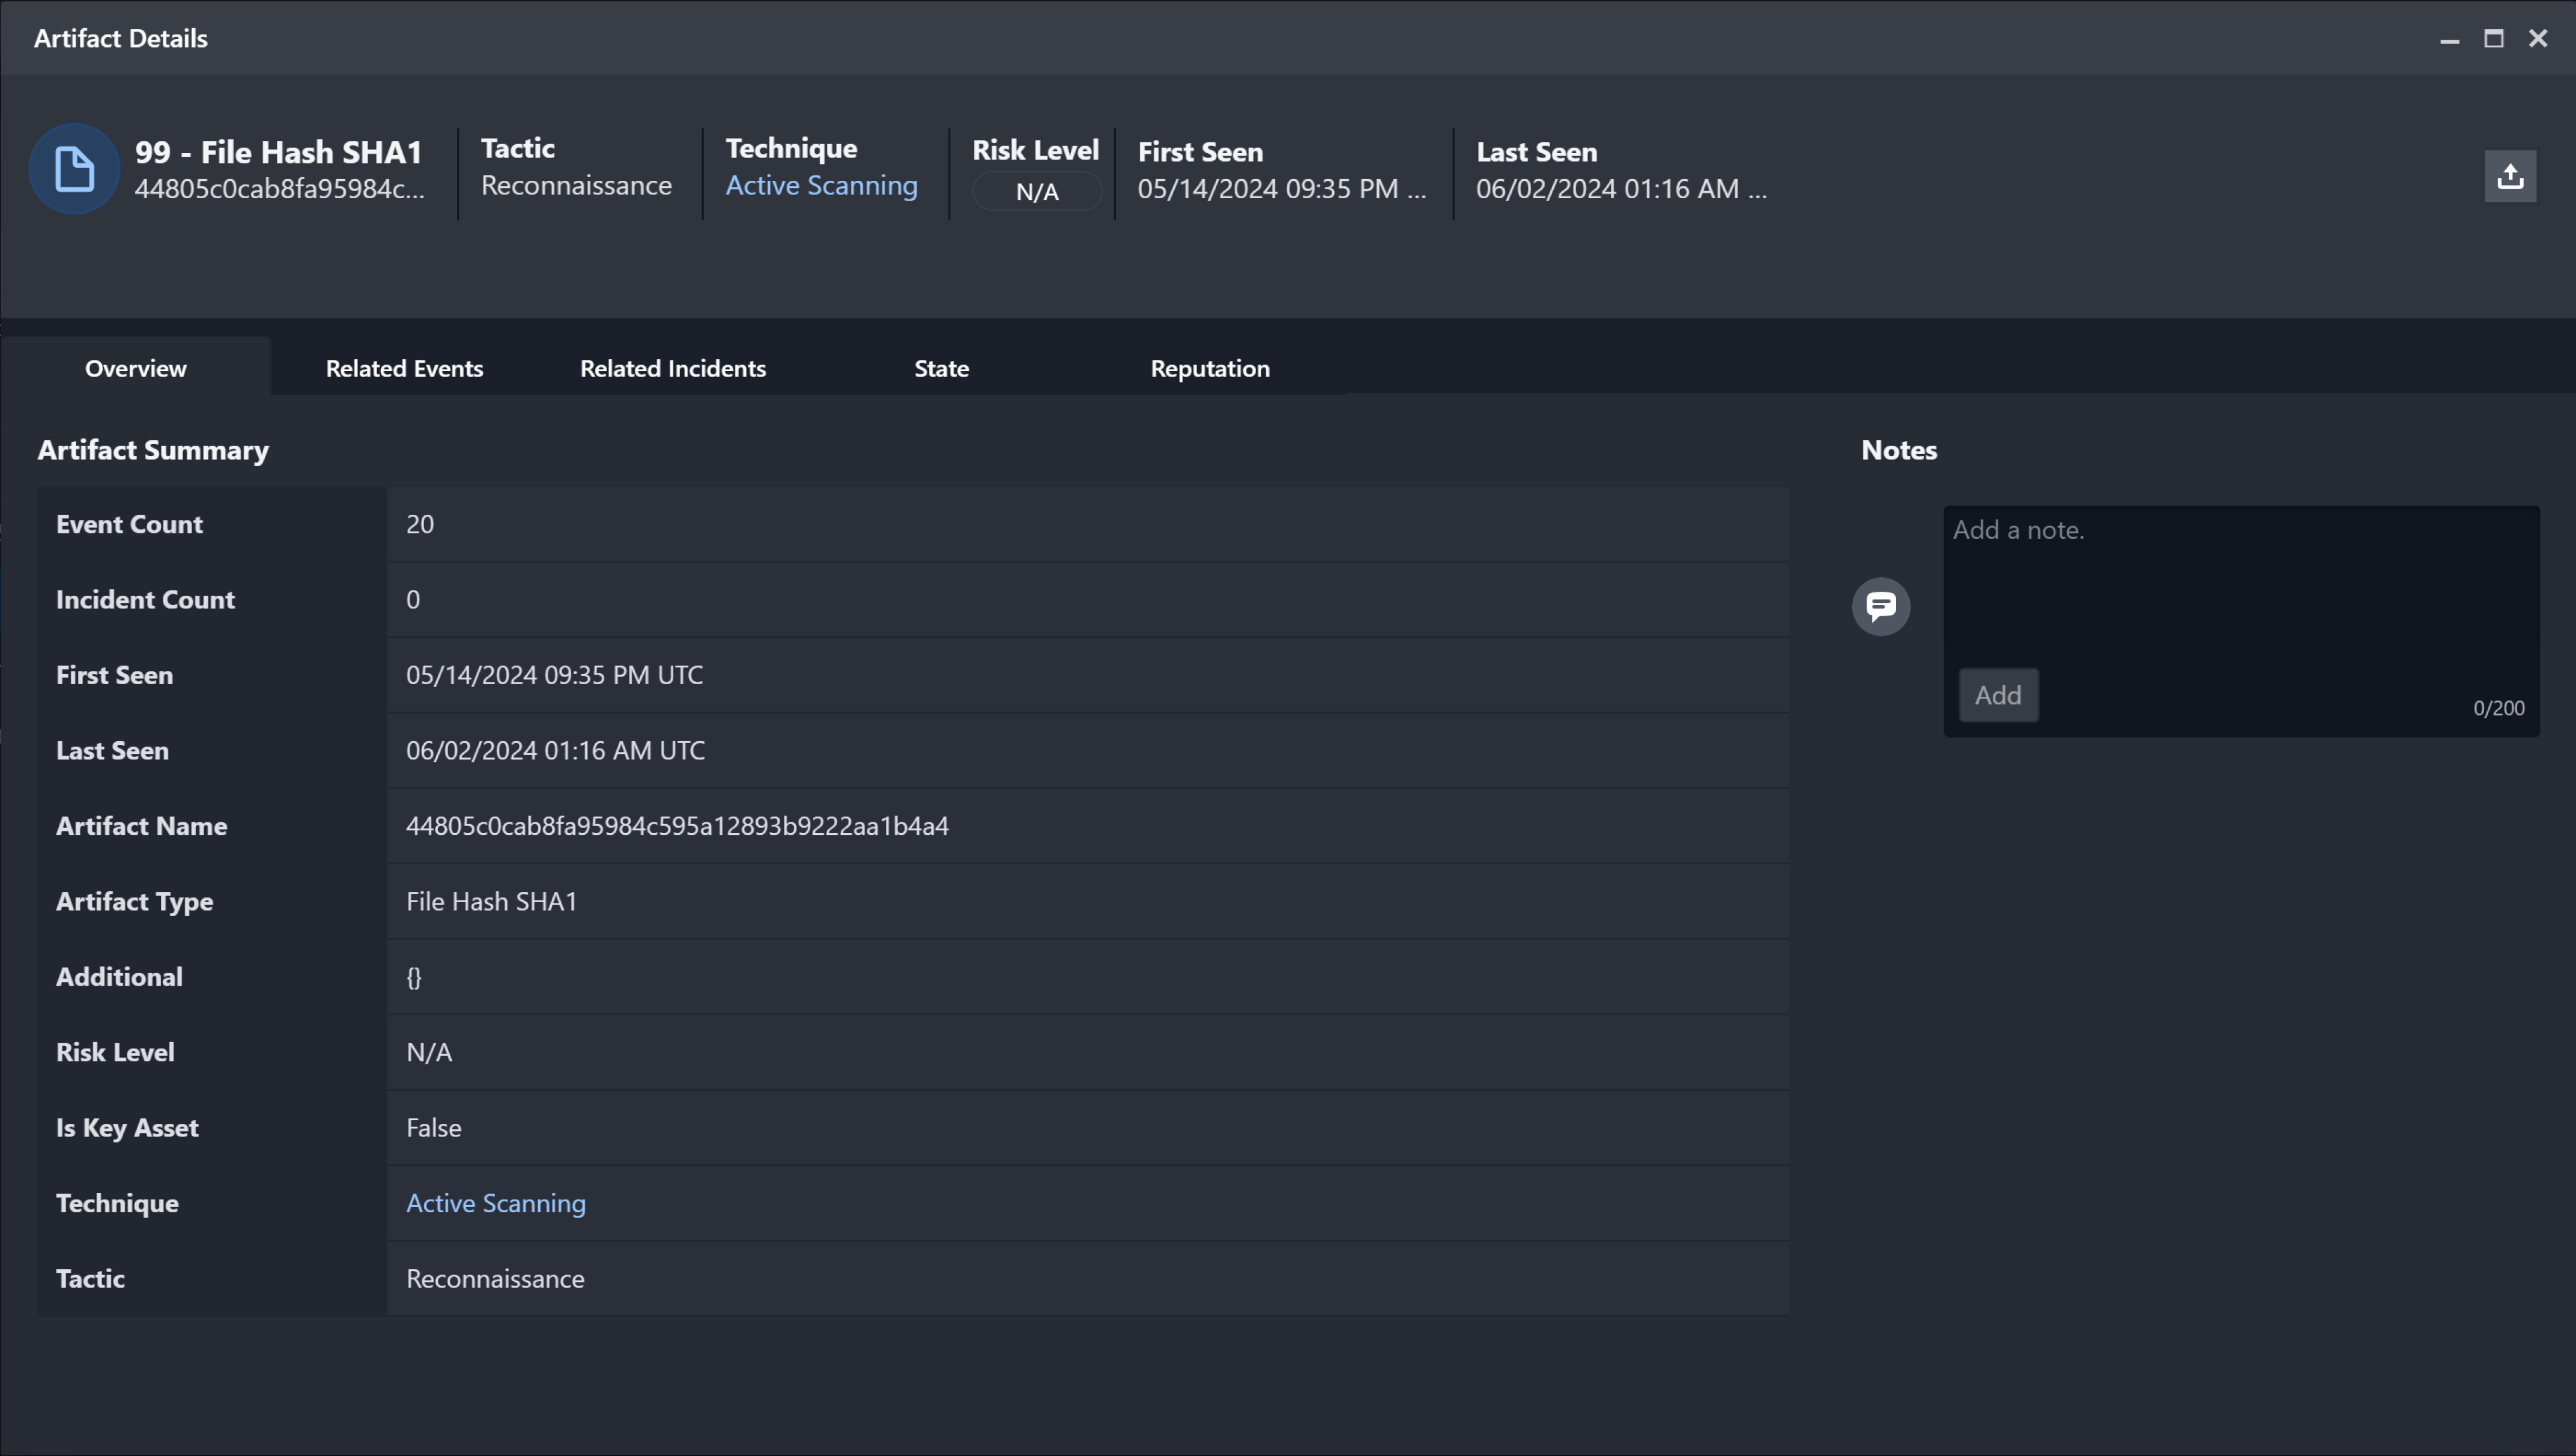
Viewing Artifact Details
Click an artifact from the list to open the Artifact Details window, where users can view additional details and associated events. Artifact Details contains five tabs.
-
Overview: Displays all relevant information for the selected Artifact.
-
Related Events: Provides a list of all instances where the selected artifact appears in an event. Clicking on an event will open the Event Details window.
.jpg?cb=6021232932a3093f20664ab6165bc509)
-
Related Incidents: Provides a list of all instances where the selected artifact appears in an incident. Clicking on an incident will open the related Incident Workspace.
.jpg?cb=c37c248a2f8517137309d9430ec13cd8)
State: If the artifact has been updated or changed, the State will display a history of said changes.
.jpg?cb=a84d8991e4904bc25e34baecfcb10f08)
Reputation: Provides a historical record of the reputation for the selected Artifact. This is useful to detect changes in an Artifact.
.jpg?cb=1e620729ce01297513d0d2d172d8aed0)
Artifacts can be exported in STIX 2.1 format, as a JSON file type. Use the share icon located at the top right corner of the artifacts detail window.
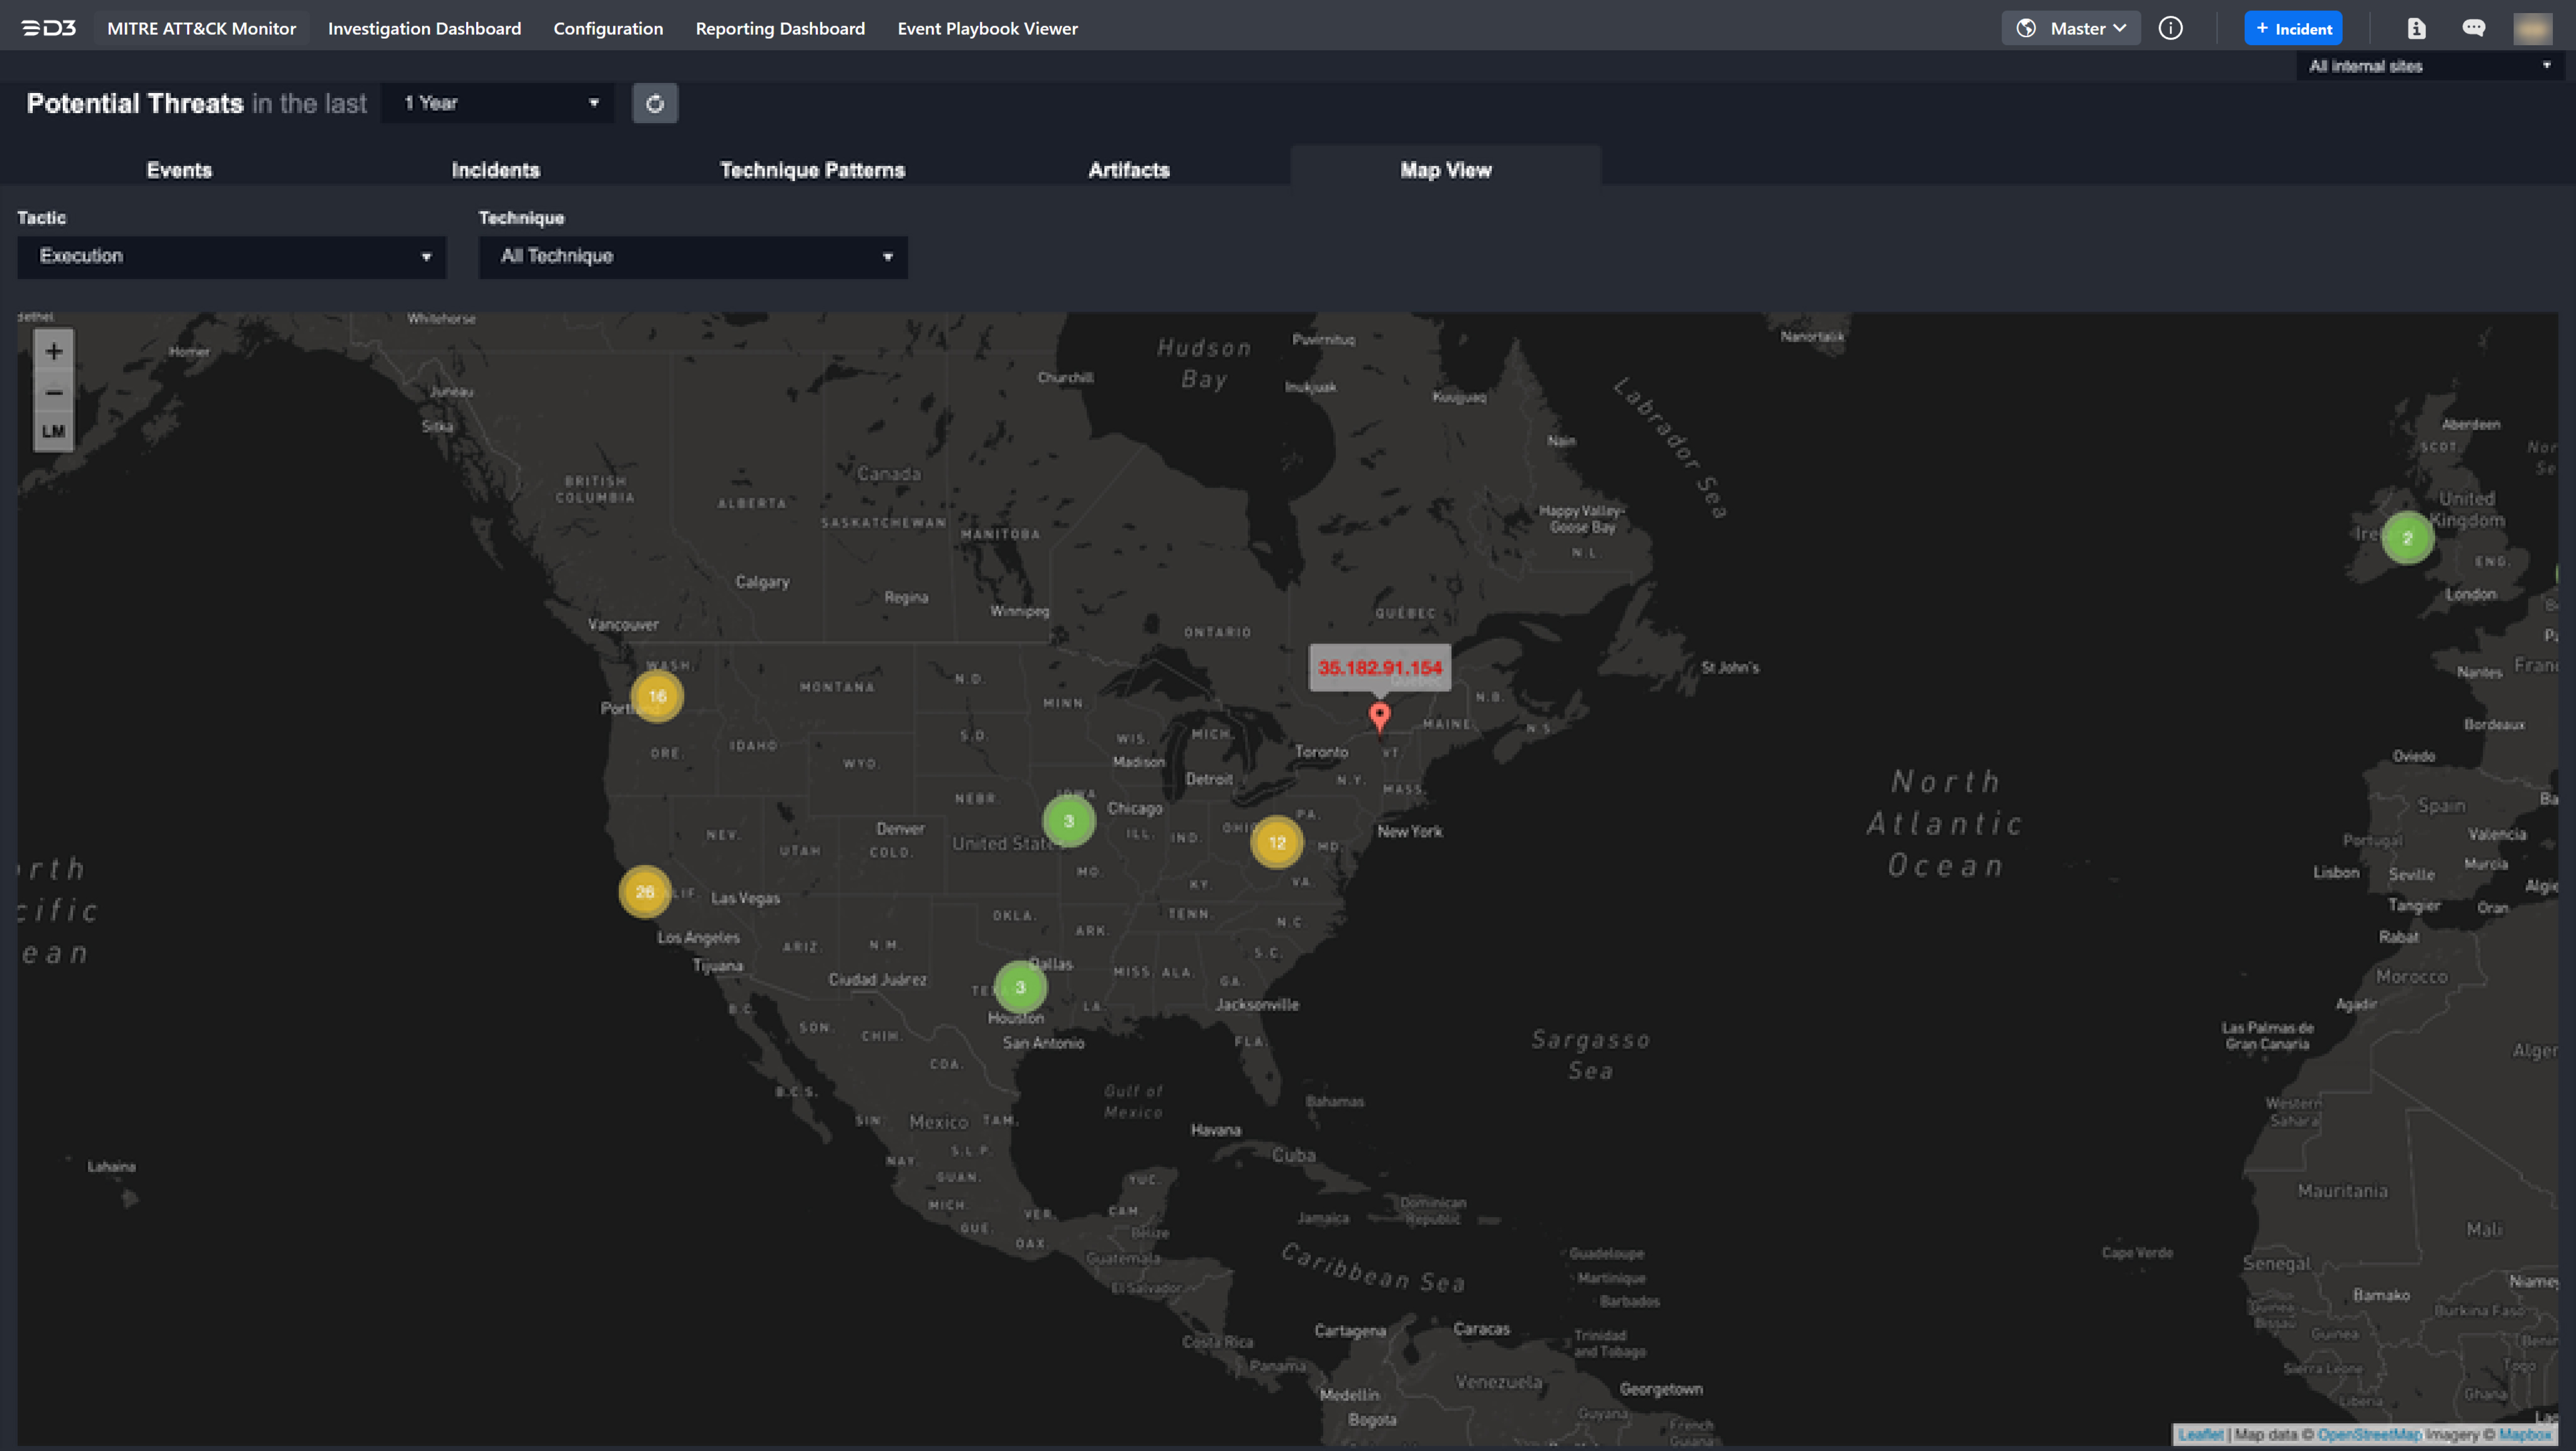
Map View
The Map View tab provides a visual representation of surfaced and high-risk threats. This view allows users to map connections between artifacts and potential adversarial groups by geographic location.
Required Setup
The following conditions must be met in order to have IP and host domains displayed in map view.
-
The required setup includes:
-
ipstack Integration: A connection to the ipstack integration must be established on the target site. For detailed steps, refer to the ipstack integration guide.
-
Field Mappings: Ensure that the field mappings for the data source Fetch Event commands are configured correctly. The IP addresses in the raw data must be linked to the External Endpoint artifact type.
In the field mapping settings for each data source, map the JSON paths of these IP addresses to one of the following default fields: Destination hostname, Destination IP address, Source hostname, Source IP address, Device, Device IP address, Source Device, Source Device IP address, Destination Device and Destination Device IP address. This will link the associated IPs with the External Endpoint artifact type.
-
-
Alerts with IP or host domain information are ingested into D3 as events.
-
With the corresponding field mappings in place, the system automatically checks the IP geolocation in ipstack upon ingesting events from the configured data sources.
READER NOTE *
D3 will first perform an IP geolocation check in the system's cache. If no data is found, it will proceed to check in ipstack, using up the allocated quota.
-
If ipstack returns an IP geolocation, it will be displayed on the map.
READER NOTE *
If ipstack doesn't return any result, the IP or host domain won't be displayed on the map.
Using Map View
The map provides a geographic view of artifacts associated with the built-in External Endpoint artifact type for the selected site. Use the following options to navigate the map view:
-
Selecting a Site: To choose a site, find the dropdown menu positioned at the top-right.
-
Identifying Clusters: Concentrated areas with events or artifacts are marked with highlighted circles. These circles vary in color - green represents low threat density, while red indicates a higher concentration. Yellow serves as an intermediary alert.
-
Zooming In and Out: Use the mouse scroll wheel or the zoom controls on the left side of the map for a closer or broader view.
-
Accessing Detailed Views: Click a pin to open the detailed page for the associated artifact or event.
-
Using Tactic & Technique Filters: Filter displayed artifacts through the Tactic and Technique dropdowns to see those associated with specific MITRE tactics and techniques.
READER NOTE *
To use the MITRE tactics and techniques filter, the artifacts must have the appropriate Tactic or Technique fields mapped. In addition, the Enable MITRE Tactics setting should be active.