Skip table of contents

LogRhythm Axon

Overview

LogRhythm Axon is a cloud-native SIEM platform built for security teams that are stretched thin by overwhelming amounts of data and an ever-evolving threat landscape.

D3 SOAR is providing REST operations to function with LogRhythm Axon.

LogRhythm Axon is available for use in:

D3 SOAR

V16.2+

Category

SIEM XDR

Deployment Options

Option II, Option IV

Connection

To connect to LogRhythm Axon from D3 SOAR, please follow this part to collect the required information below:

Parameter

Description

Example

Server URL

The base API URL of your LogRhythm Axon server. Select the URL corresponding to your geographic location:

For customers in North or South America, use: https://api.na01.prod.boreas.cloud

For European customers, use: https://api.eu01.prod.boreas.cloud

https://api.na01.prod.boreas.cloud

Tenant ID

The tenant ID to authenticate the connection.

l***c

API Key

The API token to authenticate the connection.

lgr******c01

API Version

The version of the API to use for the connection. The default version is v1.

v1

Permission Requirements

All commands can be executed with the Analyst user role as the minimum required permission. Granting the user the Administrator role is optional and not necessary for executing commands.

As LogRhythm Axon is using role-based access control (RBAC), the API access token is generated based on a specific user account and the application. Therefore, the command permissions are inherited from the user account’s role. Users need to configure their user profile from the LogRhythm Axon console for each command in this integration.

Reader Note

LogRhythm Axon’s default user profiles (sorted from the least permissions to the most) are as follows:

  • Analyst

  • Administrator

Custom roles are not supported in LogRhythm Axon. For more information about roles, refer to Roles from LogRhythm's documentation.

Configuring LogRhythm Axon to Work with D3 SOAR

Creating a User With Your Desired Role

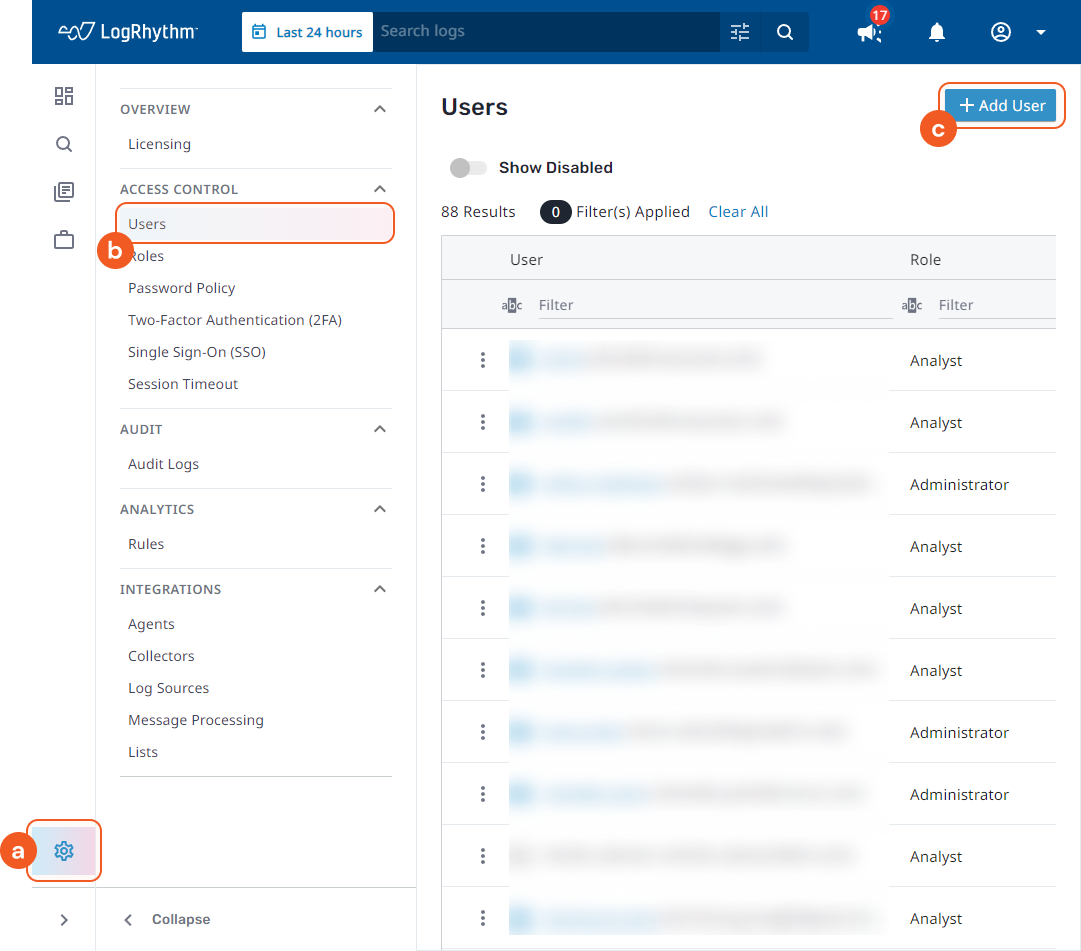
  1. Log in to your admin account and navigate to the Settings section. Click on the Users tab, then select +Add User.

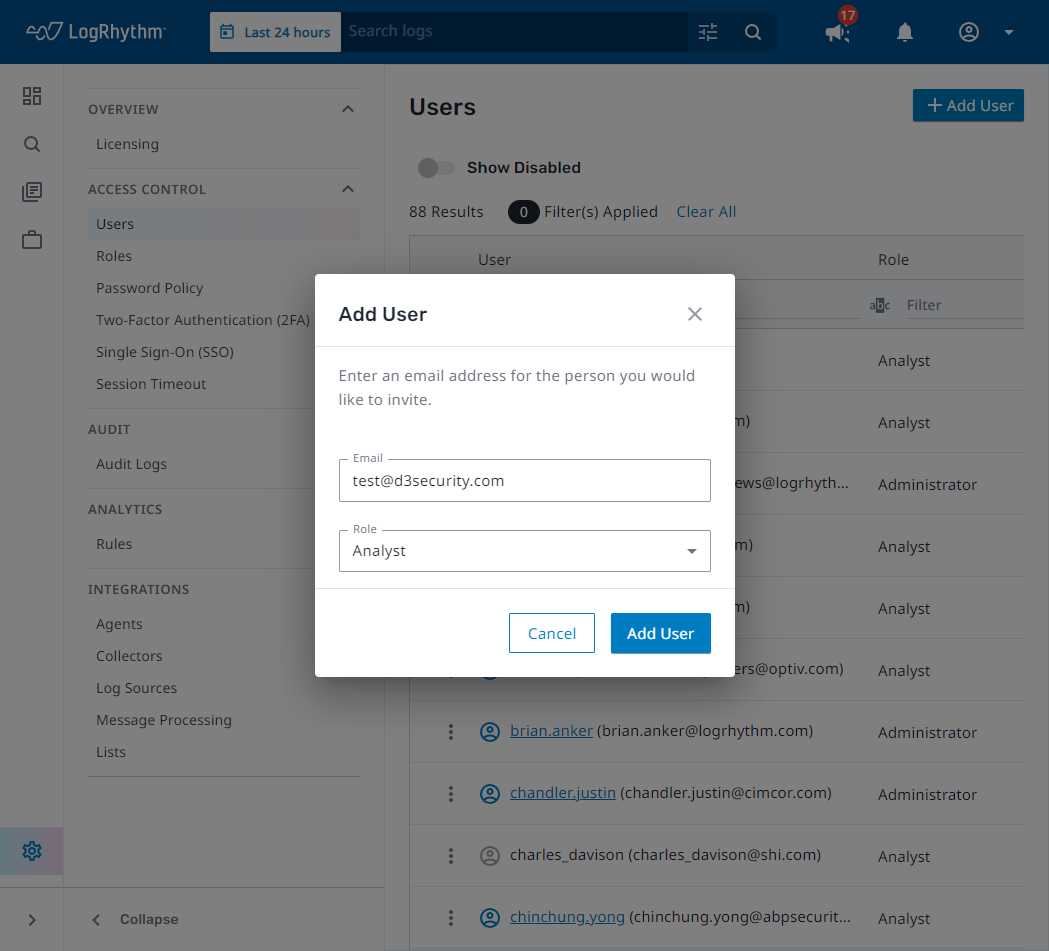
  2. Enter the email address of the new user and assign them a role, with the minimum being "Analyst". Click Add User to proceed.

  3. The new user will receive an invitation via email. They should open the email and click on Accept Invitation. This action will redirect them to a page where they can set up their password and enable Two-Factor Authentication (2FA) for added security.

Generating API Keys

  1. Log in to your new account.

  2. Navigate to My Account under the account section. Here, you'll find information about your current tenant. Go to the API Keys section and select + Add New API Key.

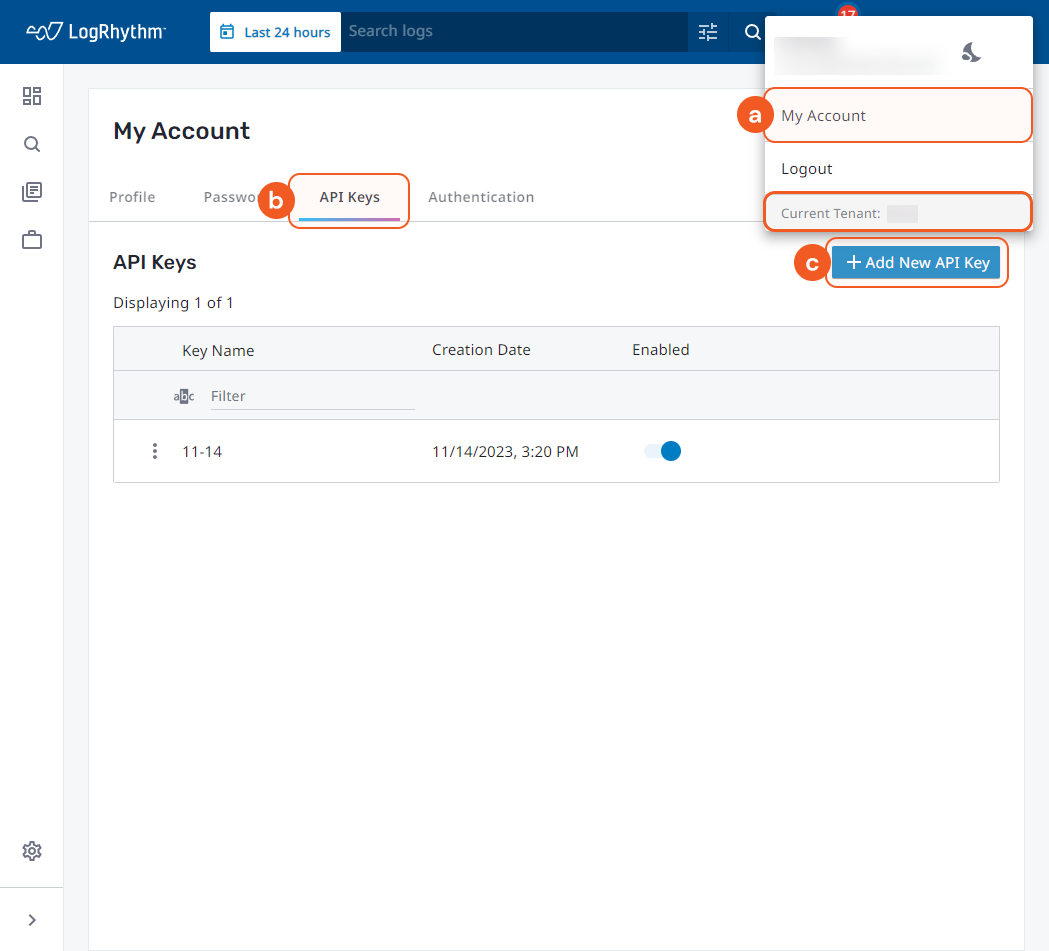
  3. Enter a name for your new API key, then click on Generate Key.

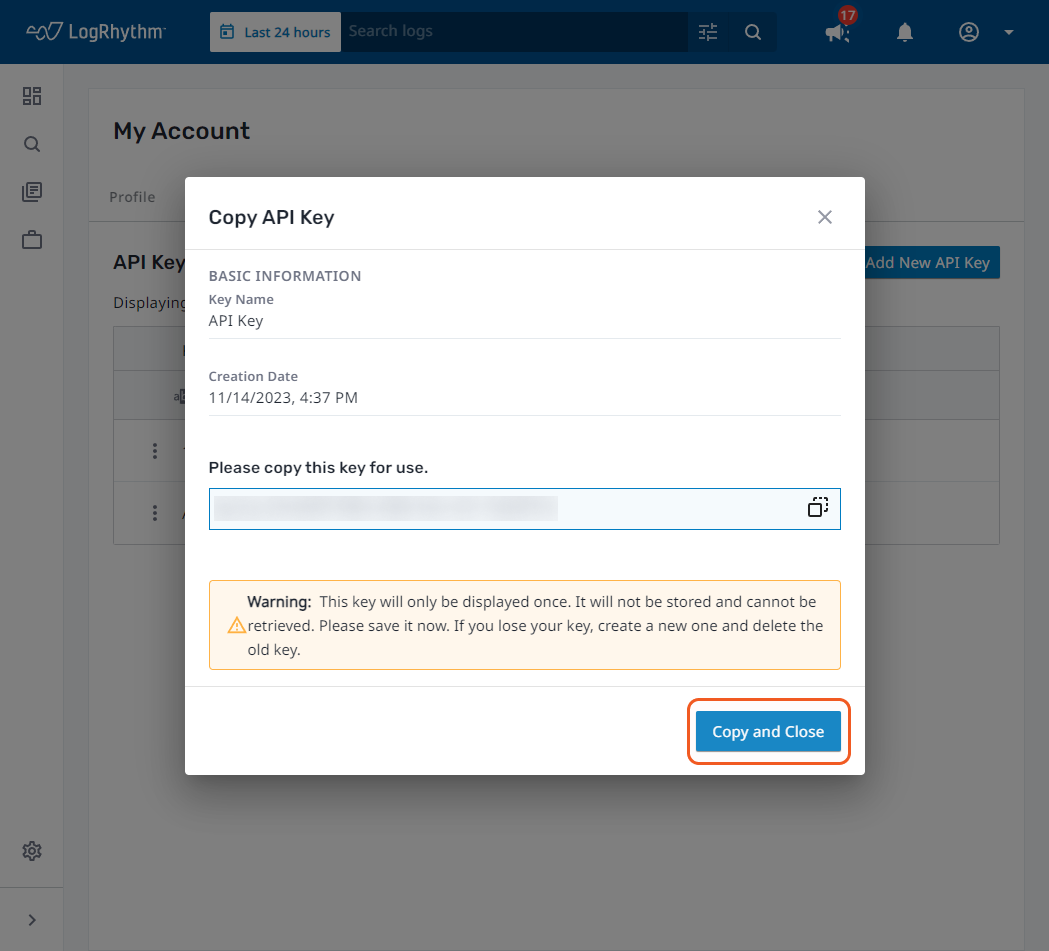
  4. Once the key is generated, copy and save it in a secure location. This is the only opportunity you will have to view this key.

Configuring D3 SOAR to Work with LogRhythm Axon

  1. Log in to D3 SOAR.

  2. Find the LogRhythm Axon integration.

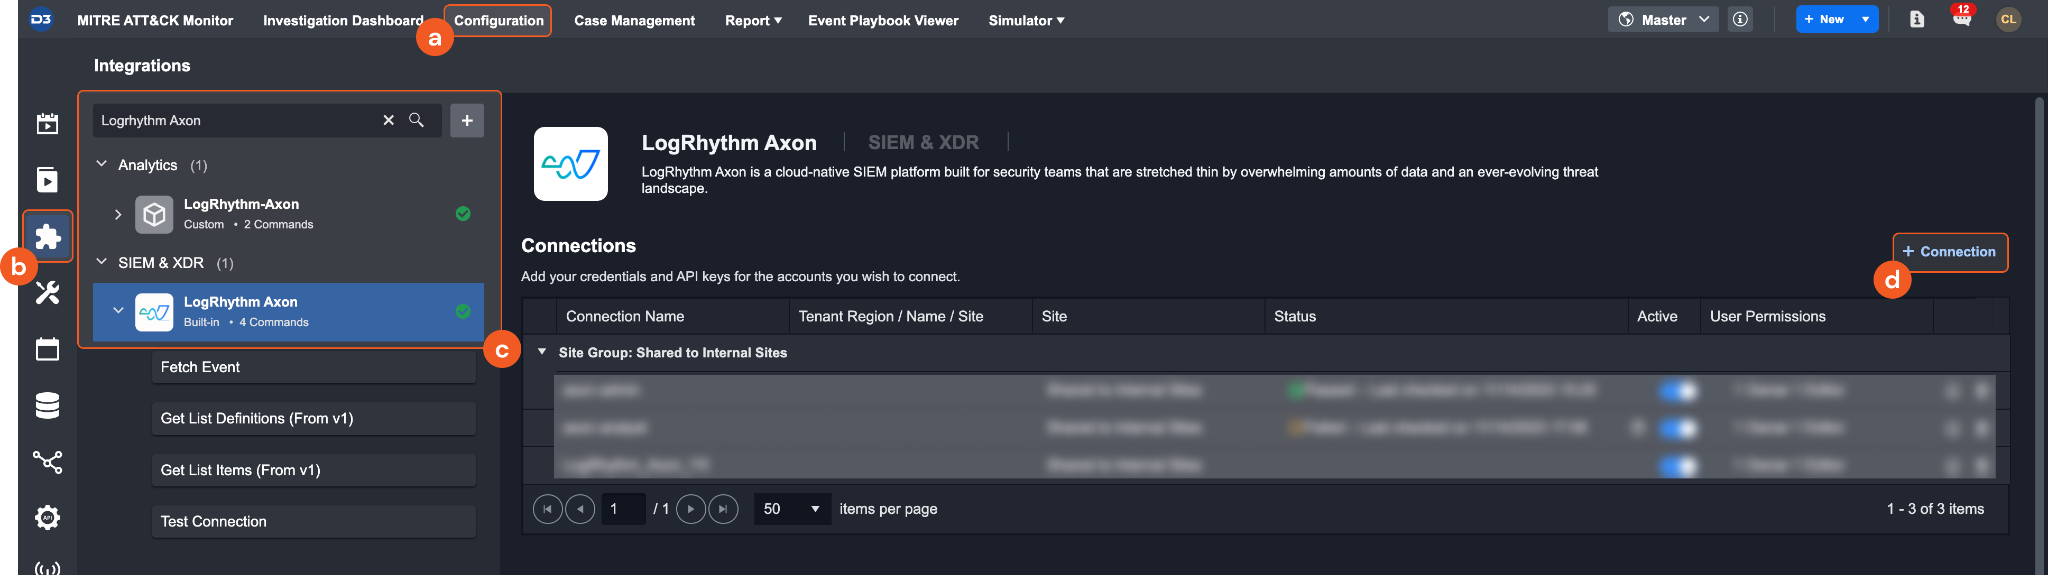
    1. Navigate to Configuration on the top header menu.

    2. Click on the Integration icon on the left sidebar.

    3. Type LogRhythm Axon in the search box to find the integration, then click it to select it.

    4. Click + Connection, on the right side of the Connections section. A new connection window will appear.

  3. Configure the following fields to create a connection to LogRhythm Axon.

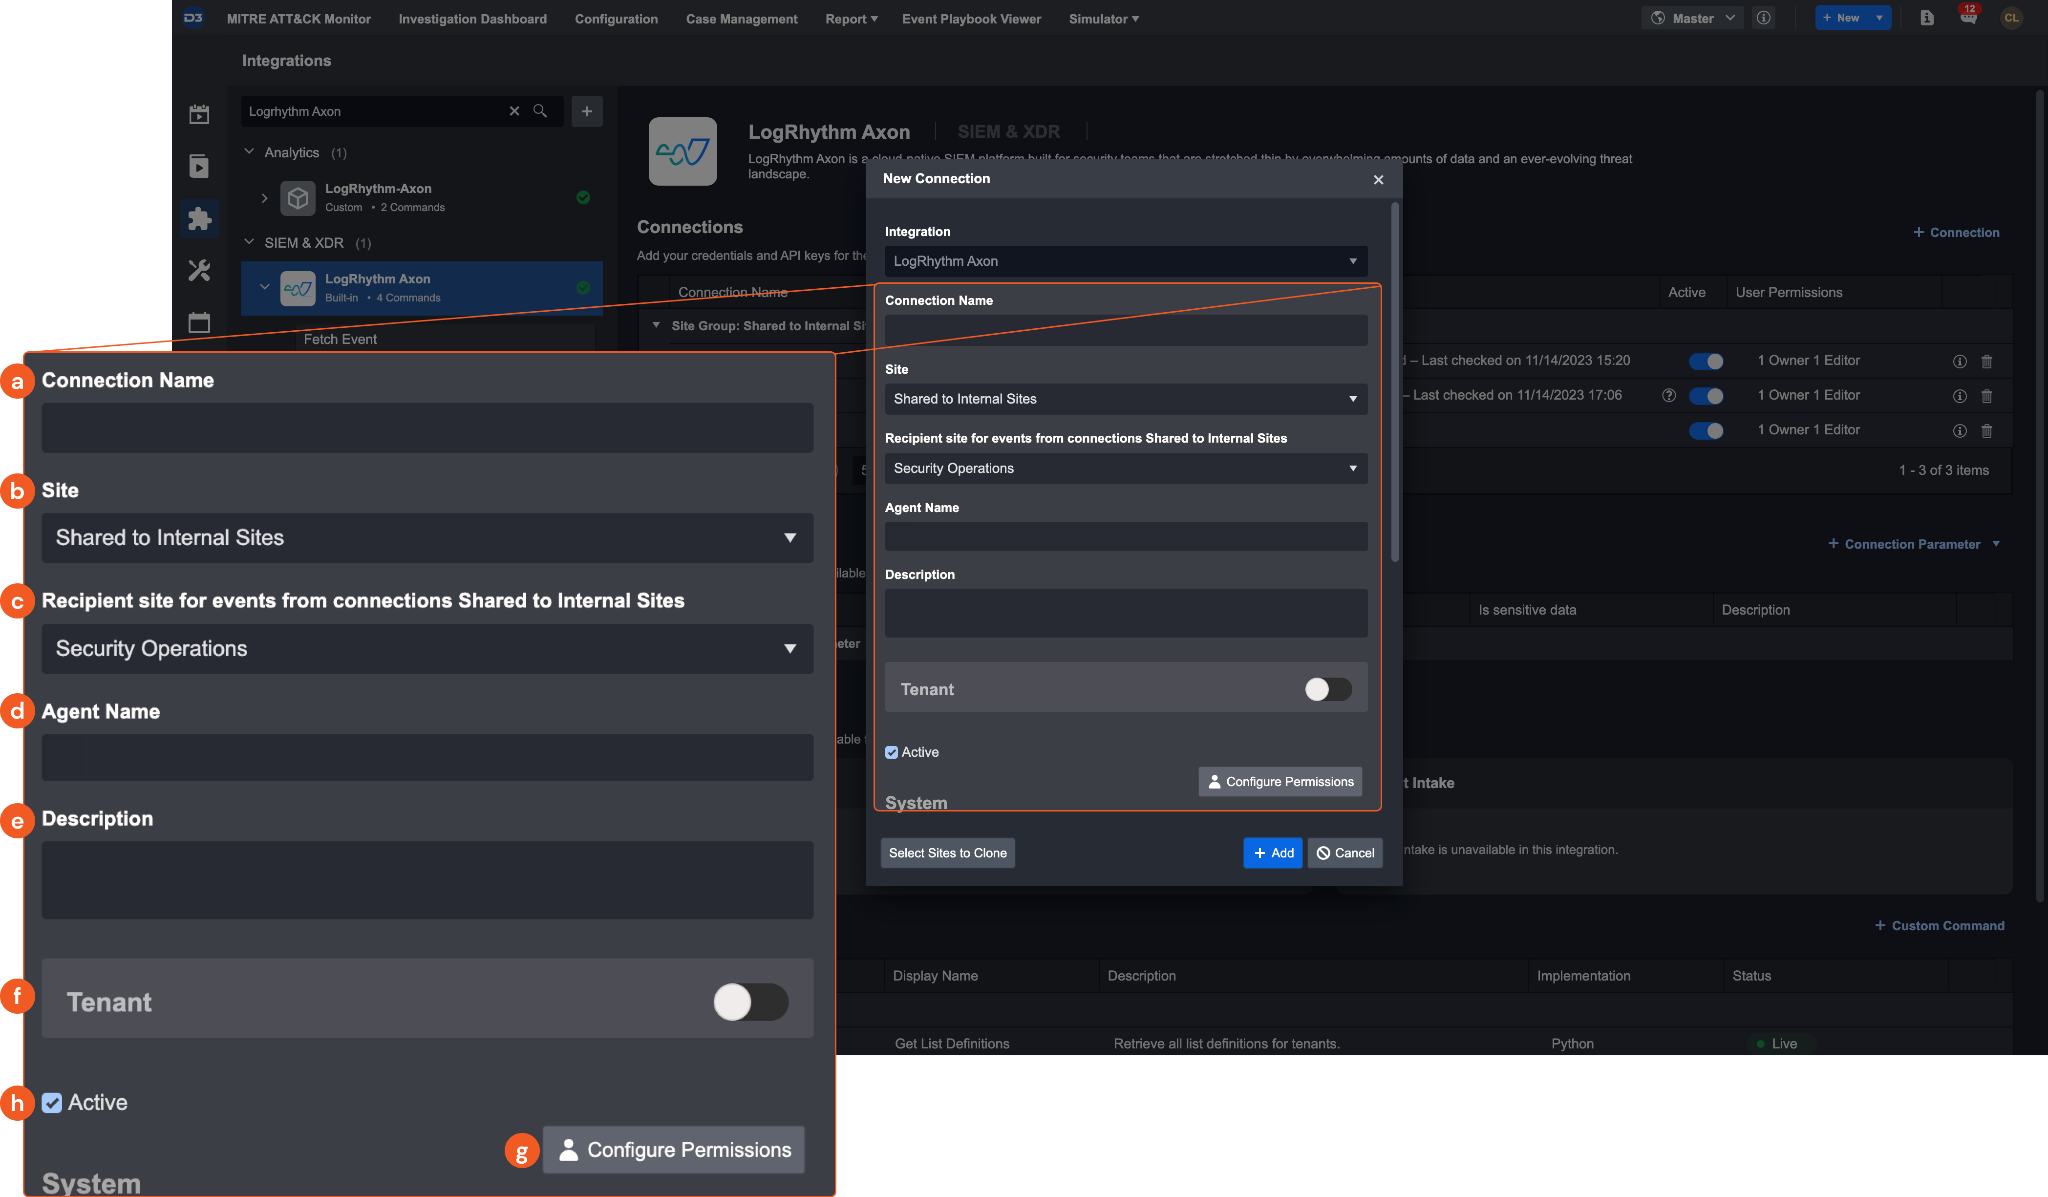
    1. Connection Name: The desired name for the connection.

    2. Site: Specifies the site to use the integration connection. Use the drop-down menu to select the site. The Share to Internal Sites option enables all sites defined as internal sites to use the connection. Selecting a specific site will only enable that site to use the connection.

    3. Recipient site for events from connections Shared to Internal Sites: This field appears if you selected Share to Internal Sites for Site to let you select the internal site to deploy the integration connection.

    4. Agent Name (Optional): Specifies the proxy agent required to build the connection. Use the dropdown menu to select the proxy agent from a list of previously configured proxy agents.

    5. Description (Optional): Add your desired description for the connection.

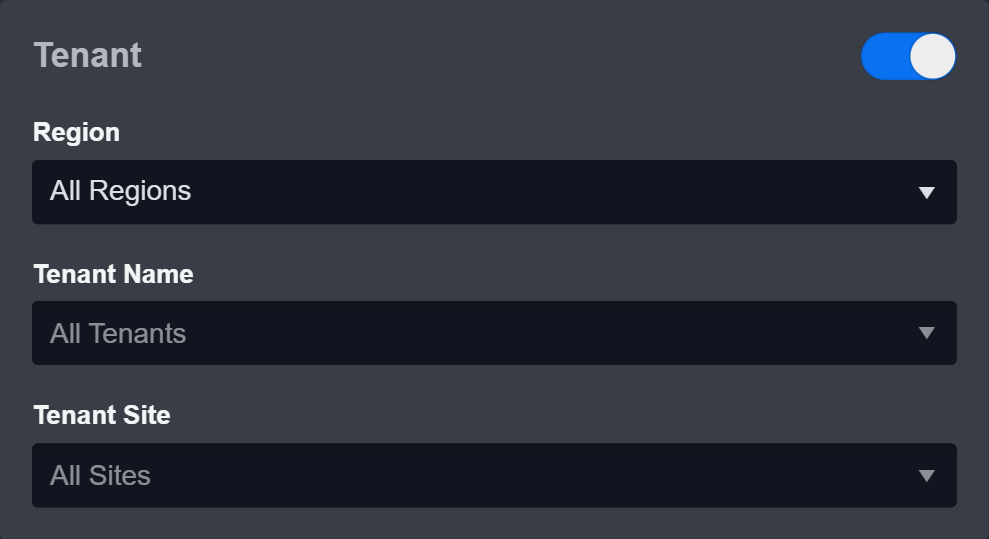
    6. Tenant (Optional): When configuring the connection from a master tenant site, you have the option to choose the specific tenant sites you want to share the connection with. Once you enable this setting, you can filter and select the desired tenant sites from the dropdowns to share the connection.

    7. Configure User Permissions: Defines which users have access to the connection.

    8. Active: Check the tick box to ensure the connection is available for use.

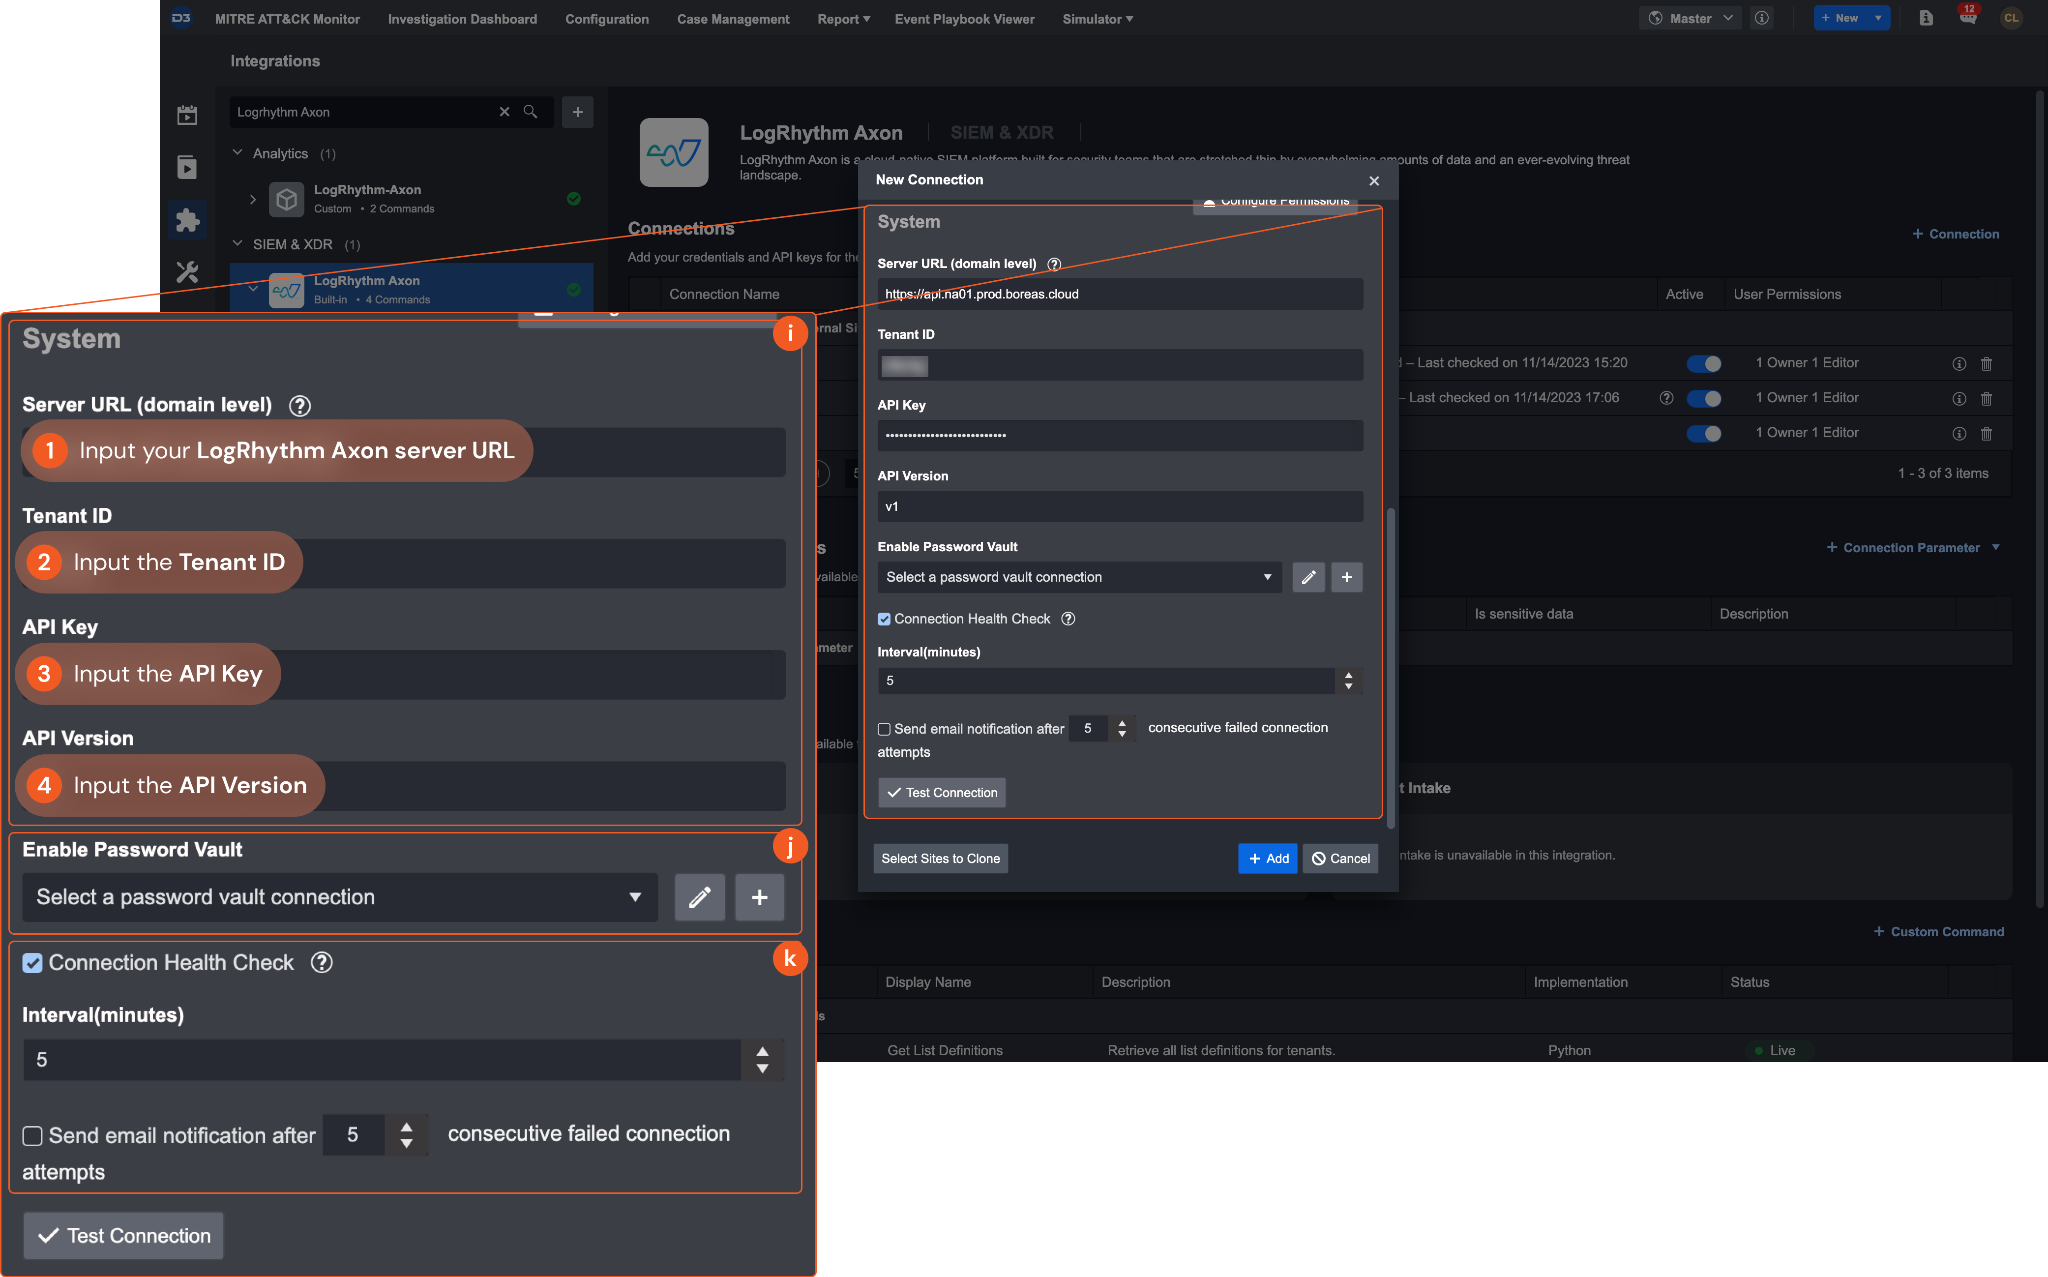
    9. System: This section contains the parameters defined specifically for the integration. These parameters must be configured to create the integration connection.
      1. Input the Server URL of your LogRhythm Axon server. Ensure to enter the appropriate server based on your geographic location. For customers located in North or South America, input https://api.na01.prod.boreas.cloud. If you are a European customer, use https://api.eu01.prod.boreas.cloud instead.
      2. Input the Tenant ID. You can refer to step 2 of Generating API Keys for instructions on obtaining the Tenant ID.
      3. Input the API Key. You can refer to step 4 of Generating API Keys for instructions on obtaining the API Key.
      4. Input the API Version. The default version is v1.

    10. Enable Password Vault: An optional feature that allows users to take the stored credentials from their own password vault. Please refer to the password vault connection guide if needed.

    11. Connection Health Check: Updates the connection status you have created. A connection health check is done by scheduling the Test Connection command of this integration. This can only be done when the connection is active.
      To set up a connection health check, check the Connection Health Check tickbox. You can customize the interval (minutes) for scheduling the health check. An email notification can be set up after a specified number of failed connection attempts.

  4. Test the connection.

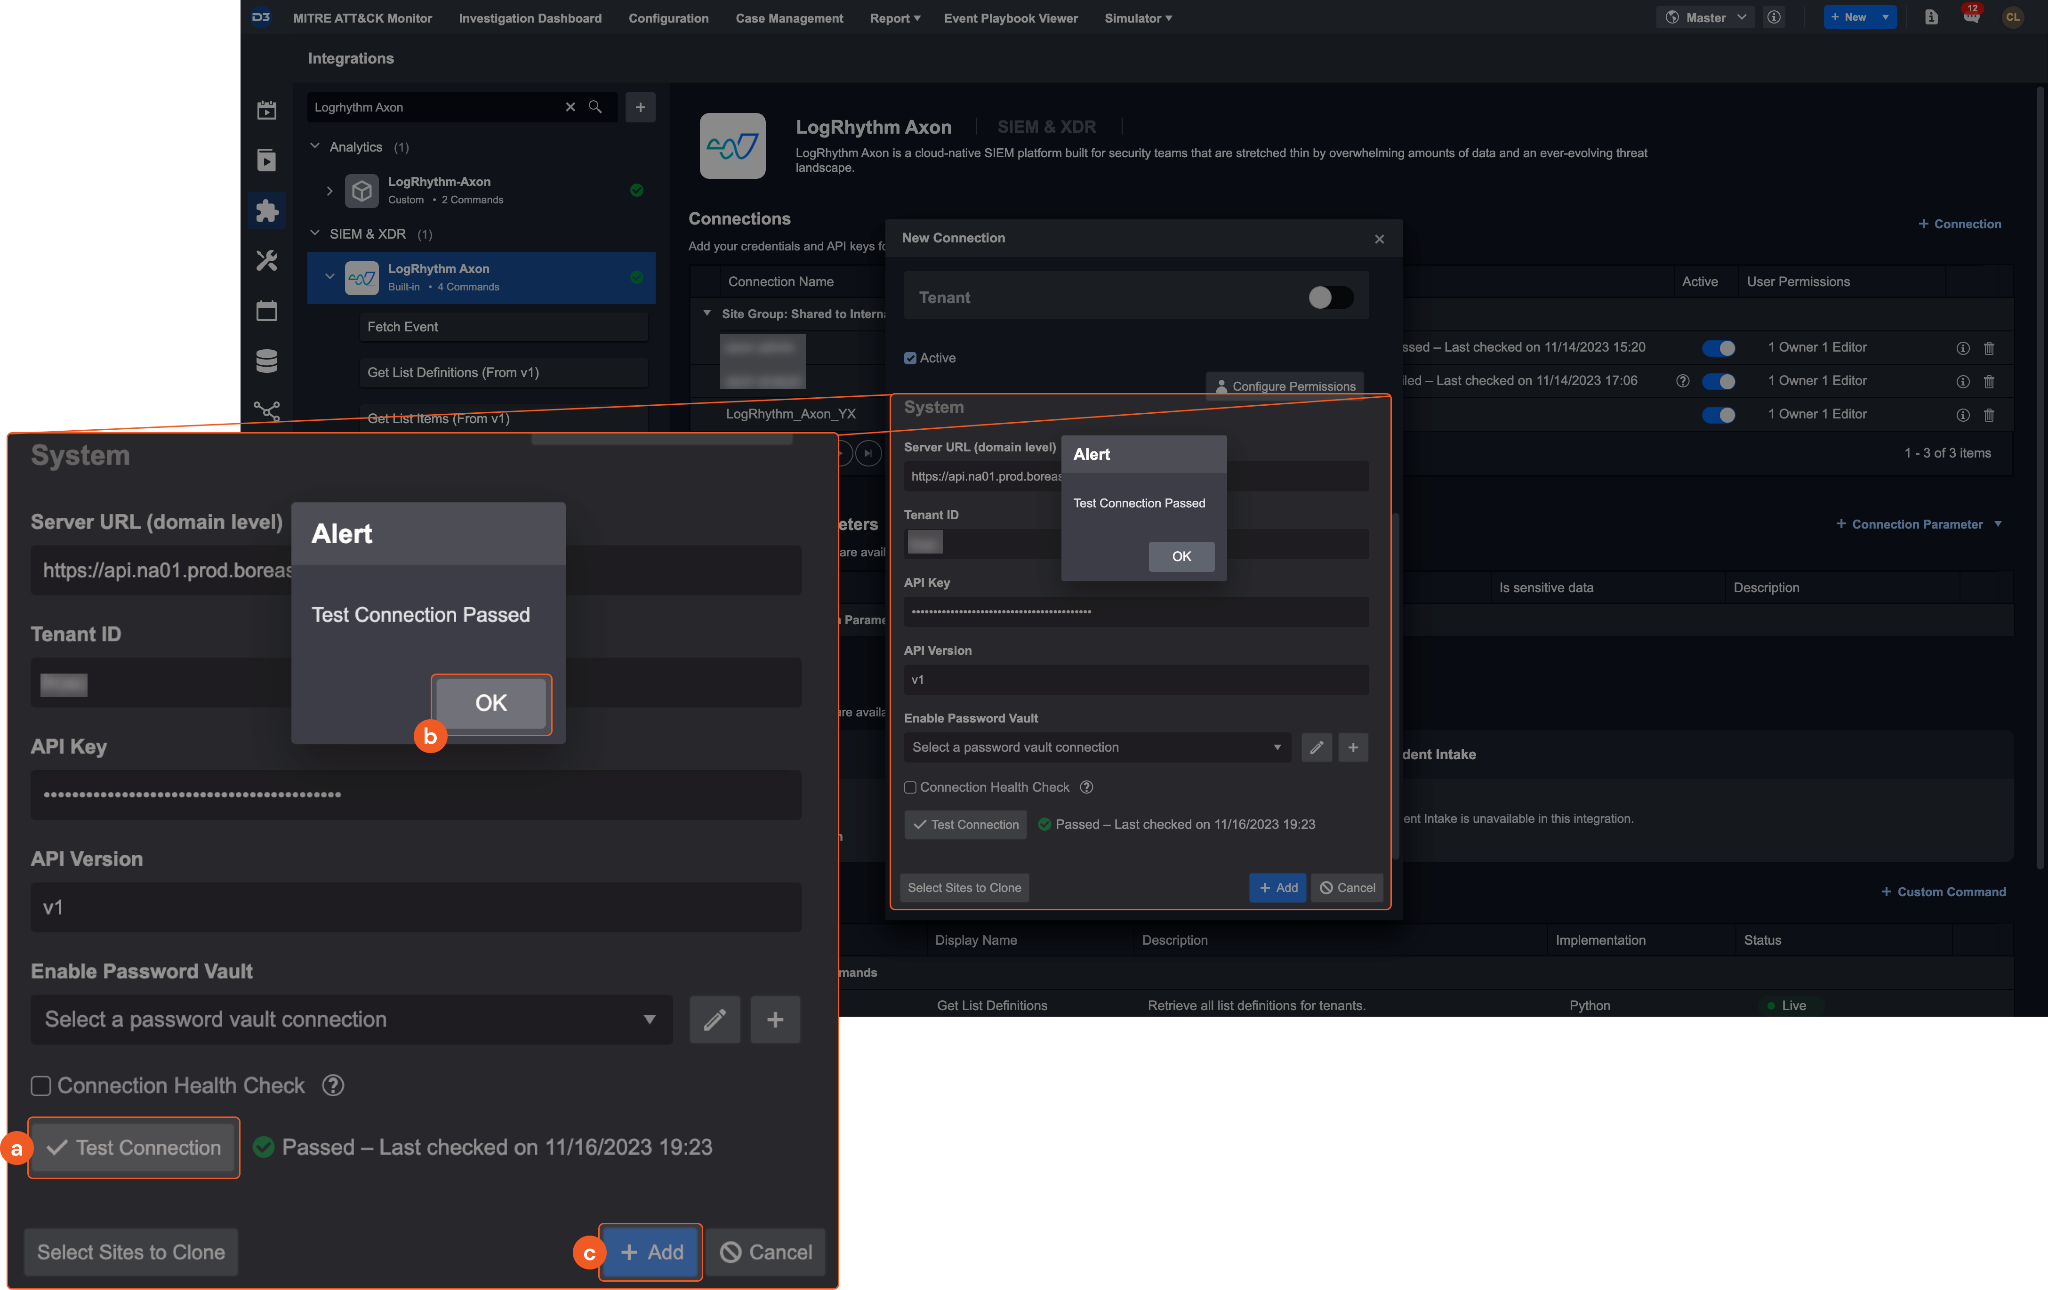
    1. Click Test Connection to verify the account credentials and network connection. If the Test Connection Passed alert window appears, the test connection is successful. You will see Passed with a green checkmark appear beside the Test Connection button. If the test connection fails, please check your connection parameters and try again.

    2. Click OK to close the alert window.

    3. Click + Add to create and add the configured connection.

Commands

LogRhythm Axon includes the following executable commands for users to set up schedules or create playbook workflows. With the Test Command, you can execute these commands independently for playbook troubleshooting.

Integration API Note

For more information about the LogRhythm Axon API, please refer to the LogRhythm Axon API reference.

Reader Note

Certain permissions are required for each command. Please refer to the Permission Requirements and Configuring LogRhythm Axon to Work with D3 SOAR for details.

Note for Time-related parameters

The input format of time-related parameters may vary based on your account settings. As a result, the sample data provided in our commands is different from what you see. To set your preferred time format, follow these steps:

  1. Navigate to Configuration > Application Settings. Select Date/Time Format.

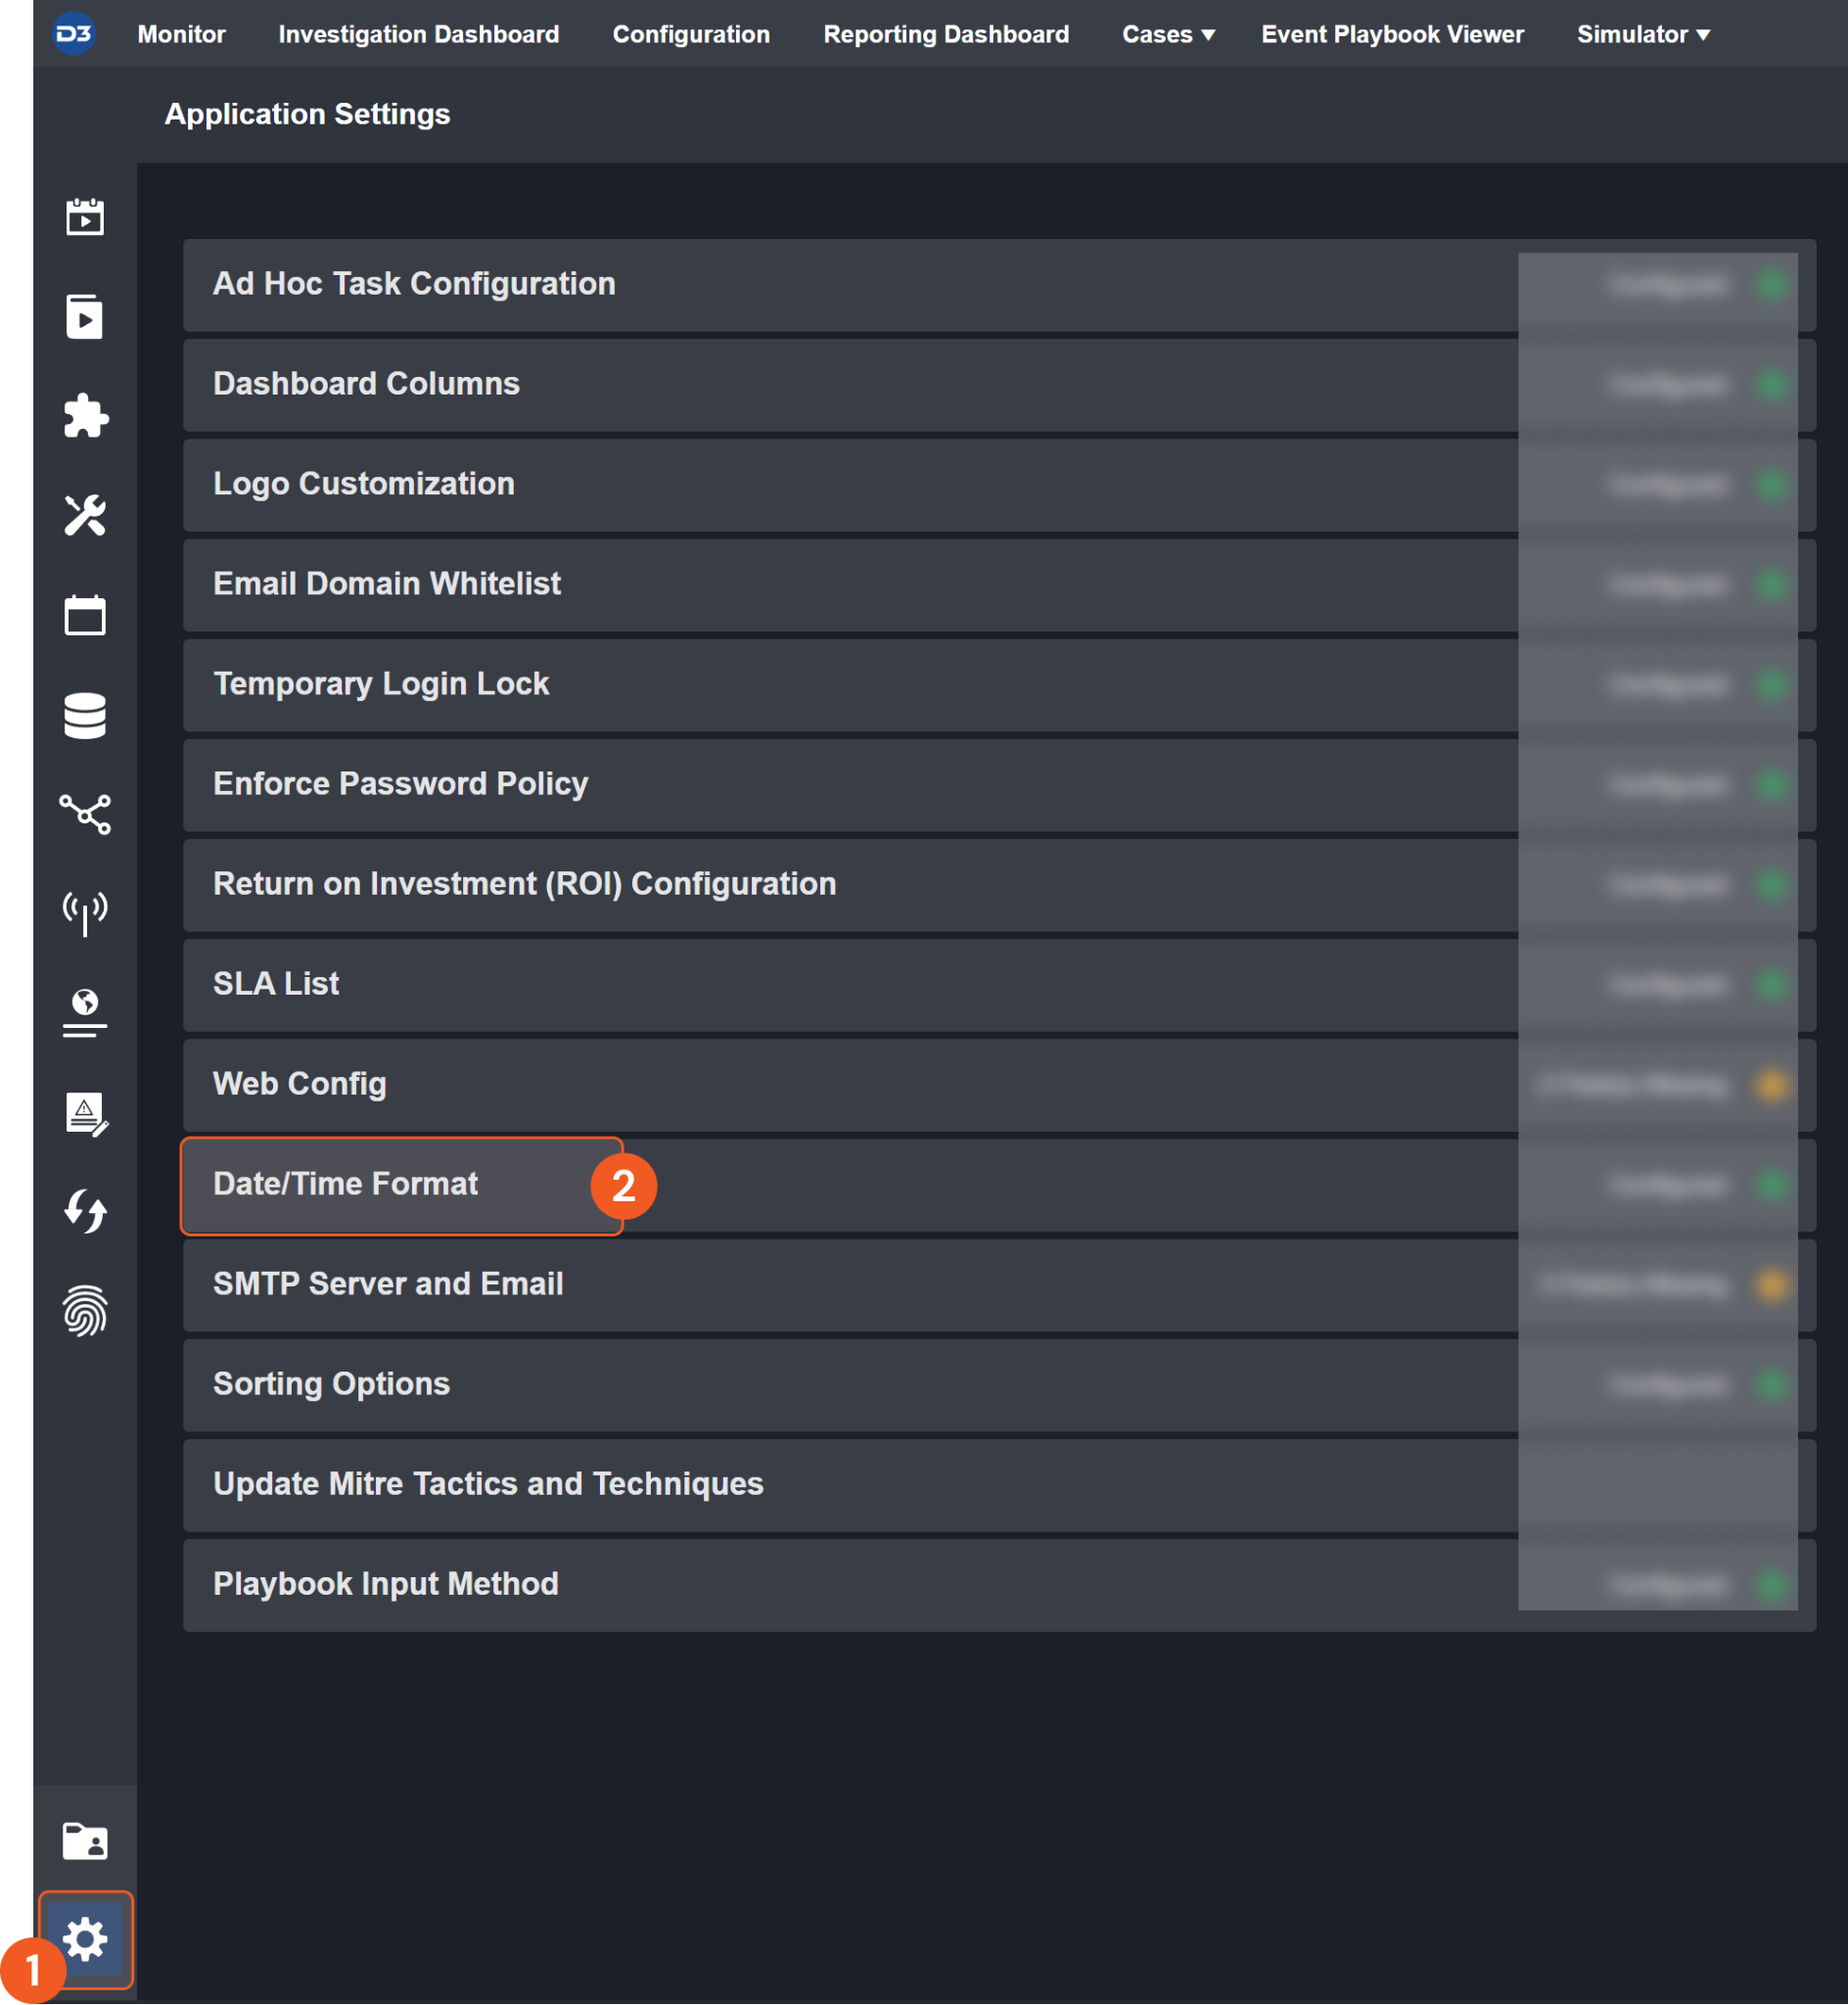
  2. Choose your desired date and time format.

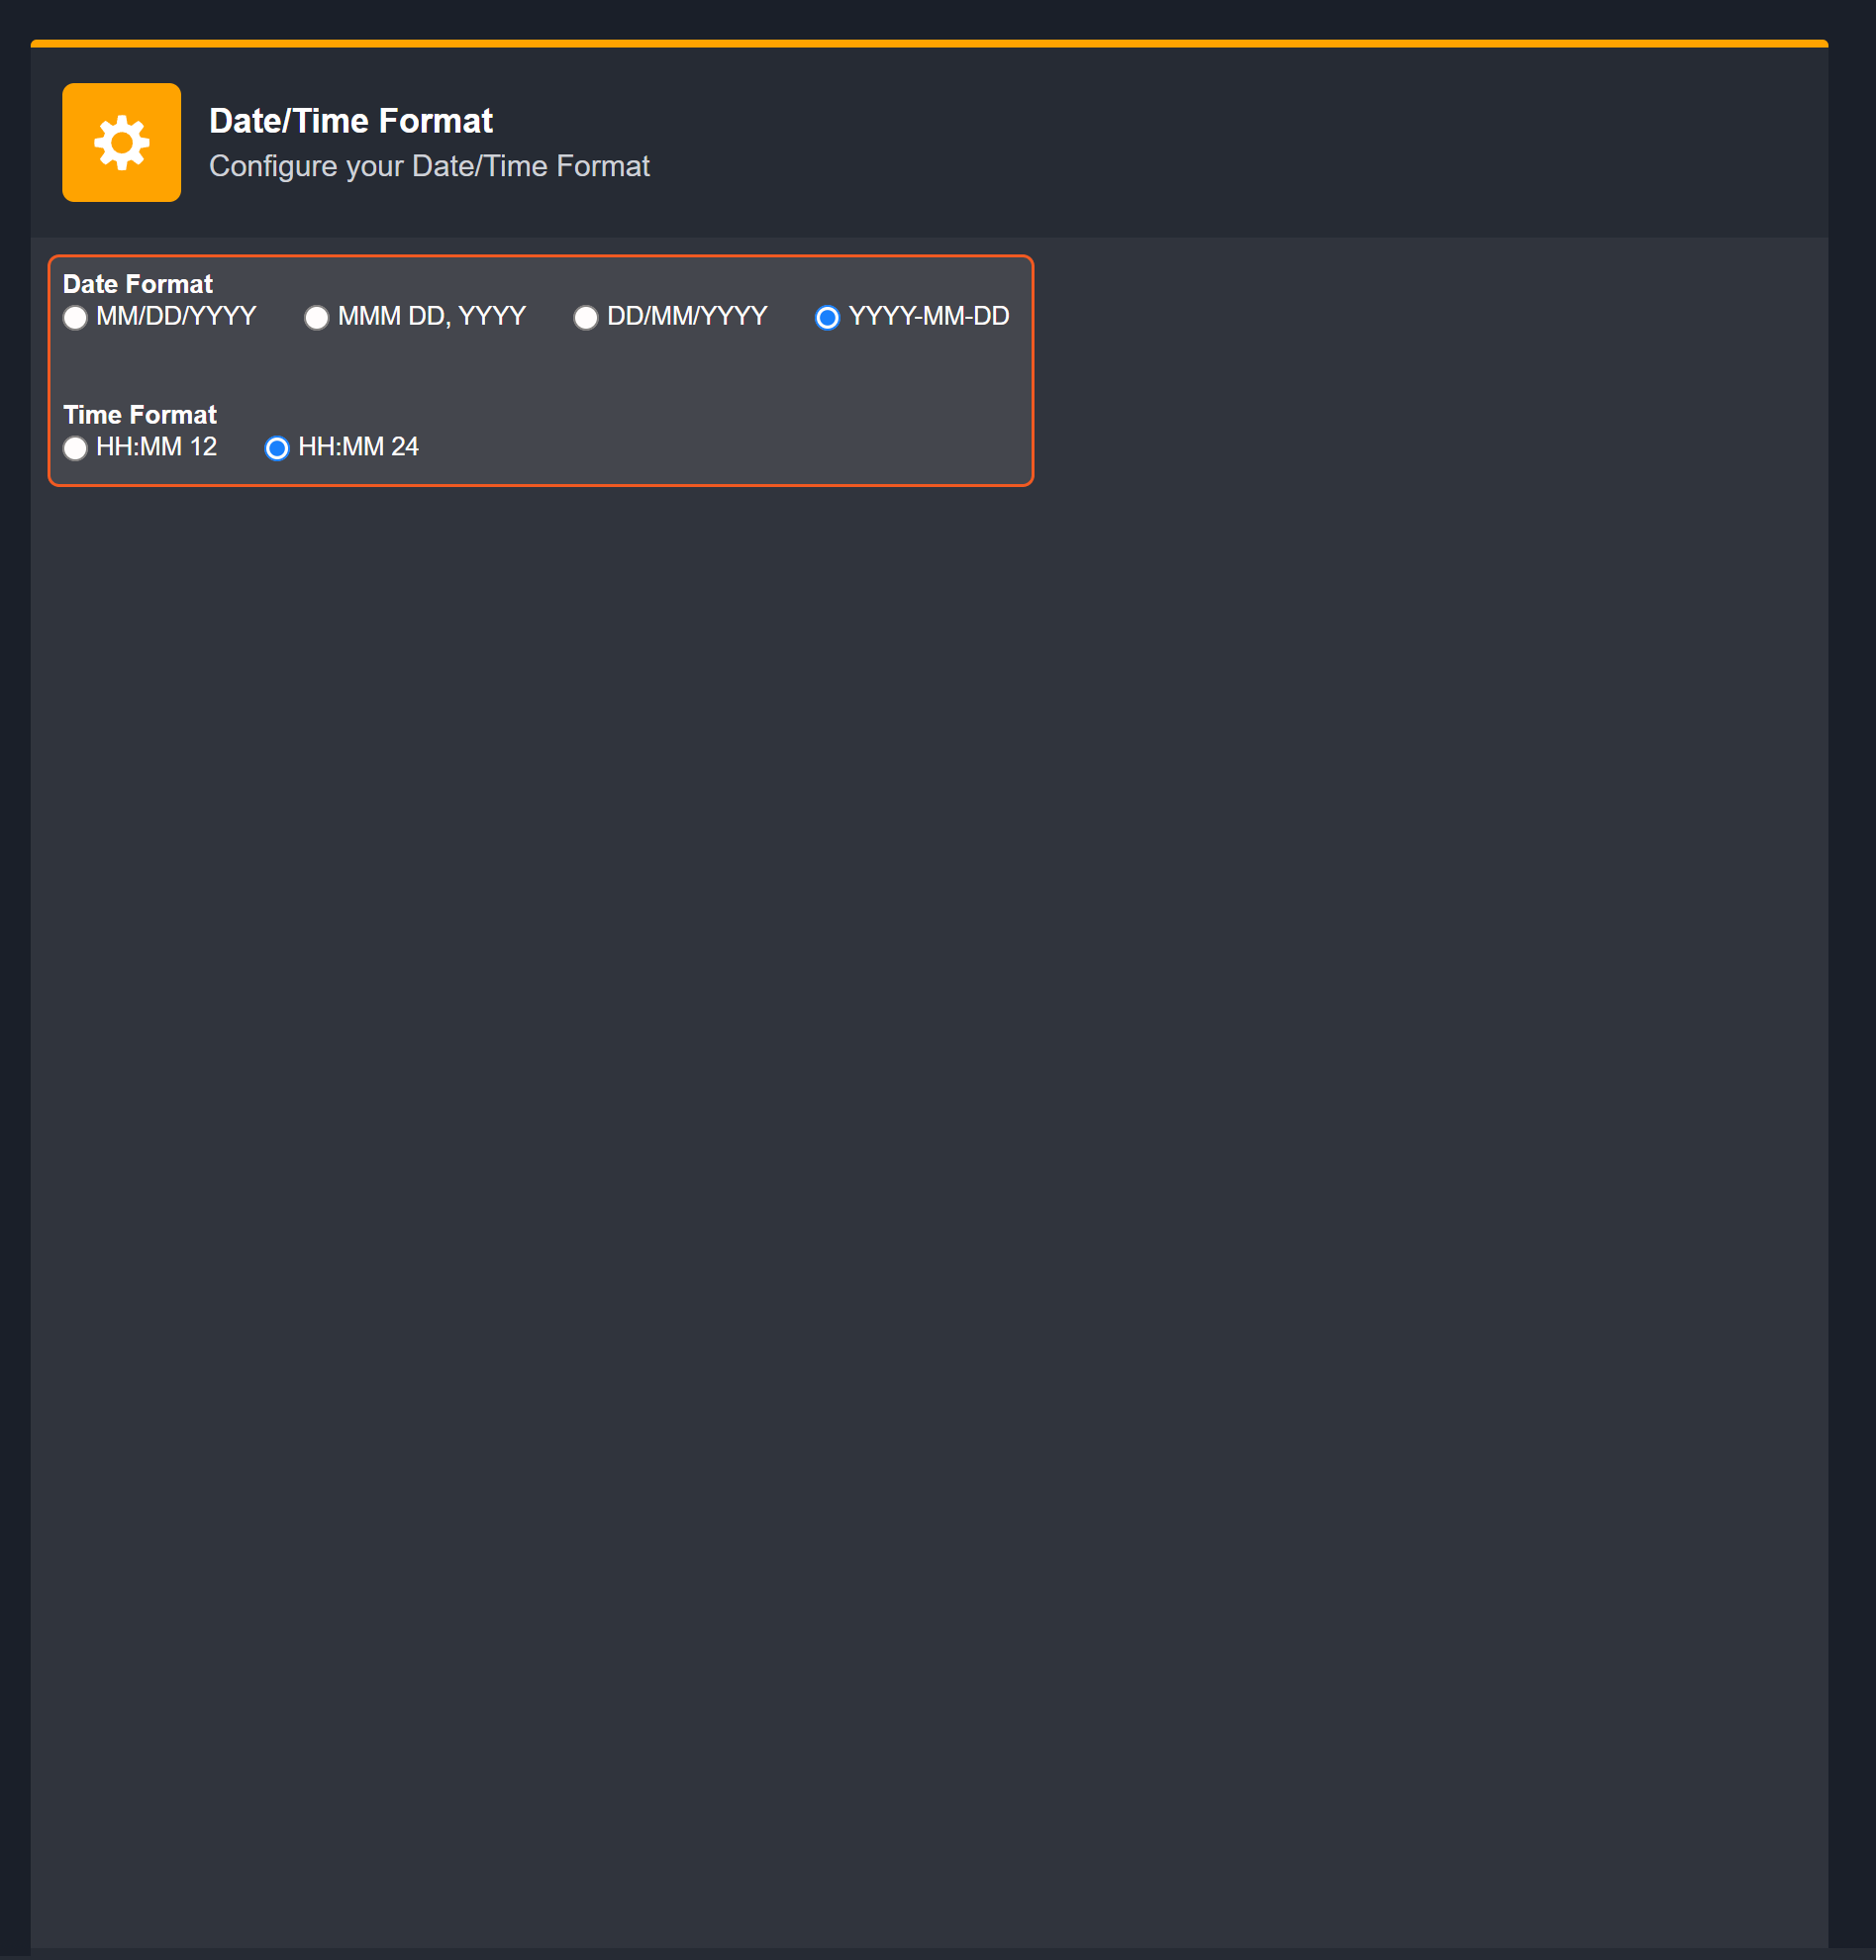
After that, you will be able to view your preferred time format when configuring the DateTime input parameters for commands.

Fetch Event

Returns events from the platform based on specified criteria.

Reader Note

When setting your search parameters, ensure to specify them precisely. Merely defining the start and end time might lead to a timeout, as this can result in an excessive number of events being retrieved.

Input

Input Parameter

Required /Optional

Description

Example

Start Time

Required

The start time of the time range to retrieve events, in UTC format.

2023-01-09 00:00

End Time

Required

The end time of the time range to retrieve events, in UTC format.

2023-01-10 00:00

Number of Event(s) Fetched

Optional

The maximum number of events to return. If this parameter is not defined, the default limit value of 10000 will be applied.

5

Search Conditions

Optional

The query statement to filter results. For more information about the query syntax, refer to https://docs.logrhythm.com/axon/docs/build-a-query.

origin.host.name=\"QA\\SM-*****\"

Output

Raw Data

The primary response data from the API request.

SAMPLE DATA

JSON
{
    "requestId": "*****",
    "status": "OK",
    "computed": {
        "commonEvents": {
            "***-***-***-***-***": "Watchlist Hit",
            "3***-***-***-***-***": "Threat Detection"
        }
    },
    "paginationInfo": {
        "nextPage": "1*****1,11*****1"
    },
    "content": [
        {
            "tenantId": "l*****",
            "id": "kQ_*****",
            "result": {
                "unattributed.hash.sha256": [
                    "3AE****3F"
                ],
                "unattributed.hash.md5": [
                    "*****",
                    "*****"
                ],
                "vendor_information.log_subtype": "THREAT",
                "general_information.log_source.name": "Carbon Black Cloud:SignalReplay:-*****",
                "origin.host.id": "*****",
                "general_information.processing_start_time": "2023-09-01T18:15:00.231738Z",
                "threat.id": "*****",
                "general_information.tenant_id": "l*****",
                "origin.host.name": "QA\\SM-*****",
                "general_information.standard_time_confidence": "high",
                "general_information.transit_path.collector_id": "***-***-***-***-***",
                "general_information.raw_message_size": "1965",
                "general_information.log_source.type_name": "Carbon Black Cloud",
                "general_information.log_source.id": "***-***-***-***-***",
                "object.process.hash.sha256": "******",
                "system.create.nanos": *****,
                "threat.severity": "5",
                "threat.run_status": "RAN",
                "origin.host.os.version": "Windows Server 2016 x64",
                "general_information.transit_path.complete": "[{\"type\":\"SEND\",\"host\":\"SignalReplay\",\"port\":*****,\"reportingService\":\"SignalReplay\",\"protocol\":\"GRPC\",\"timestamp\":\"2023-09-01T18:15:00.192797Z\",\"collectorId\":\"***-***-***-***-***\"},{\"type\":\"RECEIVE\",\"host\":\"SignalIngest\",\"port\":*****,\"reportingService\":\"SignalIngest\",\"protocol\":\"GRPC\",\"timestamp\":\"2023-09-01T18:15:00.200645Z\"}]",
                "general_information.log_source.type_id": "***-***-***-***-***",
                "object.process.name": "java.exe",
                "general_information.raw_message": "{\"reason\":\"Process java.exe was detected by the report \\\" Java.exe Test 1 - Mahendra\\\" in watchlist \\\"Bruce Test Historical Data (Watchlist)\\\"\",\"policy_id\":6525,\"first_event_time\":\"2023-03-29T21:03:14.760Z\",\"threat_id\":\"2365D168F71C929A42ED8EB8C1FF109E\",\"type\":\"WATCHLIST\",\"device_name\":\"QA\\\\SM-*****\",\"threat_indicators\":[{\"sha256\":\"*****\",\"ttps\":[\"***-***-***-***-***\"],\"process_name\":\"java.exe\"}],\"process_guid\":\"***-***-***-***-***\",\"target_value\":\"MEDIUM\",\"process_name\":\"java.exe\",\"document_guid\":\"******\",\"watchlists\":[{\"name\":\"Bruce Test Historical Data (Watchlist)\",\"id\":\"*****\"}],\"id\":\"***-***-***-***-***\",\"alert_classification\":null,\"threat_cause_actor_sha256\":\"*****\",\"threat_cause_actor_md5\":\"*****\",\"ioc_field\":null,\"severity\":5,\"create_time\":\"2023-09-01T18:15:00.192690Z\",\"last_event_time\":\"2023-09-01T18:15:00.192690Z\",\"device_id\":*****,\"workflow\":{\"remediation\":null,\"last_update_time\":\"2023-03-29T21:06:25.972Z\",\"changed_by\":\"ALERT_CREATION\",\"comment\":null,\"state\":\"OPEN\"},\"count\":0,\"policy_name\":\"default\",\"ioc_hit\":\"(process_name:java.exe)\",\"ioc_id\":\"***-***-***-***-***\",\"run_state\":\"RAN\",\"threat_cause_vector\":\"UNKNOWN\",\"device_os\":\"WINDOWS\",\"device_username\":\"test@example.com\",\"tags\":null,\"org_key\":\"*****\",\"last_update_time\":\"2023-03-29T21:06:25.972Z\",\"threat_cause_reputation\":\"TRUSTED_WHITE_LIST\",\"report_id\":\"*****\",\"threat_cause_threat_category\":\"UNKNOWN\",\"legacy_alert_id\":\"***-***-***-***-***\",\"device_os_version\":\"Windows Server 2016 x64\",\"category\":\"THREAT\",\"report_name\":\" Java.exe Test 1 - Mahendra\",\"notes_present\":true,\"threat_cause_actor_name\":\"c:\\\\program files\\\\logrhythm\\\\data indexer\\\\dependencies\\\\jre\\\\bin\\\\java.exe\"}",
                "threat.evidence": "Process java.exe was detected by the report \" Java.exe Test 1 - Mahendra\" in watchlist \"Bruce Test Historical Data (Watchlist)\"",
                "action.state": "OPEN",
                "general_information.common_event": [
                    "***-***-***-***-***",
                    "***-***-***-***-***"
                ],
                "threat.source": "UNKNOWN",
                "object.process.hash.md5": "*****",
                "unattributed.account.email_address": [
                    "test@example.com"
                ],
                "vendor_information.log_generation_time": "2023-09-01T18:15:00.192690Z",
                "object.policy.name": "default",
                "system.create.date": "2023-09-01T18:15:00.691+0000",
                "vendor_information.log_type": "WATCHLIST",
                "general_information.standard_message_time": "2023-09-01T18:15:00.192690Z",
                "general_information.processing_end_time": "2023-09-01T18:15:00.238029Z",
                "origin.host.os.platform": "WINDOWS",
                "object.policy.id": "6525",
                "general_information.message_id": "kQ_*****",
                "general_information.common_event_name": [
                    "Threat Detection",
                    "Watchlist Hit"
                ]
            }
        },
        {
            "tenantId": "l*****",
            "id": "eA_*****p",
            "result": {
                "unattributed.hash.sha256": [
                    "*****"
                ],
                "unattributed.hash.md5": [
                    "*****",
                    "*****"
                ],
                "vendor_information.log_subtype": "THREAT",
                "general_information.log_source.name": "Carbon Black Cloud:SignalReplay:-329267567",
                "origin.host.id": "6360983",
                "general_information.processing_start_time": "2023-09-01T18:15:00.233385Z",
                "threat.id": "*****",
                "general_information.tenant_id": "l*****",
                "origin.host.name": "QA\\SM-*****",
                "general_information.standard_time_confidence": "high",
                "general_information.transit_path.collector_id": "***-***-***-***-***",
                "general_information.raw_message_size": "1998",
                "general_information.log_source.type_name": "Carbon Black Cloud",
                "general_information.log_source.id": "***-***-***-***-***",
                "object.process.hash.sha256": "*****",
                "system.create.nanos": *****,
                "threat.severity": "5",
                "threat.run_status": "RAN",
                "origin.host.os.version": "Windows Server 2016 x64",
                "general_information.transit_path.complete": "[{\"type\":\"SEND\",\"host\":\"SignalReplay\",\"port\":8080,\"reportingService\":\"SignalReplay\",\"protocol\":\"GRPC\",\"timestamp\":\"2023-09-01T18:15:00.192797Z\",\"collectorId\":\"3cffa9f1-254d-4b8e-b8ef-c3e68703be89\"},{\"type\":\"RECEIVE\",\"host\":\"SignalIngest\",\"port\":*****,\"reportingService\":\"SignalIngest\",\"protocol\":\"GRPC\",\"timestamp\":\"2023-09-01T18:15:00.200645Z\"}]",
                "general_information.log_source.type_id": "***-***-***-***-***",
                "object.process.name": "java.exe",
                "general_information.raw_message": "{\"reason\":\"Process java.exe was detected by the report \\\" Java.exe Test 1 - Mahendra\\\" in watchlist \\\"Bruce Test Historical Data (Watchlist)\\\"\",\"policy_id\":6525,\"first_event_time\":\"2023-03-29T20:16:19.608Z\",\"threat_id\":\"*****\",\"type\":\"WATCHLIST\",\"device_name\":\"QA\\\\SM-2K16\",\"threat_indicators\":[{\"sha256\":\"*****\",\"ttps\":[\"***-***-***-***-***\"],\"process_name\":\"java.exe\"}],\"process_guid\":\"***-***-***-***-***\",\"target_value\":\"MEDIUM\",\"process_name\":\"java.exe\",\"document_guid\":\"-wdN4-*****\",\"watchlists\":[{\"name\":\"Bruce Test Historical Data (Watchlist)\",\"id\":\"*****\"}],\"id\":\"***-***-***-***-***\",\"alert_classification\":null,\"threat_cause_actor_sha256\":\"*****\",\"threat_cause_actor_md5\":\"*****\",\"ioc_field\":null,\"severity\":5,\"create_time\":\"2023-09-01T18:15:00.192555Z\",\"last_event_time\":\"2023-09-01T18:15:00.192555Z\",\"device_id\":*****,\"workflow\":{\"remediation\":null,\"last_update_time\":\"2023-03-29T20:20:48.621Z\",\"changed_by\":\"ALERT_CREATION\",\"comment\":null,\"state\":\"OPEN\"},\"count\":0,\"policy_name\":\"default\",\"ioc_hit\":\"(process_name:java.exe)\",\"ioc_id\":\"***-***-***-***-***\",\"run_state\":\"RAN\",\"threat_cause_vector\":\"UNKNOWN\",\"device_os\":\"WINDOWS\",\"device_username\":\"test@example.com\",\"tags\":null,\"org_key\":\"*****\",\"last_update_time\":\"2023-03-29T20:20:48.621Z\",\"threat_cause_reputation\":\"TRUSTED_WHITE_LIST\",\"report_id\":\"*****\",\"threat_cause_threat_category\":\"UNKNOWN\",\"legacy_alert_id\":\"***-***-***-***-***\",\"device_os_version\":\"Windows Server 2016 x64\",\"category\":\"THREAT\",\"report_name\":\" Java.exe Test 1 - *****\",\"notes_present\":true,\"threat_cause_actor_name\":\"c:\\\\program files\\\\logrhythm\\\\logrhythm web services\\\\logrhythm web indexer\\\\dependencies\\\\jre\\\\bin\\\\java.exe\"}",
                "threat.evidence": "Process java.exe was detected by the report \" Java.exe Test 1 - Mahendra\" in watchlist \"Bruce Test Historical Data (Watchlist)\"",
                "action.state": "OPEN",
                "general_information.common_event": [
                    "***-***-***-***-***",
                    "***-***-***-***-***"
                ],
                "threat.source": "UNKNOWN",
                "object.process.hash.md5": "*****",
                "unattributed.account.email_address": [
                    "test@example.com"
                ],
                "vendor_information.log_generation_time": "2023-09-01T18:15:00.192555Z",
                "object.policy.name": "default",
                "system.create.date": "2023-09-01T18:15:00.692+0000",
                "vendor_information.log_type": "WATCHLIST",
                "general_information.standard_message_time": "2023-09-01T18:15:00.192555Z",
                "general_information.processing_end_time": "2023-09-01T18:15:00.235197Z",
                "origin.host.os.platform": "WINDOWS",
                "object.policy.id": "6525",
                "general_information.message_id": "eA_*****",
                "general_information.common_event_name": [
                    "Threat Detection",
                    "Watchlist Hit"
                ]
            }
        }
    ],
    "count": {
        "qualifier": "eq",
        "value": 58
    },
    "took": 26,
    "aggregationBatchResponse": {
        "aggregationResponses": []
    }
}
Key Fields

Common cyber security indicators such as unique IDs, file hash values, CVE numbers, IP addresses, etc., will be extracted from Raw Data as Key Fields.
The system stores these key fields in the path $.[playbookTask].outputData. You can use these key-value pairs as data points for playbook task inputs.

SAMPLE DATA

CODE
{
    "IDs": "\"[\\r\\n\\\"kQ_*****\\\",\\r\\n\\\"eA_*****\\\",\\r\\n\\\"hA_*****\\\"\\r\\n]\""
}
Return Data

Indicates one of the possible command execution states: Successful or Failed.

The Failed state can be triggered by any of the following errors:

  • A connection issue with the integration

  • The API returned an error message

  • No response from the API

You can view more details about an error in the Error tab.

Return Data can be passed down directly to a subsequent command or used to create conditional tasks in playbooks.

SAMPLE DATA

CODE
Successful
Result

Provides a brief summary of outputs in an HTML formatted table.

SAMPLE DATA

requestId

b*****b9

status

OK

computed

{'commonEvents': {'***-***-***-***-***3': 'Watchlist Hit', '***-***-***-***-***': 'Threat Detection'}}

paginationInfo

{'nextPage': '*****,*****'}

content

  • {'tenantId': 'lrcxc', 'id': 'kQ_*****', 'result': {'unattributed.hash.sha256': ['*****'], 'unattributed.hash.md5': ['****', '*****'], 'vendor_information.log_subtype': 'THREAT', 'general_information.log_source.name': 'Carbon Black Cloud:SignalReplay:-*****', 'origin.host.id': '*****', 'general_information.processing_start_time': '2023-09-01T18:15:00.231738Z', 'threat.id': '*****', 'general_information.tenant_id': 'l******', 'origin.host.name': 'QA\\SM-*****', 'general_information.standard_time_confidence': 'high', 'general_information.transit_path.collector_id': '***-***-***-***-***', 'general_information.raw_message_size': '1965', 'general_information.log_source.type_name': 'Carbon Black Cloud', 'general_information.log_source.id': '***-***-***-***-***', 'object.process.hash.sha256': '*****', 'system.create.nanos': *****, 'threat.severity': '5', 'threat.run_status': 'RAN', 'origin.host.os.version': 'Windows Server 2016 x64', 'general_information.transit_path.complete': '[{"type":"SEND","host":"SignalReplay","port":8080,"reportingService":"SignalReplay","protocol":"GRPC","timestamp":"2023-09-01T18:15:00.192797Z","collectorId":"***-***-***-***-***"},{"type":"RECEIVE","host":"SignalIngest","port":5050,"reportingService":"SignalIngest","protocol":"GRPC","timestamp":"2023-09-01T18:15:00.200645Z"}]', 'general_information.log_source.type_id': '***-***-***-***-***', 'object.process.name': 'java.exe', 'general_information.raw_message': '{"reason":"Process java.exe was detected by the report \\" Java.exe Test 1 - *****\\" in watchlist \\"Bruce Test Historical Data (Watchlist)\\"","policy_id":*****,"first_event_time":"2023-03-29T21:03:14.760Z","threat_id":"*****","type":"WATCHLIST","device_name":"QA\\\\SM-*****","threat_indicators":[{"sha256":"*****","ttps":["***-***-***-***-***"],"process_name":"java.exe"}],"process_guid":"7***-***-***-***-***","target_value":"MEDIUM","process_name":"java.exe","document_guid":"*****","watchlists":[{"name":"Bruce Test Historical Data (Watchlist)","id":"****"}],"id":"***-***-***-***-***","alert_classification":null,"threat_cause_actor_sha256":"*****","threat_cause_actor_md5":"*****","ioc_field":null,"severity":5,"create_time":"2023-09-01T18:15:00.192690Z","last_event_time":"2023-09-01T18:15:00.192690Z","device_id":*****,"workflow":{"remediation":null,"last_update_time":"2023-03-29T21:06:25.972Z","changed_by":"ALERT_CREATION","comment":null,"state":"OPEN"},"count":0,"policy_name":"default","ioc_hit":"(process_name:java.exe)","ioc_id":"***-***-***-***-***","run_state":"RAN","threat_cause_vector":"UNKNOWN","device_os":"WINDOWS","device_username":"test@example.com","tags":null,"org_key":"7DESJ9GN","last_update_time":"2023-03-29T21:06:25.972Z","threat_cause_reputation":"TRUSTED_WHITE_LIST","report_id":"*****","threat_cause_threat_category":"UNKNOWN","legacy_alert_id":"***-***-***-***-***","device_os_version":"Windows Server 2016 x64","category":"THREAT","report_name":" Java.exe Test 1 - *****","notes_present":true,"threat_cause_actor_name":"c:\\\\program files\\\\logrhythm\\\\data indexer\\\\dependencies\\\\jre\\\\bin\\\\java.exe"}', 'threat.evidence': 'Process java.exe was detected by the report " Java.exe Test 1 - Mahendra" in watchlist "Bruce Test Historical Data (Watchlist)"', 'action.state': 'OPEN', 'general_information.common_event': ['***-***-***-***-***', '***-***-***-***-***'], 'threat.source': 'UNKNOWN', 'object.process.hash.md5': '*****', 'unattributed.account.email_address': ['test@example.com'], 'vendor_information.log_generation_time': '2023-09-01T18:15:00.192690Z', 'object.policy.name': 'default', 'system.create.date': '2023-09-01T18:15:00.691+0000', 'vendor_information.log_type': 'WATCHLIST', 'general_information.standard_message_time': '2023-09-01T18:15:00.192690Z', 'general_information.processing_end_time': '2023-09-01T18:15:00.238029Z', 'origin.host.os.platform': 'WINDOWS', 'object.policy.id': '*****', 'general_information.message_id': 'kQ_*****', 'general_information.common_event_name': ['Threat Detection', 'Watchlist Hit']}}

count

{'qualifier': 'eq', 'value': 58}

took

26

aggregationBatchResponse

{'aggregationResponses': []}

Fetch Event Field Mapping

Please note that Fetch Event commands require event field mapping. Field mapping plays a key role in the data normalization process part of the event pipeline. Field mapping converts the original data fields from the different providers to the D3 fields which are standardized by the D3 Model. Please refer to Event and Incident Intake Field Mapping for details.

To customize field mapping, click + Add Field and add the custom field of your choice. You can also remove built-in field mappings by clicking x. Please note that two underscore characters will automatically prefix the defined Field Name as the System Name for a custom field mapping. Additionally, if an input Field Name contains any spaces, they will automatically be replaced with underscores for the corresponding System Name.

As a system integration, the LogRhythm Axon integration has some pre-configured field mappings for default field mapping.

  • Default Event Source
    The Default Event Source is the default set of field mappings that are applied when this fetch event command is executed. For out-of-the-box integrations, you will find a set of field mapping provided by the system. Default event source provides field mappings for common fields from fetched events. The default event source has a “Main Event JSON Path” (i.e., $.content) that is used to extract a batch of events from the response raw data. Click Edit Event Source to view the “Main Event JSON Path”.

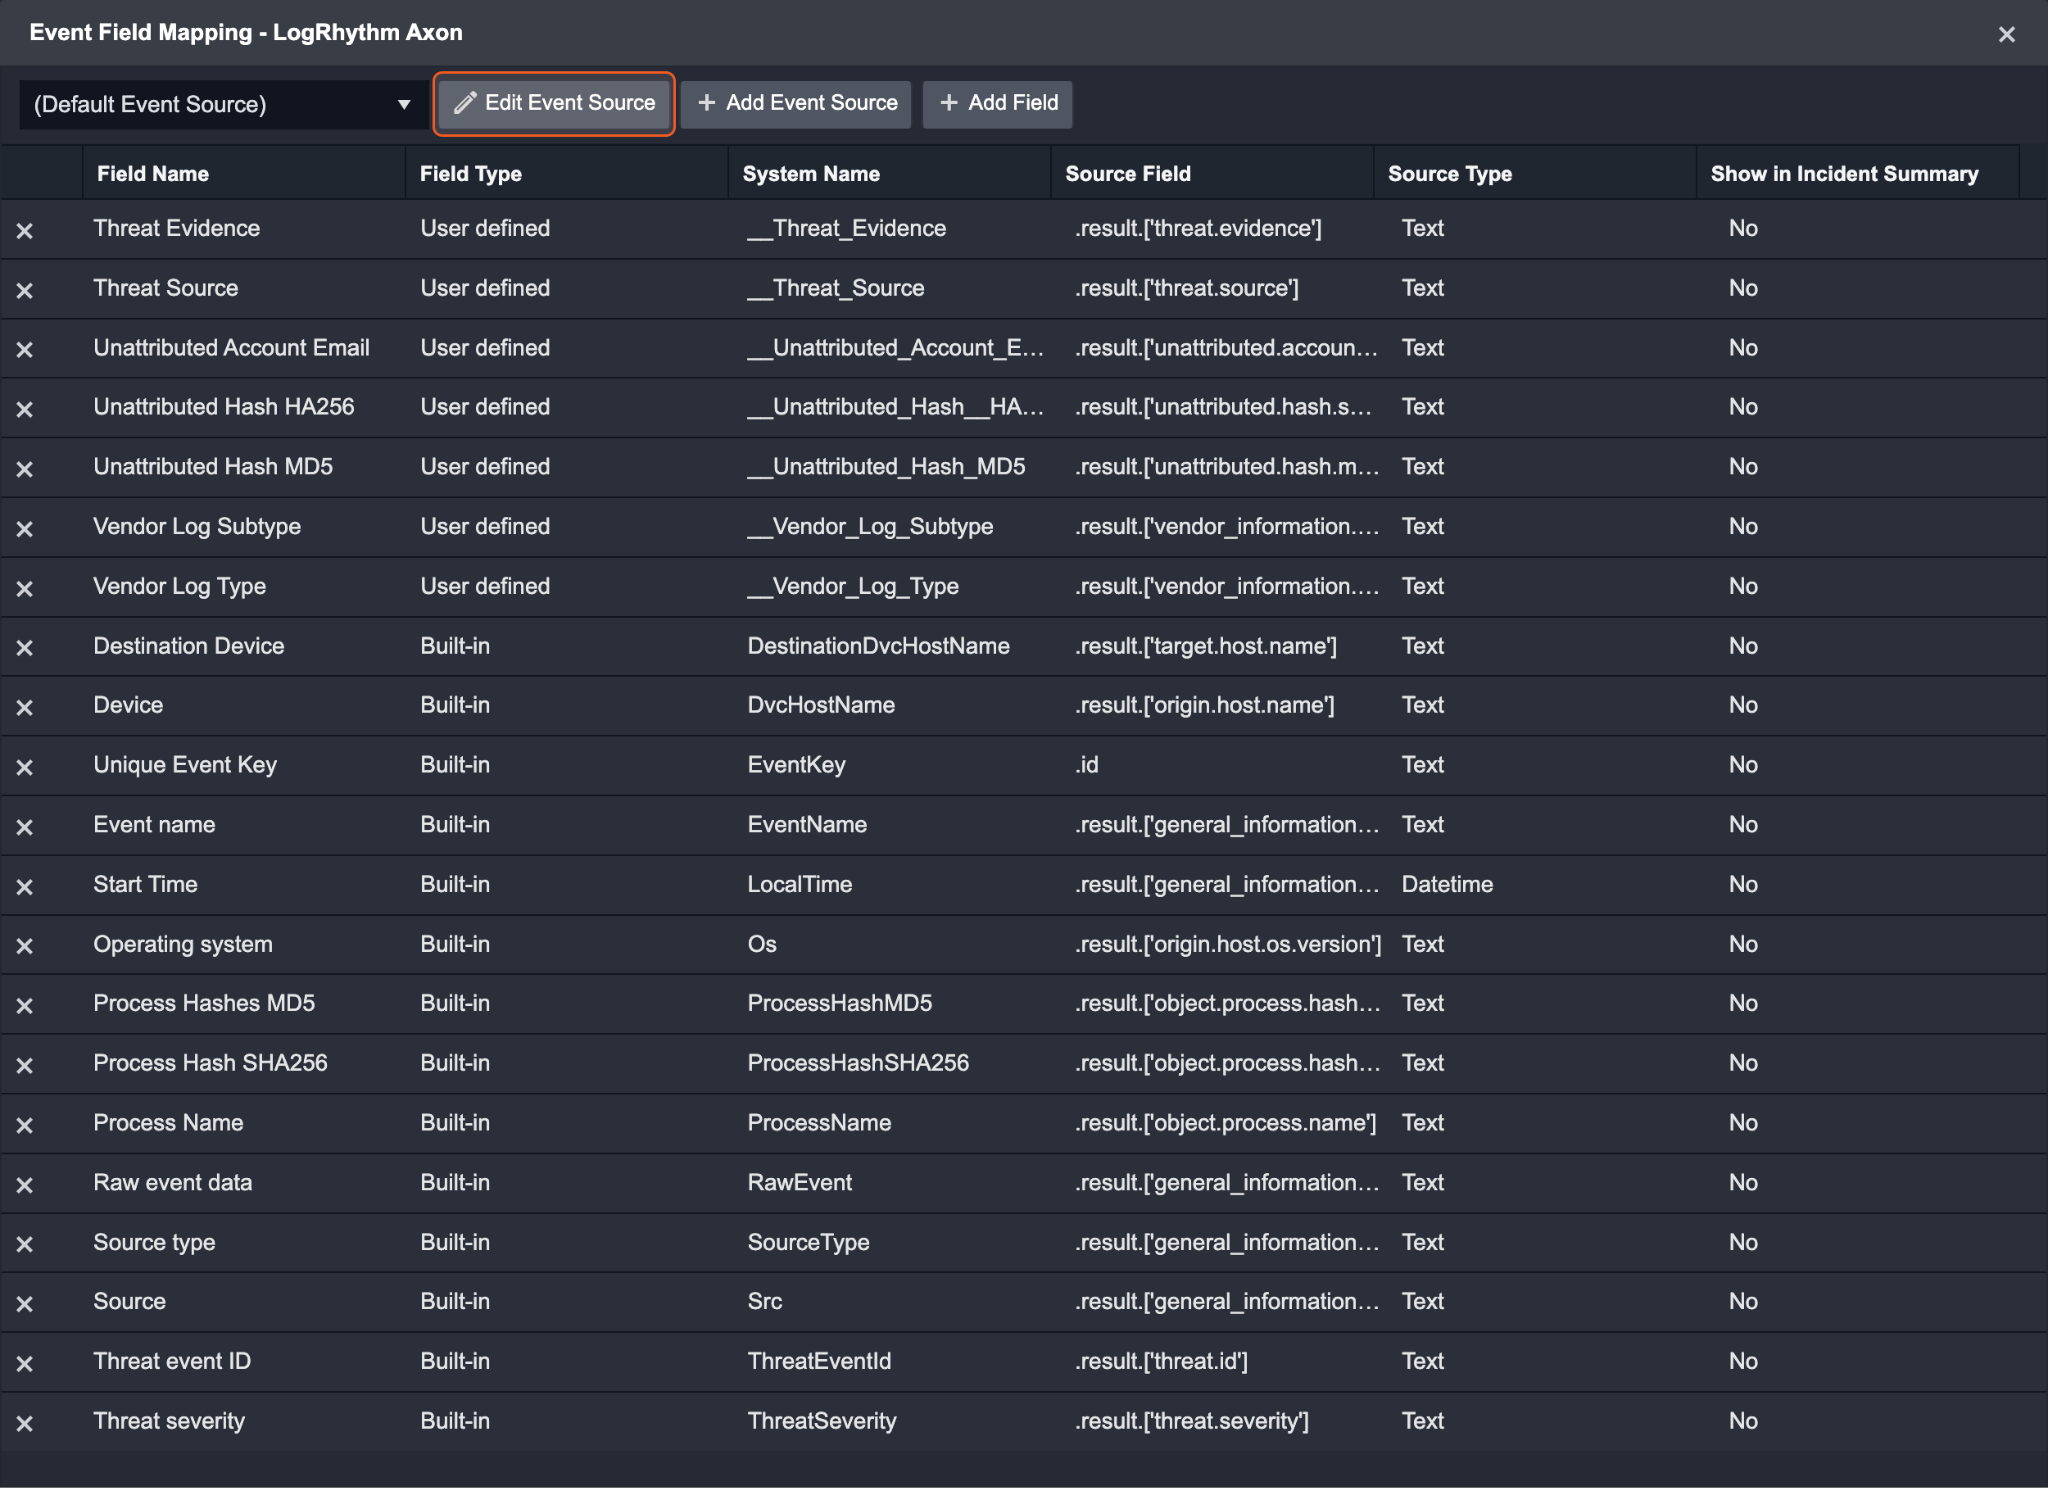
    • Main Event JSON Path: $.content
      The Main Event JSON Path determines the root path where the system starts parsing raw response data into D3 event data. The JSON path begins with $, representing the root element. The path is formed by appending a sequence of child elements to $, each separated by a dot (.). Square brackets with nested quotation marks ([‘...’]) should be used to separate child elements in JSON arrays.
      For example, the root node of a JSON Path is content. The child node denoting the Unique Event Key field would be id. Putting it together, the JSON Path expression to extract the Unique Event Key is $.content.id.

The pre-configured field mappings are detailed below:

Field Name

Source Field

Unique Event Key

.id

Start Time

.result.['general_information.standard_message_time']

Device

.result.['origin.host.name']

Unattributed Hash HA256

.result.['unattributed.hash.sha256']

Unattributed Hash MD5

.result.['unattributed.hash.md5']

Vendor Log Subtype

.result.['vendor_information.log_subtype']

Source

.result.['general_information.log_source.name']

Threat event ID

.result.['threat.id']

Destination Device

.result.['target.host.name']

Source type

.result.['general_information.log_source.type_name']

Process Hash SHA256

.result.['object.process.hash.sha256']

Threat severity

.result.['threat.severity']

Operating system

.result.['origin.host.os.version']

Process Name

.result.['object.process.name']

Threat Evidence

.result.['threat.evidence']

Process Hashes MD5

.result.['object.process.hash.md5']

Threat Source

.result.['threat.source']

Unattributed Account Email

.result.['unattributed.account.email_address']

Vendor Log Type

.result.['vendor_information.log_type']

Event name

.result.['general_information.common_event_name']

Raw event data

.result.['general_information.raw_message']

Error Handling

If the Return Data is Failed, an Error tab will appear in the Test Result window.

The error tab contains the details responded from D3 SOAR or third-party API calls, including Failure Indicator, Status Code, and Message. This can help you locate the root cause of a command failure.

Parts in Error

Description

Example

Failure Indicator

Indicates the command failure that happened at a specific input and/or API call.

Fetch Event failed.

Status Code

The response code issued by the third-party API server or the D3 SOAR system that can be used to locate the corresponding error category. For example, if the returned status code is 401, the selected connection is unauthorized to run the command. The user or system support would need to check the permission setting in the LogRhythm Axon portal. Refer to the HTTP Status Code Registry for details.

Status Code: 400.

Message

The raw data or captured key error message from the integration API server about the API request failure.

Message: Syntax error at line: 1: 2 - no viable alternative at input.

Error Sample Data

Fetch Event failed.

Status Code: 400.

Message: Syntax error at line: 1: 2 - no viable alternative at input.

Get List Definitions

Retrieves all list definitions for tenants.

Input

Input Parameter

Required/Optional

Description

Example

Limit

Optional

The maximum number of results to return. If this parameter is not defined, all available list definitions will be returned.

5

Output

Raw Data

The primary response data from the API request.

SAMPLE DATA

JSON
{
    "requestId": "8*****5",
    "paginationInfo": {
        "nextPage": "***-***-***-***-***"
    },
    "content": [
        {
            "tenantId": "l*****",
            "id": "***-***-***-***-***",
            "createdOn": "2023-09-22T17:21:13.176797Z",
            "updatedOn": "2023-09-22T18:09:07.664634Z",
            "title": "Malicious Files",
            "description": "These Files are suspicious malware",
            "retired": false,
            "columns": [
                {
                    "tenantId": "l*****",
                    "id": "***-***-***-***-***",
                    "createdOn": "2023-09-22T17:21:13.180985Z",
                    "updatedOn": "2023-09-22T18:09:07.664634Z",
                    "title": "id",
                    "description": "These Files are flagged",
                    "type": "LONG_TEXT"
                }
            ],
            "dataStrategy": "LOCAL",
            "createdBy": "***-***-***-***-***",
            "updatedBy": "***-***-***-***-***",
            "entryCount": 1
        }
    ]
}
Key Fields

Common cyber security indicators such as unique IDs, file hash values, CVE numbers, IP addresses, etc., will be extracted from Raw Data as Key Fields.
The system stores these key fields in the path $.[playbookTask].outputData. You can use these key-value pairs as data points for playbook task inputs.

SAMPLE DATA

CODE
{
    "ListDefinitionIDs": "\"[\\\"***-***-***-***-***\\\"]\"",
    "Titles": "\"[\\\"Malicious Files\\\"]\""
}
Return Data

Indicates one of the possible command execution states: Successful or Failed.

The Failed state can be triggered by any of the following errors:

  • A connection issue with the integration

  • The API returned an error message

  • No response from the API

You can view more details about an error in the Error tab.

Return Data can be passed down directly to a subsequent command or used to create conditional tasks in playbooks.

SAMPLE DATA

CODE
Successful
Result

Provides a brief summary of outputs in an HTML formatted table.

SAMPLE DATA

requestId

8*****5

paginationInfo

{'nextPage': '***-***-***-***-***'}

content

  • {'tenantId': 'l*****', 'id': '***-***-***-***-***', 'createdOn': '2023-09-22T17:21:13.176797Z', 'updatedOn': '2023-09-22T18:09:07.664634Z', 'title': 'Malicious Files', 'description': 'These Files are suspicious malware', 'retired': False, 'columns': [{'tenantId': 'l*****', 'id': '***-***-***-***-***', 'createdOn': '2023-09-22T17:21:13.180985Z', 'updatedOn': '2023-09-22T18:09:07.664634Z', 'title': 'id', 'description': 'These Files are flagged', 'type': 'LONG_TEXT'}], 'dataStrategy': 'LOCAL', 'createdBy': ***-***-***-***-***', 'updatedBy': '***-***-***-***-***', 'entryCount': 1}

Error Handling

If the Return Data is Failed, an Error tab will appear in the Test Result window.

The error tab contains the details responded from D3 SOAR or third-party API calls, including Failure Indicator, Status Code, and Message. This can help you locate the root cause of a command failure.

Parts in Error

Description

Example

Failure Indicator

Indicates the command failure that happened at a specific input and/or API call.

Get List Definitions failed.

Status Code

The response code issued by the third-party API server or the D3 SOAR system that can be used to locate the corresponding error category. For example, if the returned status code is 401, the selected connection is unauthorized to run the command. The user or system support would need to check the permission setting in the LogRhythm Axon portal. Refer to the HTTP Status Code Registry for details.

Status Code: 400.

Message

The raw data or captured key error message from the integration API server about the API request failure.

Message: The value for parameter (Limit) is invalid.

Error Sample Data

Get List Definitions failed.

Status Code: 400.

Message: The value for parameter (Limit) is invalid.

Get List Items

Retrieves items from the specified list definition.

Reader Note

List Definition ID is a required parameter to run this command.

  • Run the Get List Definitions command to obtain List Definition ID. List Definition IDs can be found from the returned raw data at the path $.content[*].id.

Input

Input Parameter

Required/Optional

Description

Example

List Definition ID

Required

The ID of the list definition to retrieve items. List Definition IDs can be obtained using the Get List Definitions command.

***-***-***-***-***

Output

Raw Data

The primary response data from the API request.

SAMPLE DATA

JSON
{
    "requestId": "*****",
    "content": {
        "tenantId": "l*****",
        "id": "***-***-***-***-***",
        "createdOn": "2023-09-22T19:30:24.185812Z",
        "updatedOn": "2023-09-22T19:41:13.678892Z",
        "title": "White list",
        "description": "test",
        "retired": false,
        "columns": [
            {
                "tenantId": "l*****",
                "id": "***-***-***-***-***",
                "createdOn": "2023-09-22T19:30:24.187753Z",
                "updatedOn": "2023-09-22T19:30:24.187753Z",
                "title": "File SHA256 Hashes",
                "description": "",
                "type": "LONG_TEXT",
                "columnValues": [
                    {
                        "tenantId": "l*****",
                        "id": "***-***-***-***-***",
                        "createdOn": "2023-09-22T19:41:13.714413Z",
                        "updatedOn": "2023-09-22T19:41:13.714413Z",
                        "value": "*****"
                    },
                    {
                        "tenantId": "l******",
                        "id": "***-***-***-***-***",
                        "createdOn": "2023-09-22T19:41:13.713823Z",
                        "updatedOn": "2023-09-22T19:41:13.713823Z",
                        "value": "*****"
                    }
                ]
            }
        ],
        "dataStrategy": "LOCAL",
        "createdBy": "***-***-***-***-***",
        "updatedBy": "***-***-***-***-***",
        "entryCount": 2
    }
}
Key Fields

Common cyber security indicators such as unique IDs, file hash values, CVE numbers, IP addresses, etc., will be extracted from Raw Data as Key Fields.
The system stores these key fields in the path $.[playbookTask].outputData. You can use these key-value pairs as data points for playbook task inputs.

SAMPLE DATA

CODE
{
    "Titles": "\"[\\r\\n\\\"File SHA256 Hashes\\\",\\r\\n\\\"File MD5 Hashes\\\",\\r\\n]\"",
    "IDs": "\"[\\r\\n\\\"***-***-***-***-***\\\",\\r\\n\\\"***-***-***-***-***\\\"\\r\\n]\"",
    "Values": "\"[\\r\\n\\\"****\\\",\\r\\n\\\"*****\\\"\\r\\n]\""
}
Return Data

Indicates one of the possible command execution states: Successful or Failed.

The Failed state can be triggered by any of the following errors:

  • A connection issue with the integration

  • The API returned an error message

  • No response from the API

You can view more details about an error in the Error tab.

Return Data can be passed down directly to a subsequent command or used to create conditional tasks in playbooks.

SAMPLE DATA

CODE
Successful
Result

Provides a brief summary of outputs in an HTML formatted table.

SAMPLE DATA

requestId

e******2

content

{'tenantId': 'l*****', 'id': '***-***-***-***-***', 'createdOn': '2023-09-22T19:30:24.185812Z', 'updatedOn': '2023-09-22T19:41:13.678892Z', 'title': 'White list', 'description': 'test', 'retired': False, 'columns': [{'tenantId': 'l*****', 'id': '***--***-***-***', 'createdOn': '2023-09-22T19:30:24.187753Z', 'updatedOn': '2023-09-22T19:30:24.187753Z', 'title': 'File SHA256 Hashes', 'description': '', 'type': 'LONG_TEXT', 'columnValues': [{'tenantId': 'l*****', 'id': '***-***-***-***-***', 'createdOn': '2023-09-22T19:41:13.714413Z', 'updatedOn': '2023-09-22T19:41:13.714413Z', 'value': '*****'}, {'tenantId': 'l*****', 'id': '***-***-***-***-***', 'createdOn': '2023-09-22T19:41:13.713823Z', 'updatedOn': '2023-09-22T19:41:13.713823Z', 'value': '***'}]}, {'tenantId': 'l*****', 'id': ***--***-***-***', 'createdOn': '2023-09-22T19:30:24.189381Z', 'updatedOn': '2023-09-22T19:30:24.189381Z', 'title': 'File MD5 Hashes', 'description': '', 'type': 'LONG_TEXT', 'columnValues': [{'tenantId': 'l*****', 'id': '***-***-***-***-***', 'createdOn': '2023-09-22T19:41:13.714413Z', 'updatedOn': '2023-09-22T19:41:13.714413Z', 'value': 'A*****4'}, {'tenantId': 'l*****', 'id': '***-***-***-***-***', 'createdOn': '2023-09-22T19:41:13.713823Z', 'updatedOn': '2023-09-22T19:41:13.713823Z', 'value': '**'}]}], 'dataStrategy': 'LOCAL', 'createdBy': '***-***-***-***-***', 'updatedBy': '***-***-***-***-***', 'entryCount': 2}

Error Handling

If the Return Data is Failed, an Error tab will appear in the Test Result window.

The error tab contains the details responded from D3 SOAR or third-party API calls, including Failure Indicator, Status Code, and Message. This can help you locate the root cause of a command failure.

Parts in Error

Description

Example

Failure Indicator

Indicates the command failure that happened at a specific input and/or API call.

Get List Items failed.

Status Code

The response code issued by the third-party API server or the D3 SOAR system that can be used to locate the corresponding error category. For example, if the returned status code is 401, the selected connection is unauthorized to run the command. The user or system support would need to check the permission setting in the LogRhythm Axon portal. Refer to the HTTP Status Code Registry for details.

Status Code: 404.

Message

The raw data or captured key error message from the integration API server about the API request failure.

Message: Could not find entity with identifier={"tenantId":"xxx","id":"xxx"}.

Error Sample Data

Get List Items failed.

Status Code: 404.

Message: Could not find entity with identifier={"tenantId":"xxx","id":"xxx"}.

Test Connection

Allows you to perform a health check on an integration connection. You can schedule a periodic health check by selecting Connection Health Check when editing an integration connection.

Input

N/A

Output

Return Data

Indicates one of the possible command execution states: Successful or Failed.

The Failed state can be triggered by any of the following errors:

  • A connection issue with the integration

  • The API returned an error message

  • No response from the API

You can view more details about an error in the Error tab.

SAMPLE DATA

CODE
Successful

Error Handling

If the Return Data is Failed, an Error tab will appear in the Test Result window.

The error tab contains the details responded from D3 SOAR or third-party API calls, including Failure Indicator, Status Code, and Message. This can help you locate the root cause of a command failure.

Parts in Error

Description

Example

Failure Indicator

Indicates the command failure that happened at a specific input and/or API call.

Test Connection failed. Failed to check the connector.

Status Code

The response code issued by the third-party API server or the D3 SOAR system that can be used to locate the corresponding error category. For example, if the returned status code is 401, the selected connection is unauthorized to run the command. The user or system support would need to check the permission setting in the LogRhythm Axon portal. Refer to the HTTP Status Code Registry for details.

Status Code: 403.

Message

The raw data or captured key error message from the integration API server about the API request failure.

Message: HTTP 403 Forbidden.

Error Sample Data

Test Connection failed. Failed to check the connector.

Status Code: 403.

Message: HTTP 403 Forbidden.

JavaScript errors detected

Please note, these errors can depend on your browser setup.

If this problem persists, please contact our support.