
New Features
Morpheus Adaptive Tasking 
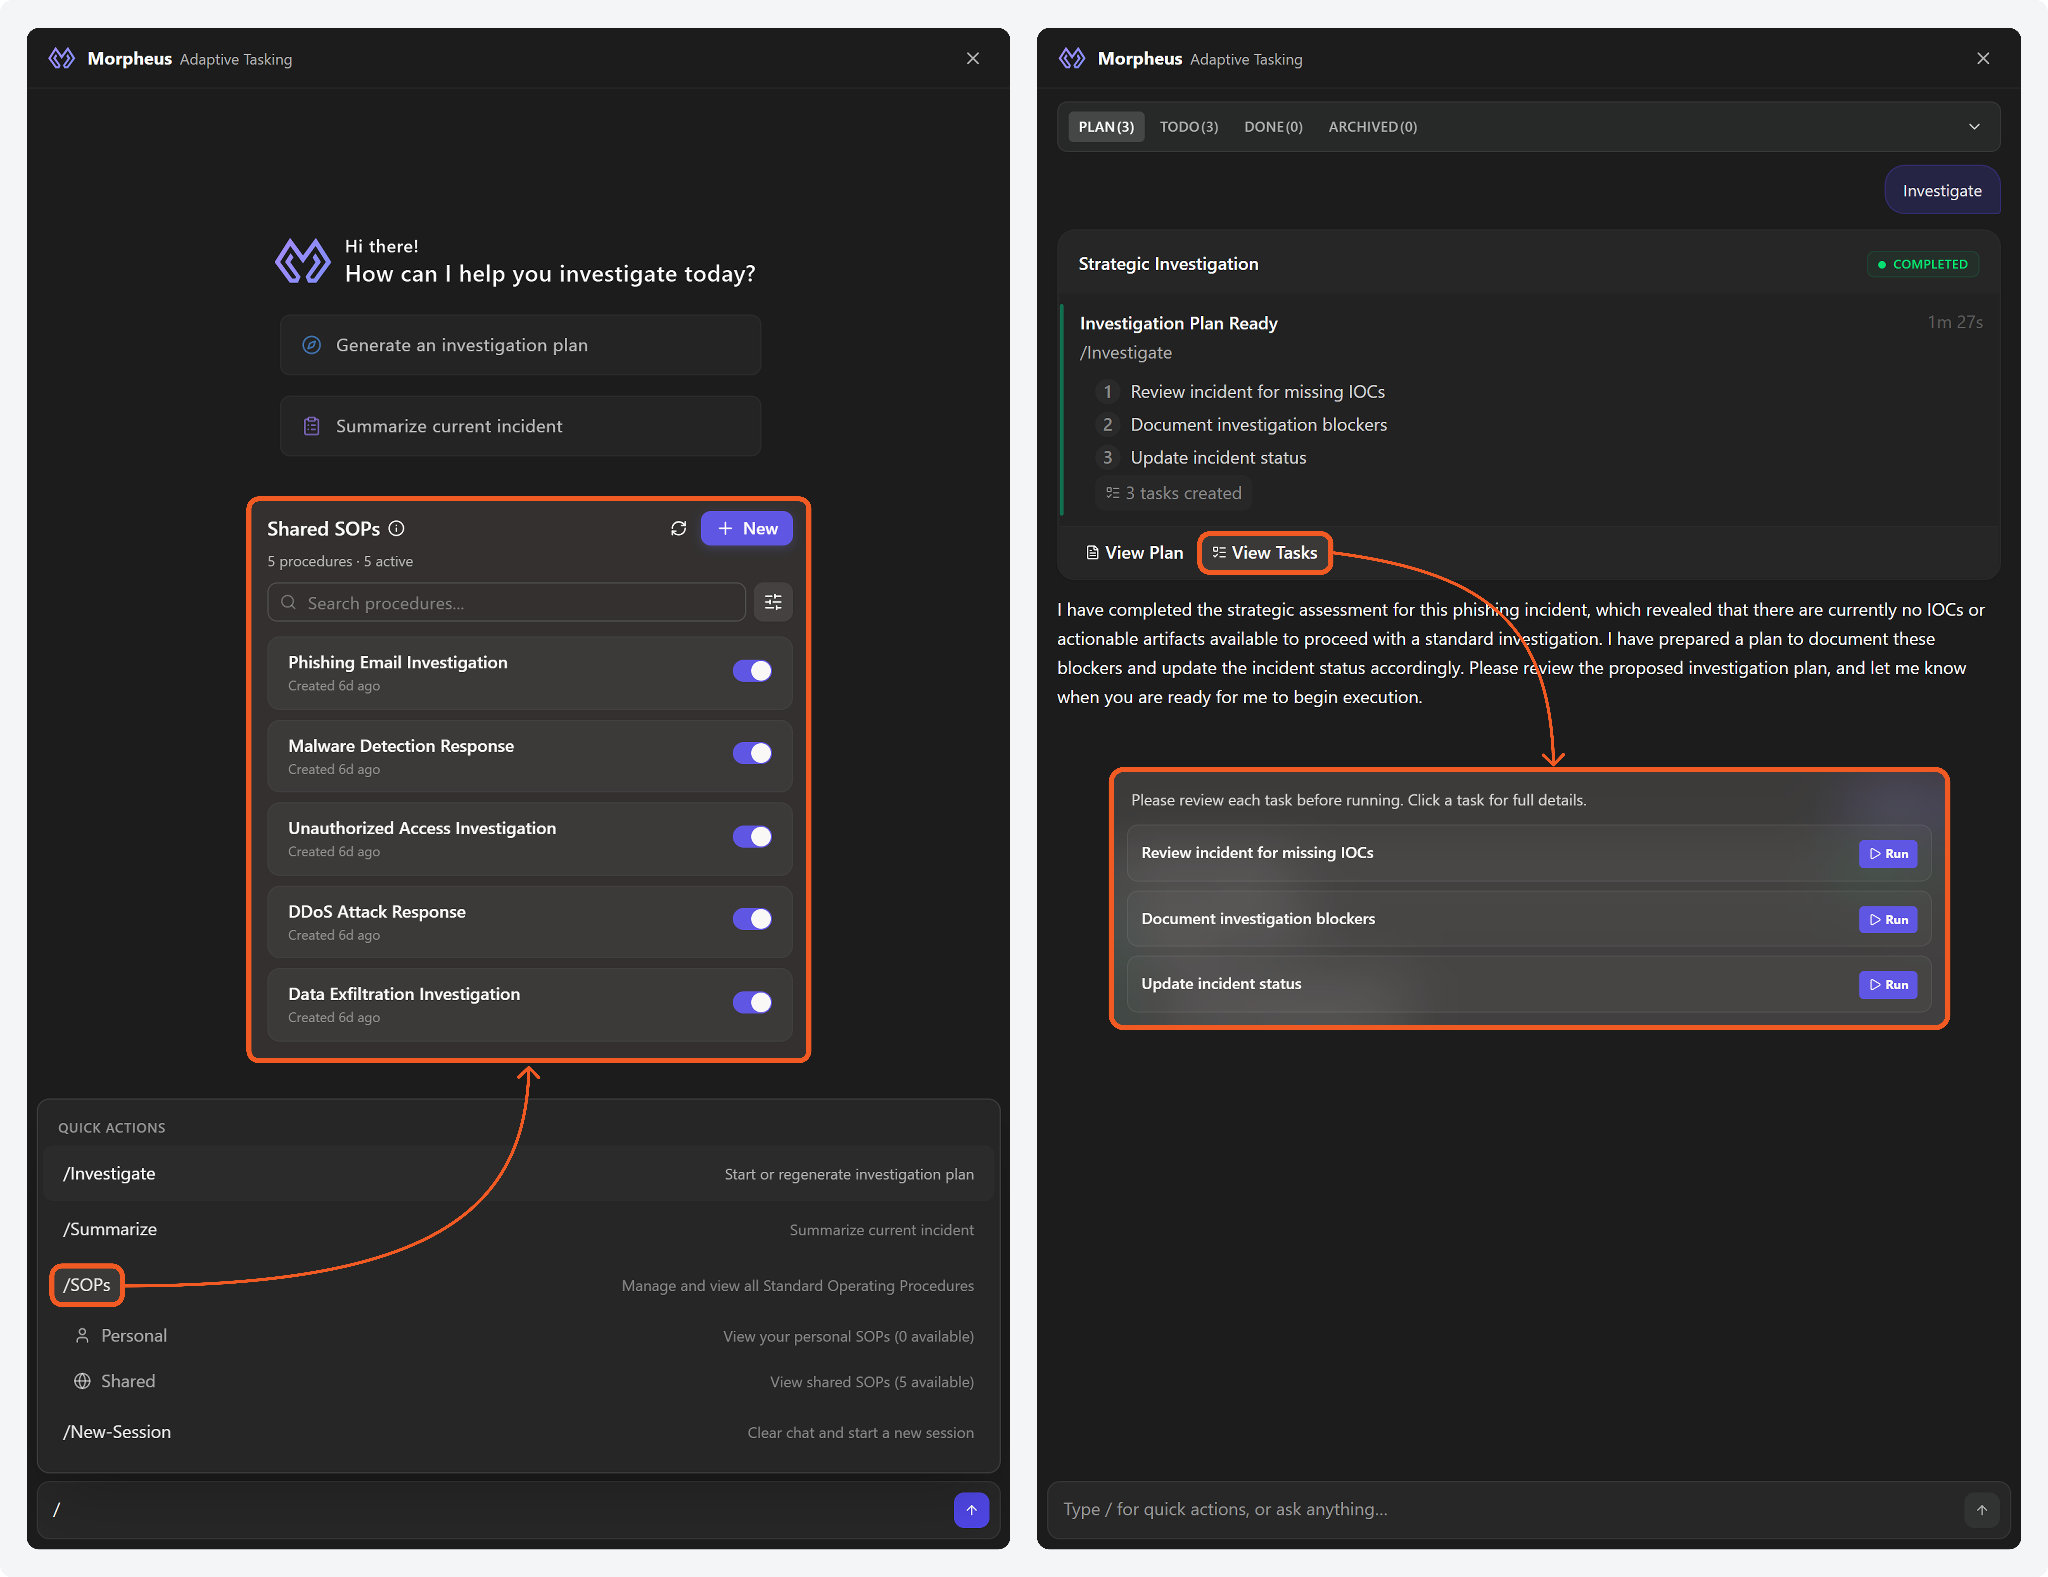
A collapsible AI-driven investigation interface, Morpheus Adaptive Tasking, is now available in the incident workspace. Users can create standard operating procedures (SOPs) to guide Morpheus-led investigations, generate step-by-step investigation plans, summarize incidents, execute quick actions, and track task progress. All actions require user confirmation, with stricter safeguards for high-impact operations.
AI Task Node
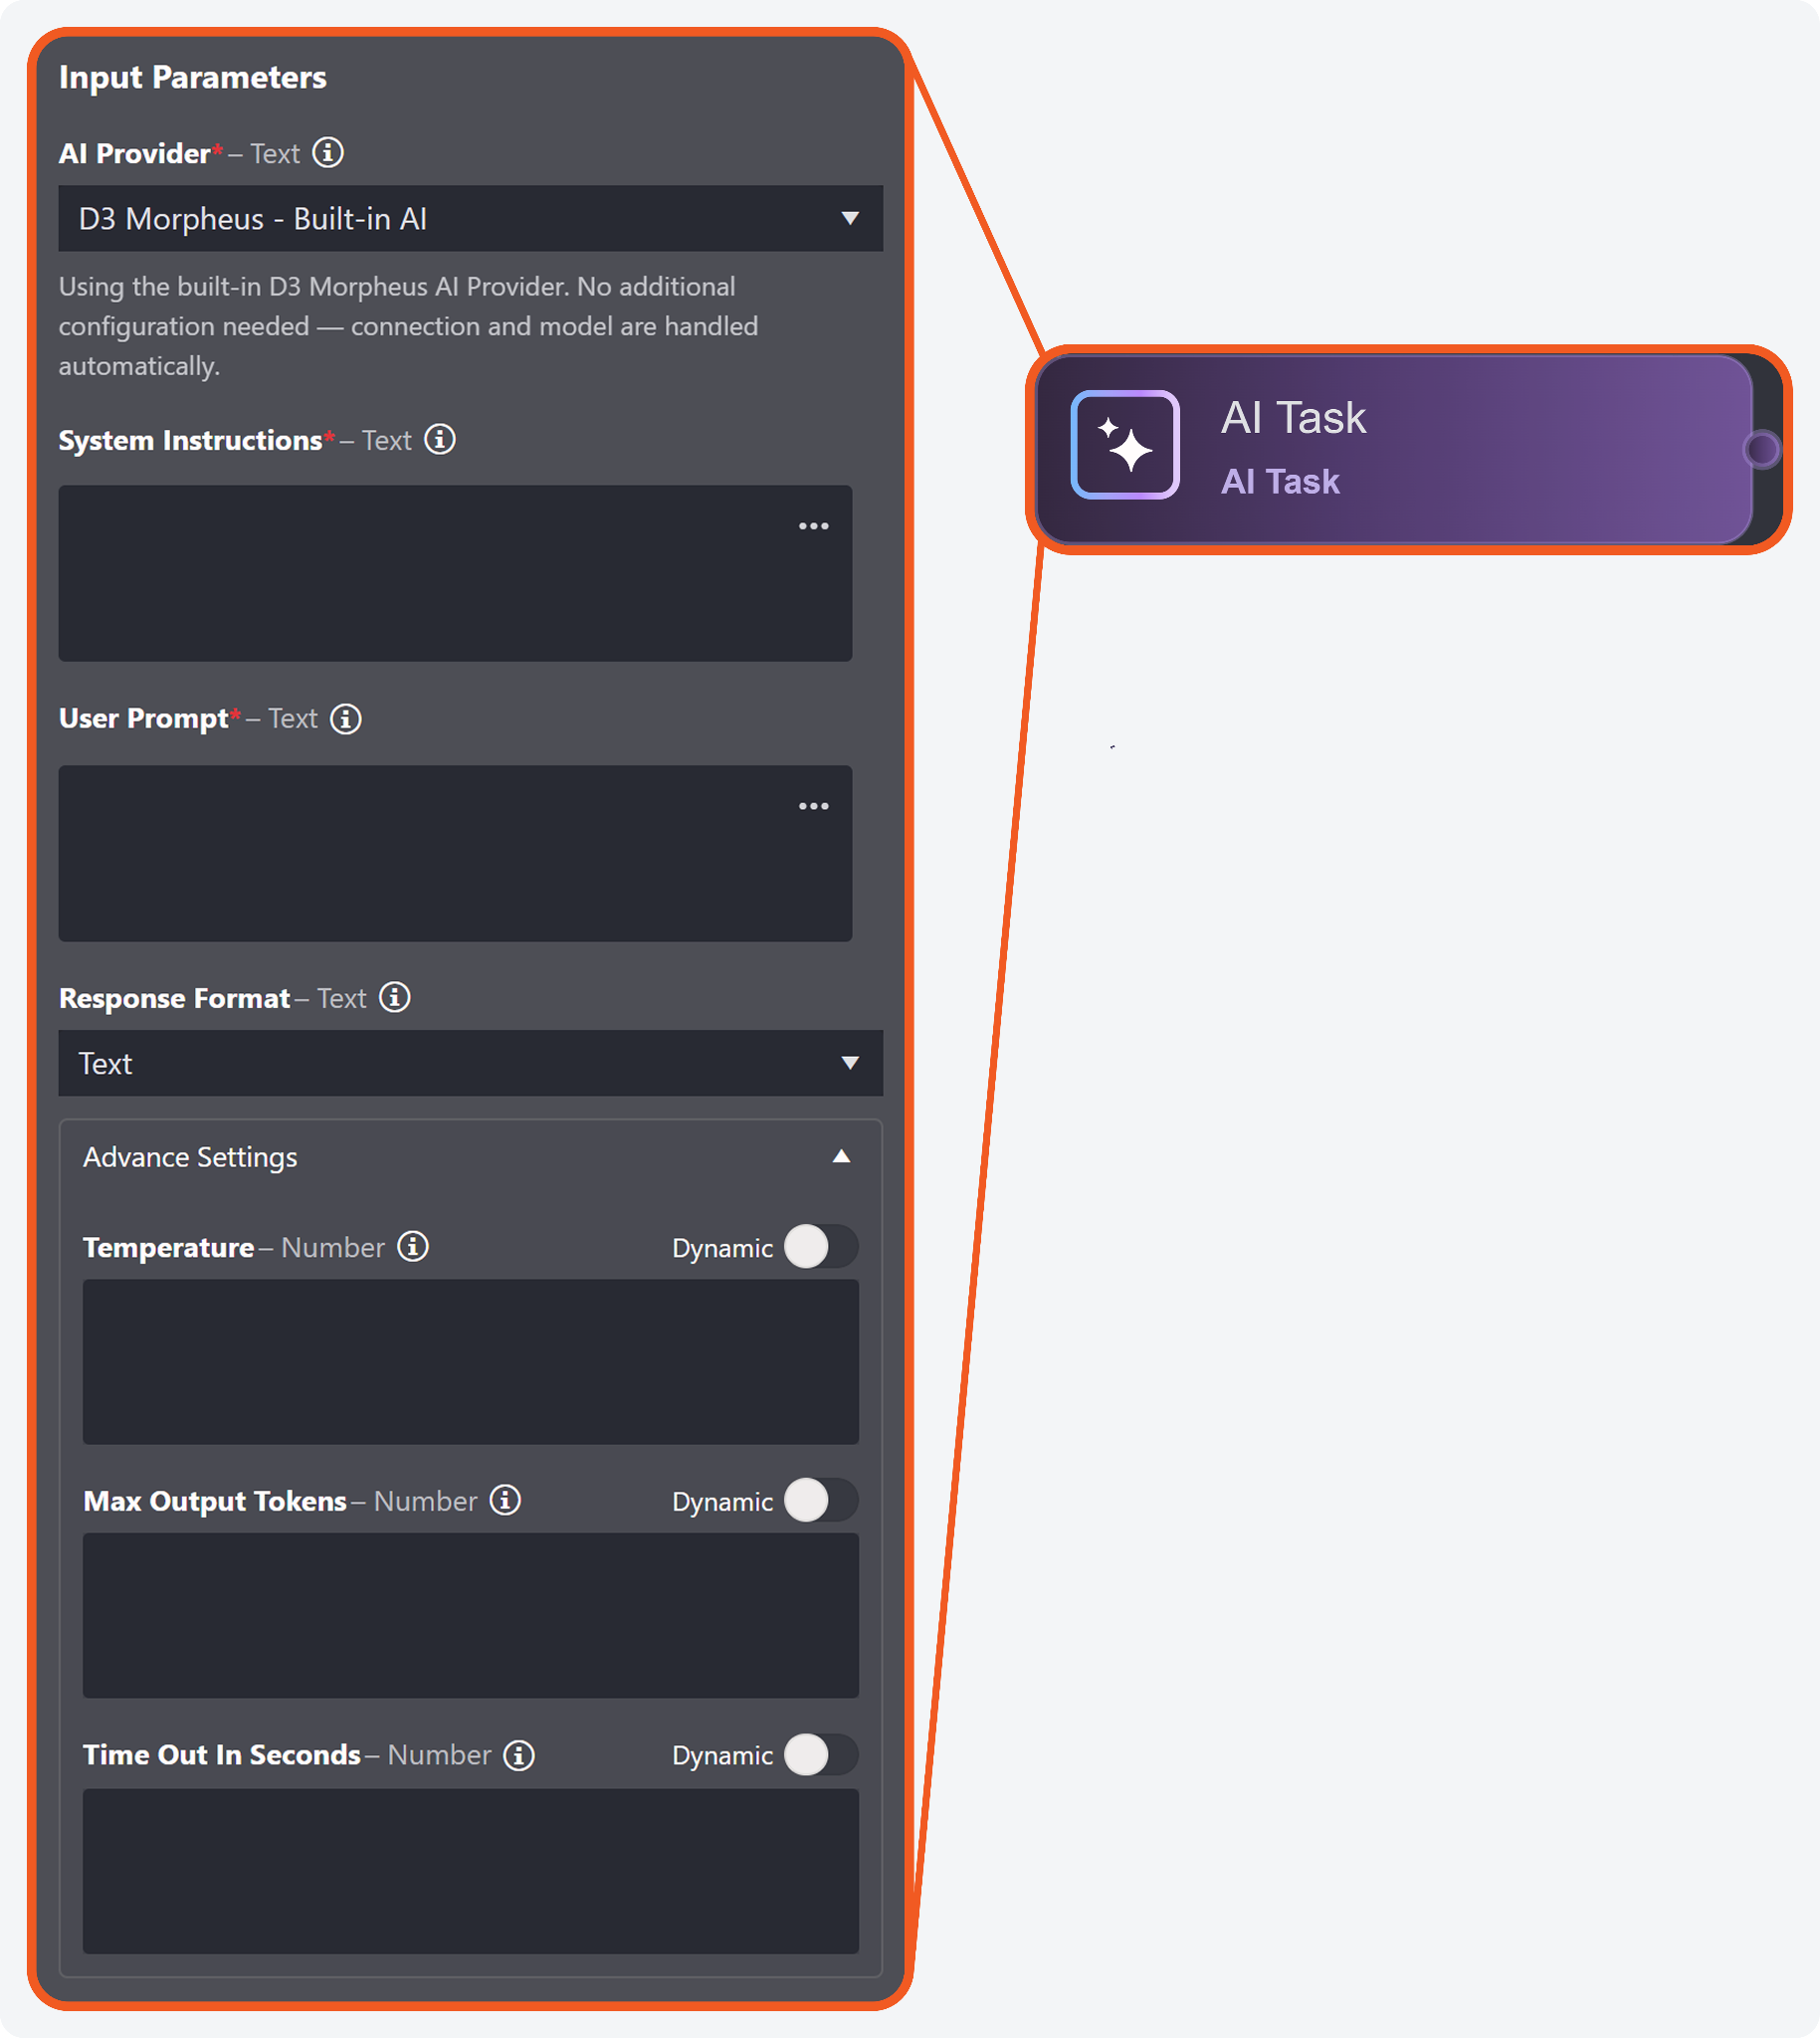
A new type of playbook task node, AI Task, has been introduced. Each execution path leading to the AI Task node contributes to evaluation and output. Supported use cases include data summarization, remediation guidance, and drafting communications for stakeholders. Users can configure a connection to use supported external models, or leverage D3's built-in AI without additional configuration. Input data from upstream execution lineages will not be used for model training.
Attack Path Discovery Node
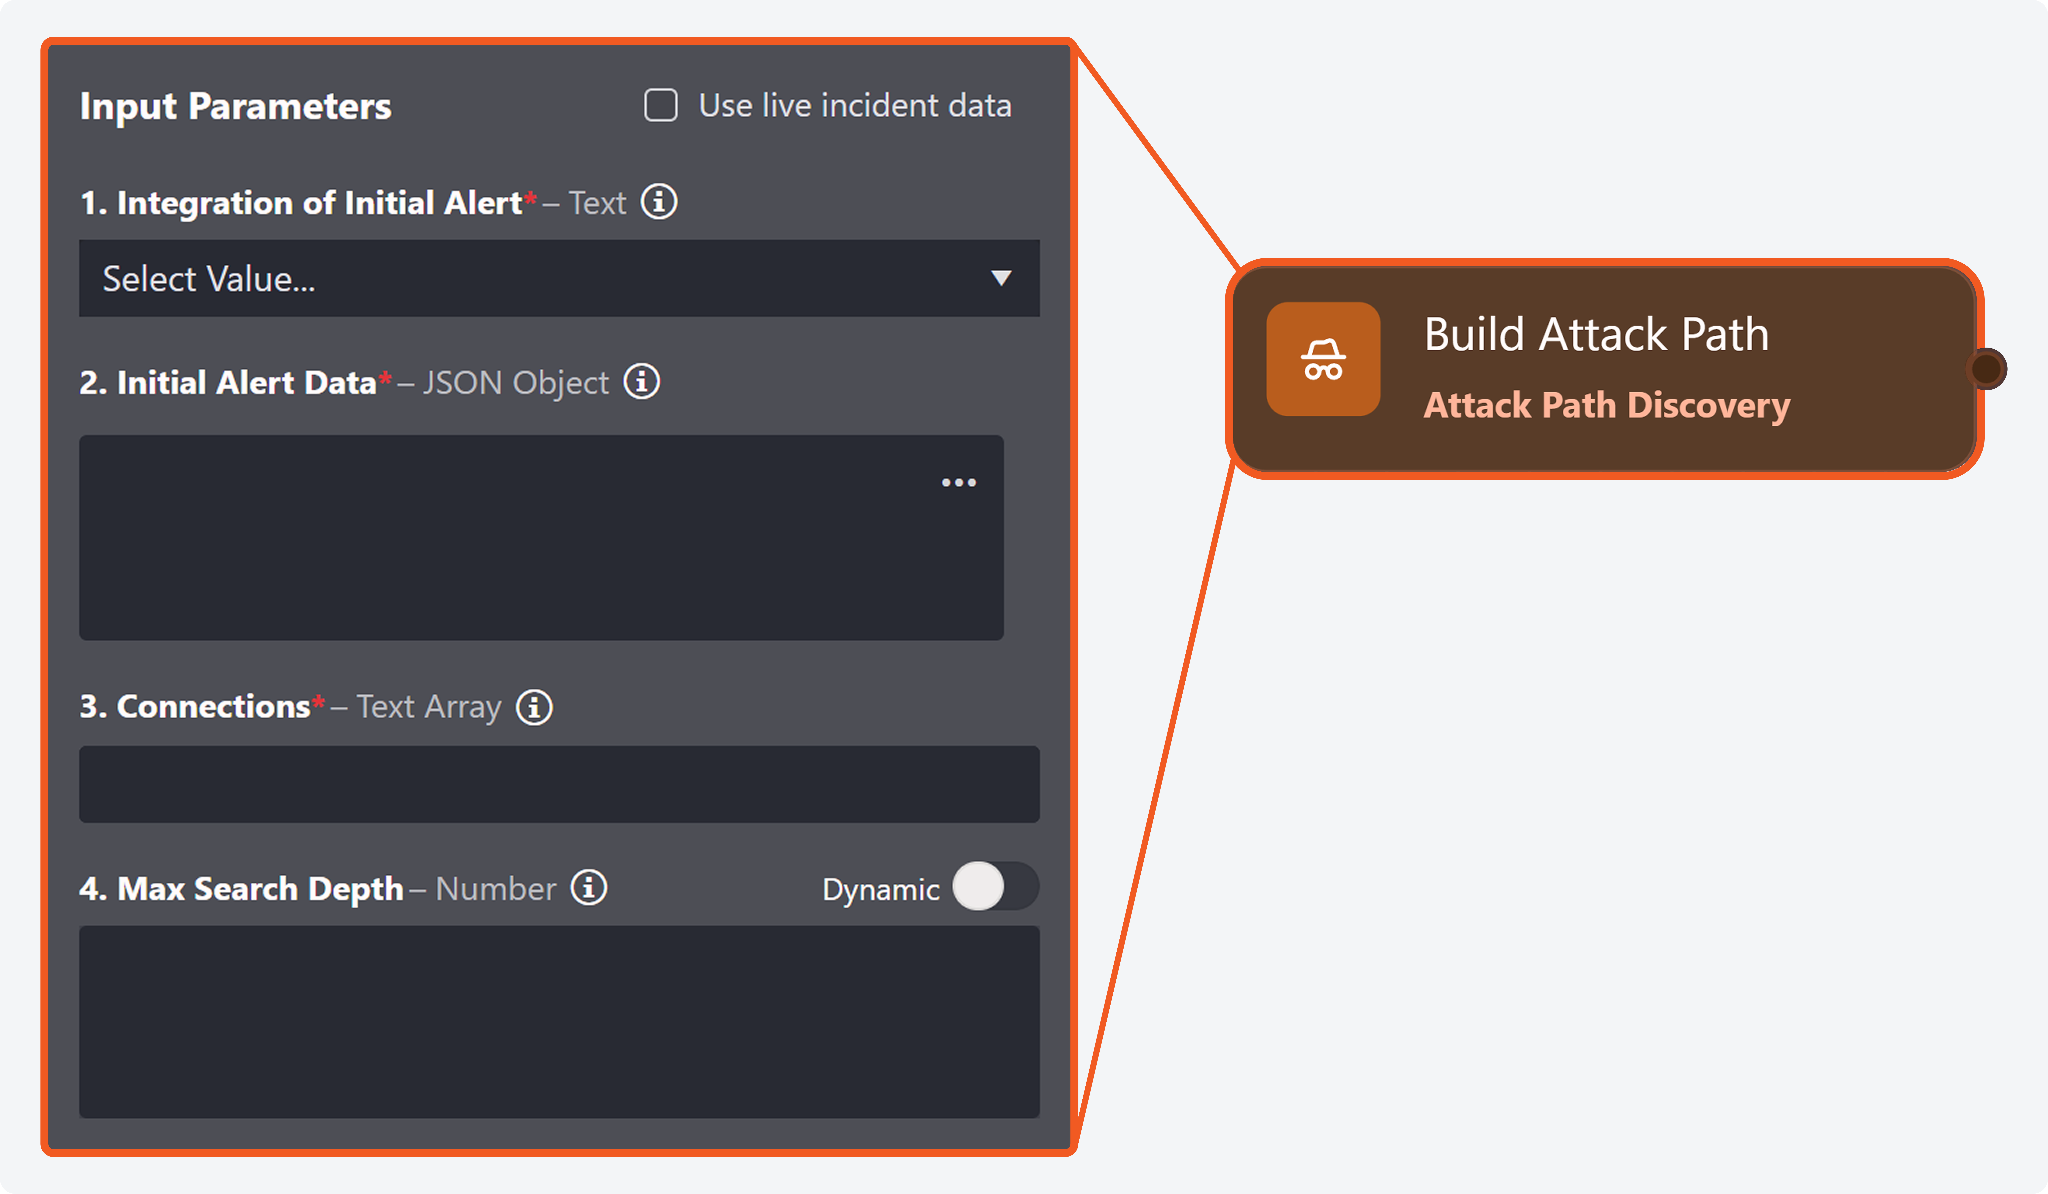
An Attack Path Discovery (APD) investigation playbook task has been introduced to aggregate and analyze data across supported integrations. The task dynamically determines runtime logic to construct attack-path timelines, summaries, key findings, remediation guidance, and graph data. Retrieved data are used by supporting utility commands to populate Morpheus AI widgets.
Example - Configuration and Return Data
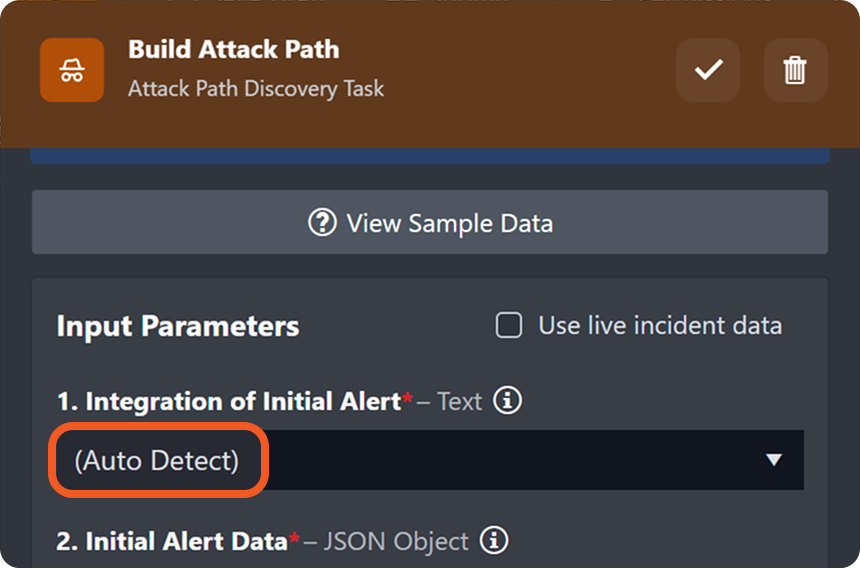
objective Configure the APD task node in preparation for widget display.
-
Select a supported integration or the (Auto Detect) option to limit execution to one integration or to determine the appropriate integrations to use, respectively.
-
Input the object, or Jinja expression that evaluates to an object, containing initial alert data.
Sample data Source{{PlaybookData | jsonpath('$.DataSource.incident.Events[*].EventData')}}
-
Input the connection names of all connected and supported integrations.
-
Run the playbook and observe the return data.
APD Return Data Structure
JSON{ "Status": "<status>", "Data": { "InvestigationSummary": { "Overview": { ... }, "KeyFindings": [ ... ] }, "AttackPathSummary": { "Overview": { ... }, "EntryVector": { ... }, "WhyItMatters": "<impact reasoning>" }, "RemediationSuggestion": { ... }, "AttackPathTimeline": [ ... ], "InvestigationGraph": { "Nodes": [ ... ], "Edges": [ ... ] } } } -
Set up supporting utility commands to populate incident workspace Morpheus AI widgets using the APD return data.
ACCESS TO ATTACK PATH DISCOVERY
The Attack Path Discovery task node, its utility commands, and the Morpheus AI widgets are excluded in standard deployments. Contact D3 Support for activation and licensing details.
Morpheus AI Incident Workspace Widgets
Three new Morpheus AI incident workspace widgets are introduced to display the data returned by the Attack Path Discovery task. These widgets, populated via supporting utility commands, present attack-path intelligence that improve situational awareness, lower effort requirements across analytical dimensions, and accelerate workflows.
Example - Displaying the Attack Path Discovery Results
Objective Add the Morpheus AI widgets in the Incident Type Manager to customize the incident workspace view, and configure the supporting utility commands that populate them.
Morpheus AI Widgets and Utility Commands
|
Widget |
Description |
|---|---|
|
Morpheus AI Attack Timeline |
Presents a chronological sequence of significant events that contribute to the attack path. 
|
|
Morpheus AI Summary |
Provides summary-level attack-path insights, key findings, remediation guidance, and more. 
|
|
Morpheus AI Graph |
Displays nodes representing activities and entities, along with derivation edges, to show how various pieces of evidence connect to form the attack path. 
|
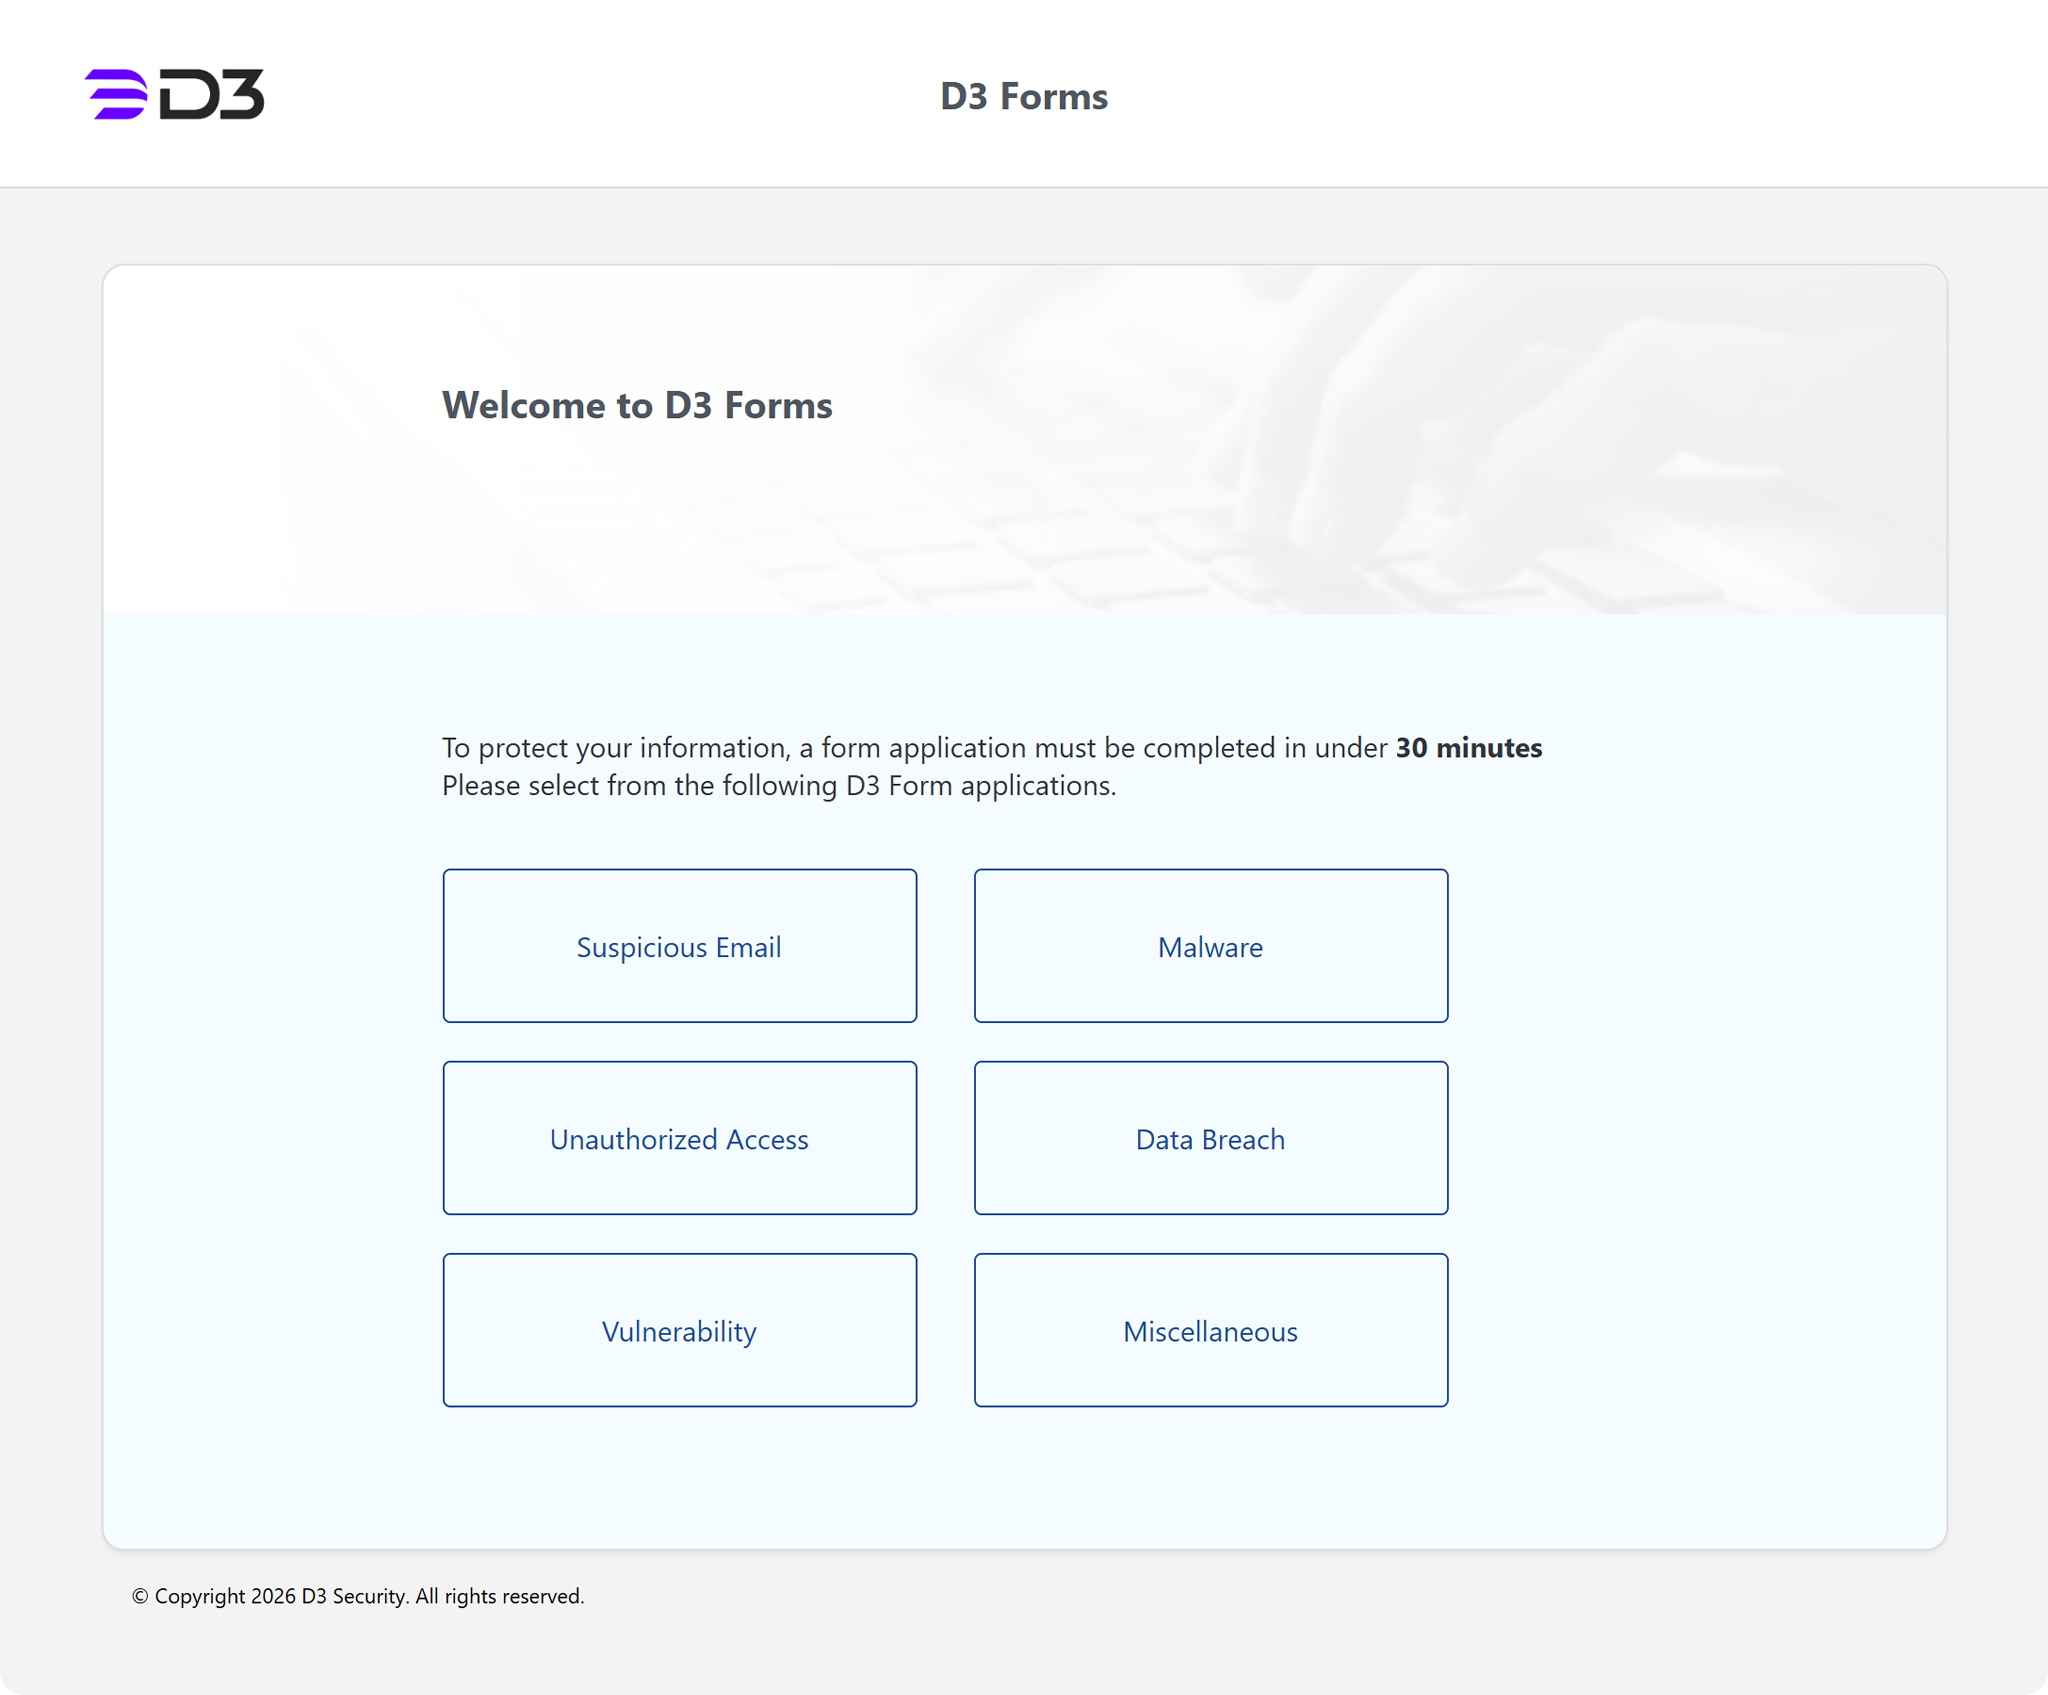
Form Branding
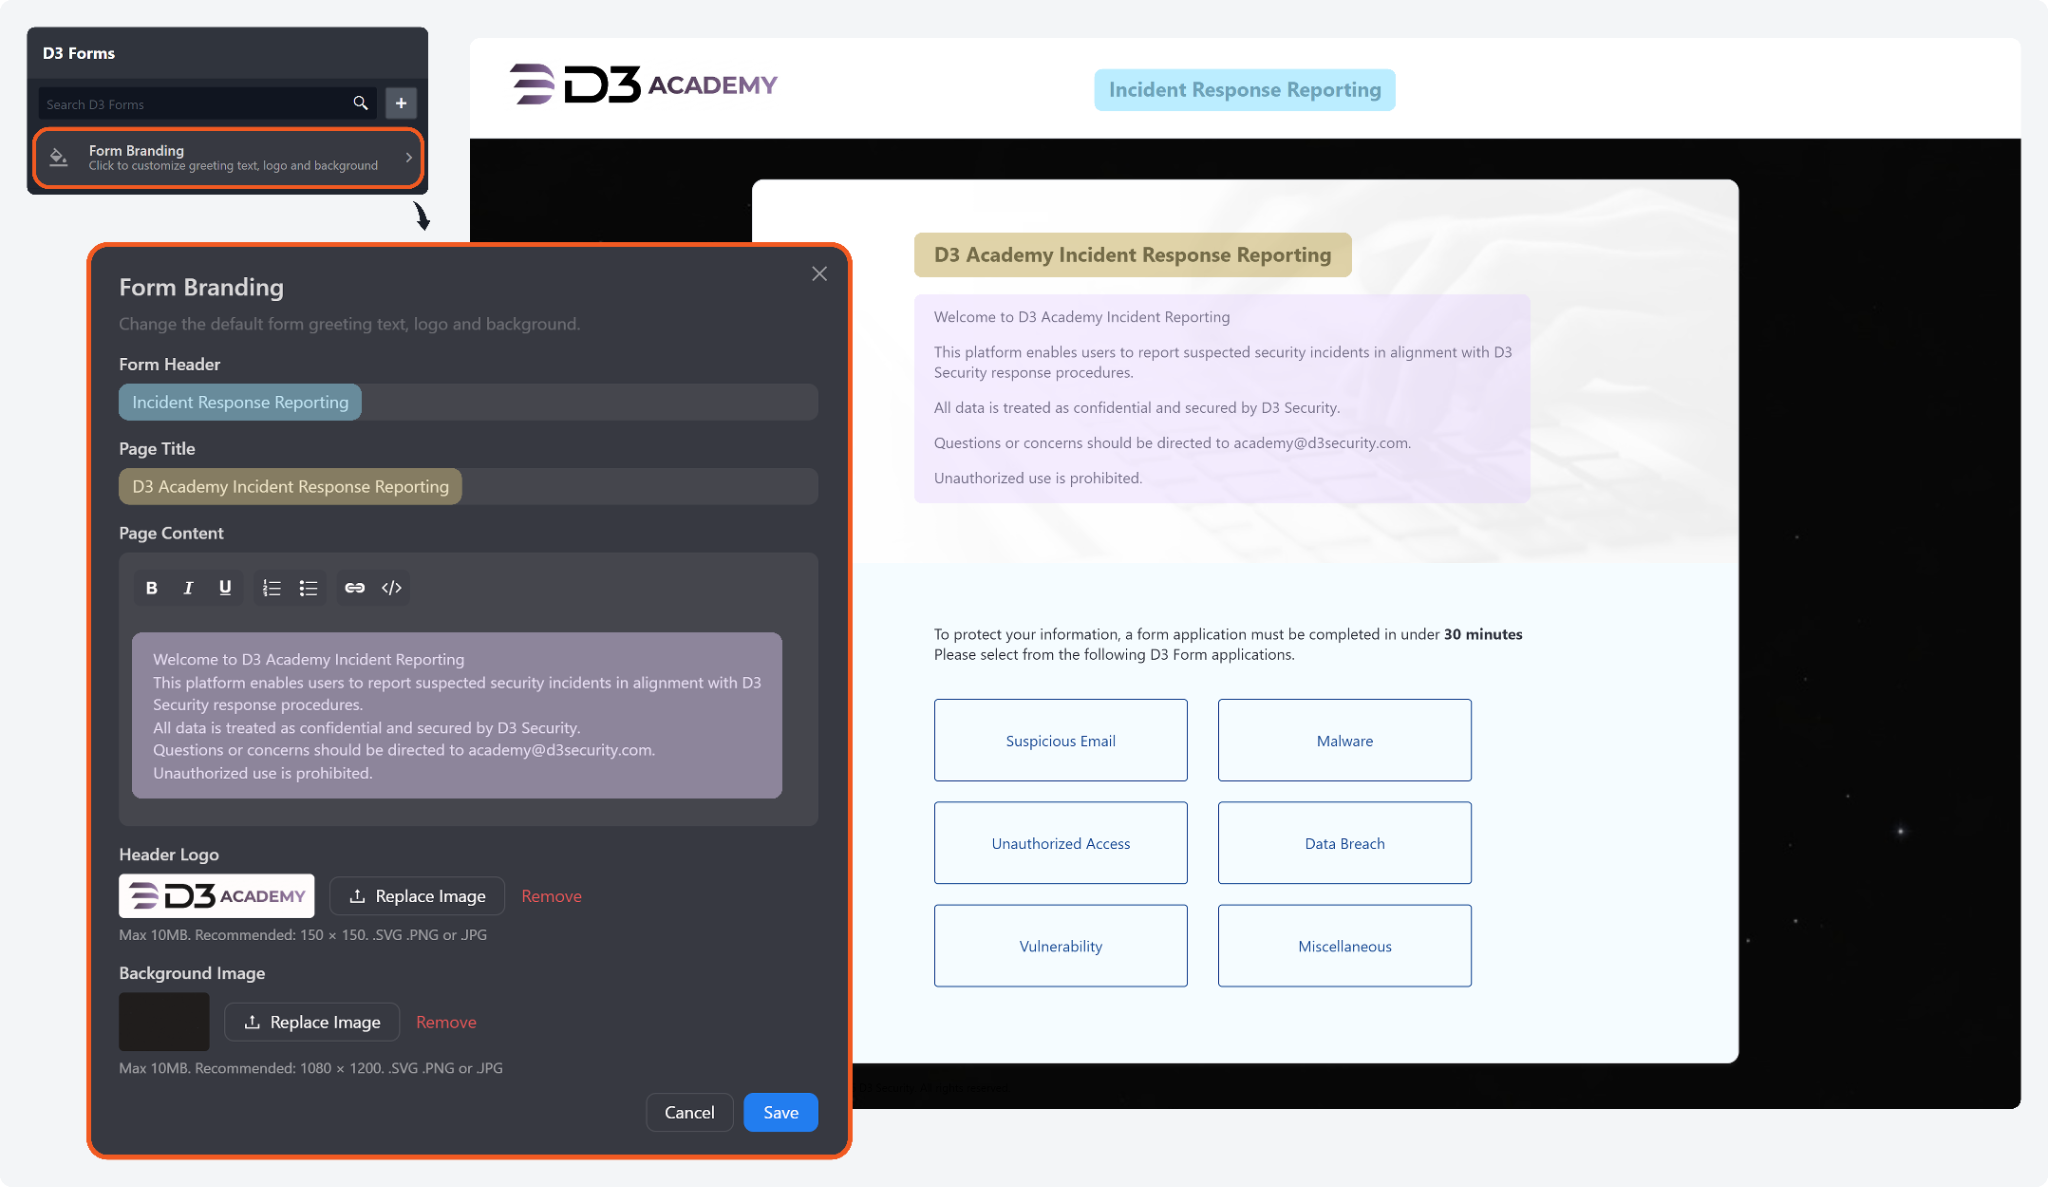
Users can now customize D3 Forms (E-alert form portal) to align with organizational branding. Administrators can update the header text, page title, page content, logo, and background image directly from the D3 Forms > Form Branding popover to tailor the reporting experience. Access requires enabling the Form Branding role permission under Configuration Modules > D3 Forms.
View Original D3 Form
Enhancements
E-Alert Access
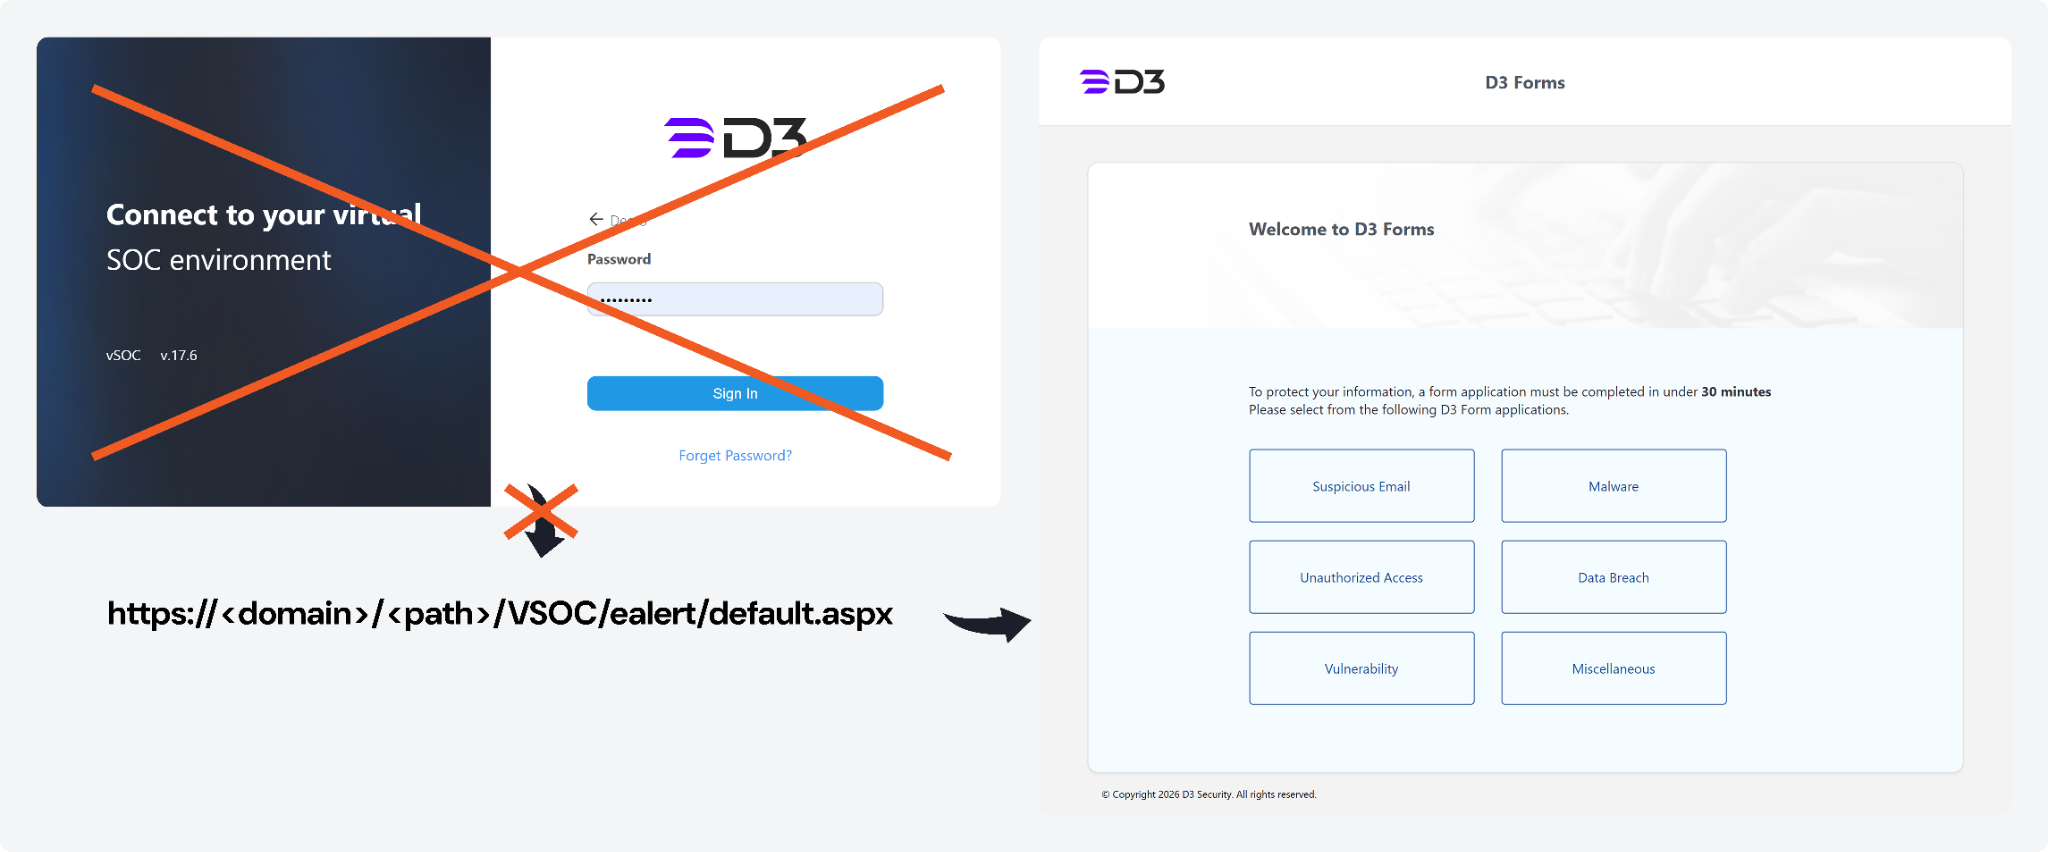
Previously, the E-alert form portal access required users to be logged into the D3 platform. This authentication requirement can now be optionally removed. To remove the authentication requirement, contact D3 and request disabling the Ealert.RequireLogin configuration key.
Event Field Mapping UI Revamp
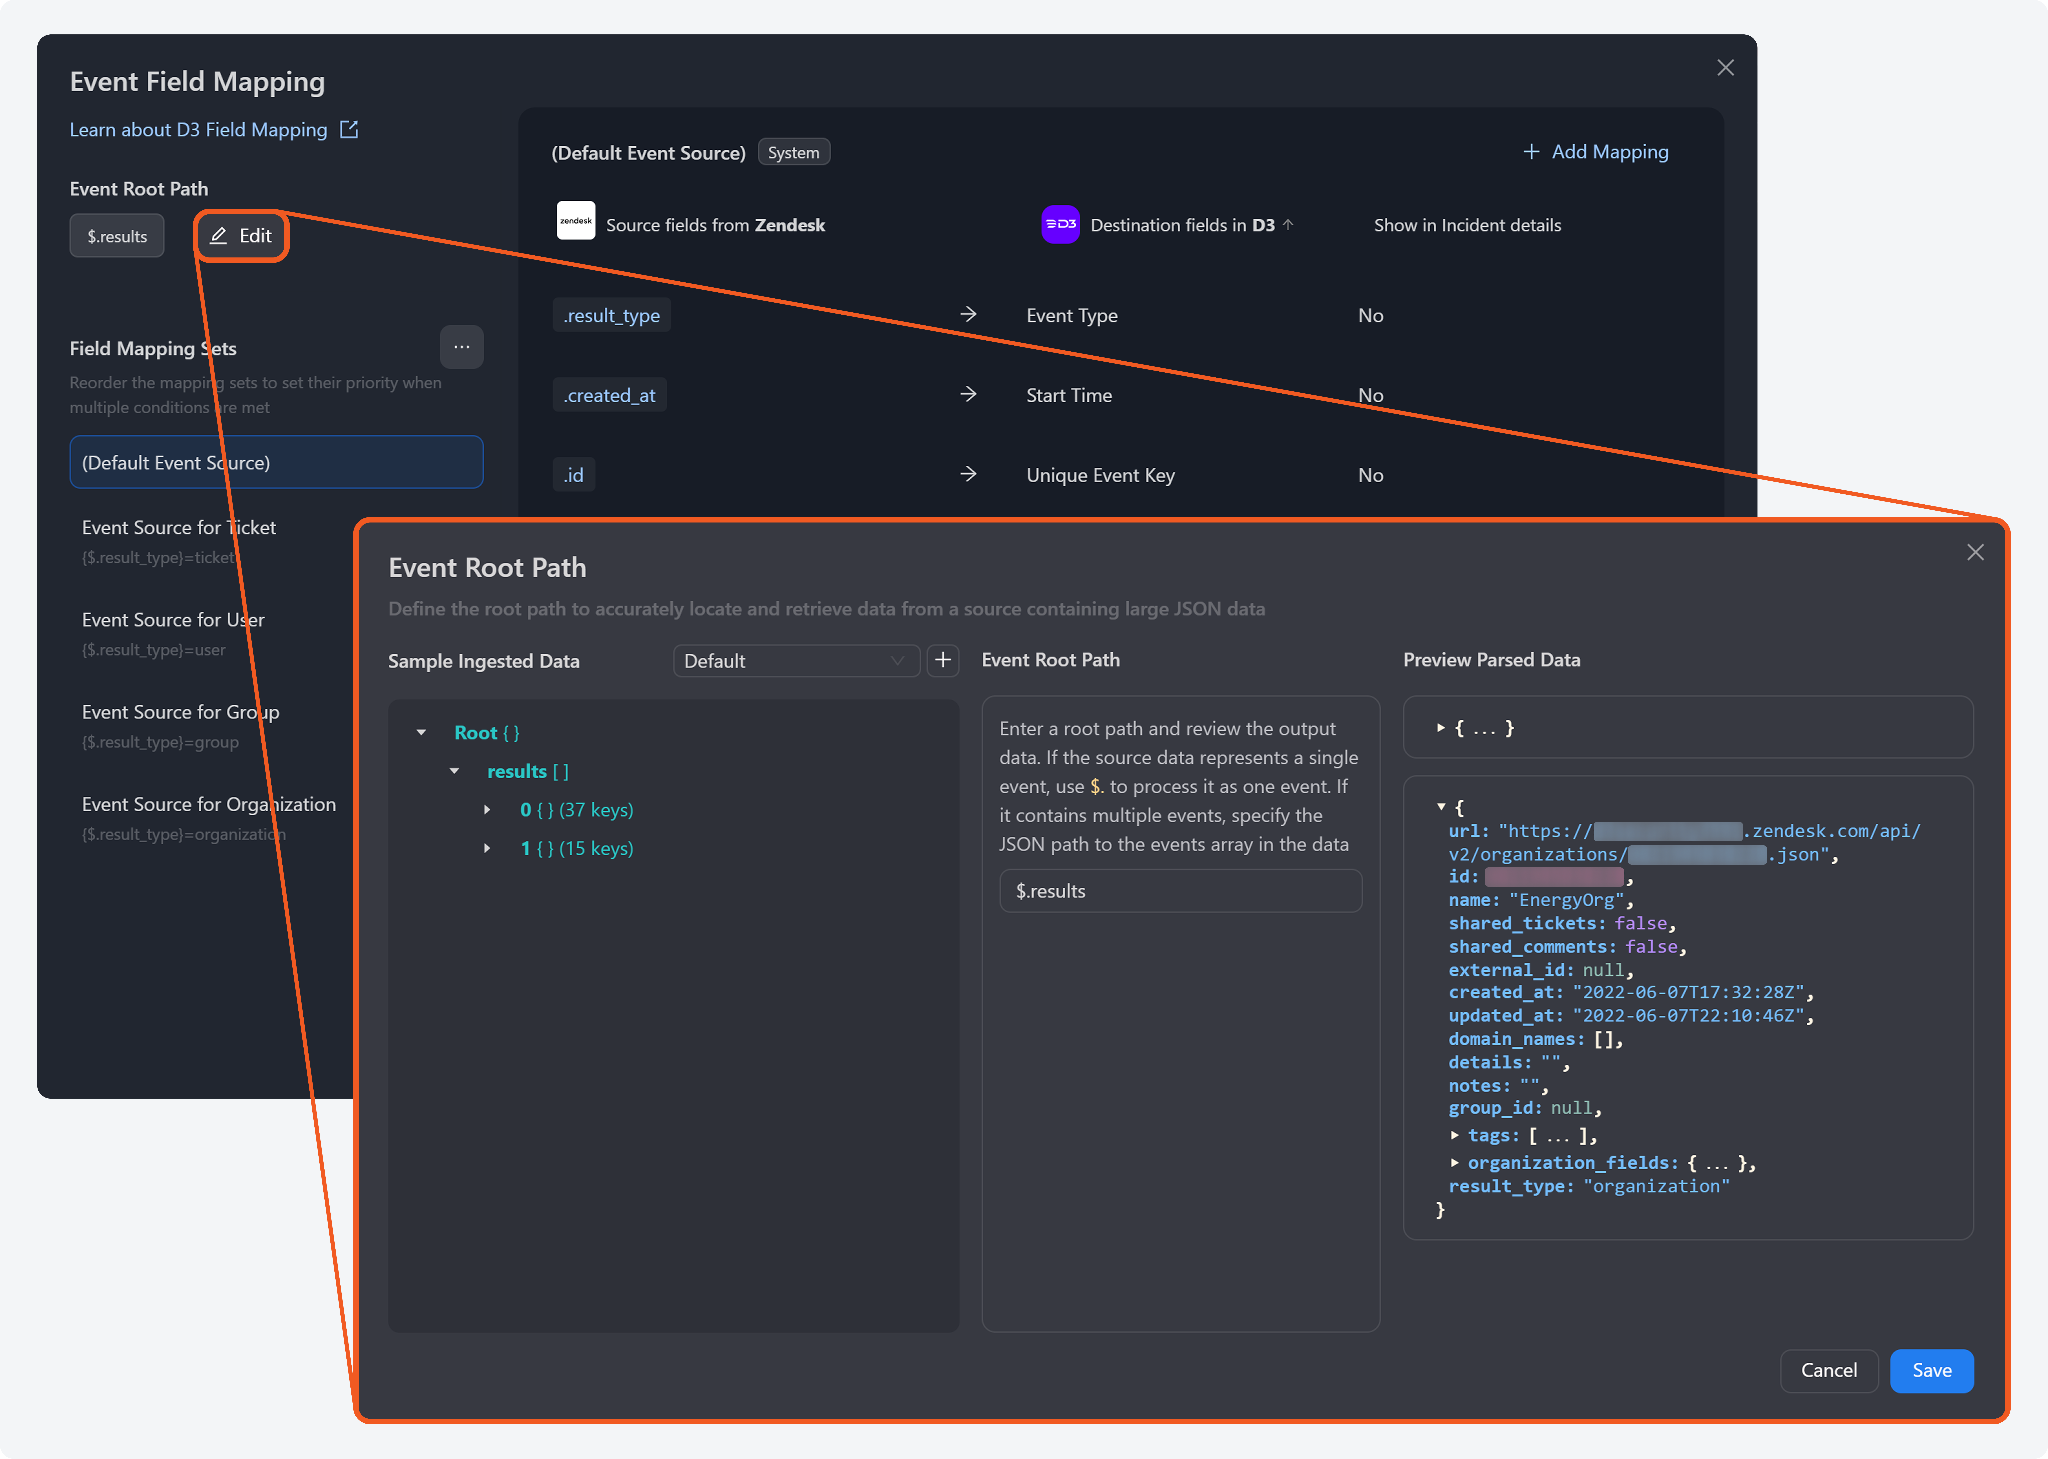
The Event Field Mapping UI has been redesigned to deliver a more modern and streamlined configuration experience. Event Source has been renamed to Field Mapping Sets, and Main Event JSON Path field has been renamed to Event Root Path. Users can now edit the Event Root Path through an interactive popover with sample ingested data and a dynamically rendered preview of parsed data.
Additional Date/Time Format Options
Two new date/time formats, YYYY-MM-DD (ISO 8601) and DD.MM.YYYY (European format), have been added to the Date/Time Format configuration, providing greater flexibility for regional and organizational requirements.
Incident Title Field for the Summary Widget
The Summary widget within the Reporting Dashboard module now supports adding Incident Title as a configurable field. This enables clearer identification of incidents within custom dashboards.
Utility Commands
New Commands
The following utility commands have been added to this release of D3 Autonomous SOC.
|
Commands |
Functionality |
|
Link Related Incidents |
Updates the Linked Incidents widget by linking an artifact to all related incidents identified through investigation merge relationships. Retrieves related investigations from the current investigation and links the artifact to each resolved incident. Unresolved incidents will be skipped and counted in the SkippedIncidents output. |
|
Generate AI Summary |
Generates a summary of the runtime incident processed by an investigation playbook. It is recommended to execute this command after aggregating results from upstream lineages, to capture the full investigation context. Incoming execution lineages are analyzed to generate a structured JSON output containing investigation context, key findings, attack-path analysis, and remediation guidance. |
|
Set Morpheus AI Attack Path Summary |
Updates an incident's Morpheus AI Summary widget (Summary section) with structured attack-path information. |
|
Set Morpheus AI Investigation Summary And Key Findings |
Updates an incident's Morpheus AI Summary widget (Summary section) with a title, summary, threat-confidence score, key findings, and threat intel verdict. |
|
Set Morpheus AI Remediation Suggestion |
Updates an incident's Morpheus AI Summary widget (Remediation Suggestion section) with a title and a description of response actions. |
|
Set Morpheus AI Attack Path Timeline |
Updates an incident's Morpheus AI Attack Path Timeline widget. |
|
Set Morpheus AI Graph |
Updates an incident's Morpheus AI Graph widget. |
|
Set Morpheus AI Incident Widgets |
Reduces playbook clutter by consolidating the above five utility commands into a single node, to update the following Morpheus AI widgets:
|
Integrations
New Integrations
The following integrations have been added to this release of D3 ASOC.
|
Integration Name |
Description |
|
Armis Centrix |
Armis Centrix is the cyber exposure management platform, powered by the Armis AI-driven Asset Intelligence Engine, which sees, secures, protects and manages billions of assets around the world in real time. Armis Centrix™ seamlessly connects with existing data sources to see, secure, protect, and manage all physical and virtual assets – from the ground to the cloud – ensuring the entire attack surface is both defended and managed in real time. |
|
BitSight |
BitSight is a security ratings platform that continuously measures an organization’s external cyber risk using outside-in data such as vulnerabilities, exposed credentials, and threat activity. It provides objective security ratings and insights to help organizations assess risk and monitor their own and third-party security posture. |
|
Gurucul |
The Gurucul Next-Gen SIEM is a modern platform for Security Information and Event Management (SIEM). It enables organizations to detect, investigate, and respond to cyber threats with greater efficiency than older, traditional SIEM tools. This platform is a component of Gurucul’s expansive REVEAL security analytics offering. REVEAL utilizes advanced analytics, a cloud-native architecture, and open integrations to provide security teams with comprehensive visibility across intricate environments. |
|
OPNsense |
OPNsense is an open-source, FreeBSD-based firewall and routing platform that provides stateful packet filtering, VPN, intrusion detection, traffic shaping, high availability, and two-factor authentication capabilities for securing network infrastructure. |
|
Sipgate |
Sipgate is a cloud-based communication platform that provides VoIP telephony, virtual phone numbers, and click-to-dial capabilities through a REST API. It enables organizations to manage voice communications, initiate outbound phone calls, and integrate telephony services into automated workflows. |
|
Team Dynamix ITSM |
TeamDynamix provides a cloud-based IT Service Management (ITSM) platform that integrates service delivery with project portfolio management on a single, no-code architecture. It is designed specifically to reduce administrative overhead and accelerate resolution times through heavy use of AI and automation. |
|
Trellix IVX Server |
Trellix Intelligent Virtual Execution (IVX) Server is an on-premises malware analysis and sandboxing appliance that analyzes suspicious files and URLs using static and dynamic analysis in virtual environments, then produces detailed threat reports for investigation and response. |
Updated Integrations
The following integrations have been updated in this release of D3 ASOC.
|
Integration Name |
Changes |
|
Microsoft Sentinel |
New Command
|
|
Cisco Umbrella Cloud Security |
New Commands
|
|
ConnectWise PSA |
New Commands
|
|
D3 Attack Path Discovery Integration |
New Commands
|
|
Github |
The second version of GitHub. New Commands
|
|
Atlassian Jira Software |
New Commands
|
|
Kaduu.io |
New Commands
|
|
LogPoint Director |
New Command
|
|
Microsoft Defender XDR |
New Commands
|
|
Pulsedive |
New Command
|
|
ServiceNow V2 |
New Command
|
|
SOC Radar Incident V3 |
New Command
|
|
SOCRadar Advanced Threat Intelligence |
SOCRadar rebranded SOCRadar Threat Analysis to SOCRadar Advanced Threat Intelligence. New Command
|