
17.3
New Features
Dashboard Auto-Refresh on New Events or Incidents
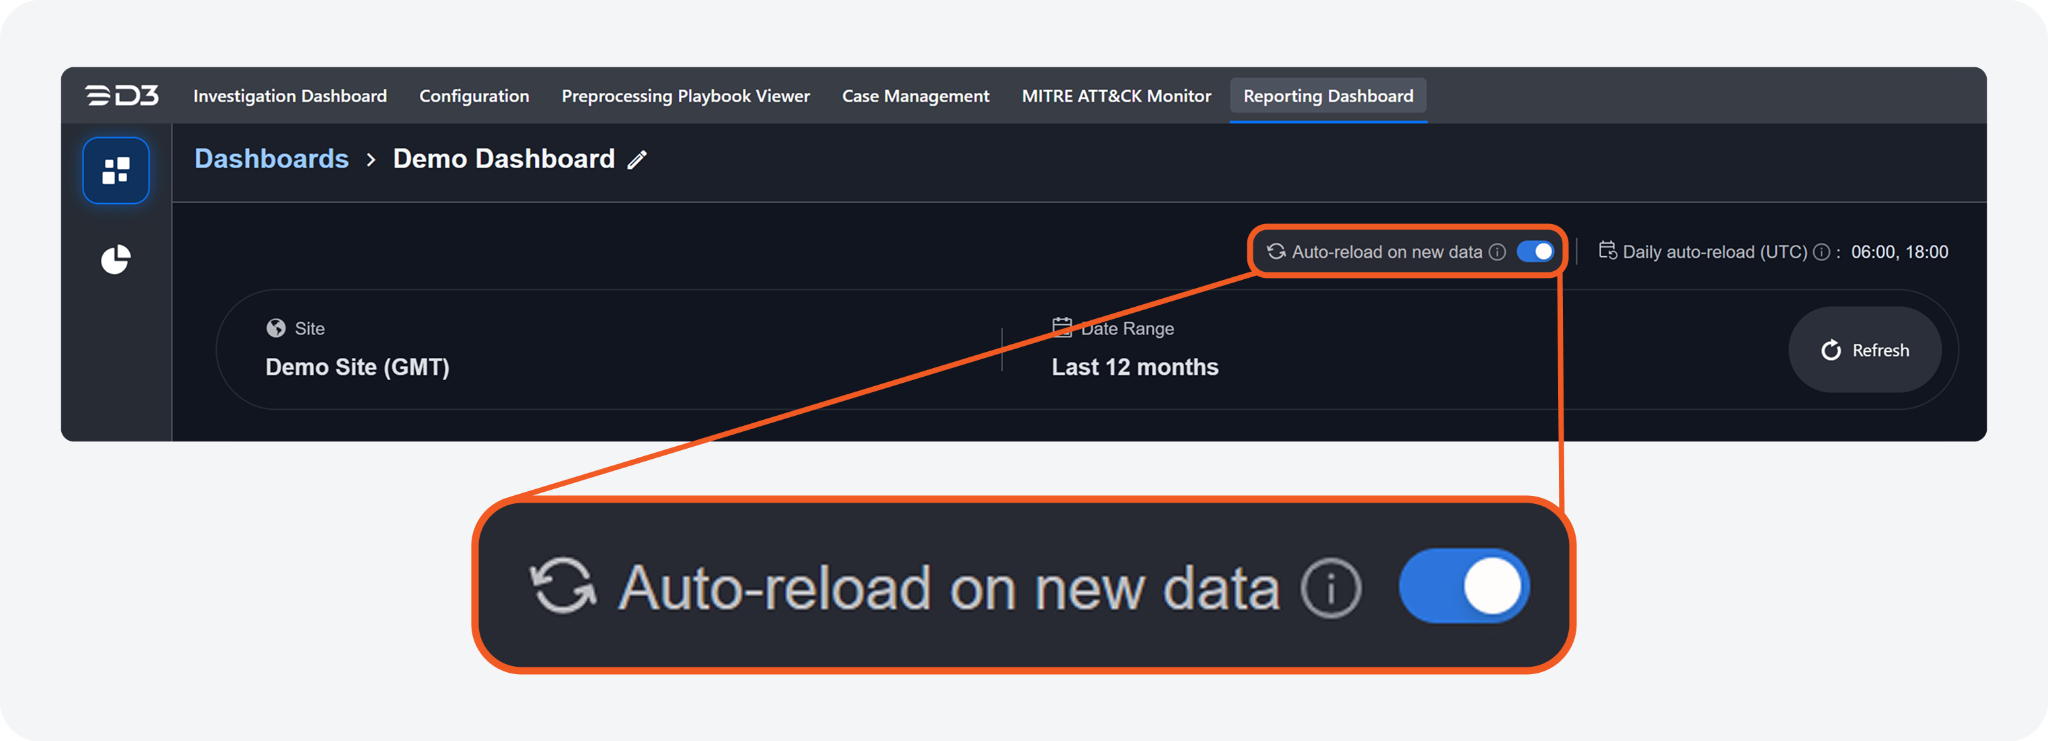
Previously, users were required to manually refresh the reporting dashboard, or click the -20250529-195945.png?inst-v=42f6df80-df0f-4ec4-af2e-6f907a55cc8f) button on a persistent "Dashboard Update Available" banner, to view new data. The dashboard now supports live auto-refresh, automatically updating widget visualizations when new events or incidents are detected. This behavior can be enabled via the new Auto-reload on new data toggle.
button on a persistent "Dashboard Update Available" banner, to view new data. The dashboard now supports live auto-refresh, automatically updating widget visualizations when new events or incidents are detected. This behavior can be enabled via the new Auto-reload on new data toggle.
New Permission Scope: Create New Tag
-20250529-195347.png?inst-v=42f6df80-df0f-4ec4-af2e-6f907a55cc8f)
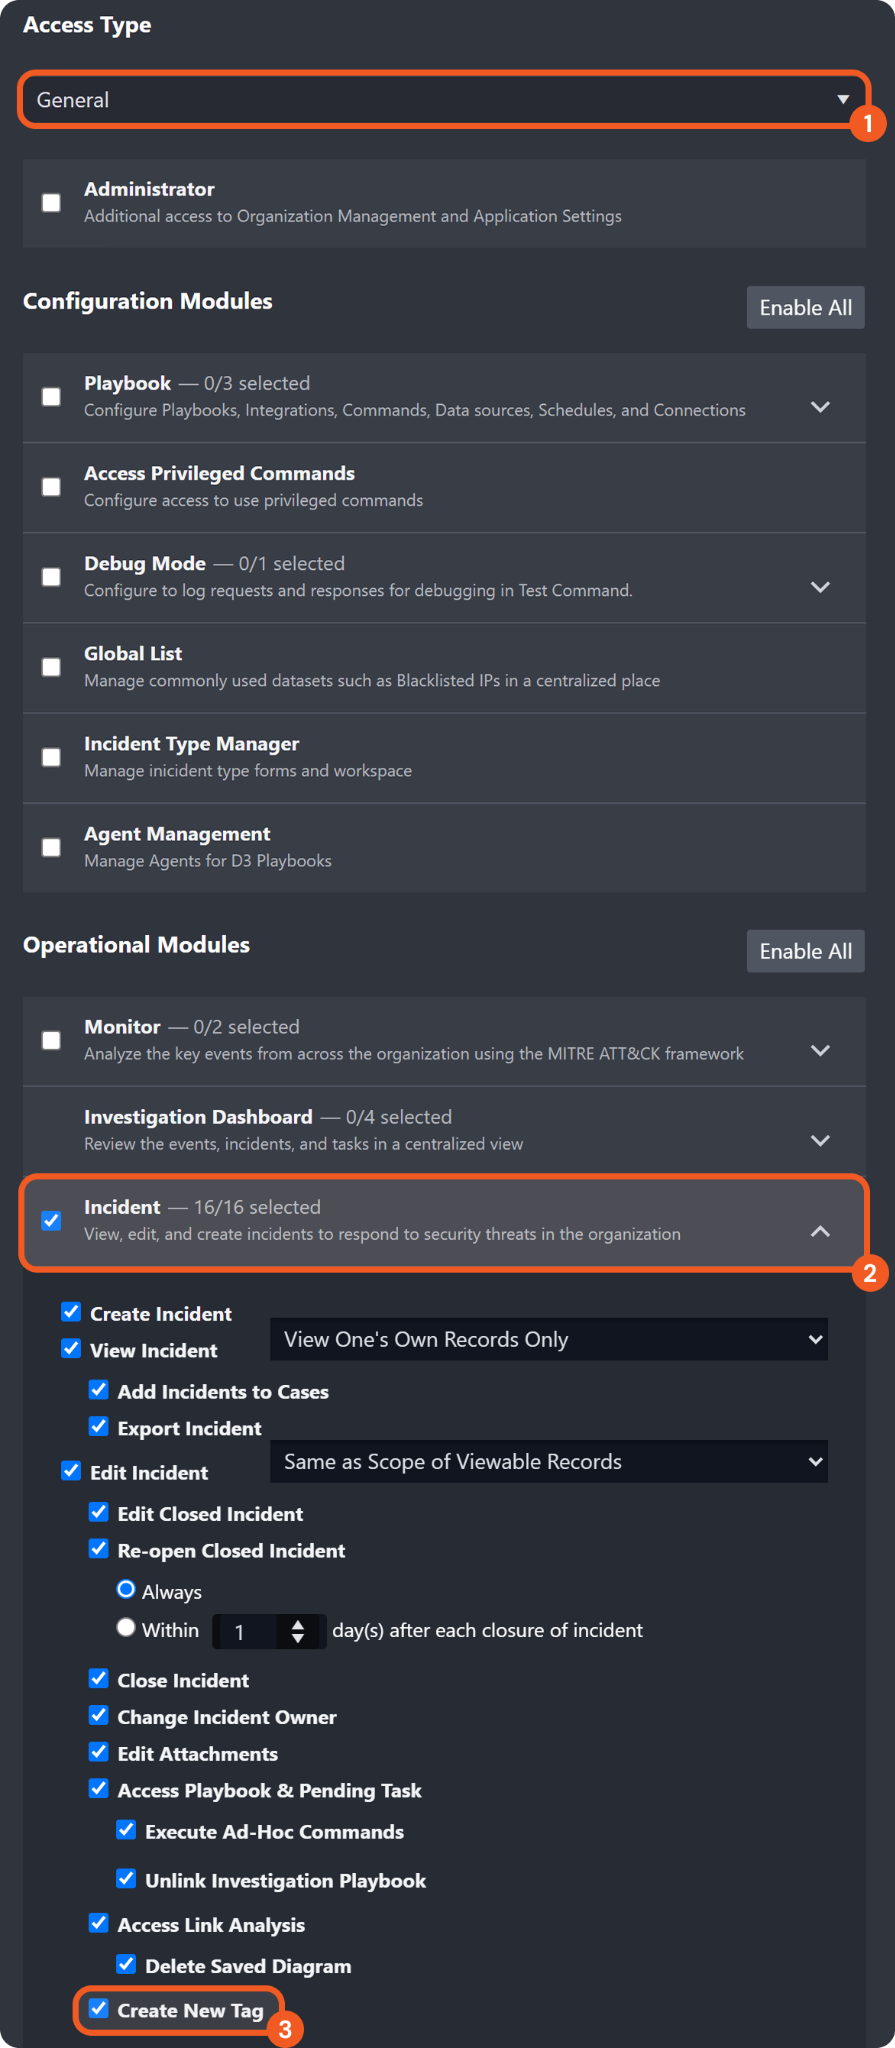
The ability to create new tags is now restricted to users with the Create New Tag permission. Users without this scope can still add tags to incidents from a predefined list.
Navigate to Configuration > Organization Management > Roles > [Select Role] > Details > Operational Modules > Incident.
Select the Create New Tag checkbox to grant the tag-creation permission to the selected role.
Retry Mechanism for Missing Events During Connectivity Interruptions
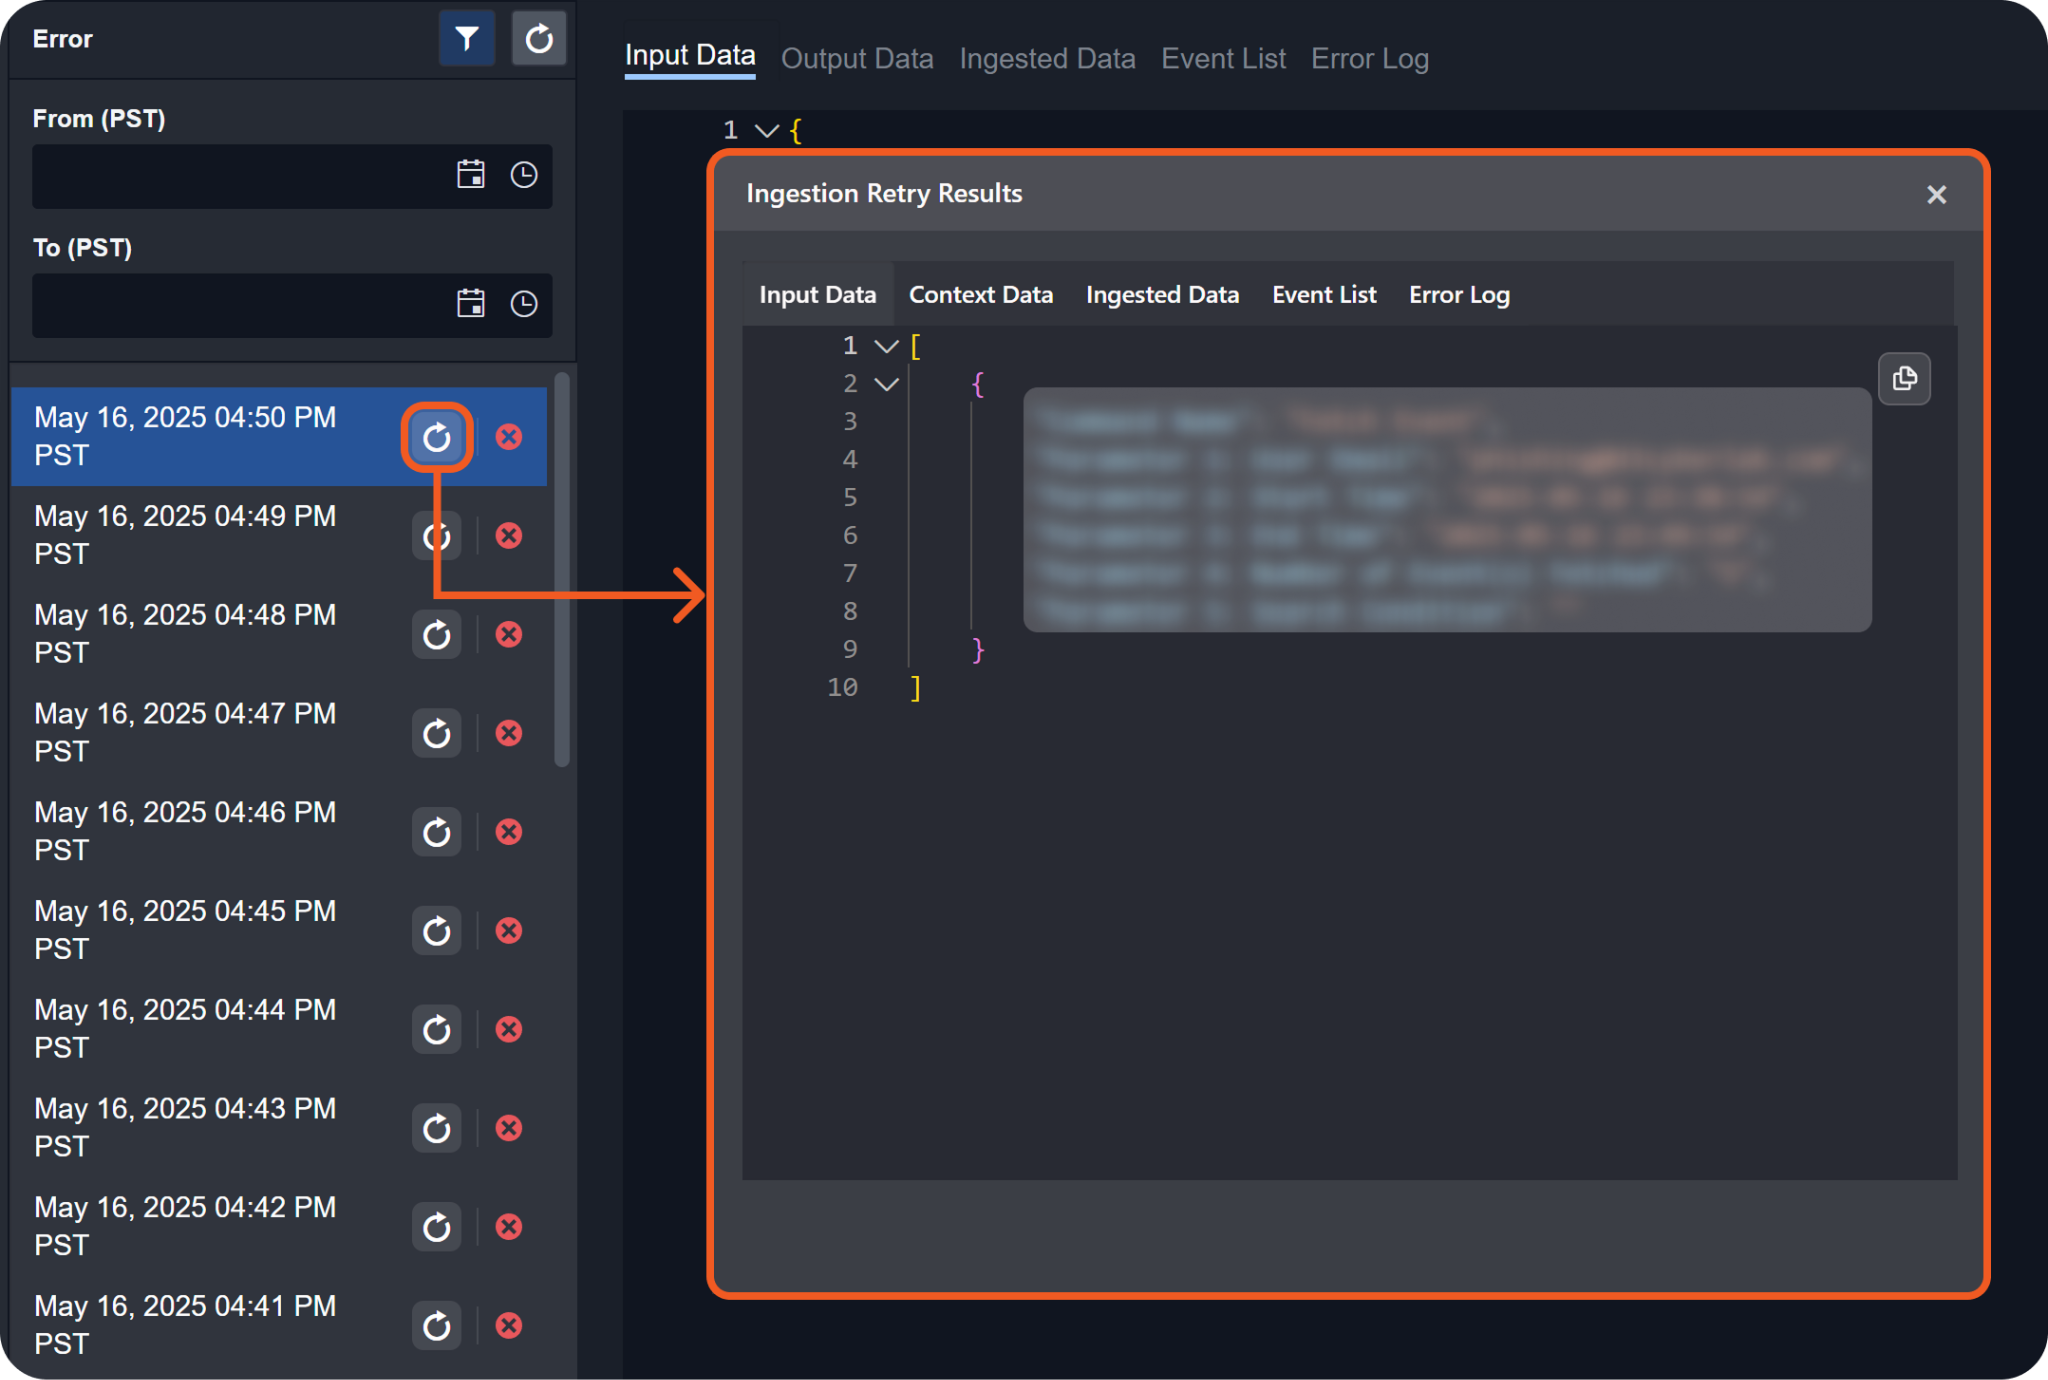
A new Retry mechanism enables automated retries during connectivity interruptions. It re-fetches event or incident data in chronological order, up to a user-defined limit, after the main ingestion job resumes normal operation.
Users can enable the retry mechanism for a new data ingestion job in the following steps:
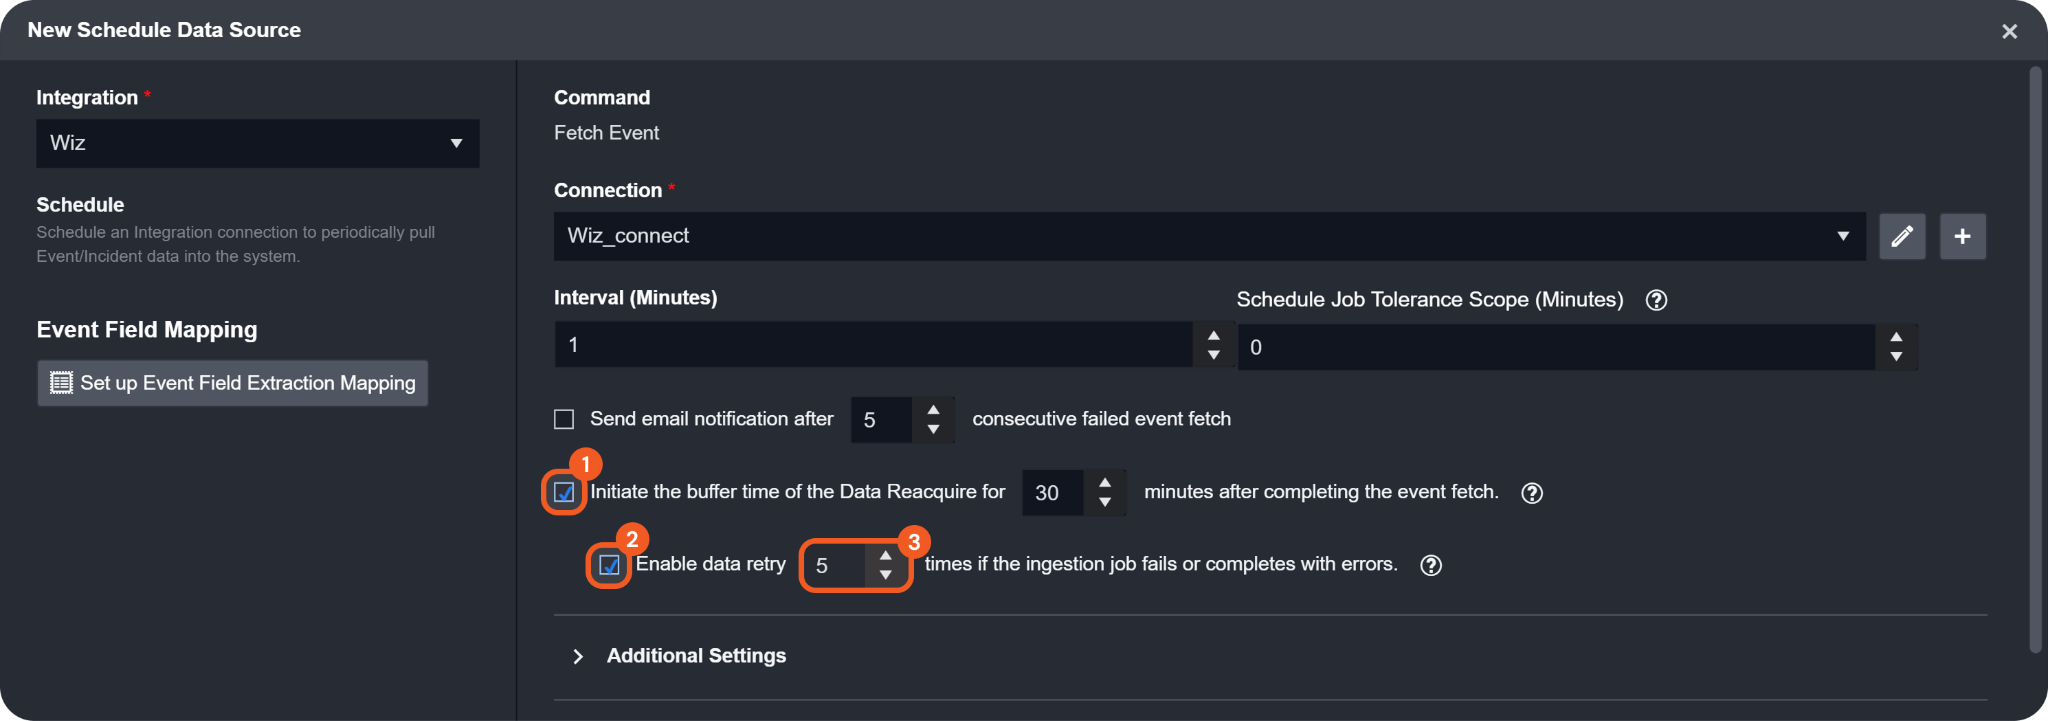
Select the Initiate the buffer time of the Data Reacquire for <number> minutes after completing the event fetch checkbox to display the retry mechanism checkbox.
Select the Enable data retry <number> times if the ingestion job fails or completes with errors checkbox to activate automated retries for fetching event or incident data.
(Optional) Configure the retry attempt limit (e.g., 5).
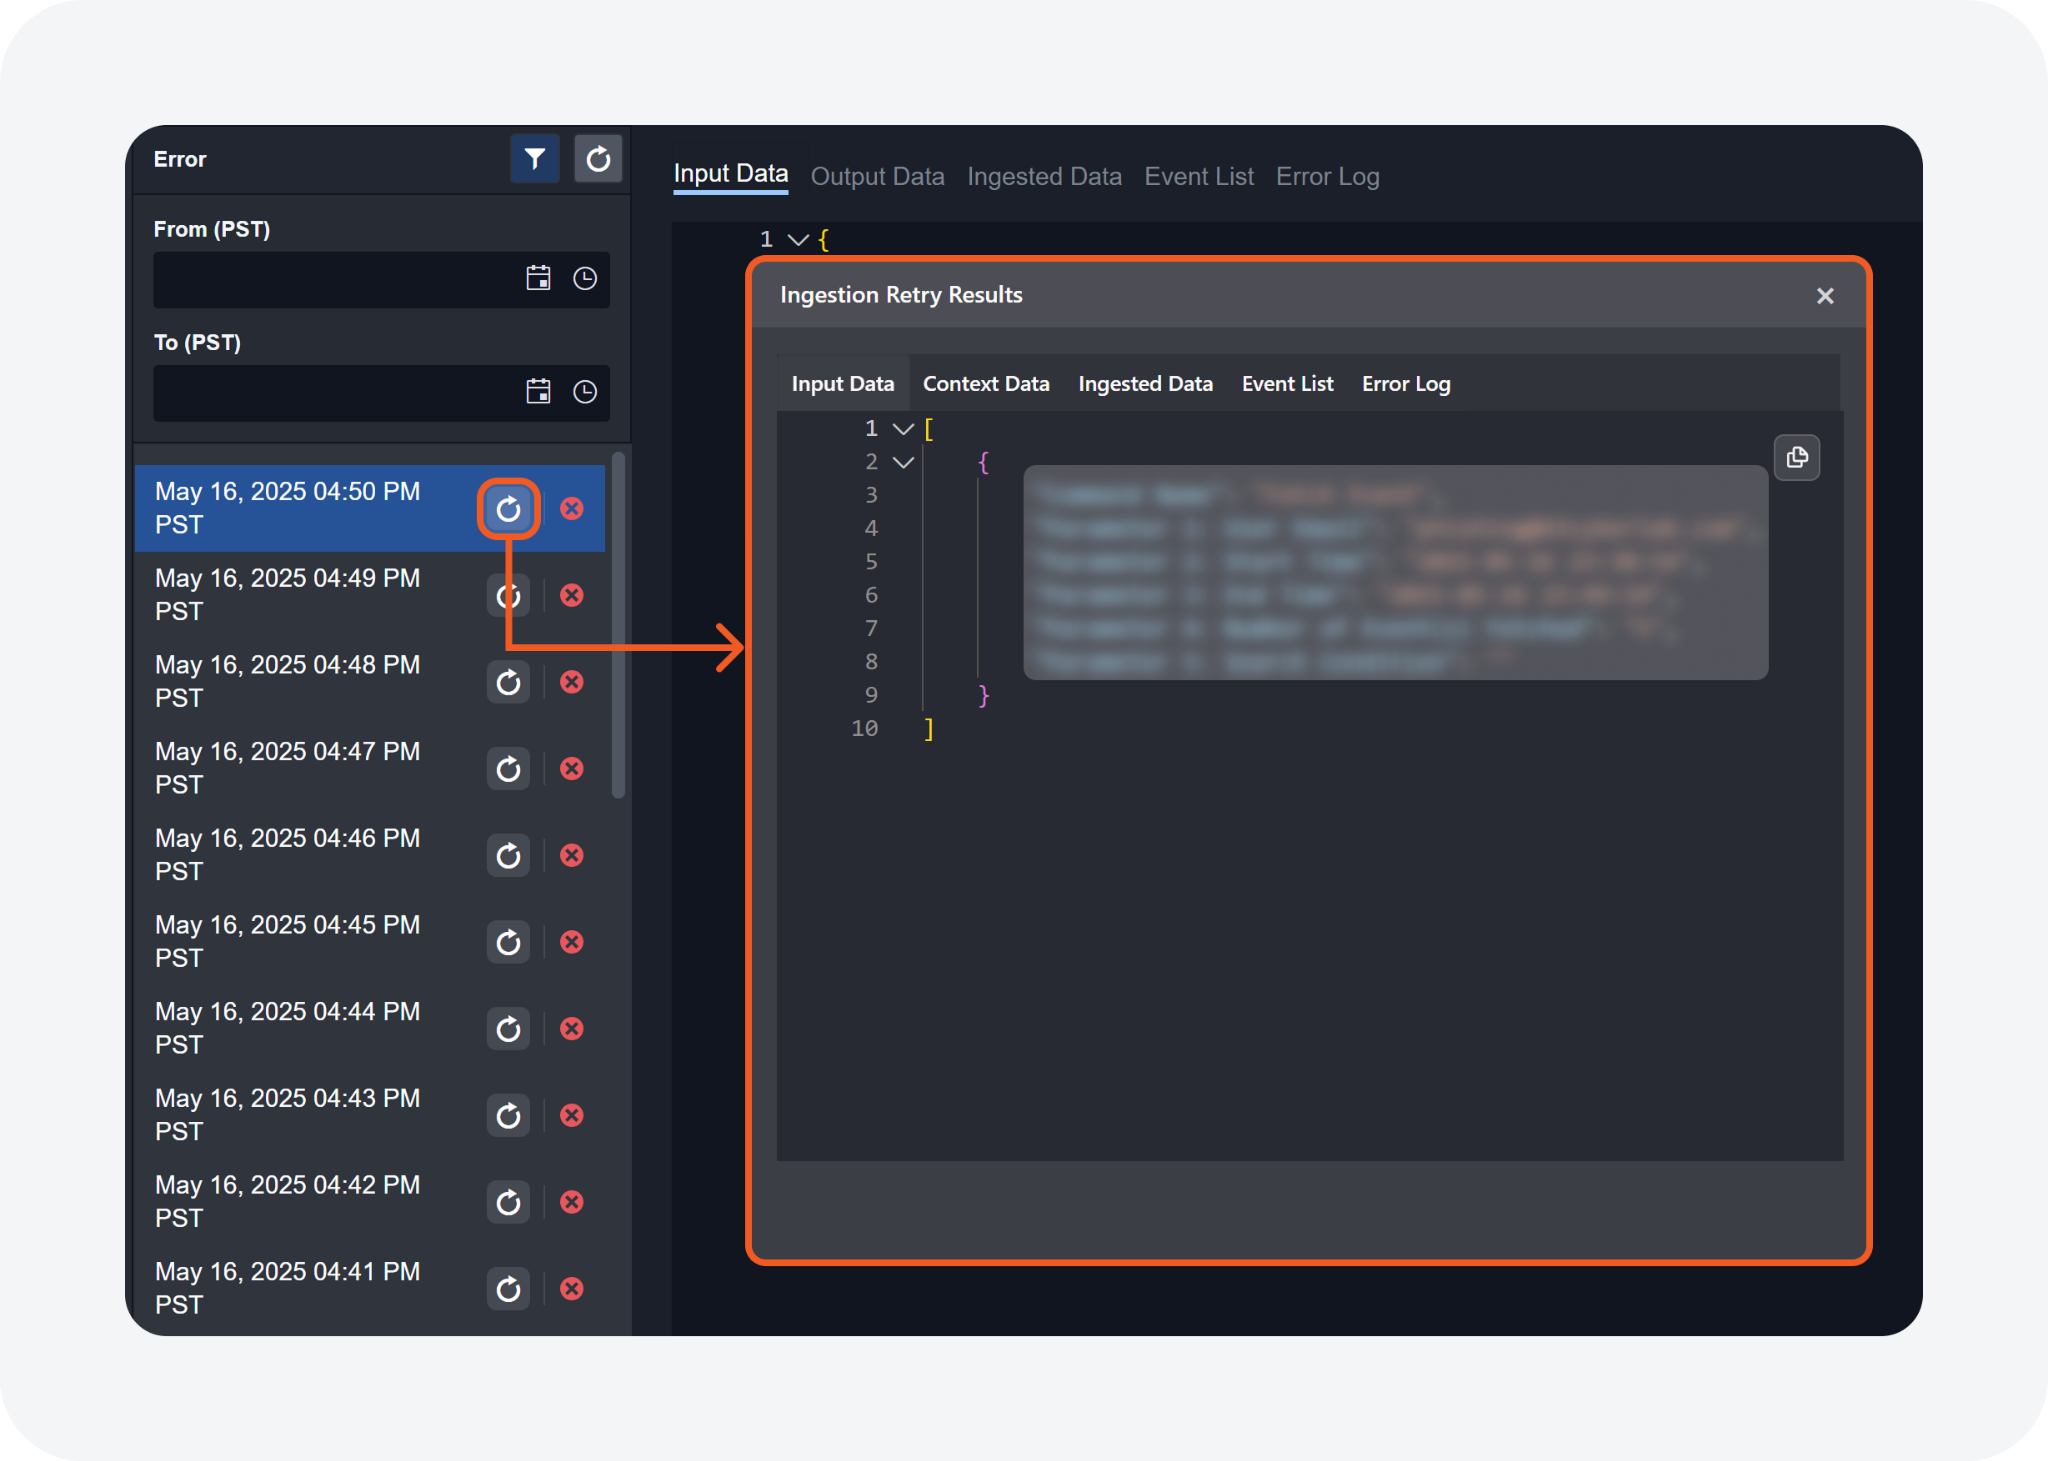
If an ingestion fails, the retry mechanism activates automatically. Users can view the retry results upon success by clicking the ![]() button.
button.
Enhancements
Email Reporting Across Multiple Sites
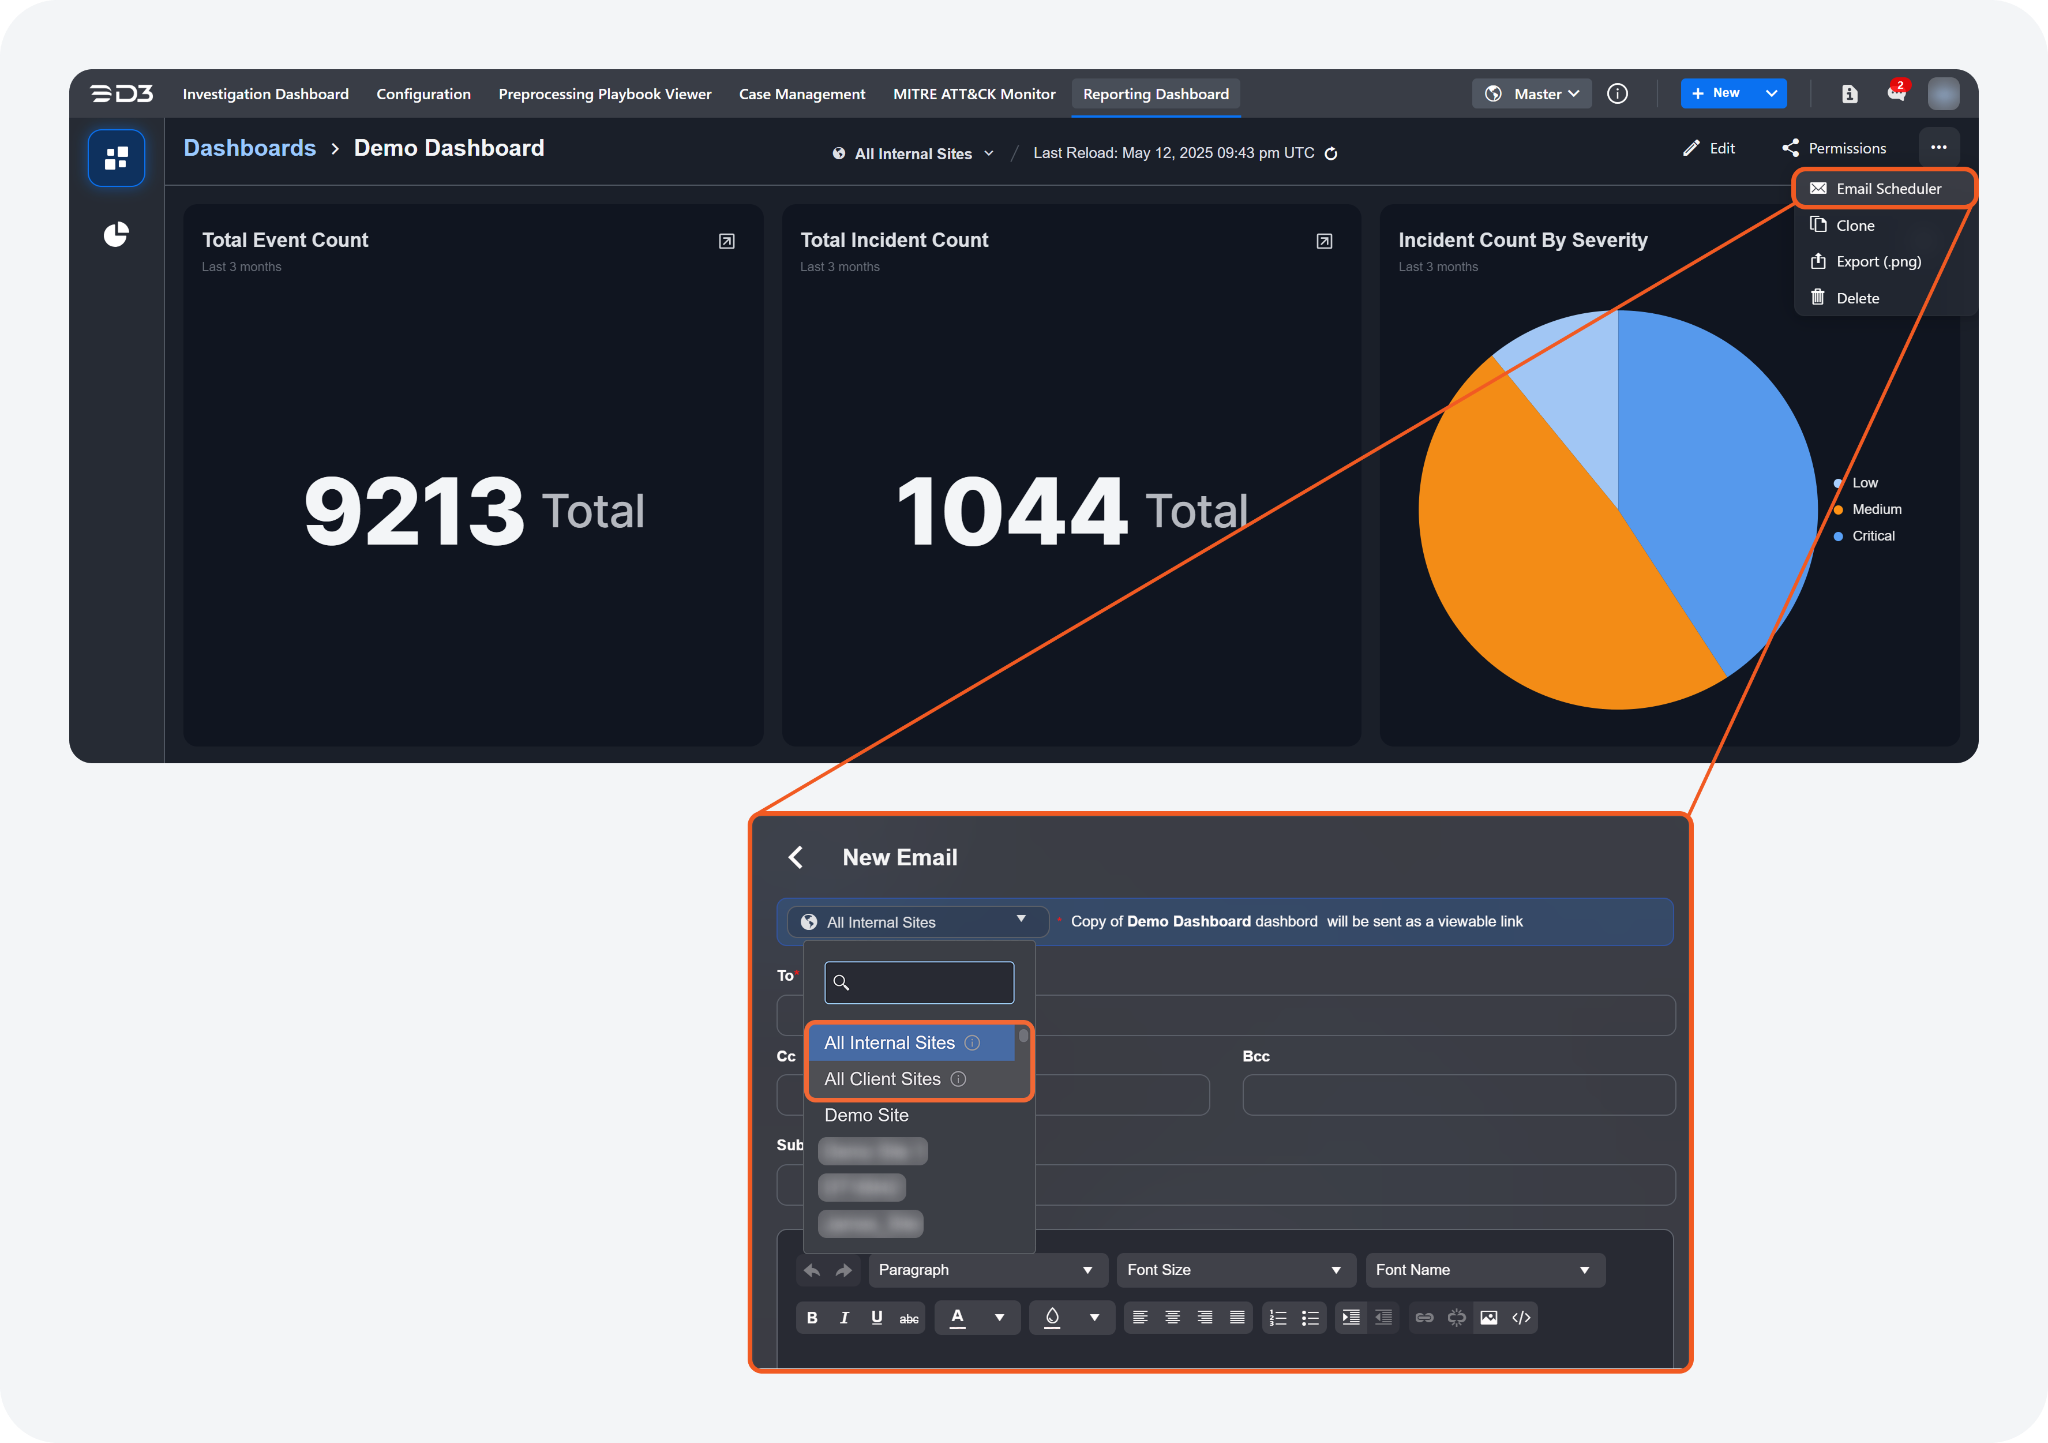
Previously, within the Reporting Dashboard module's Email Scheduler sub-feature, users had to create individual email schedules for each site, as there were no options to send a dashboard that included data from multiple sites. This enhancement introduces two new options, "All Internal Sites" and "All Client Sites," enabling users to distribute dashboards with data from all internal or client sites without needing to send them individually.
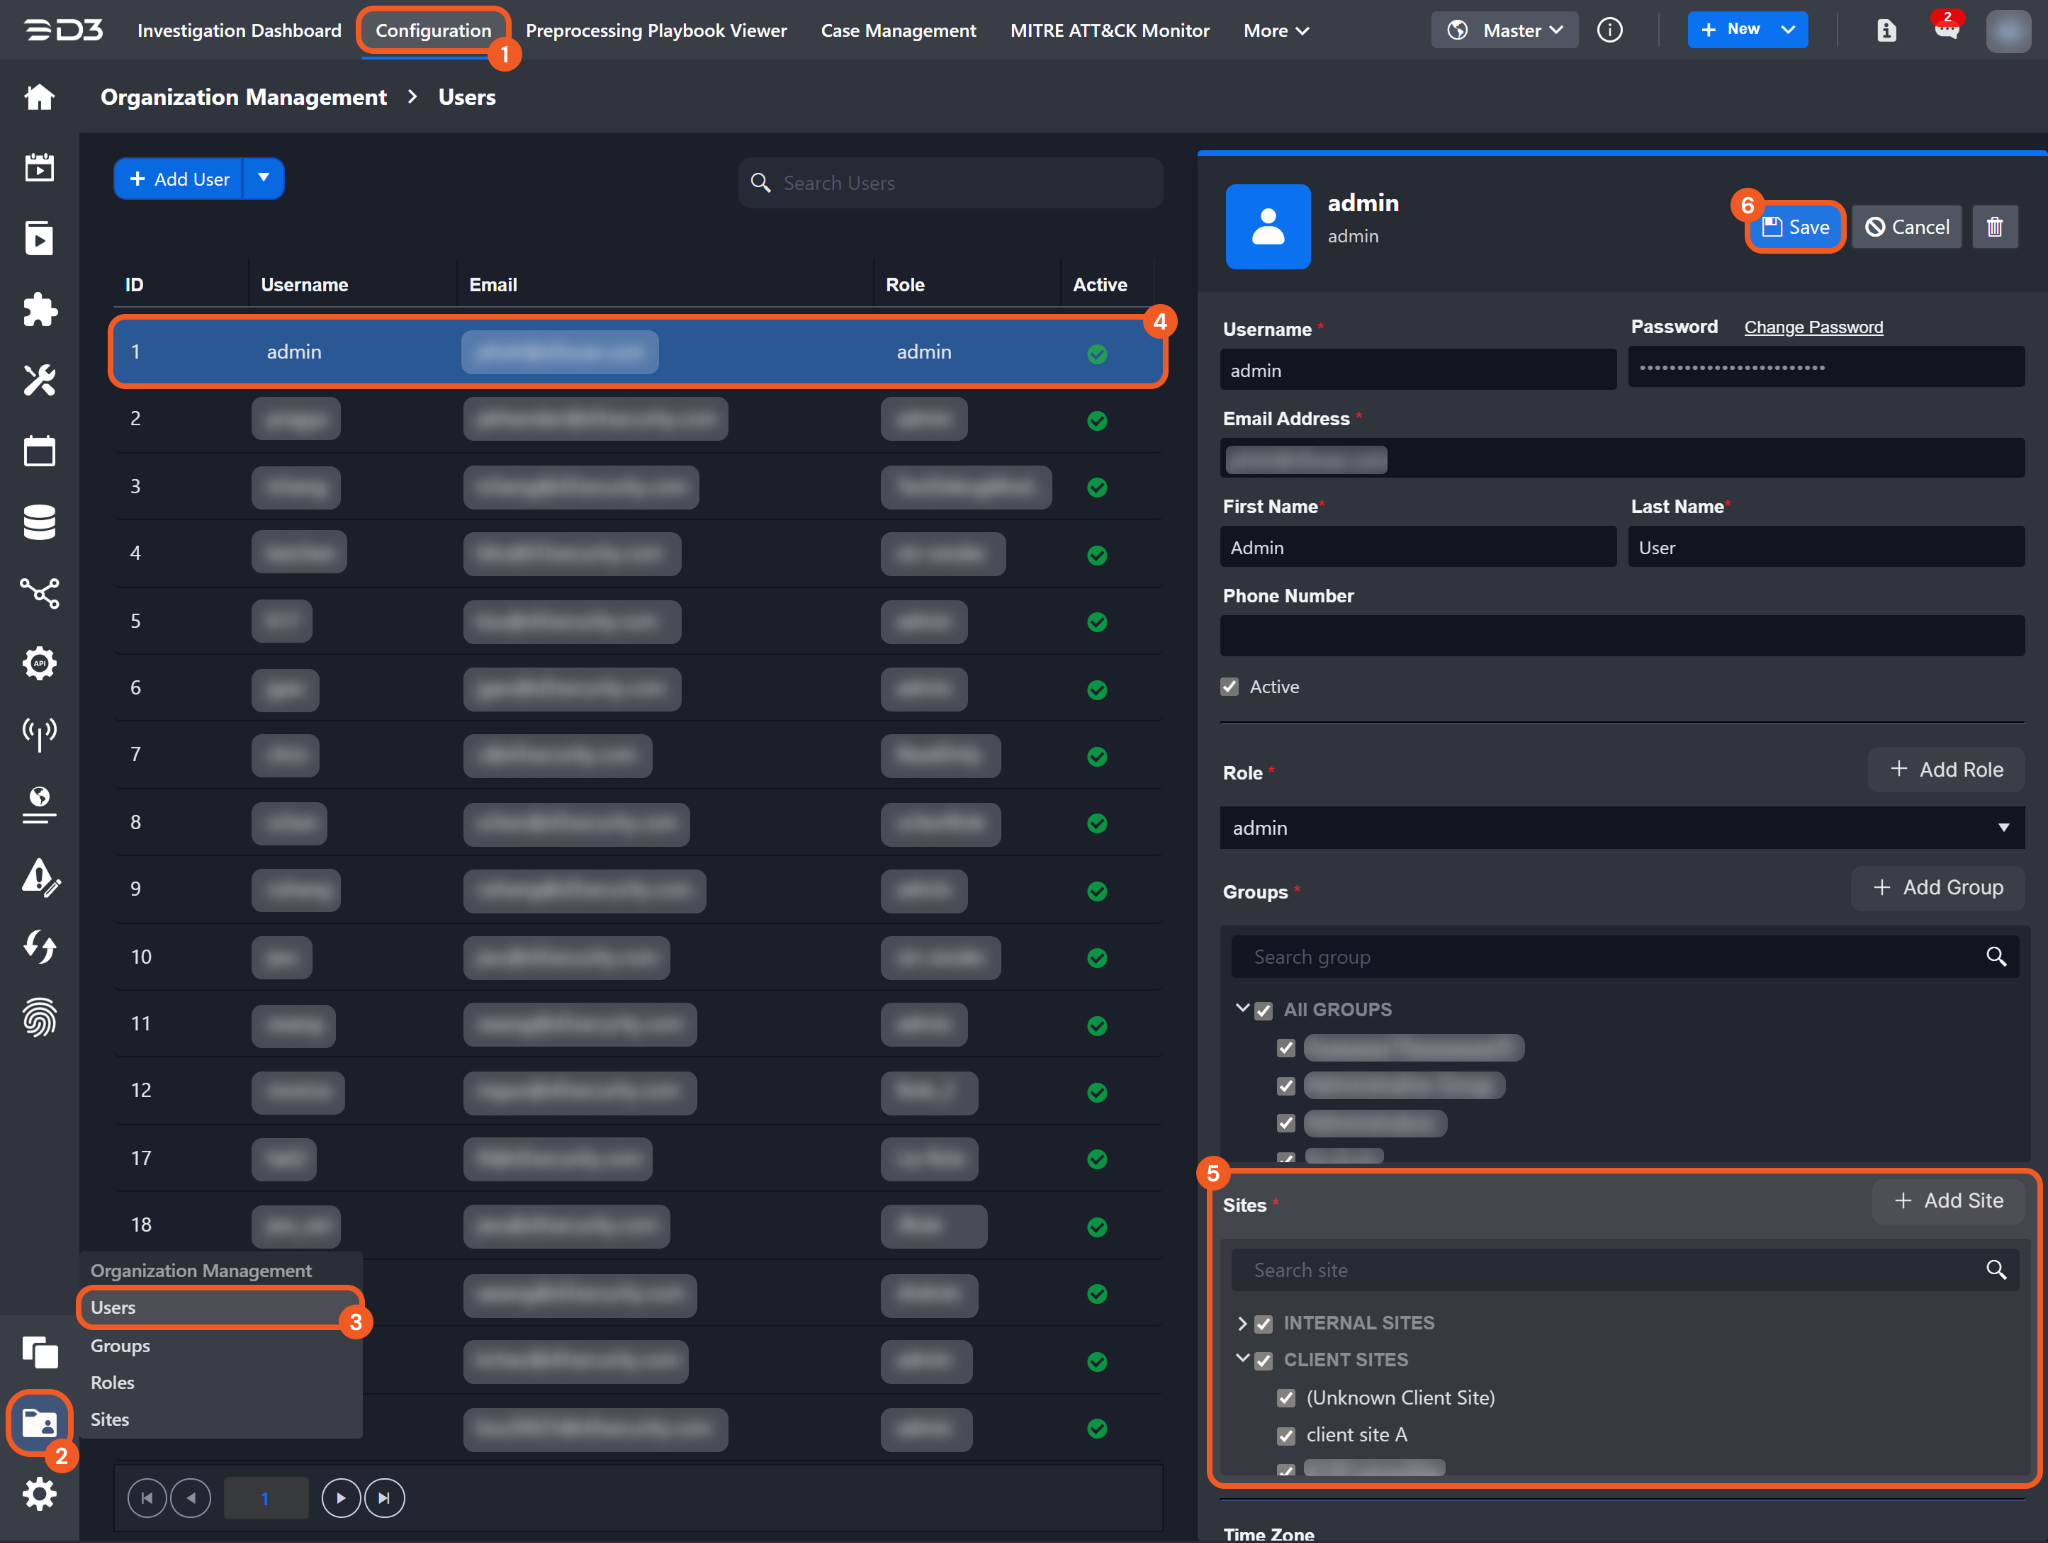
The "All Internal Sites" and "All Client Sites" options will include all sites the dashboard owner has access to at the moment the snapshot is generated. To adjust which sites are included in these options, the settings can be configured in the Organization Management > Users sub-module.
Access Control Applied to User-Based Dropdown Filters
User-related dropdown filters in the Reporting Dashboard have been enhanced to show only users associated with the selected site. This improvement simplifies the filtering process and makes it easier to find relevant users.
The improvement on the user-related dropdown filters works as follows:
Select a site to view the reporting dashboard.
Click the user-related filter (such as the Incident Owner filter) on a relevant widget.
Choose one or more users associated with the selected site to filter the displayed data.
Utility Commands
New Commands
The following utility commands have been added to this release of D3 SOAR.
Commands | Functionality |
Get JSON Of Current Event Automation Rules | Displays Event Automation rules in JSON format. Filters include rule type ("Escalation", "Dismissal", or "All") and the option to filter by active or both active and inactive rules. By default, it retrieves both rule types and only includes active rules. |
Integrations
Updated Integrations
The following integrations have been updated in this release of D3 SOAR.
Integration Name | Changes |
Cisco Identity Services Engine | New Commands
|
Cortex XDR | New Commands
Enhanced Command(s)
|
Freshservice | Enhanced Command(s)
|
Google Drive | Enhanced Command Upload Files: Users can now upload files from vSOC to a specific folder using the Parent Folder ID parameter. |
Microsoft Entra ID Protection (Azure AD Identity Protection) | Enhanced Command Fetch Event: Added the Risk Users dropdown option to the Event Type parameter for the newly added Event Source for Risk User event source. |
Office 365 | Enhanced Command Fetch Events: Revised the display names for the following built-in field mappings (source fields):
|
Stamus Clear NDR | New Command Fetch Incidents |
Wiz | Enhanced Command Fetch Event: Updated the command to align with recent API changes. |