Skip table of contents

CODA Footprint

LAST UPDATED: 02/15/2024

Overview

CODA Footprint is an AI-based, cloud-agnostic, cyber security platform by CODA Intelligence, designed to take the cost and complexity out of vulnerability management for the SMB market.

D3 SOAR is providing REST operations to function with CODA Footprint.

CODA Footprint is available for use in:

D3 SOAR

V15.2.12.0+

Category

Threat Intelligence

Deployment Options

Option II, Option IV

Connection

To connect to CODA Footprint from D3 SOAR, please follow this part to collect the required information below:

Parameter

Description

Example

Server URL

The server URL of the integration.

https://<Replace.Me>

User Name

The user name for authentication. This is an email address used to log in to CODA Cloud.

test@example.com

Password

The password for authentication.

PassW0rd!

Permission Requirements

Each endpoint in the CODA Footprint API requires a certain permission scope. The following are required scopes for the commands in this integration:

Command

Required Permission

Get Technical Context

Administrator, Management, Operations or Reporting

List Current Targets Ports

Administrator, Management, Operations or Reporting

List Device Attack Avenues

Administrator, Management, Operations or Reporting

List Device Network Connections

Administrator, Management, Operations or Reporting

List Devices

Administrator, Management, Operations or Reporting

List Device Users

Administrator, Management, Operations or Reporting

List Device Vulnerabilities

Administrator, Management, Operations or Reporting

List Scanners

Administrator, Management, Operations or Reporting

List Scan Surfaces

Administrator, Management, Operations or Reporting

List Technical Contexts

Administrator, Management, Operations or Reporting

List Tenants

Administrator, Management, Operations or Reporting

Patch Rescan

Administrator, Management, Operations or Reporting

Update Target Scan Scope

Administrator, Management, Operations or Reporting

Test Connection

Administrator, Management, Operations or Reporting

Configuring D3 SOAR to Work with CODA Footprint

  1. Log in to D3 SOAR.

  2. Find the CODA Footprint integration.

    1. Navigate to Configuration on the top header menu.

    2. Click on the Integration icon on the left sidebar.

    3. Type CODA Footprint in the search box to find the integration, then click it to select it.

    4. Click + New Connection, on the right side of the Connections section. A new connection window will appear.

  3. Configure the following fields to create a connection to CODA Footprint.

    1. Connection Name: The desired name for the connection.

    2. Site: Specifies the site to use the integration connection. Use the drop-down menu to select the site. The Share to Internal Sites option enables all sites defined as internal sites to use the connection. Selecting a specific site will only enable that site to use the connection.

    3. Recipient site for events from connections Shared to Internal Sites: This field appears if you selected Share to Internal Sites for Site to let you select the internal site to deploy the integration connection.

    4. Agent Name (Optional): Specifies the proxy agent required to build the connection. Use the dropdown menu to select the proxy agent from a list of previously configured proxy agents.

    5. Description (Optional): Add your desired description for the connection.
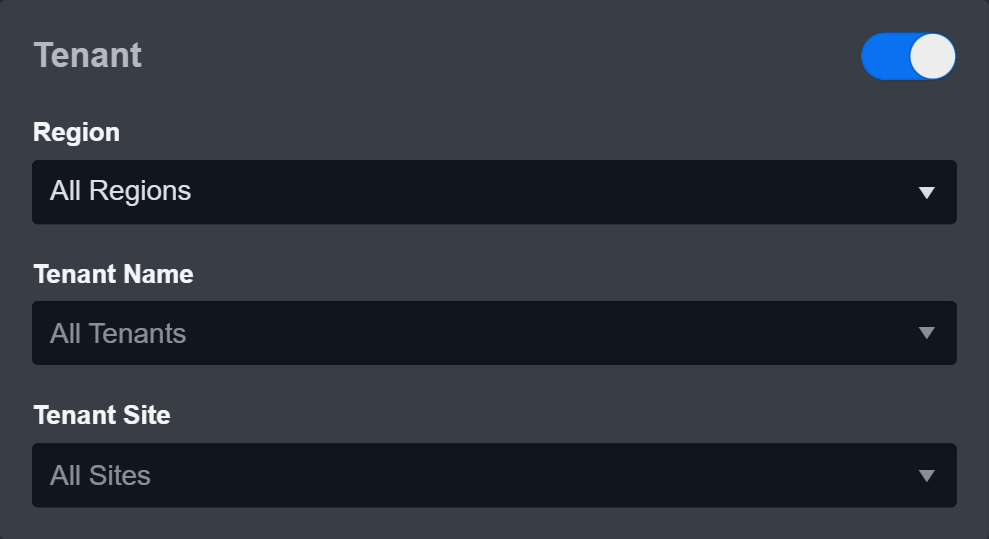
    6. Configure User Permissions: Defines which users have access to the connection.

    7. Active: Check the tick box to ensure the connection is available for use.

    8. System: This section contains the parameters defined specifically for the integration. These parameters must be configured to create the integration connection.
      1. Input your domain level Server URL.
      2. Input your User Name.
      3. Input your Password.

    9. Connection Health Check: Updates the connection status you have created. A connection health check is done by scheduling the Test Connection command of this integration. This can only be done when the connection is active.
      To set up a connection health check, check the Connection Health Check tickbox. You can customize the interval (minutes) for scheduling the health check. An email notification can be set up after a specified number of failed connection attempts.

    10. Enable Password Vault: An optional feature that allows users to take the stored credentials from their own password vault. Please refer to the password vault connection guide if needed.

  4. Test the connection.

    1. Click Test Connection to verify the account credentials and network connection. If the Test Connection Passed alert window appears, the test connection is successful. You will see Passed with a green checkmark appear beside the Test Connection button. If the test connection fails, please check your connection parameters and try again.

    2. Click OK to close the alert window.

    3. Click + Add to create and add the configured connection.

Commands

CODA Footprint includes the following executable commands for users to set up schedules or create playbook workflows. With the Test Command, you can execute these commands independently for playbook troubleshooting.

Integration API Note

For more information about the CODA Footprint API, please refer to the CODA Footprint API reference.

READER NOTE

Certain permissions are required for each command. Please refer to the Permission Requirements for details.

Get Technical Context

Returns details of a specified technical context.

READER NOTE

Context ID is a required parameter to run this command.

  • Run the List Technical Contexts command to obtain Context ID. Context IDs can be found in the returned raw data at the path $.items[*].id.

Footprint Tenant ID is an optional parameter to run this command.

  • Run the List Tenants command to obtain Footprint Tenant ID. Footprint Tenant IDs can be found in the returned raw data at the path $.[*].id.

Input

Input Parameter

Required/Optional

Description

Example

Context ID

Required

The Context ID to return details. Context IDs can be obtained using the List Technical Contexts command.

***

Footprint Tenant ID

Optional

The Tenant ID to receive a request for. If this parameter is not defined, the original_tenant_id from the auth endpoint will be the default value.

1

Output

Raw Data

The primary response data from the API request.

SAMPLE DATA

CODE
{
    "id": ***,
    "name": "***- Status",
    "created": "2022-04-05 19:09:50.562404+00:00",
    "modified": "2022-08-18 10:04:13.486480+00:00",
    "createdBy": "Footprint",
    "ownerGroupId": null,
    "ownerUserId": null,
    "type": "ts",
    "isAutomaticallyGenerated": true,
    "icon": null,
    "technicalContexts": [],
    "info": {
        "levels": {
            "critical": 0,
            "vulnerable": 50,
            "nonvisible": 0,
            "secure": 50
        },
        "components": {
            "ts": [],
            "applications": []
        },
        "applications": 10,
        "applicationsUp": 4,
        "uptime": 100,
        "icon": null
    },
    "state": "vulnerable",
    "extra": {
        "alerts": [],
        "graphs": []
    }
}
Return Data

Indicates one of the possible command execution states: Successful or Failed.

The Failed state can be triggered by any of the following errors:

  • A connection issue with the integration

  • The API returned an error message

  • No response from the API

You can view more details about an error in the Error tab.

Return Data can be passed down directly to a subsequent command or used to create conditional tasks in playbooks.

SAMPLE DATA

CODE
Successful
Result

Provides a brief summary of outputs in an HTML formatted table.

SAMPLE DATA

Applications

10

Applications Up

10

Uptime

30.797406402645084%

Security State

vulnerable

Error Handling

If the Return Data is Failed, an Error tab will appear in the Test Result window.

The error tab contains the details responded from D3 SOAR or third-party API calls, including Failure Indicator, Status Code, and Message. This can help you locate the root cause of a command failure.

Parts in Error

Description

Example

Failure Indicator

Indicates the command failure that happened at a specific input and/or API call.

Get Technical Context failed.

Status Code

The response code issued by the third-party API server or the D3 SOAR system that can be used to locate the corresponding error category. For example, if the returned status code is 401, the selected connection is unauthorized to run the command. The user or system support would need to check the permission setting in the CODA Footprint portal. Refer to the HTTP Status Code Registry for details.

Status Code: 404.

Message

The raw data or captured key error message from the integration API server about the API request failure.

Message: Not Found.

Error Sample Data

Get Technical Context failed.

Status Code: 404.

Message: Not Found.

List Current Targets Ports

Retrieves user input, current targets, and port.

READER NOTE

Footprint Tenant ID is an optional parameter to run this command.

  • Run the List Tenants command to obtain Footprint Tenant ID. Footprint Tenant IDs can be found in the returned raw data at the path $.[*].id.

Input

Input Parameter

Required/Optional

Description

Example

Page

Optional

The index of the page to request. If this parameter is not defined, the first page will be returned.

1

Footprint Tenant ID

Optional

The Tenant ID to receive a request for. If this parameter is not defined, the original_tenant_id from the auth endpoint will be the default value.

1

Output

Raw Data

The primary response data from the API request.

SAMPLE DATA

CODE
{
    "page": 1,
    "totalPages": 1,
    "totalCount": 4,
    "items": [
        {
            "userInput": "1.1.1.1/24",
            "ipAddress": "1.1.1.1.1",
            "portTransportProtocolList": [
                {
                    "port": 53,
                    "transportProtocol": "tcp"
                },
                {
                    "port": 80,
                    "transportProtocol": "tcp"
                },
                {
                    "port": 53,
                    "transportProtocol": "udp"
                }
            ]
        },
        {
            "userInput": "1.1.1.1/24",
            "ipAddress": "1.1.1.1.2",
            "portTransportProtocolList": [
                {
                    "port": 22,
                    "transportProtocol": "tcp"
                },
                {
                    "port": 8443,
                    "transportProtocol": "tcp"
                },
                {
                    "port": 123,
                    "transportProtocol": "udp"
                },
                {
                    "port": 8888,
                    "transportProtocol": "tcp"
                }
            ]
        }
    ]
}
Key Fields

Common cyber security indicators such as unique IDs, file hash values, CVE numbers, IP addresses, etc., will be extracted from Raw Data as Key Fields.
The system stores these key fields in the path $.[playbookTask].outputData. You can use these key-value pairs as data points for playbook task inputs.

SAMPLE DATA

CODE
{
    "IPs": [
        "1.1.1.1.1",
        "1.1.1.1.2"
    ]
}
Return Data

Indicates one of the possible command execution states: Successful or Failed.

The Failed state can be triggered by any of the following errors:

  • A connection issue with the integration

  • The API returned an error message

  • No response from the API

You can view more details about an error in the Error tab.

Return Data can be passed down directly to a subsequent command or used to create conditional tasks in playbooks.

SAMPLE DATA

CODE
Successful
Result

Provides a brief summary of outputs in an HTML formatted table.

SAMPLE DATA

currentPage

1

totalPages

1

totalCount

4

Error Handling

If the Return Data is Failed, an Error tab will appear in the Test Result window.

The error tab contains the details responded from D3 SOAR or third-party API calls, including Failure Indicator, Status Code, and Message. This can help you locate the root cause of a command failure.

Parts in Error

Description

Example

Failure Indicator

Indicates the command failure that happened at a specific input and/or API call.

List Current Targets Ports failed.

Status Code

The response code issued by the third-party API server or the D3 SOAR system that can be used to locate the corresponding error category. For example, if the returned status code is 401, the selected connection is unauthorized to run the command. The user or system support would need to check the permission setting in the CODA Footprint portal. Refer to the HTTP Status Code Registry for details.

Status Code: 401.

Message

The raw data or captured key error message from the integration API server about the API request failure.

Message: Unauthorized.

Error Sample Data

List Current Targets Ports failed.

Status Code: 401.

Message: Unauthorized.

List Device Attack Avenues

Lists available attack avenues on a device. Please note that only a device with the isAttackAvenuesAvailable field set to true (run the List Devices command, then check the value of the path $.item.[*].isAttackAvenuesAvailable from the raw data) will have a valid response. Otherwise, the command will return empty data.

READER NOTE

Device ID is a required parameter to run this command.

  • Run the List Devices command to obtain Device ID. Device IDs can be found in the returned raw data at the path $.items[*].id.

Footprint Tenant ID is an optional parameter to run this command.

  • Run the List Tenants command to obtain Footprint Tenant ID. Footprint Tenant IDs can be found in the returned raw data at the path $.[*].id.

Input

Input Parameter

Required/Optional

Description

Example

Device ID

Required

The Device ID to return attack avenues. Device IDs can be obtained using the List Devices command.

***

Footprint Tenant ID

Optional

The Tenant ID to receive a request for. If this parameter is not defined, the original_tenant_id from the auth endpoint will be the default value.

1

Output

Raw Data

The primary response data from the API request.

SAMPLE DATA

CODE
[
    {
        "id": ***,
        "elementId": ***,
        "title": "CPE Inventory",
        "state": "discovered",
        "motivationText": "",
        "discoveredOn": "2022-04-05T23:41:35.477655Z",
        "lastScanned": "2022-08-08T09:29:53.364355Z",
        "lastUpdate": "2022-05-01T09:01:55Z",
        "cvssBase": 0,
        "impact": "",
        "severity": "0.0",
        "vulnerabilityDetectionResult": "1.1.1.1.123|cpe:/o:microsoft:windows",
        "vulnerabilityDetectionMethod": "",
        "vulnerabilityInsight": "",
        "solution": "Type:  ",
        "ref": {
            "cert": null,
            "links": "[]",
            "bid": "[]"
        },
        "relatedApplication": {
            "name": "Operating System on 1.1.1.1.123",
            "version": null,
            "port": null
        },
        "stateFixedReason": "",
        "affectedSoftwareOS": "",
        "qualityOfDetection": 80,
        "summary": "This routine uses information collected by other routines about CPE identities of operating systems, services and applications detected during the scan. Note: Some CPEs for specific products might show up twice or more in the output. Background: After a product got renamed or a specific vendor was acquired by another one it might happen that a product gets a new CPE within the NVD CPE Dictionary but older entries are kept with the older CPE.",
        "vulnerabilities": []
    },
    {
        "id": ***,
        "elementId": ***,
        "title": "Hostname Determination Reporting",
        "state": "discovered",
        "motivationText": "",
        "discoveredOn": "2022-04-05T23:41:35.498546Z",
        "lastScanned": "2022-08-08T09:29:53.364355Z",
        "lastUpdate": "2022-05-01T09:01:55Z",
        "cvssBase": 0,
        "impact": "",
        "severity": "0.0",
        "vulnerabilityDetectionResult": "Hostname determination for IP 1.1.1.1.123: Hostname|Source 192.168.10.123|IP-address",
        "vulnerabilityDetectionMethod": "",
        "vulnerabilityInsight": "",
        "solution": "Type:  ",
        "ref": {
            "cert": null,
            "links": "[]",
            "bid": "[]"
        },
        "relatedApplication": {
            "name": "Operating System on 1.1.1.1.123",
            "version": null,
            "port": null
        },
        "stateFixedReason": "",
        "affectedSoftwareOS": "",
        "qualityOfDetection": 80,
        "summary": "The script reports information on how the hostname of the target was determined.",
        "vulnerabilities": []
    },
    {
        "id": ***,
        "elementId": ***,
        "title": "OS Detection Consolidation and Reporting",
        "state": "discovered",
        "motivationText": "",
        "discoveredOn": "2022-04-05T23:41:35.518684Z",
        "lastScanned": "2022-08-08T09:29:53.364355Z",
        "lastUpdate": "2022-05-01T07:37:28Z",
        "cvssBase": 0,
        "impact": "",
        "severity": "0.0",
        "vulnerabilityDetectionResult": "Best matching OS: OS: Microsoft Windows CPE: cpe:/o:microsoft:windows Found by NVT: 1.1.1.1.1.1.22345.1.0.100000 (Microsoft Remote Desktop Protocol (RDP) Detection) Concluded from Microsoft Remote Desktop Protocol (RDP) on port 3389/tcp: Windows, possible Windows 10 or Server 2016 based on binary response fingerprinting: *** Setting key \"Host/runs_windows\" based on this information Other OS detections (in order of reliability): OS: Microsoft Windows CPE: cpe:/o:microsoft:windows Found by NVT: 1.1.1.1.1.1.23456.1.0.100000 (DCE/RPC and MSRPC Services Enumeration) Concluded from DCE/RPC and MSRPC Services Enumeration on port 135/tcp",
        "vulnerabilityDetectionMethod": "",
        "vulnerabilityInsight": "",
        "solution": "Type:  ",
        "ref": {
            "cert": null,
            "links": "[]",
            "bid": "[]"
        },
        "relatedApplication": {
            "name": "Operating System on 1.1.1.1.123",
            "version": null,
            "port": null
        },
        "stateFixedReason": "",
        "affectedSoftwareOS": "",
        "qualityOfDetection": 80,
        "summary": "This script consolidates the OS information detected by several VTs and tries to find the best matching OS. Furthermore it reports all previously collected information leading to this best matching OS. It also reports possible additional information which might help to improve the OS detection. If any of this information is wrong or could be improved please consider to report these to the referenced community portal.",
        "vulnerabilities": []
    }
]
Return Data

Indicates one of the possible command execution states: Successful or Failed.

The Failed state can be triggered by any of the following errors:

  • A connection issue with the integration

  • The API returned an error message

  • No response from the API

You can view more details about an error in the Error tab.

Return Data can be passed down directly to a subsequent command or used to create conditional tasks in playbooks.

SAMPLE DATA

CODE
Successful
Result

Provides a brief summary of outputs in an HTML formatted table.

SAMPLE DATA

Device ID of attack avenues

***

Number of attack avenues

3

Error Handling

If the Return Data is Failed, an Error tab will appear in the Test Result window.

The error tab contains the details responded from D3 SOAR or third-party API calls, including Failure Indicator, Status Code, and Message. This can help you locate the root cause of a command failure.

Parts in Error

Description

Example

Failure Indicator

Indicates the command failure that happened at a specific input and/or API call.

List Device Attack Avenues failed.

Status Code

The response code issued by the third-party API server or the D3 SOAR system that can be used to locate the corresponding error category. For example, if the returned status code is 401, the selected connection is unauthorized to run the command. The user or system support would need to check the permission setting in the CODA Footprint portal. Refer to the HTTP Status Code Registry for details.

Status Code: 404.

Message

The raw data or captured key error message from the integration API server about the API request failure.

Message: Not Found.

Error Sample Data

List Device Attack Avenues failed.

Status Code: 404.

Message: Not Found.

List Device Network Connections

Lists network connections on a deviceList. Please note that only a device with the isAttackAvenuesAvailable field set to true (run the List Devices command, then check the value of the path $.item.[*].isAttackAvenuesAvailable from the raw data) will have a valid response. Otherwise, the command will return empty data.

READER NOTE

Device ID is a required parameter to run this command.

  • Run the List Devices command to obtain Device ID. Device IDs can be found in the returned raw data at the path $.items[*].id.

Footprint Tenant ID is an optional parameter to run this command.

  • Run the List Tenants command to obtain Footprint Tenant ID. Footprint Tenant IDs can be found in the returned raw data at the path $.[*].id.

Please note that only the device type "AgentDevice" (run the List Devices command, then check the value of the path $.items.[*].type) can return users properly. If the device is a server, error 501 will return. If the input device does not exist error 404 will return.

{$.items.[*].type=server}

Input value of $.items.[*].type Not Exist

Input

Input Parameter

Required/Optional

Description

Example

Device ID

Required

The Device ID to return attack avenues. Device IDs can be obtained using the List Devices command.

***

Footprint Tenant ID

Optional

The Tenant ID to receive a request for. If this parameter is not defined, the original_tenant_id from the auth endpoint will be the default value.

1

Output

Raw Data

The primary response data from the API request.

SAMPLE DATA

CODE
[
    {
        "processName": "***",
        "processFileVersion": "",
        "processPath": "",
        "userName": "",
        "processId": ***,
        "localIp": "::",
        "localPort": ***,
        "remoteIp": "::",
        "remotePort": 0,
        "status": "LISTENING",
        "networkType": "TCP"
    },
    {
        "processName": "***",
        "processFileVersion": "10.0.12345.1",
        "processPath": "C:\\Windows\\***\\***.exe",
        "userName": "NT AUTHORITY\\SYSTEM",
        "processId": ***,
        "localIp": "::",
        "localPort": ***,
        "remoteIp": "::",
        "remotePort": 0,
        "status": "LISTENING",
        "networkType": "TCP"
    }
]
Return Data

Indicates one of the possible command execution states: Successful or Failed.

The Failed state can be triggered by any of the following errors:

  • A connection issue with the integration

  • The API returned an error message

  • No response from the API

You can view more details about an error in the Error tab.

Return Data can be passed down directly to a subsequent command or used to create conditional tasks in playbooks.

SAMPLE DATA

CODE
Successful
Result

Provides a brief summary of outputs in an HTML formatted table.

SAMPLE DATA

Port(s) in Listening

26

Port(s) in Bound

7

Port(s) in Established

7

Port(s) in Time_wait

14

Error Handling

If the Return Data is Failed, an Error tab will appear in the Test Result window.

The error tab contains the details responded from D3 SOAR or third-party API calls, including Failure Indicator, Status Code, and Message. This can help you locate the root cause of a command failure.

Parts in Error

Description

Example

Failure Indicator

Indicates the command failure that happened at a specific input and/or API call.

List Device Network Connections failed.

Status Code

The response code issued by the third-party API server or the D3 SOAR system that can be used to locate the corresponding error category. For example, if the returned status code is 401, the selected connection is unauthorized to run the command. The user or system support would need to check the permission setting in the CODA Footprint portal. Refer to the HTTP Status Code Registry for details.

Status Code: 404.

Message

The raw data or captured key error message from the integration API server about the API request failure.

Message: Not Found.

Error Sample Data

List Device Network Connections failed.

Status Code: 404.

Message: Not Found.

List Devices

Returns a list of discovered devices.

READER NOTE

Only valid fields and corresponding values will return results. See the description of the Filter input parameter for more information.

Filter and Footprint Tenant ID are optional parameters to run this command.

  • You can input “scannerId” as a filter, run the List Scanners command to obtain the scannerID. Scanner ID can be found in the returned raw data at the path $.id.

  • Run the List Tenants command to obtain Footprint Tenant ID. Footprint Tenant IDs can be found in the returned raw data at the path $.[*].id.

Input

Input Parameter

Required/Optional

Description

Example

Page

Optional

The index of the page to request. If this parameter is not defined, the first page will be returned.

1

Footprint Tenant ID

Optional

The Tenant ID to receive a request for. If this parameter is not defined, the original_tenant_id from the auth endpoint will be the default value.

1

Filter

Optional

The JSON object to filter search results. All valid filter parameters and the corresponding value formats are listed in sample data. Please refer to the Coda Footprint OpenAPI document for the filter parameters' options.

Available fields and corresponding values to define search conditions:

  • ip

  • pageSize

  • riskLevel

    • all

    • critical

    • nonvisible

    • secure

    • vulnerable

  • scanType

    • all

    • discovered

    • scanned

  • scannerId

  • scope

    • all

    • external

    • internal

  • showDevicesWithNoApps

    • true

    • false

  • sortColumn

    • discoveredOn

    • lastScanned

    • name

  • sortDirection

    • ascending

    • descending

  • source

    • agentbased

    • agentless

    • all

    • nessusimport

If this input parameter is not defined, the first page of the returned list of all devices will be sorted in descending order by device ID.

{
"ip": "string",
"pageSize": integer,
"riskLevel": string,
"scanType": "string",
"scannerId": integer,
"scope": "string",
"showDevicesWithNoApps": boolean,
"sortColumn": "string",
"sortDirection": “string”,
"source": "string"
}

Output

Raw Data

The primary response data from the API request.

SAMPLE DATA

CODE
{
    "page": 1,
    "totalPages": 1,
    "totalCount": 1,
    "items": [
        {
            "type": "***",
            "id": ***,
            "agentStatus": {
                "status": "online",
                "lastCheckin": "2022-11-03T04:12:31.579135Z",
                "lastUpdate": "2022-11-02T21:03:47.787187Z"
            },
            "disclaimer": "",
            "provider": "Other",
            "isAttackAvenuesAvailable": false,
            "isOnline": true,
            "riskLevel": "secure",
            "scannerName": null,
            "ip": "123.11.22.3",
            "name": "***",
            "originalName": "***",
            "tags": [],
            "discoveredOn": "2022-10-07 21:23:20.438112+00:00",
            "lastSeen": "2022-11-02 21:03:47.605780+00:00",
            "lastScanned": "2022-11-02T21:03:45.501680Z",
            "hostnames": [
                {
                    "name": "***",
                    "content": "123.11.22.3",
                    "type": "A",
                    "lastSeen": "2022-10-07 21:23:20.442227+00:00"
                }
            ],
            "applicationsCount": 1,
            "ports": {
                "tcp": [
                    135,
                    49668,
                    4767
                ],
                "udp": []
            },
            "agentId": ***,
            "agentCommand": {
                "id": ***,
                "commandText": null,
                "commandArgs": {},
                "commandStatus": "idle",
                "addedOn": null,
                "pulledOn": null,
                "respondedOn": null,
                "agent": ***
            },
            "hasScapResults": true,
            "hasAgentInstalled": true,
            "isNetworkEdgeScanDisabled": false,
            "numberOfCves": 0,
            "numberOfAttackAvenues": 0,
            "avoidBruteForce": false,
            "isAdvancedScanPossible": false,
            "isZAPScanPossible": false
        }
    ]
}
Key Fields

Common cyber security indicators such as unique IDs, file hash values, CVE numbers, IP addresses, etc., will be extracted from Raw Data as Key Fields.
The system stores these key fields in the path $.[playbookTask].outputData. You can use these key-value pairs as data points for playbook task inputs.

SAMPLE DATA

CODE
{
    "DeviceIDs": [
        ***
    ],
    "DeviceNames": [
        "***"
    ]
}
Return Data

Indicates one of the possible command execution states: Successful or Failed.

The Failed state can be triggered by any of the following errors:

  • A connection issue with the integration

  • The API returned an error message

  • No response from the API

You can view more details about an error in the Error tab.

Return Data can be passed down directly to a subsequent command or used to create conditional tasks in playbooks.

SAMPLE DATA

CODE
Successful
Result

Provides a brief summary of outputs in an HTML formatted table.

SAMPLE DATA

currentPage

1

totalPages

1

totalCount

1

Error Handling

If the Return Data is Failed, an Error tab will appear in the Test Result window.

The error tab contains the details responded from D3 SOAR or third-party API calls, including Failure Indicator, Status Code, and Message. This can help you locate the root cause of a command failure.

Parts in Error

Description

Example

Failure Indicator

Indicates the command failure that happened at a specific input and/or API call.

List Devices failed.

Status Code

The response code issued by the third-party API server or the D3 SOAR system that can be used to locate the corresponding error category. For example, if the returned status code is 401, the selected connection is unauthorized to run the command. The user or system support would need to check the permission setting in the CODA Footprint portal. Refer to the HTTP Status Code Registry for details.

Status Code: 401.

Message

The raw data or captured key error message from the integration API server about the API request failure.

Message: Unauthorized.

Error Sample Data

List Devices failed.

Status Code: 401.

Message: Unauthorized.

List Device Users

Returns users of a device.

READER NOTE

Device ID is a required parameter to run this command.

  • Run the List Devices command to obtain Device ID. Device IDs can be found in the returned raw data at the path $.items[*].id.

Footprint Tenant ID is an optional parameter to run this command.

  • Run the List Tenants command to obtain Footprint Tenant ID. Footprint Tenant IDs can be found in the returned raw data at the path $.[*].id.

Please note that only the device type "AgentDevice" (run the List Devices command, then check the value of the path $.items.[*].type) can return users properly. If the device is a server, error 501 will return. If the input device does not exist error 404 will return.

{$.items.[*].type=server}

Input value of $.items.[*].type Not Exist

Input

Input Parameter

Required/Optional

Description

Example

Device ID

Required

The Device ID to return attack avenues. Device IDs can be obtained using the List Devices command.

***

Footprint Tenant ID

Optional

The Tenant ID to receive a request for. If this parameter is not defined, the original_tenant_id from the auth endpoint will be the default value.

1

Output

Raw Data

The primary response data from the API request.

SAMPLE DATA

CODE
[
    {
        "accountType": ***,
        "description": "Built-in account for administering the computer/domain",
        "disabled": true,
        "name": "test",
        "passwordExpires": false
    },
    {
        "accountType": ***,
        "description": "A user account managed by the system.",
        "disabled": true,
        "name": "test2",
        "passwordExpires": false
    }
]
Key Fields

Common cyber security indicators such as unique IDs, file hash values, CVE numbers, IP addresses, etc., will be extracted from Raw Data as Key Fields.
The system stores these key fields in the path $.[playbookTask].outputData. You can use these key-value pairs as data points for playbook task inputs.

SAMPLE DATA

CODE
{
    "name": [
        "Administrator",
        "test2"
    ]
}
Return Data

Indicates one of the possible command execution states: Successful or Failed.

The Failed state can be triggered by any of the following errors:

  • A connection issue with the integration

  • The API returned an error message

  • No response from the API

You can view more details about an error in the Error tab.

Return Data can be passed down directly to a subsequent command or used to create conditional tasks in playbooks.

SAMPLE DATA

CODE
Successful
Result

Provides a brief summary of outputs in an HTML formatted table.

SAMPLE DATA

Number of user(s)

6

Error Handling

If the Return Data is Failed, an Error tab will appear in the Test Result window.

The error tab contains the details responded from D3 SOAR or third-party API calls, including Failure Indicator, Status Code, and Message. This can help you locate the root cause of a command failure.

Parts in Error

Description

Example

Failure Indicator

Indicates the command failure that happened at a specific input and/or API call.

List Device Users failed.

Status Code

The response code issued by the third-party API server or the D3 SOAR system that can be used to locate the corresponding error category. For example, if the returned status code is 401, the selected connection is unauthorized to run the command. The user or system support would need to check the permission setting in the CODA Footprint portal. Refer to the HTTP Status Code Registry for details.

Status Code: 401.

Message

The raw data or captured key error message from the integration API server about the API request failure.

Message: Unauthorized.

Error Sample Data

List Device Users failed.

Status Code: 401.

Message: Unauthorized.

List Device Vulnerabilities

Returns vulnerabilities found on a device.

READER NOTE

Device ID is a required parameter to run this command.

  • Run the List Devices command to obtain Device ID. Device IDs can be found in the returned raw data at the path $.items[*].id.

Footprint Tenant ID is an optional parameter to run this command.

  • Run the List Tenants command to obtain Footprint Tenant ID. Footprint Tenant IDs can be found in the returned raw data at the path $.[*].id.

Input

Input Parameter

Required/Optional

Description

Example

Device ID

Required

The Device ID to return attack avenues. Device IDs can be obtained using the List Devices command.

***

Page

Optional

The index of the page to request. If this parameter is not defined, the first page will be returned.

1

Footprint Tenant ID

Optional

The Tenant ID to receive a request for. If this parameter is not defined, the original_tenant_id from the auth endpoint will be the default value.

1

Output

Raw Data

The primary response data from the API request.

SAMPLE DATA

CODE
{
    "items": [
        {
            "id": ***,
            "elementId": ***,
            "cve": "CVE-***",
            "affected": "Microsoft Windows 10 Pro 64-bit 21H2 Microsoft Corporation (21H2)",
            "summary": "Windows LDAP Remote Code Execution Vulnerability.",
            "discovered": "2022-05-10T20:26:17.802139Z",
            "publishedDate": "2022-05-10T18:59:51.091749Z",
            "lastModified": "2022-05-10T18:59:51.091753Z",
            "cvssScore": 9,
            "problemTypeData": "N/A",
            "cvssImpact": null,
            "cvssExploit": null,
            "cvssConfidentialityImpact": "COMPLETE",
            "cvssAvailabilityImpact": "COMPLETE",
            "cvssVectorString": "AV:N/AC:L/Au:S/C:C/I:C/A:C",
            "cvssIntegrityImpact": "COMPLETE",
            "isCritical": true,
            "isVulnerable": false,
            "isLowSeverity": false,
            "isMediumSeverity": false,
            "isHighSeverity": false,
            "isCriticalSeverity": true,
            "isPublicExploitAvailable": false,
            "references": [
                "https://***.***/***/detail/CVE-2***"
            ],
            "exploits": [],
            "obtainAllPrivilege": null,
            "obtainOtherPrivilege": null,
            "obtainUserPrivilege": null,
            "userInteractionRequired": null,
            "severity": null,
            "state": "fixConfirmed",
            "motivationText": "",
            "stateLastChangedOn": "2022-05-13T12:37:08.301371Z",
            "stateFixedReason": "",
            "attackVector": {
                "accessVector": "NETWORK",
                "accessComplexity": "LOW",
                "authenticationRequired": "SINGLE"
            },
            "remediation": "Install ***",
            "hasRLE": false,
            "rleDetails": {},
            "informationOrigin": null
        },
        {
            "id": ***,
            "elementId": ***,
            "cve": "CVE-***",
            "affected": "Microsoft Windows 10 Pro 64-bit 21H2 Microsoft Corporation (21H2)",
            "summary": "Windows LDAP Remote Code Execution Vulnerability.",
            "discovered": "2022-05-10T20:26:17.825246Z",
            "publishedDate": "2022-05-10T18:59:51.581748Z",
            "lastModified": "2022-05-10T18:59:51.581753Z",
            "cvssScore": 9,
            "problemTypeData": "N/A",
            "cvssImpact": null,
            "cvssExploit": null,
            "cvssConfidentialityImpact": "COMPLETE",
            "cvssAvailabilityImpact": "COMPLETE",
            "cvssVectorString": "AV:N/AC:L/Au:S/C:C/I:C/A:C",
            "cvssIntegrityImpact": "COMPLETE",
            "isCritical": true,
            "isVulnerable": false,
            "isLowSeverity": false,
            "isMediumSeverity": false,
            "isHighSeverity": false,
            "isCriticalSeverity": true,
            "isPublicExploitAvailable": false,
            "references": [
                "https://nvd.nist.gov/***/detail/***"
            ],
            "exploits": [],
            "obtainAllPrivilege": null,
            "obtainOtherPrivilege": null,
            "obtainUserPrivilege": null,
            "userInteractionRequired": null,
            "severity": null,
            "state": "fixConfirmed",
            "motivationText": "",
            "stateLastChangedOn": "2022-05-13T12:37:08.301371Z",
            "stateFixedReason": "",
            "attackVector": {
                "accessVector": "NETWORK",
                "accessComplexity": "LOW",
                "authenticationRequired": "SINGLE"
            },
            "remediation": "Install ***",
            "hasRLE": false,
            "rleDetails": {},
            "informationOrigin": null
        }
    ],
    "page": 1,
    "totalPages": 11,
    "totalCount": 205
}
Key Fields

Common cyber security indicators such as unique IDs, file hash values, CVE numbers, IP addresses, etc., will be extracted from Raw Data as Key Fields.
The system stores these key fields in the path $.[playbookTask].outputData. You can use these key-value pairs as data points for playbook task inputs.

SAMPLE DATA

CODE
{
    "CVEs": [
        "CVE-***",
        "CVE-***"
    ],
    "CVSSScores": [
        9,
        9
    ]
}
Return Data

Indicates one of the possible command execution states: Successful or Failed.

The Failed state can be triggered by any of the following errors:

  • A connection issue with the integration

  • The API returned an error message

  • No response from the API

You can view more details about an error in the Error tab.

Return Data can be passed down directly to a subsequent command or used to create conditional tasks in playbooks.

SAMPLE DATA

CODE
Successful
Result

Provides a brief summary of outputs in an HTML formatted table.

SAMPLE DATA

currentPage

1

totalPages

1

totalCount

205

Error Handling

If the Return Data is Failed, an Error tab will appear in the Test Result window.

The error tab contains the details responded from D3 SOAR or third-party API calls, including Failure Indicator, Status Code, and Message. This can help you locate the root cause of a command failure.

Parts in Error

Description

Example

Failure Indicator

Indicates the command failure that happened at a specific input and/or API call.

List Device Vulnerabilities failed.

Status Code

The response code issued by the third-party API server or the D3 SOAR system that can be used to locate the corresponding error category. For example, if the returned status code is 401, the selected connection is unauthorized to run the command. The user or system support would need to check the permission setting in the CODA Footprint portal. Refer to the HTTP Status Code Registry for details.

Status Code: 404.

Message

The raw data or captured key error message from the integration API server about the API request failure.

Message: Not Found.

Error Sample Data

List Device Vulnerabilities failed.

Status Code: 404.

Message: Not Found.

List Scanners

Returns a list of available scanners. This includes the default Cloud Scanner and internal scanners.

READER NOTE

Footprint Tenant ID is an optional parameter to run this command.

  • Run the List Tenants command to obtain Footprint Tenant ID. Footprint Tenant IDs can be found in the returned raw data at the path $.[*].id.

Input

Input Parameter

Required/Optional

Description

Example

Footprint Tenant ID

Optional

The Tenant ID to receive a request for. If this parameter is not defined, the original_tenant_id from the auth endpoint will be the default value.

1

Output

Raw Data

The primary response data from the API request.

SAMPLE DATA

CODE
[
    {
        "id": ***,
        "state": "Online",
        "administrativeState": "Active",
        "schedulerConfig": {},
        "numberOfUserInputs": ***,
        "numberOfIpsScanned": ***,
        "privateIp": null,
        "guid": null,
        "publicIp": "12.345.678.90",
        "hostname": "hwn.codacloud.net",
        "label": "Cloud Scanner",
        "advancedScannerStatus": null,
        "isBrokerAccessibleByScanner": true,
        "containersStatus": [],
        "isDefaultCloudScanner": true,
        "operatingSystem": null,
        "workerVersion": "1.23.45",
        "controllerVersion": "1.23.45",
        "installType": "standalone",
        "installDate": "2022-02-18T15:16:19.733522Z",
        "lastSeen": "2022-08-19T18:12:41.539058Z",
        "lastUpdate": "2022-08-19T18:12:41.539058Z",
        "messageBrokerUsername": null,
        "virtualHost": null,
        "type": "external",
        "extendScanRunning": true,
        "isShared": false,
        "tenant": 20,
        "agent": null
    },
    {
        "id": ***,
        "state": "Offline",
        "administrativeState": "Stopped",
        "schedulerConfig": {},
        "numberOfUserInputs": 0,
        "numberOfIpsScanned": 0,
        "privateIp": "N/A",
        "guid": "***-***-***-***-***",
        "publicIp": "123.45.678.901",
        "hostname": "***",
        "label": "***",
        "advancedScannerStatus": "starting",
        "isBrokerAccessibleByScanner": true,
        "containersStatus": [
            {
                "name": "isc-frontend",
                "status": "online",
                "cpuUsage": 0.24,
                "memLimit": "512MiB",
                "memUsage": "4.191MiB"
            },
            {
                "name": "***",
                "status": "online",
                "cpuUsage": 36.57,
                "memLimit": "4GiB",
                "memUsage": "2.205GiB"
            },
            {
                "name": "***",
                "status": "online",
                "cpuUsage": 0.06,
                "memLimit": "3GiB",
                "memUsage": "291.9MiB"
            },
            {
                "name": "***",
                "status": "online",
                "cpuUsage": 0.79,
                "memLimit": "2GiB",
                "memUsage": "393.1MiB"
            }
        ],
        "isDefaultCloudScanner": false,
        "operatingSystem": "Linux ***-generic",
        "workerVersion": "1.2.34",
        "controllerVersion": "1.2.34",
        "installType": "standalone",
        "installDate": "2022-02-22T17:06:28.614040Z",
        "lastSeen": "2022-03-22T22:23:37.136946Z",
        "lastUpdate": "2022-03-22T22:20:39.613879Z",
        "messageBrokerUsername": "***",
        "virtualHost": "***",
        "type": "internal",
        "extendScanRunning": false,
        "isShared": false,
        "tenant": 20,
        "agent": null
    },
    {
        "id": ***,
        "state": "Offline",
        "administrativeState": "Stopped",
        "schedulerConfig": {},
        "numberOfUserInputs": 1,
        "numberOfIpsScanned": **,
        "privateIp": "111.111.10.110",
        "guid": "***-***-***-***-***",
        "publicIp": "1.1.1.1",
        "hostname": "coresite_scanner",
        "label": "coresite_scanner",
        "advancedScannerStatus": "online",
        "isBrokerAccessibleByScanner": true,
        "containersStatus": [
            {
                "name": "***",
                "status": "online",
                "cpuUsage": 30.44,
                "memLimit": "7.741GiB",
                "memUsage": "527.5MiB"
            },
            {
                "name": "***",
                "status": "online",
                "cpuUsage": 32.08,
                "memLimit": "4GiB",
                "memUsage": "116.9MiB"
            }
        ],
        "isDefaultCloudScanner": false,
        "operatingSystem": "Linux ***-generic",
        "workerVersion": "1.00.0",
        "controllerVersion": "1.0.00",
        "installType": "standalone",
        "installDate": "2022-04-05T18:11:35.742678Z",
        "lastSeen": "2022-05-14T15:02:32.880905Z",
        "lastUpdate": "2022-05-13T12:36:25.772340Z",
        "messageBrokerUsername": "***",
        "virtualHost": "***",
        "type": "internal",
        "extendScanRunning": false,
        "isShared": false,
        "tenant": 20,
        "agent": null
    }
]
Key Fields

Common cyber security indicators such as unique IDs, file hash values, CVE numbers, IP addresses, etc., will be extracted from Raw Data as Key Fields.
The system stores these key fields in the path $.[playbookTask].outputData. You can use these key-value pairs as data points for playbook task inputs.

SAMPLE DATA

CODE
{
    "ScannerIDs": [
        ***,
        ***,
        ***
    ],
    "PublicIPs": [
        "12.123.345.11",
        "200.00.000.000",
        "123.456.78.90"
    ],
    "ScannerNames": [
        "***",
        "***",
        "***"
    ]
}
Return Data

Indicates one of the possible command execution states: Successful or Failed.

The Failed state can be triggered by any of the following errors:

  • A connection issue with the integration

  • The API returned an error message

  • No response from the API

You can view more details about an error in the Error tab.

Return Data can be passed down directly to a subsequent command or used to create conditional tasks in playbooks.

SAMPLE DATA

CODE
Successful
Result

Provides a brief summary of outputs in an HTML formatted table.

SAMPLE DATA

Number of user(s)

4

Error Handling

If the Return Data is Failed, an Error tab will appear in the Test Result window.

The error tab contains the details responded from D3 SOAR or third-party API calls, including Failure Indicator, Status Code, and Message. This can help you locate the root cause of a command failure.

Parts in Error

Description

Example

Failure Indicator

Indicates the command failure that happened at a specific input and/or API call.

List Scanners failed.

Status Code

The response code issued by the third-party API server or the D3 SOAR system that can be used to locate the corresponding error category. For example, if the returned status code is 401, the selected connection is unauthorized to run the command. The user or system support would need to check the permission setting in the CODA Footprint portal. Refer to the HTTP Status Code Registry for details.

Status Code: 401.

Message

The raw data or captured key error message from the integration API server about the API request failure.

Message: Unauthorized.

Error Sample Data

List Scanners failed.

Status Code: 401.

Message: Unauthorized.

List Scan Surfaces

Returns a list of user inputs and resulting assets.

READER NOTE

Scanner ID is an optional parameter to run this command.

  • Run the List Scanners command to obtain Scanner ID. Scanner IDs can be found in the returned raw data at the path $.id.

Footprint Tenant ID is an optional parameter to run this command.

  • Run the List Tenants command to obtain Footprint Tenant ID. Footprint Tenant IDs can be found in the returned raw data at the path $.[*].id.

Input

Input Parameter

Required/Optional

Description

Example

Page

Optional

The index of the page to request. If this parameter is not defined, the first page will be returned.

1

Scanner ID

Optional

The Scanner ID to receive a request for. Scanner IDs can be obtained using the List Scanners command. If this parameter is not defined or has an invalid input, all scanners will be returned.

***

Footprint Tenant ID

Optional

The Tenant ID to receive a request for. If this parameter is not defined, the original_tenant_id from the auth endpoint will be the default value.

1

Output

Raw Data

The primary response data from the API request.

SAMPLE DATA

CODE
{
    "page": 1,
    "totalPages": 1,
    "totalCount": 3,
    "items": [
        {
            "id": ***,
            "user": {
                "photo": "",
                "firstName": "Aaron",
                "lastName": "Martin"
            },
            "scanDate": "2022-05-27T01:48:42.252936Z",
            "input": "1.1.1.1/28",
            "scanners": [
                {
                    "id": ***,
                    "label": "***",
                    "isActive": true,
                    "potentialTargets": [],
                    "currentTargets": [
                        {
                            "id": ***,
                            "ip": "2.2.2.2",
                            "organization": "***",
                            "description": "Server",
                            "hostnames": [
                                "2.2.2.2.highwirenetworks.com"
                            ],
                            "range": "2.2.2.2/28",
                            "isRangeScanned": false,
                            "isTargetStopped": false,
                            "isTargetPaused": false
                        },
                        {
                            "id": ***,
                            "ip": "2.2.2.2.67",
                            "organization": "***",
                            "description": "Server",
                            "hostnames": [
                                "2.2.2.2.highwirenetworks.com"
                            ],
                            "range": "2.2.2.2/28",
                            "isRangeScanned": false,
                            "isTargetStopped": false,
                            "isTargetPaused": false
                        }
                    ],
                    "results": {
                        "applications": {
                            "count": 16,
                            "critical": 0,
                            "secure": 0,
                            "vulnerable": 0,
                            "unknown": 0
                        },
                        "devices": {
                            "count": 2,
                            "critical": 0,
                            "secure": 0,
                            "vulnerable": 0,
                            "unknown": 0
                        }
                    }
                }
          ]
}
Key Fields

Common cyber security indicators such as unique IDs, file hash values, CVE numbers, IP addresses, etc., will be extracted from Raw Data as Key Fields.
The system stores these key fields in the path $.[playbookTask].outputData. You can use these key-value pairs as data points for playbook task inputs.

SAMPLE DATA

CODE
{
    "UserIDs": [
        ***,
        ***,
        ***
    ],
    "ScannerIDs": [
        ***,
        ***,
        ***
    ],
    "TargetIDs": [
        ***,
        ***,
        ***
    ]
}
Return Data

Indicates one of the possible command execution states: Successful or Failed.

The Failed state can be triggered by any of the following errors:

  • A connection issue with the integration

  • The API returned an error message

  • No response from the API

You can view more details about an error in the Error tab.

Return Data can be passed down directly to a subsequent command or used to create conditional tasks in playbooks.

SAMPLE DATA

CODE
Successful
Result

Provides a brief summary of outputs in an HTML formatted table.

SAMPLE DATA

currentPage

1

totalPages

1

Number of users

3

Number of scanners

3

Numer of current targets

3

Error Handling

If the Return Data is Failed, an Error tab will appear in the Test Result window.

The error tab contains the details responded from D3 SOAR or third-party API calls, including Failure Indicator, Status Code, and Message. This can help you locate the root cause of a command failure.

Parts in Error

Description

Example

Failure Indicator

Indicates the command failure that happened at a specific input and/or API call.

List Scan Surfaces failed.

Status Code

The response code issued by the third-party API server or the D3 SOAR system that can be used to locate the corresponding error category. For example, if the returned status code is 401, the selected connection is unauthorized to run the command. The user or system support would need to check the permission setting in the CODA Footprint portal. Refer to the HTTP Status Code Registry for details.

Status Code: 401.

Message

The raw data or captured key error message from the integration API server about the API request failure.

Message: Unauthorized.

Error Sample Data

List Scan Surfaces failed.

Status Code: 401.

Message: Unauthorized.

List Technical Contexts

Returns a list of available technical contexts.

READER NOTE

If your input Page exceeds the total pages, D3 will return success with no result. Leave the Page parameter empty and run this command to obtain the totalPages from the result. The totalPages may change based on your other settings, please change the page to get your desired page.

Footprint Tenant ID is an optional parameter to run this command.

  • Run the List Tenants command to obtain Footprint Tenant ID. Footprint Tenant IDs can be found in the returned raw data at the path $.[*].id.

Input

Input Parameter

Required/Optional

Description

Example

Page

Optional

The index of the page to request. If this parameter is not defined, the first page will be returned.

1

Risk Level

Optional

The risk level to request. If not this parameter is not defined, contexts of all risk levels will be returned.

All

Footprint Tenant ID

Optional

The Tenant ID to receive a request for. If this parameter is not defined, the original_tenant_id from the auth endpoint will be the default value.

1

Output

Raw Data

The primary response data from the API request.

SAMPLE DATA

CODE
{
    "page": 1,
    "totalCount": 244,
    "totalPages": 13,
    "items": [
        {
            "id": ***,
            "name": "*** - Status",
            "type": "ts",
            "icon": null,
            "isAutomaticallyGenerated": true,
            "info": {
                "levels": {
                    "critical": 0,
                    "vulnerable": 50,
                    "nonvisible": 0,
                    "secure": 50
                },
                "applications": 10,
                "applicationsUp": 4,
                "uptime": 100,
                "icon": null
            },
            "riskLevel": "vulnerable"
        },
        {
            "id": ***,
            "name": "*** - Status",
            "type": "ts",
            "icon": null,
            "isAutomaticallyGenerated": true,
            "info": {
                "levels": {
                    "critical": 0,
                    "vulnerable": 50,
                    "nonvisible": 0,
                    "secure": 50
                },
                "applications": 5,
                "applicationsUp": 2,
                "uptime": 100,
                "icon": null
            },
            "riskLevel": "vulnerable"
        },
        {
            "id": ***,
            "name": "4***",
            "type": "ts",
            "icon": null,
            "isAutomaticallyGenerated": true,
            "info": {
                "levels": {
                    "critical": 0,
                    "vulnerable": 10,
                    "nonvisible": 0,
                    "secure": 90
                },
                "applications": 48,
                "applicationsUp": 40,
                "uptime": ***,
                "icon": null
            },
            "riskLevel": "vulnerable"
        },
        {
            "id": ***,
            "name": "***",
            "type": "ts",
            "icon": null,
            "isAutomaticallyGenerated": true,
            "info": {
                "levels": {
                    "critical": 0,
                    "vulnerable": 0,
                    "nonvisible": 0,
                    "secure": 100
                },
                "applications": 6,
                "applicationsUp": 4,
                "uptime": ***,
                "icon": null
            },
            "riskLevel": "secure"
        }
    ]
}
Key Fields

Common cyber security indicators such as unique IDs, file hash values, CVE numbers, IP addresses, etc., will be extracted from Raw Data as Key Fields.
The system stores these key fields in the path $.[playbookTask].outputData. You can use these key-value pairs as data points for playbook task inputs.

SAMPLE DATA

CODE
{
    "ContextIDs": [
        ***,
        ***,
        ***,
        ***,
        ***
    ],
    "ContextNames": [
        "***",
        "***",
        "***",
        "***",
        "***"
    ]
}
Return Data

Indicates one of the possible command execution states: Successful or Failed.

The Failed state can be triggered by any of the following errors:

  • A connection issue with the integration

  • The API returned an error message

  • No response from the API

You can view more details about an error in the Error tab.

Return Data can be passed down directly to a subsequent command or used to create conditional tasks in playbooks.

SAMPLE DATA

CODE
Successful
Result

Provides a brief summary of outputs in an HTML formatted table.

SAMPLE DATA

currentPage

1

totalPages

13

totalCount

244

Error Handling

If the Return Data is Failed, an Error tab will appear in the Test Result window.

The error tab contains the details responded from D3 SOAR or third-party API calls, including Failure Indicator, Status Code, and Message. This can help you locate the root cause of a command failure.

Parts in Error

Description

Example

Failure Indicator

Indicates the command failure that happened at a specific input and/or API call.

List Technical Contexts failed.

Status Code

The response code issued by the third-party API server or the D3 SOAR system that can be used to locate the corresponding error category. For example, if the returned status code is 401, the selected connection is unauthorized to run the command. The user or system support would need to check the permission setting in the CODA Footprint portal. Refer to the HTTP Status Code Registry for details.

Status Code: 401.

Message

The raw data or captured key error message from the integration API server about the API request failure.

Message: Unauthorized.

Error Sample Data

List Technical Contexts failed.

Status Code: 401.

Message: Unauthorized.

List Tenants

Lists tenant accounts that the current user can log in to.

Input

N/A

Output

Raw Data

The primary response data from the API request.

SAMPLE DATA

CODE
[
    {
        "id": 1,
        "name": "***",
        "lastLogin": null,
        "isPrimaryAccount": true
    },
    {
        "id": 2,
        "name": "***",
        "lastLogin": null,
        "isPrimaryAccount": false
    },
    {
        "id": 3,
        "name": "***",
        "lastLogin": null,
        "isPrimaryAccount": false
    },
    {
        "id": 4,
        "name": "***",
        "lastLogin": null,
        "isPrimaryAccount": false
    }
]
Return Data

Indicates one of the possible command execution states: Successful or Failed.

The Failed state can be triggered by any of the following errors:

  • A connection issue with the integration

  • The API returned an error message

  • No response from the API

You can view more details about an error in the Error tab.

Return Data can be passed down directly to a subsequent command or used to create conditional tasks in playbooks.

SAMPLE DATA

CODE
Successful
Result

Provides a brief summary of outputs in an HTML formatted table.

SAMPLE DATA

Number of Accessible Accounts

4

Error Handling

If the Return Data is Failed, an Error tab will appear in the Test Result window.

The error tab contains the details responded from D3 SOAR or third-party API calls, including Failure Indicator, Status Code, and Message. This can help you locate the root cause of a command failure.

Parts in Error

Description

Example

Failure Indicator

Indicates the command failure that happened at a specific input and/or API call.

List Tenants failed.

Status Code

The response code issued by the third-party API server or the D3 SOAR system that can be used to locate the corresponding error category. For example, if the returned status code is 401, the selected connection is unauthorized to run the command. The user or system support would need to check the permission setting in the CODA Footprint portal. Refer to the HTTP Status Code Registry for details.

Status Code: 401.

Message

The raw data or captured key error message from the integration API server about the API request failure.

Message: Unauthorized.

Error Sample Data

List Tenants failed.

Status Code: 401.

Message: Unauthorized.

Patch Rescan

Runs an endpoint that rescans all user inputs from the Scan Surface for each active Agentless Scanner or a specific Agentless Scanner.

READER NOTE

Scanner ID is an optional parameter to run this command.

  • Run the List Scanners command to obtain Scanner ID. Scanner IDs can be found in the returned raw data at the path $.id.

Footprint Tenant ID is an optional parameter to run this command.

  • Run the List Tenants command to obtain Footprint Tenant ID. Footprint Tenant IDs can be found in the returned raw data at the path $.[*].id.

Input

Input Parameter

Required/Optional

Description

Example

Scanner ID

Optional

The Scanner ID to receive a request for. Scanner IDs can be obtained using the List Scanners command. If this parameter is not defined or has an invalid input, all user inputs from Scan Surface for each active Agentless Scanner will be scheduled.

***

Footprint Tenant ID

Optional

The Tenant ID to receive a request for. If this parameter is not defined, the original_tenant_id from the auth endpoint will be the default value.

1

Output

Raw Data

The primary response data from the API request.

SAMPLE DATA

CODE
{
    "ScannerID": "***",
    "ActionResult": "Rescan accepted and will start in a few moments"
}
Return Data

Indicates one of the possible command execution states: Successful or Failed.

The Failed state can be triggered by any of the following errors:

  • A connection issue with the integration

  • The API returned an error message

  • No response from the API

You can view more details about an error in the Error tab.

Return Data can be passed down directly to a subsequent command or used to create conditional tasks in playbooks.

SAMPLE DATA

CODE
Successful
Result

Provides a brief summary of outputs in an HTML formatted table.

SAMPLE DATA

Scanner ID

***

Execution Status

Rescan accepted and will start in a few moments

Error Handling

If the Return Data is Failed, an Error tab will appear in the Test Result window.

The error tab contains the details responded from D3 SOAR or third-party API calls, including Failure Indicator, Status Code, and Message. This can help you locate the root cause of a command failure.

Parts in Error

Description

Example

Failure Indicator

Indicates the command failure that happened at a specific input and/or API call.

Patch Rescan failed.

Status Code

The response code issued by the third-party API server or the D3 SOAR system that can be used to locate the corresponding error category. For example, if the returned status code is 401, the selected connection is unauthorized to run the command. The user or system support would need to check the permission setting in the CODA Footprint portal. Refer to the HTTP Status Code Registry for details.

Status Code: 401.

Message

The raw data or captured key error message from the integration API server about the API request failure.

Message: Unauthorized.

Error Sample Data

Patch Rescan failed.

Status Code: 401.

Message: Unauthorized.

Update Target Scan Scope

Runs an endpoint that edits existing scan entries scope (in/out).

READER NOTE

Target ID is a required parameter to run this command.

  • Run the List Scan Surfaces command to obtain Target ID. Target IDs can be found in the returned raw data at the path $.currentTargets[*].id.

Footprint Tenant ID is an optional parameter to run this command.

  • Run the List Tenants command to obtain Footprint Tenant ID. Footprint Tenant IDs can be found in the returned raw data at the path $.[*].id.

Input

Input Parameter

Required/Optional

Description

Example

Target ID

Required

The Target ID to request an update. Target IDs can be obtained using the List Scan Surfaces command.

***

Scope

Required

The scope to update.

All

Footprint Tenant ID

Optional

The Tenant ID to receive a request for. If this parameter is not defined, the original_tenant_id from the auth endpoint will be the default value.

1

Output

Raw Data

The primary response data from the API request.

SAMPLE DATA

CODE
{
    "ScannerID": "***",
    "ActionResult": "Scope successfully changed for a current target"
}
Return Data

Indicates one of the possible command execution states: Successful or Failed.

The Failed state can be triggered by any of the following errors:

  • A connection issue with the integration

  • The API returned an error message

  • No response from the API

You can view more details about an error in the Error tab.

Return Data can be passed down directly to a subsequent command or used to create conditional tasks in playbooks.

SAMPLE DATA

CODE
Successful
Result

Provides a brief summary of outputs in an HTML formatted table.

SAMPLE DATA

Scanner ID

***

Execution Status

Updated successfully

Error Handling

If the Return Data is Failed, an Error tab will appear in the Test Result window.

The error tab contains the details responded from D3 SOAR or third-party API calls, including Failure Indicator, Status Code, and Message. This can help you locate the root cause of a command failure.

Parts in Error

Description

Example

Failure Indicator

Indicates the command failure that happened at a specific input and/or API call.

Update Target Scan Scope failed.

Status Code

The response code issued by the third-party API server or the D3 SOAR system that can be used to locate the corresponding error category. For example, if the returned status code is 401, the selected connection is unauthorized to run the command. The user or system support would need to check the permission setting in the CODA Footprint portal. Refer to the HTTP Status Code Registry for details.

Status Code: 401.

Message

The raw data or captured key error message from the integration API server about the API request failure.

Message: Unauthorized.

Error Sample Data

Update Target Scan Scope failed.

Status Code: 401.

Message: Unauthorized.

Test Connection

Allows you to perform a health check on an integration connection. You can schedule a periodic health check by selecting Connection Health Check when editing an integration connection.

Input

N/A

Output

Return Data

Indicates one of the possible command execution states: Successful or Failed.

The Failed state can be triggered by any of the following errors:

  • A connection issue with the integration

  • The API returned an error message

  • No response from the API

You can view more details about an error in the Error tab.

Return Data can be passed down directly to a subsequent command or used to create conditional tasks in playbooks.

SAMPLE DATA

CODE
Successful

Error Handling

If the Return Data is Failed, an Error tab will appear in the Test Result window.

The error tab contains the details responded from D3 SOAR or third-party API calls, including Failure Indicator, Status Code, and Message. This can help you locate the root cause of a command failure.

Parts in Error

Description

Example

Failure Indicator

Indicates the command failure that happened at a specific input and/or API call.

Test Connection failed. Failed to check the connector.

Status Code

The response code issued by the third-party API server or the D3 SOAR system that can be used to locate the corresponding error category. For example, if the returned status code is 401, the selected connection is unauthorized to run the command. The user or system support would need to check the permission setting in the CODA Footprint portal. Refer to the HTTP Status Code Registry for details.

Status Code: 401.

Message

The raw data or captured key error message from the integration API server about the API request failure.

Message: Unauthorized.

Error Sample Data

Test Connection failed. Failed to check the connector.

Status Code: 401.

Message: Unauthorized.

JavaScript errors detected

Please note, these errors can depend on your browser setup.

If this problem persists, please contact our support.