Incident Workspace Widgets
LAST UPDATED: JULY 15, 2025
The incident workspace now includes updated and new widgets, customizable via the Incident Workspace Builder. Each widget can be expanded or restored to their default size using their ![]() (expand) and
(expand) and ![]() (shrink) interactive icons. This article provides an overview of all available widgets and explains how to populate them within the incident workspace.
(shrink) interactive icons. This article provides an overview of all available widgets and explains how to populate them within the incident workspace.
Adversary Lifecycle
%201-20241228-013359.png?inst-v=e416ef0a-975f-4240-8b76-b2350608028d)
The Adversary Lifecycle widget displays tactic and technique details specific to the current incident, providing clear and comprehensive insights for each item.
Clicking on the ![]() button beside the Adversary Lifecycle widget header will render a popup. The dropdown menu within this popup contains built-in and custom tactics and techniques.
button beside the Adversary Lifecycle widget header will render a popup. The dropdown menu within this popup contains built-in and custom tactics and techniques.
Navigate to the MITRE ATT&CK Monitor.
Click on the
-20241228-011409.png?inst-v=e416ef0a-975f-4240-8b76-b2350608028d) icon next to a tactic.
icon next to a tactic.Select Insert Tactic or Add Technique.
-20241228-012434.png?inst-v=e416ef0a-975f-4240-8b76-b2350608028d)
Enter in the necessary tactic or technique information, then click on the Save button.
Users can now observe their custom tactic or technique in the Adversary Lifecycle widget’s Add Tactic/Technique popup.
%201-20241228-012834.png?inst-v=e416ef0a-975f-4240-8b76-b2350608028d)
Hover over a technique, then click on the icon.
-20241228-013713.png?inst-v=e416ef0a-975f-4240-8b76-b2350608028d)
Click on the Remove button.
-20241228-013935.png?inst-v=e416ef0a-975f-4240-8b76-b2350608028d)
-20241228-010720.png?inst-v=e416ef0a-975f-4240-8b76-b2350608028d)
If built-in techniques are not visible, navigate to the Monitor module and select the Enable Mitre Tactics checkbox.
.png?inst-v=e416ef0a-975f-4240-8b76-b2350608028d)
Conclusion
Users can use the Conclusion widget to record a summary for the incident’s resolution using an HTML editor.
To edit the content, hover over the widget and click on the
 icon.
icon.To clear the HTML widget, hover over the widget, click on the
 icon, then click on the Clear button.
Custom Fields
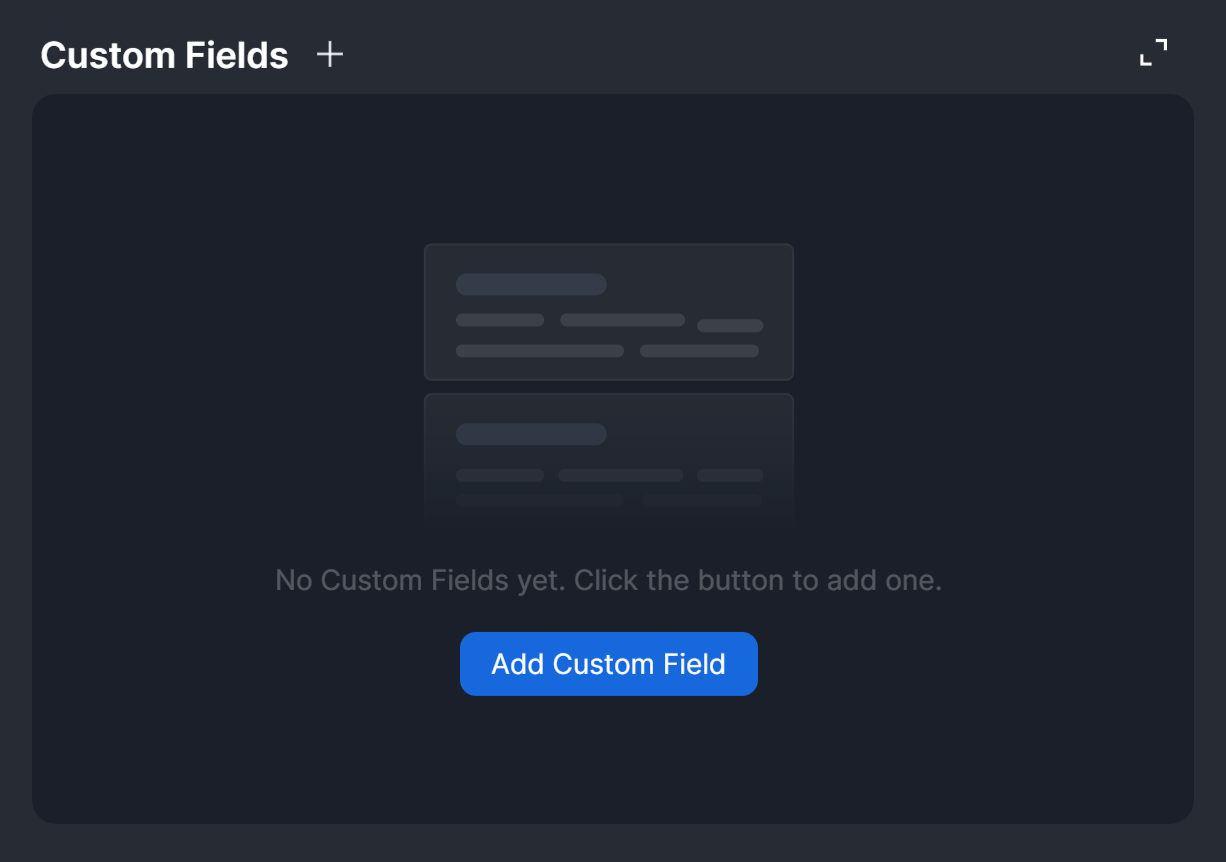
The Custom Fields widget allows users to add custom fields and values to incorporate information about the incident beyond what appears in the header panel.
To add a custom field, click on the .png?inst-v=e416ef0a-975f-4240-8b76-b2350608028d) button or the Add Custom Field button. In the pop-up window that appears, enter the custom field name and value before clicking on the Save button.
button or the Add Custom Field button. In the pop-up window that appears, enter the custom field name and value before clicking on the Save button.
.png?inst-v=e416ef0a-975f-4240-8b76-b2350608028d)
Editing a Custom Field Value
To edit a custom field value, click on the custom field, make the edits, then click on the .png?inst-v=e416ef0a-975f-4240-8b76-b2350608028d) button to save.
button to save.
Deleting a Custom Field
To delete a custom field, click on it, then click on the  icon.
icon.
Description
The Description widget enables users to add or update the incident description using an HTML editor.
To edit the content, hover over the widget and click on the
icon.To clear the HTML widget, hover over the widget, click on the
icon, then click on the Clear button.
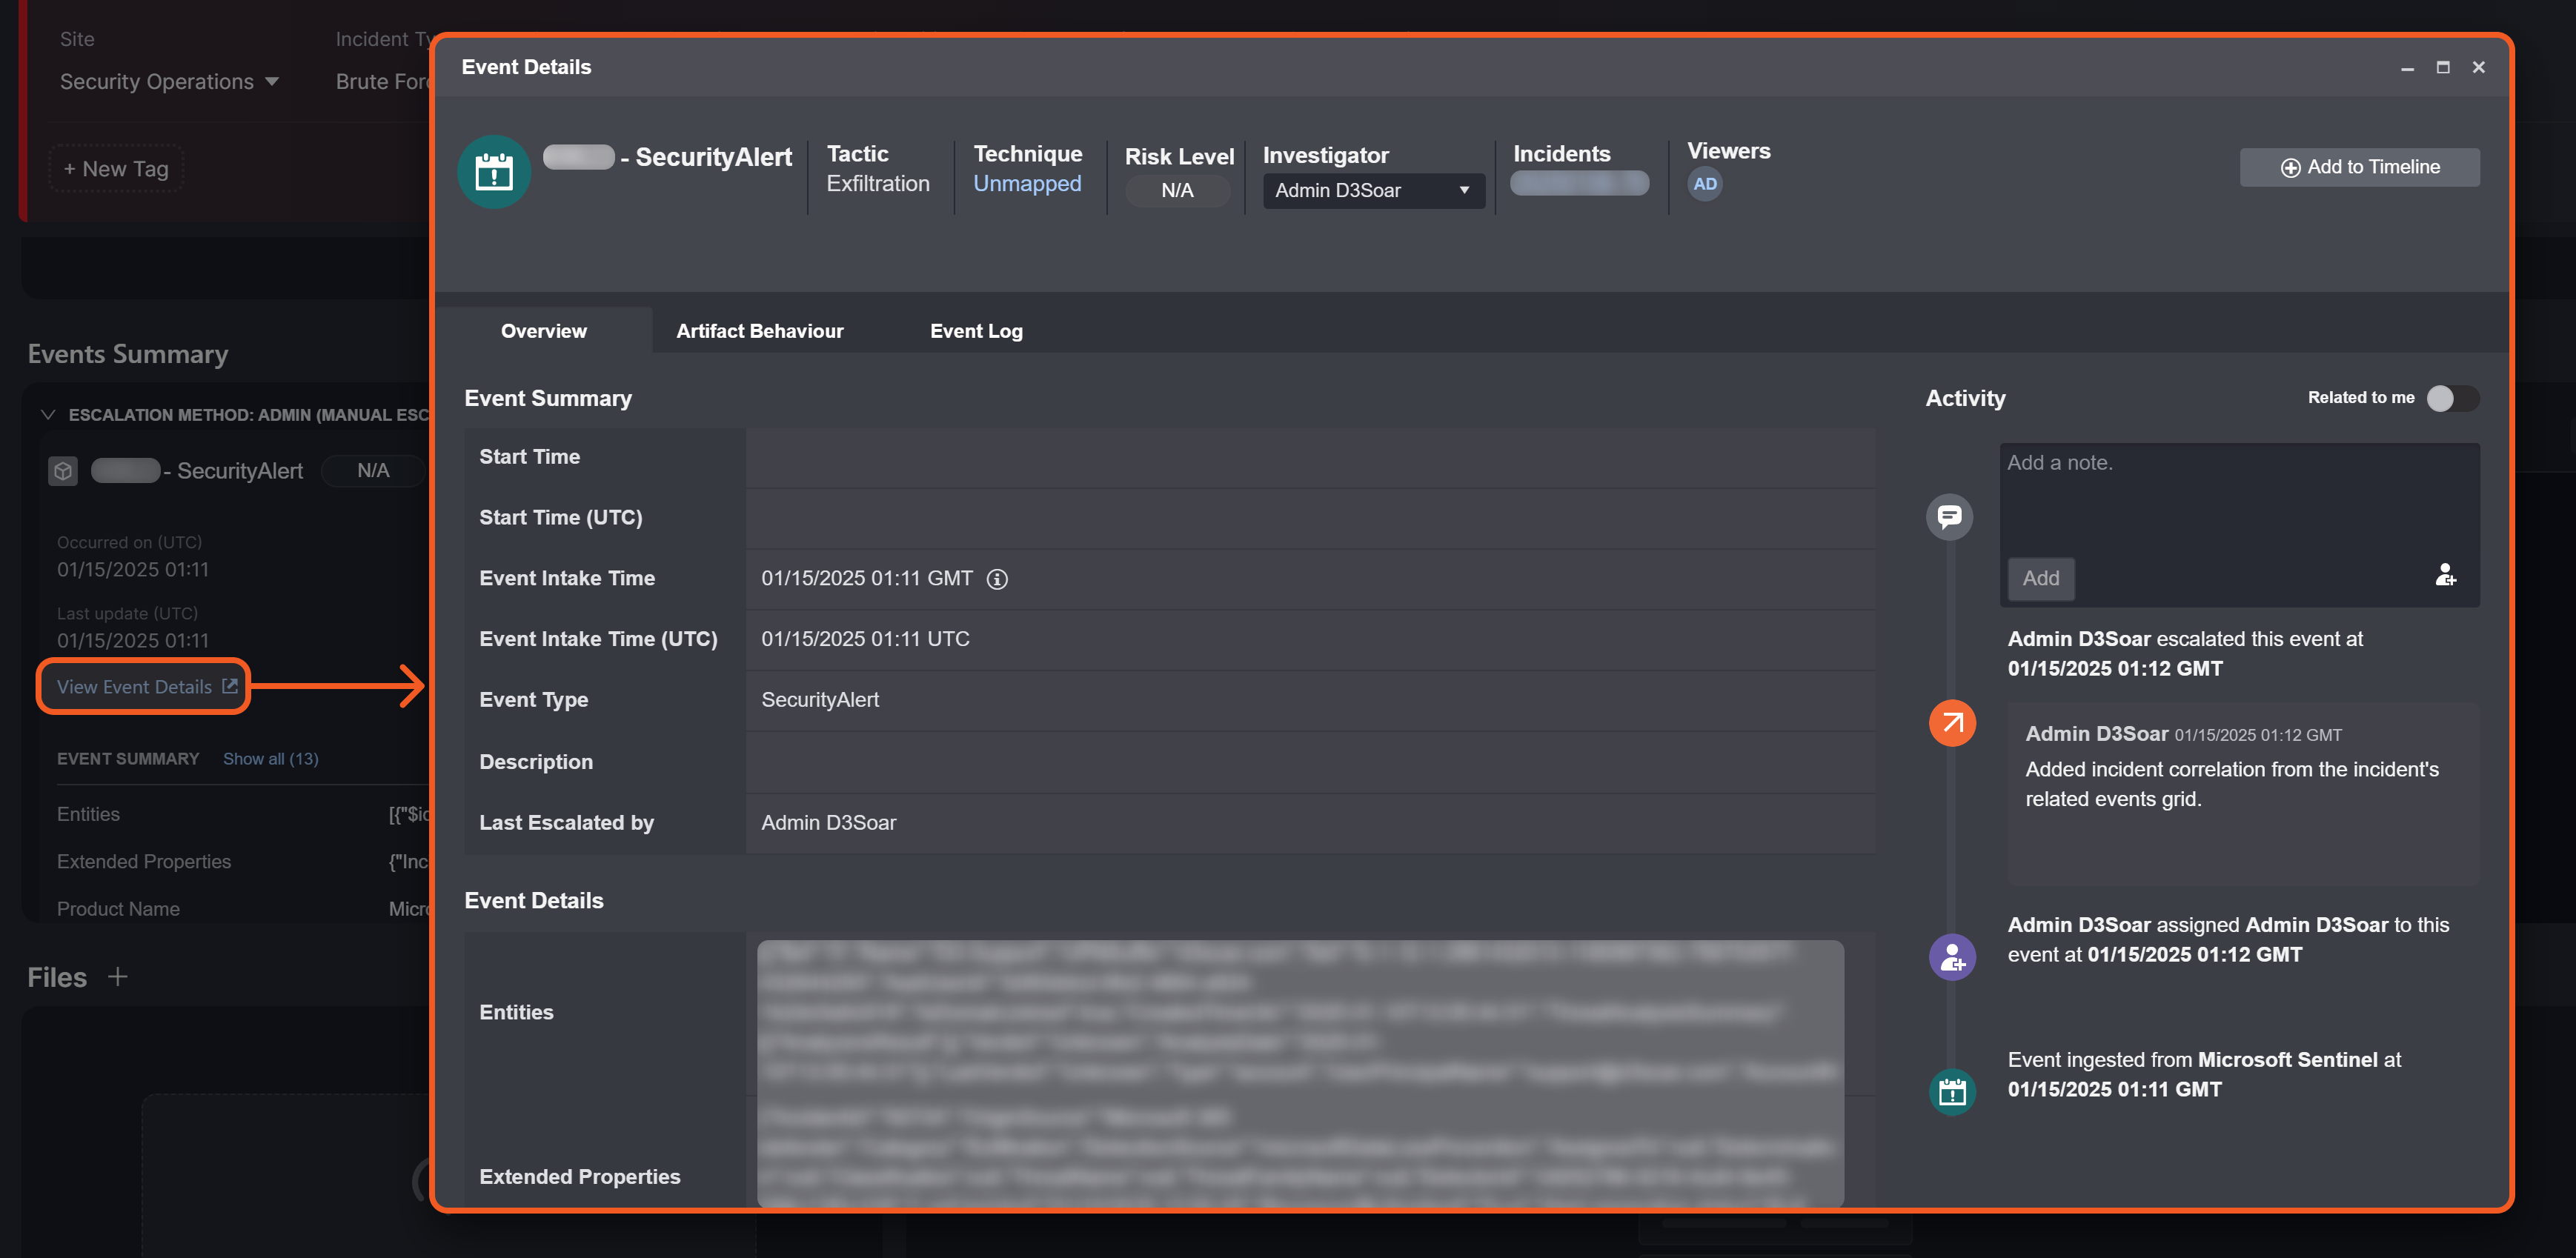
Events Summary
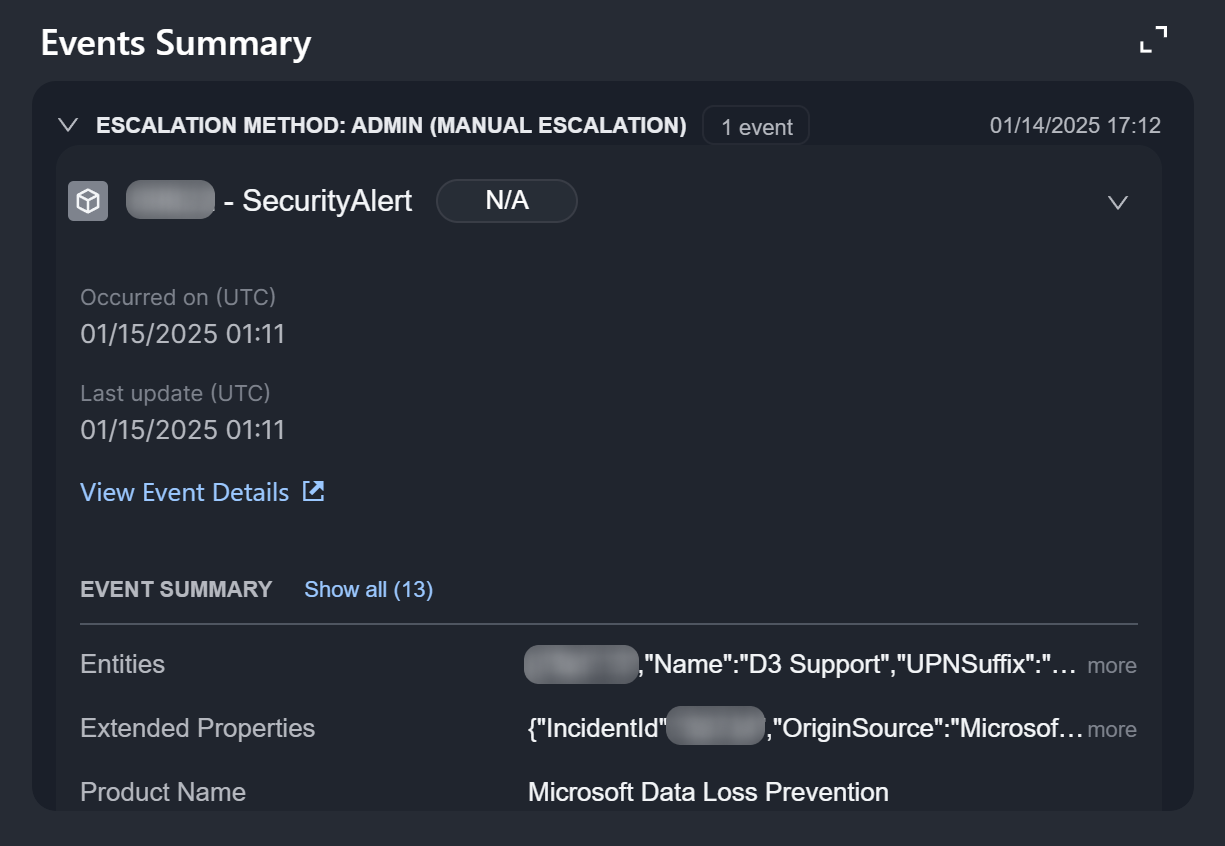
The Events Summary widget provides summaries of events linked to the incident, including their linkage method, event ID and name, risk level, occurrence and last updated dates, and a link to access the event details pop-up window for linked events.
Clicking the View Event Details link opens the Event Details pop-up window containing the details of the event.
Files
The Files widget allows users to upload files to the incident using a drag-and-drop interface.
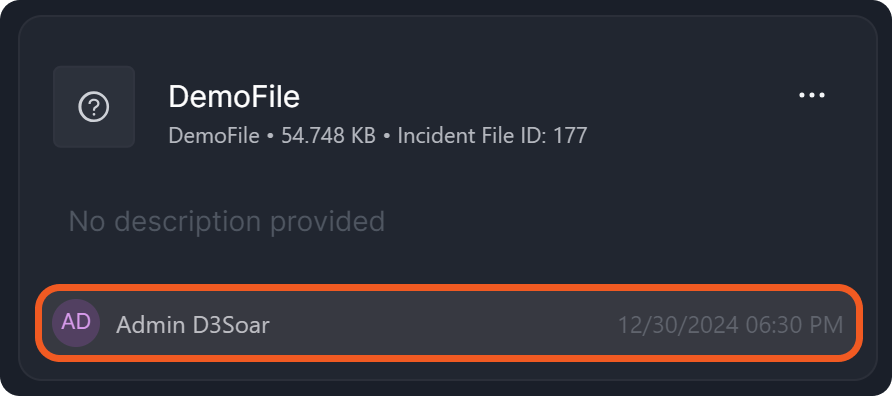
Each file card displays the file name, size, and unique incident file ID. Users can perform the actions Preview, Download, or Delete using the menu accessible through the -20241230-184908.png?inst-v=e416ef0a-975f-4240-8b76-b2350608028d) icon.
icon.
%201-20241230-183917.png?inst-v=e416ef0a-975f-4240-8b76-b2350608028d)
Upload details, including the uploader's name and timestamp, are displayed at the bottom of each file card.
Users can edit the file description by clicking the text area and cancel or confirm changes using the %203-20241230-185847.png?inst-v=e416ef0a-975f-4240-8b76-b2350608028d) and
and %202-20241230-185807.png?inst-v=e416ef0a-975f-4240-8b76-b2350608028d) buttons at the bottom-right.
buttons at the bottom-right.
-20241230-185253.png?inst-v=e416ef0a-975f-4240-8b76-b2350608028d)
Findings
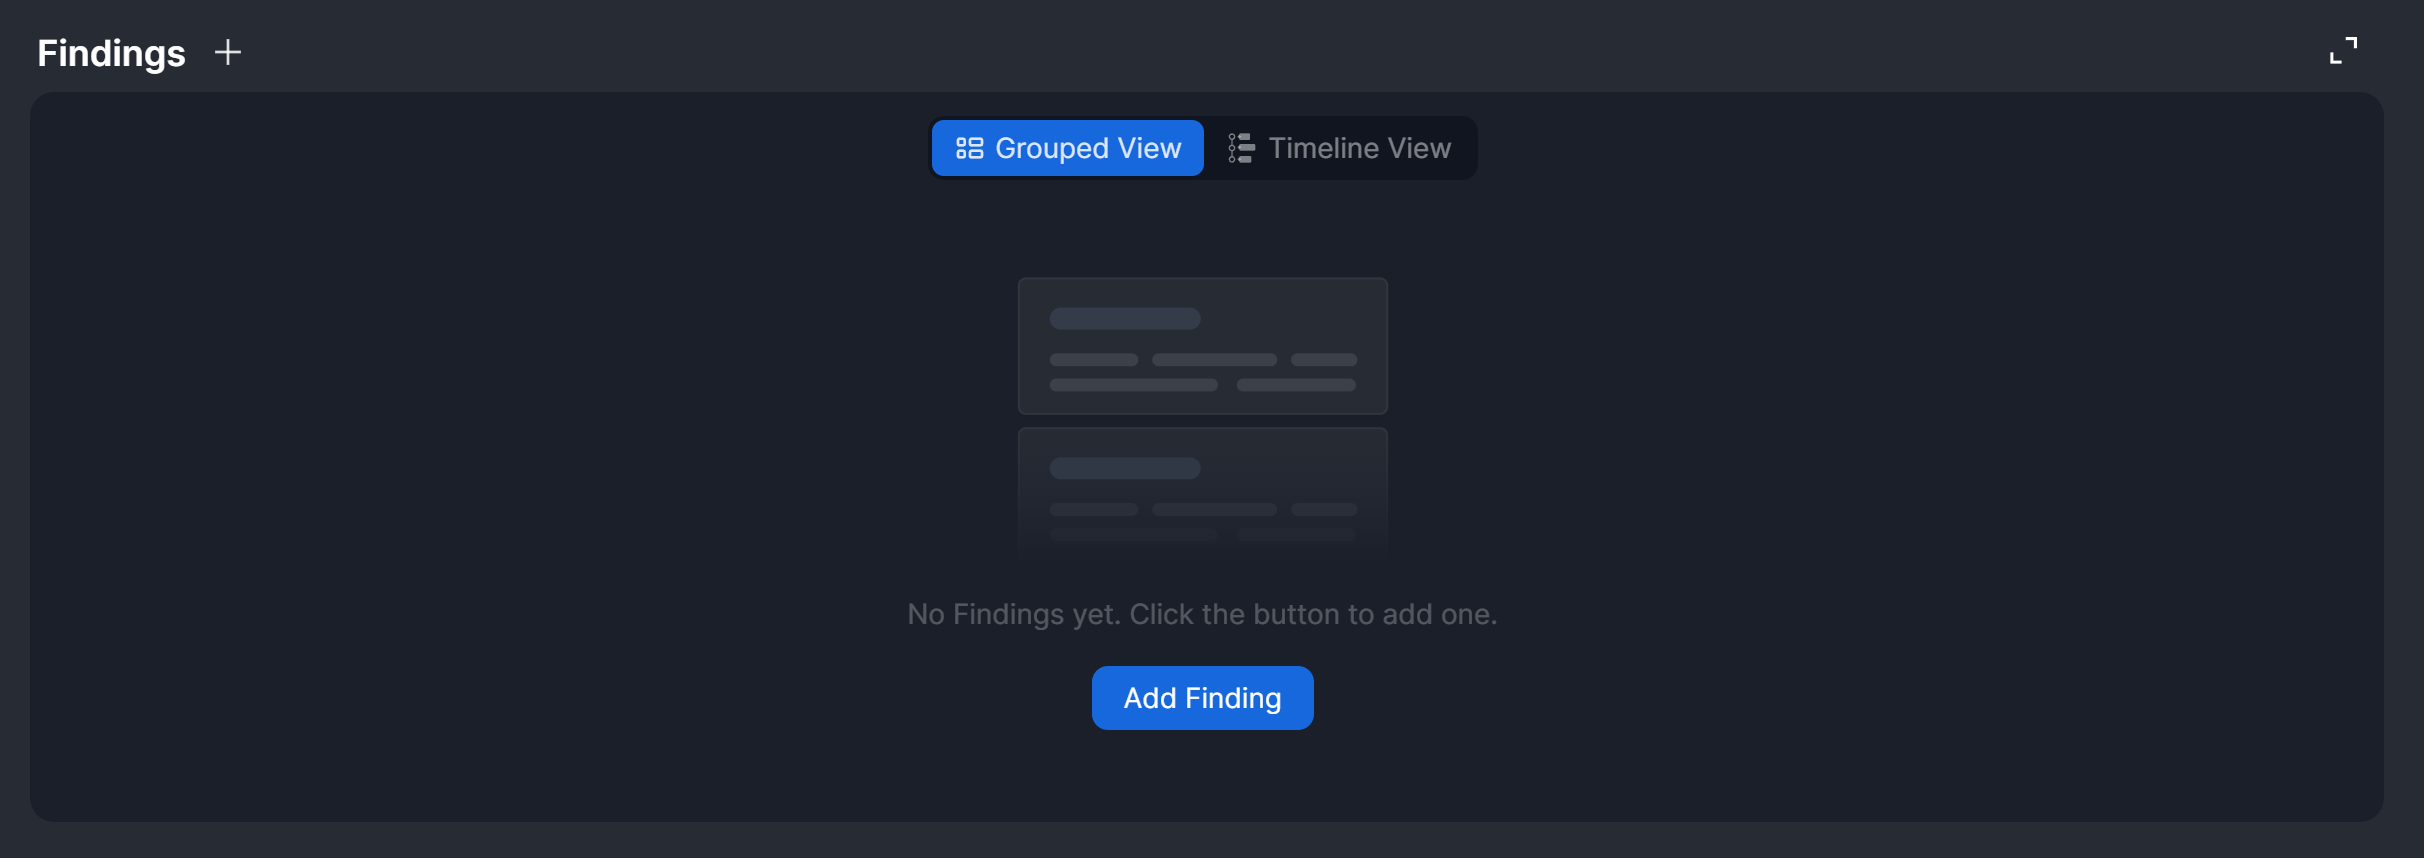
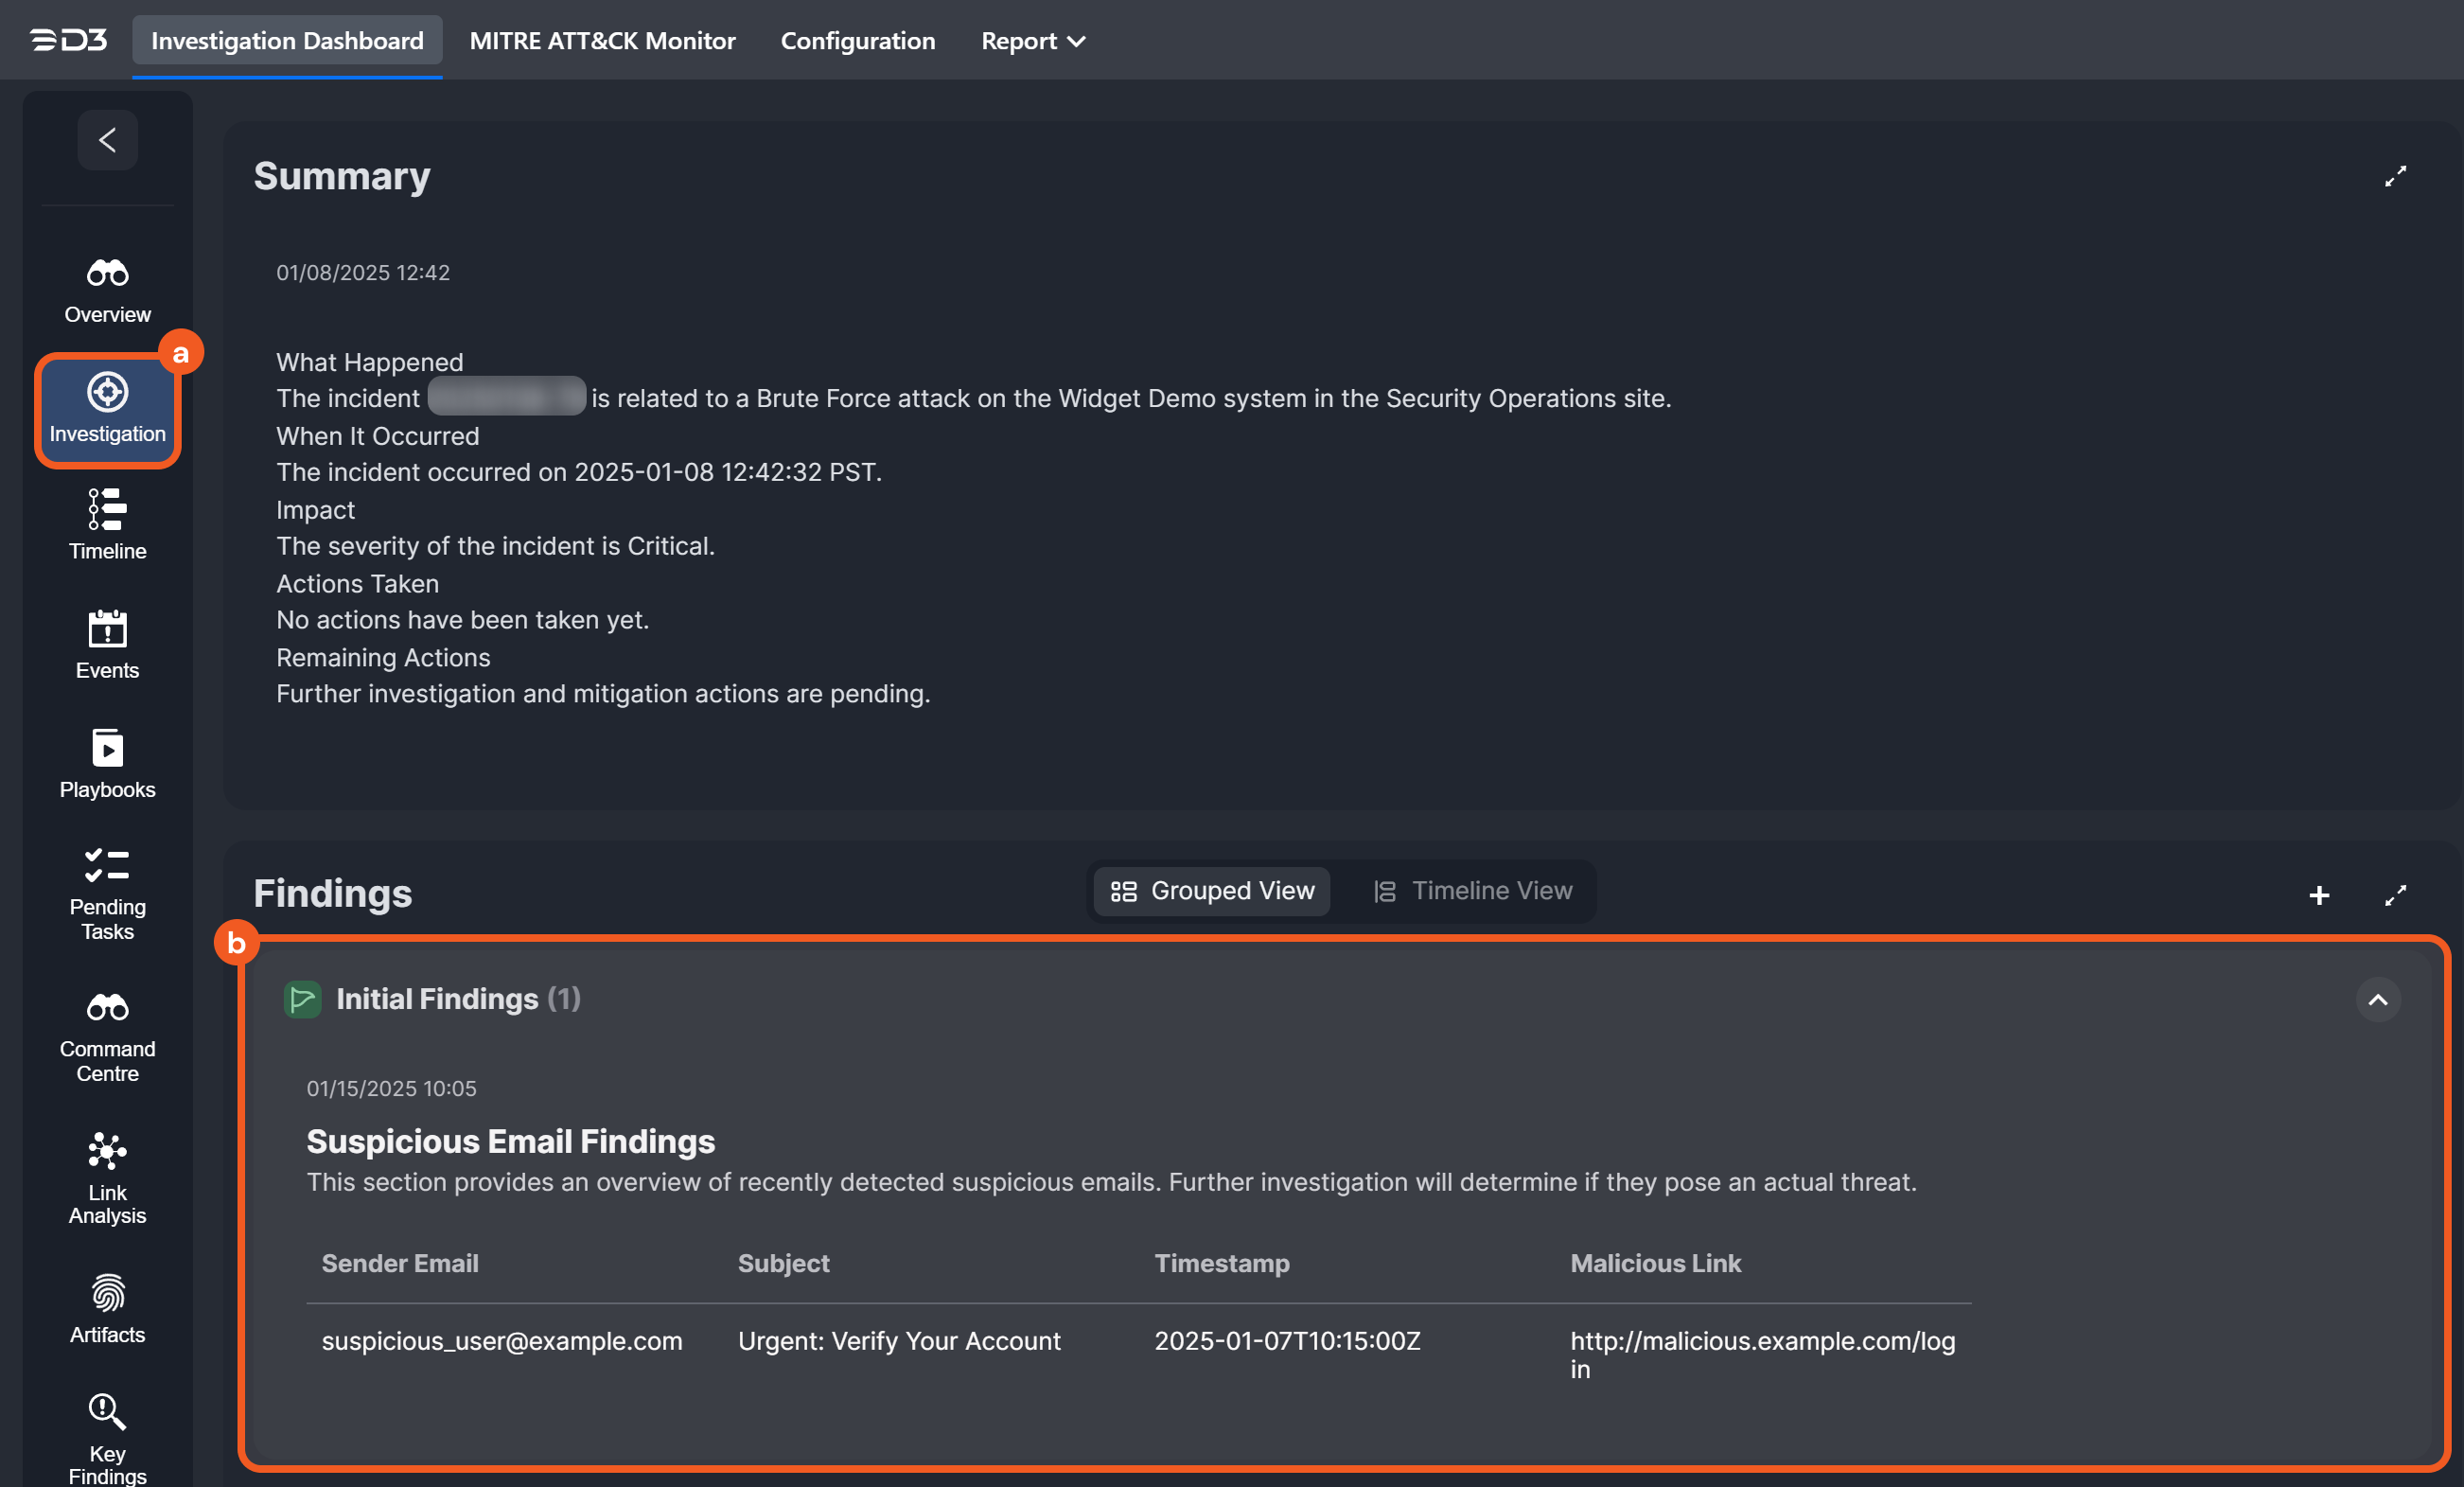
The Findings widget enables users to view, add, and edit investigation findings directly from the Overview tab. The data displayed in this widget mirrors the information in the Findings section of the Investigation tab.
Click on the
 button or Add Finding button.
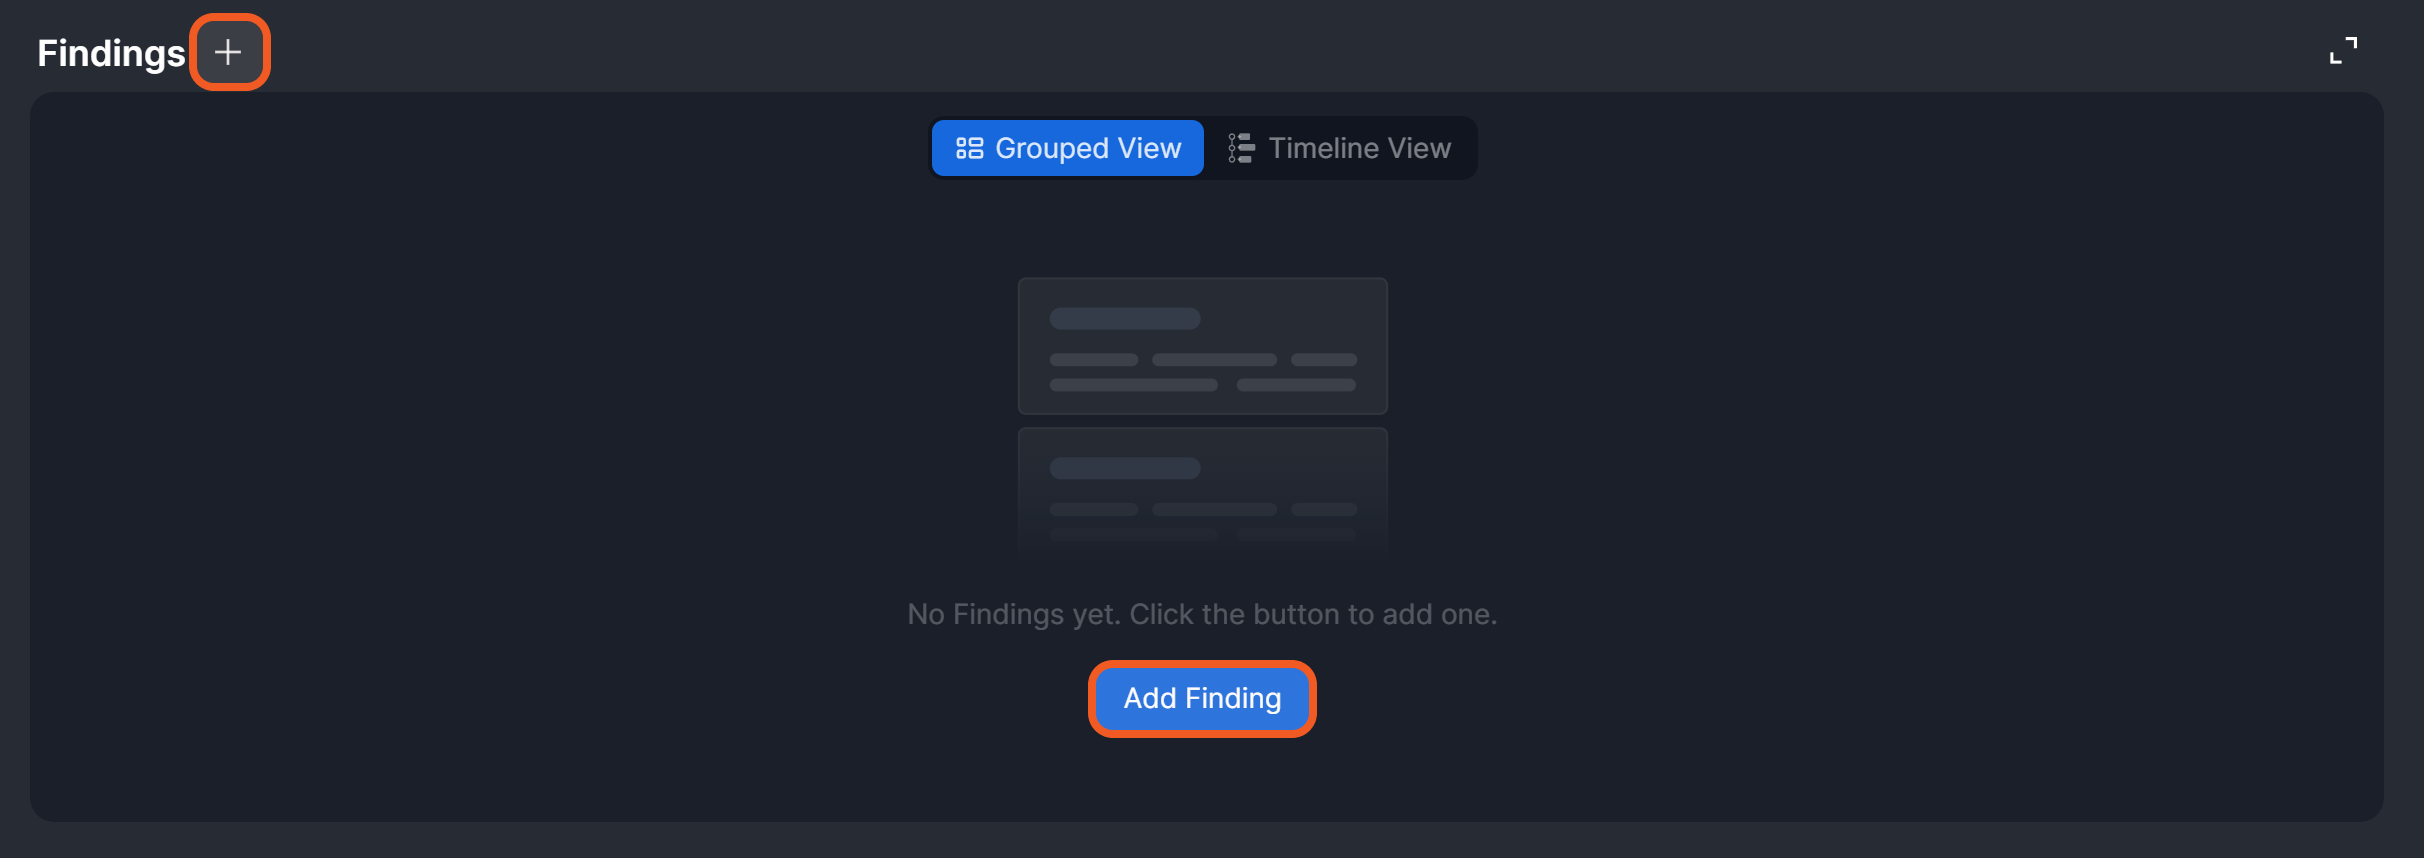
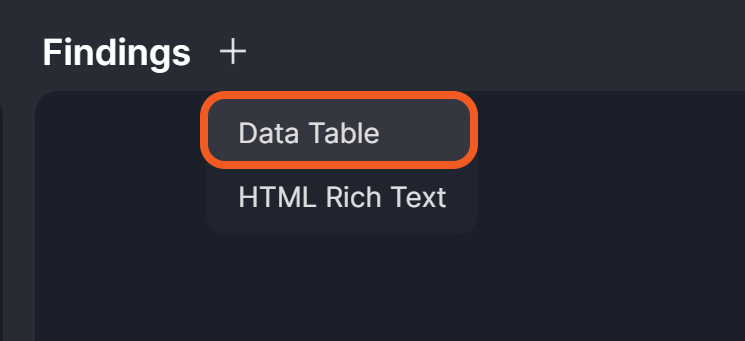
Click on the Data Table option.
Configure the table.
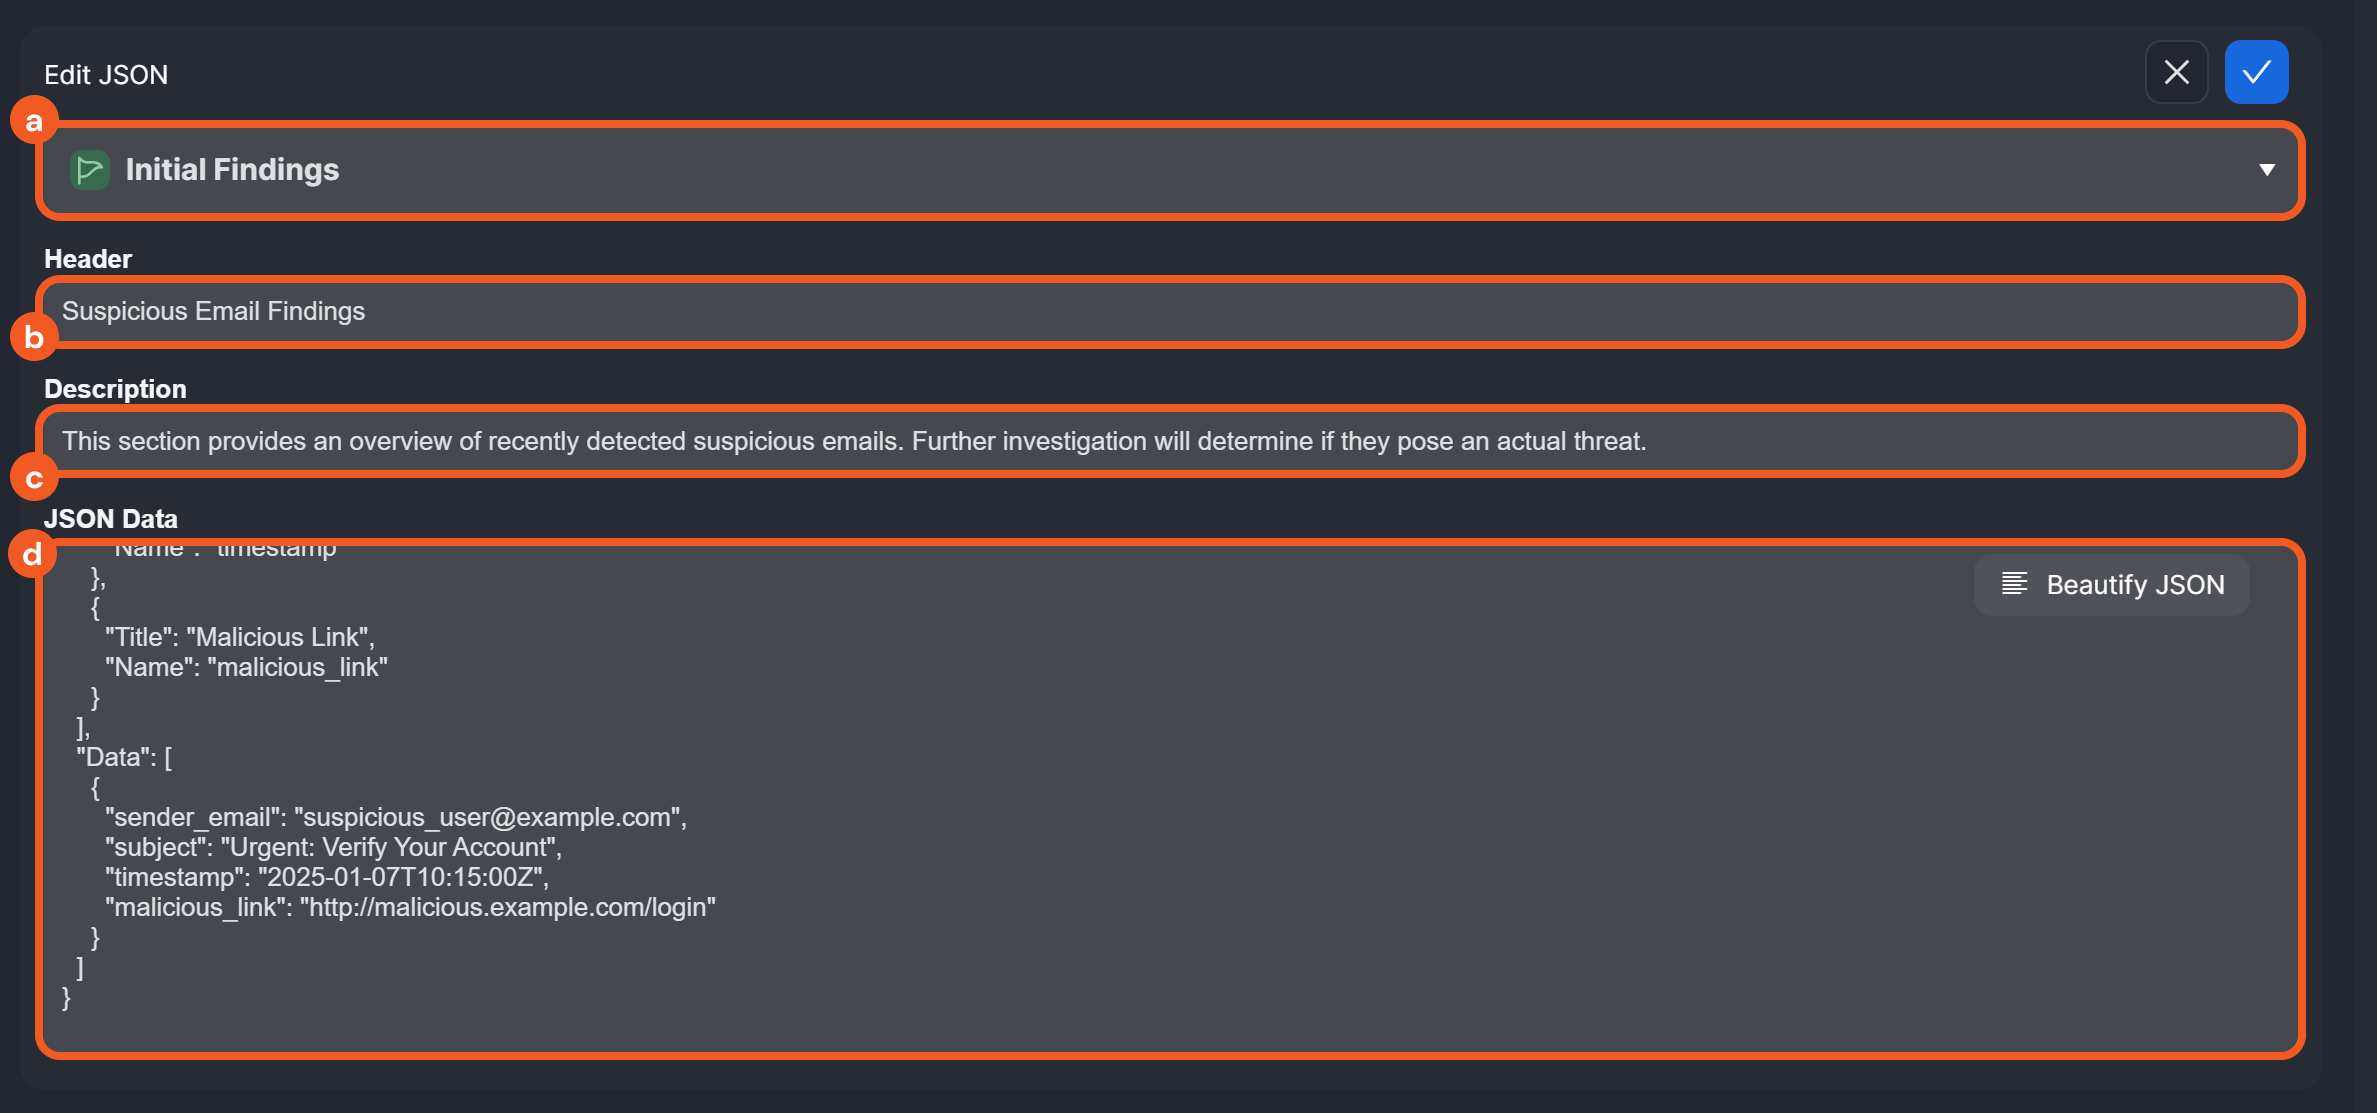
Select a suitable category from the dropdown.
Enter a descriptive header for the table.
Provide a brief description to help other users understand the table’s contents.
Use the code snippet below to create the table.
JSON{ "Fields": [ { "Title": "Sender Email", "Name": "sender_email" }, { "Title": "Subject", "Name": "subject" }, { "Title": "Timestamp", "Name": "timestamp" }, { "Title": "Malicious Link", "Name": "malicious_link" } ], "Data": [ { "sender_email": "suspicious_user@example.com", "subject": "Urgent: Verify Your Account", "timestamp": "2025-01-07T10:15:00Z", "malicious_link": "http://malicious.example.com/login" } ] }
Click on the
.png?inst-v=e416ef0a-975f-4240-8b76-b2350608028d) button to save.
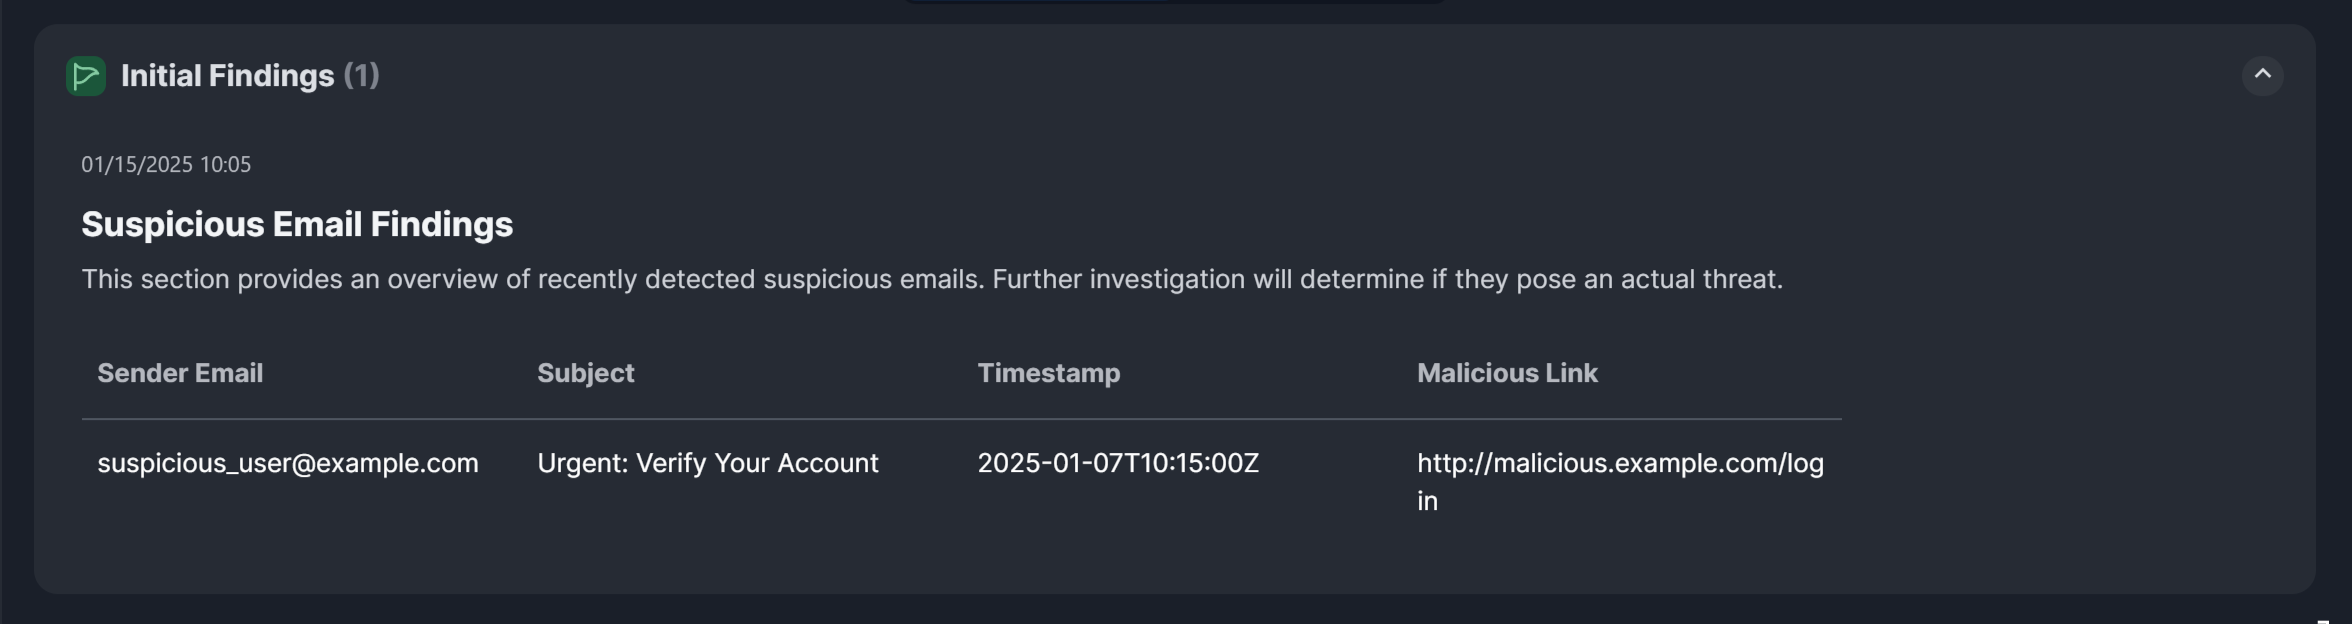
button to save.Confirm that the data table can be rendered properly.
(Optional) Click the Investigation tab to check if the newly added finding is also there.
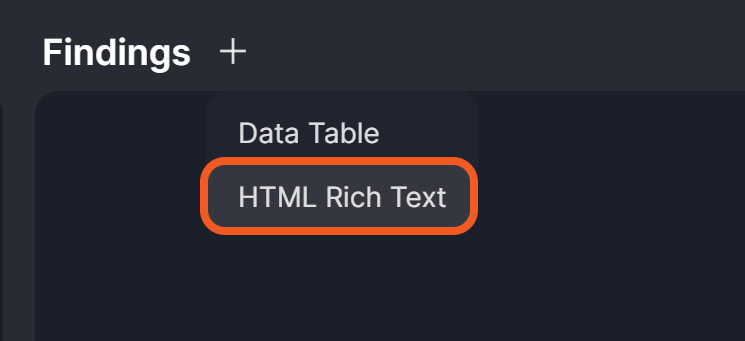
Click on the
button or Add Finding button.Click on the HTML Rich Text option.
Add the content.
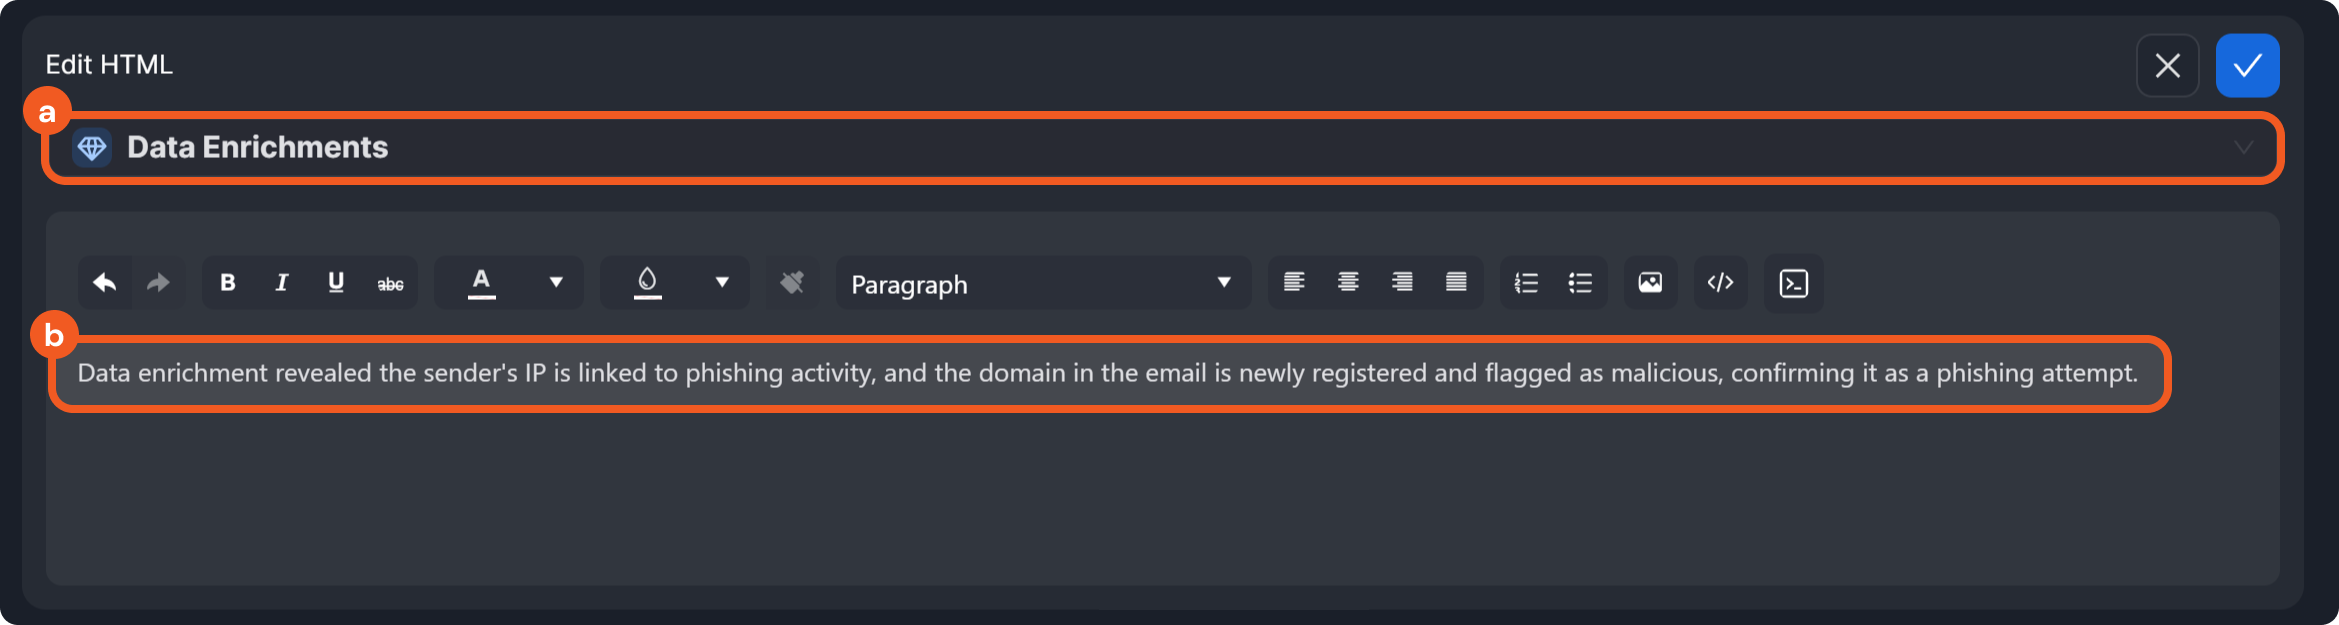
Select a suitable category from the dropdown.
Add the finding using the HTML Rich Text editor.
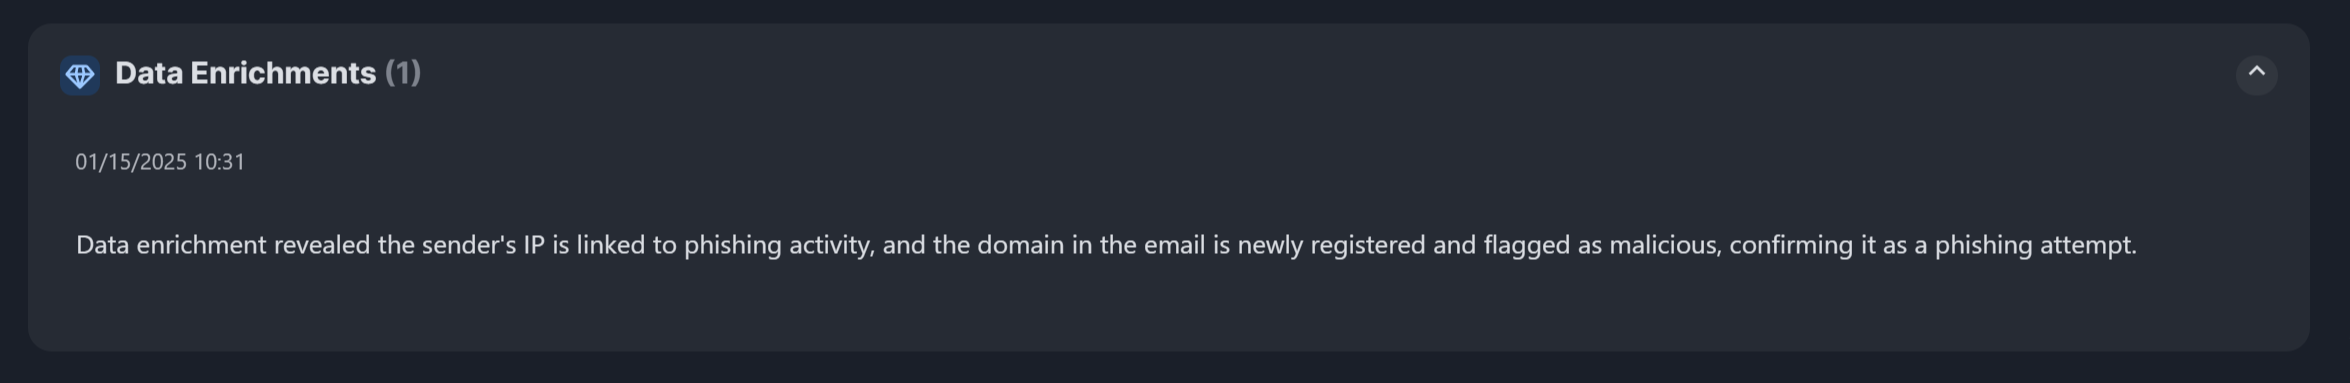
Click on the
button to save.Confirm that the content can be rendered properly.
(Optional) Click the Investigation tab to check if the newly added finding is also there.
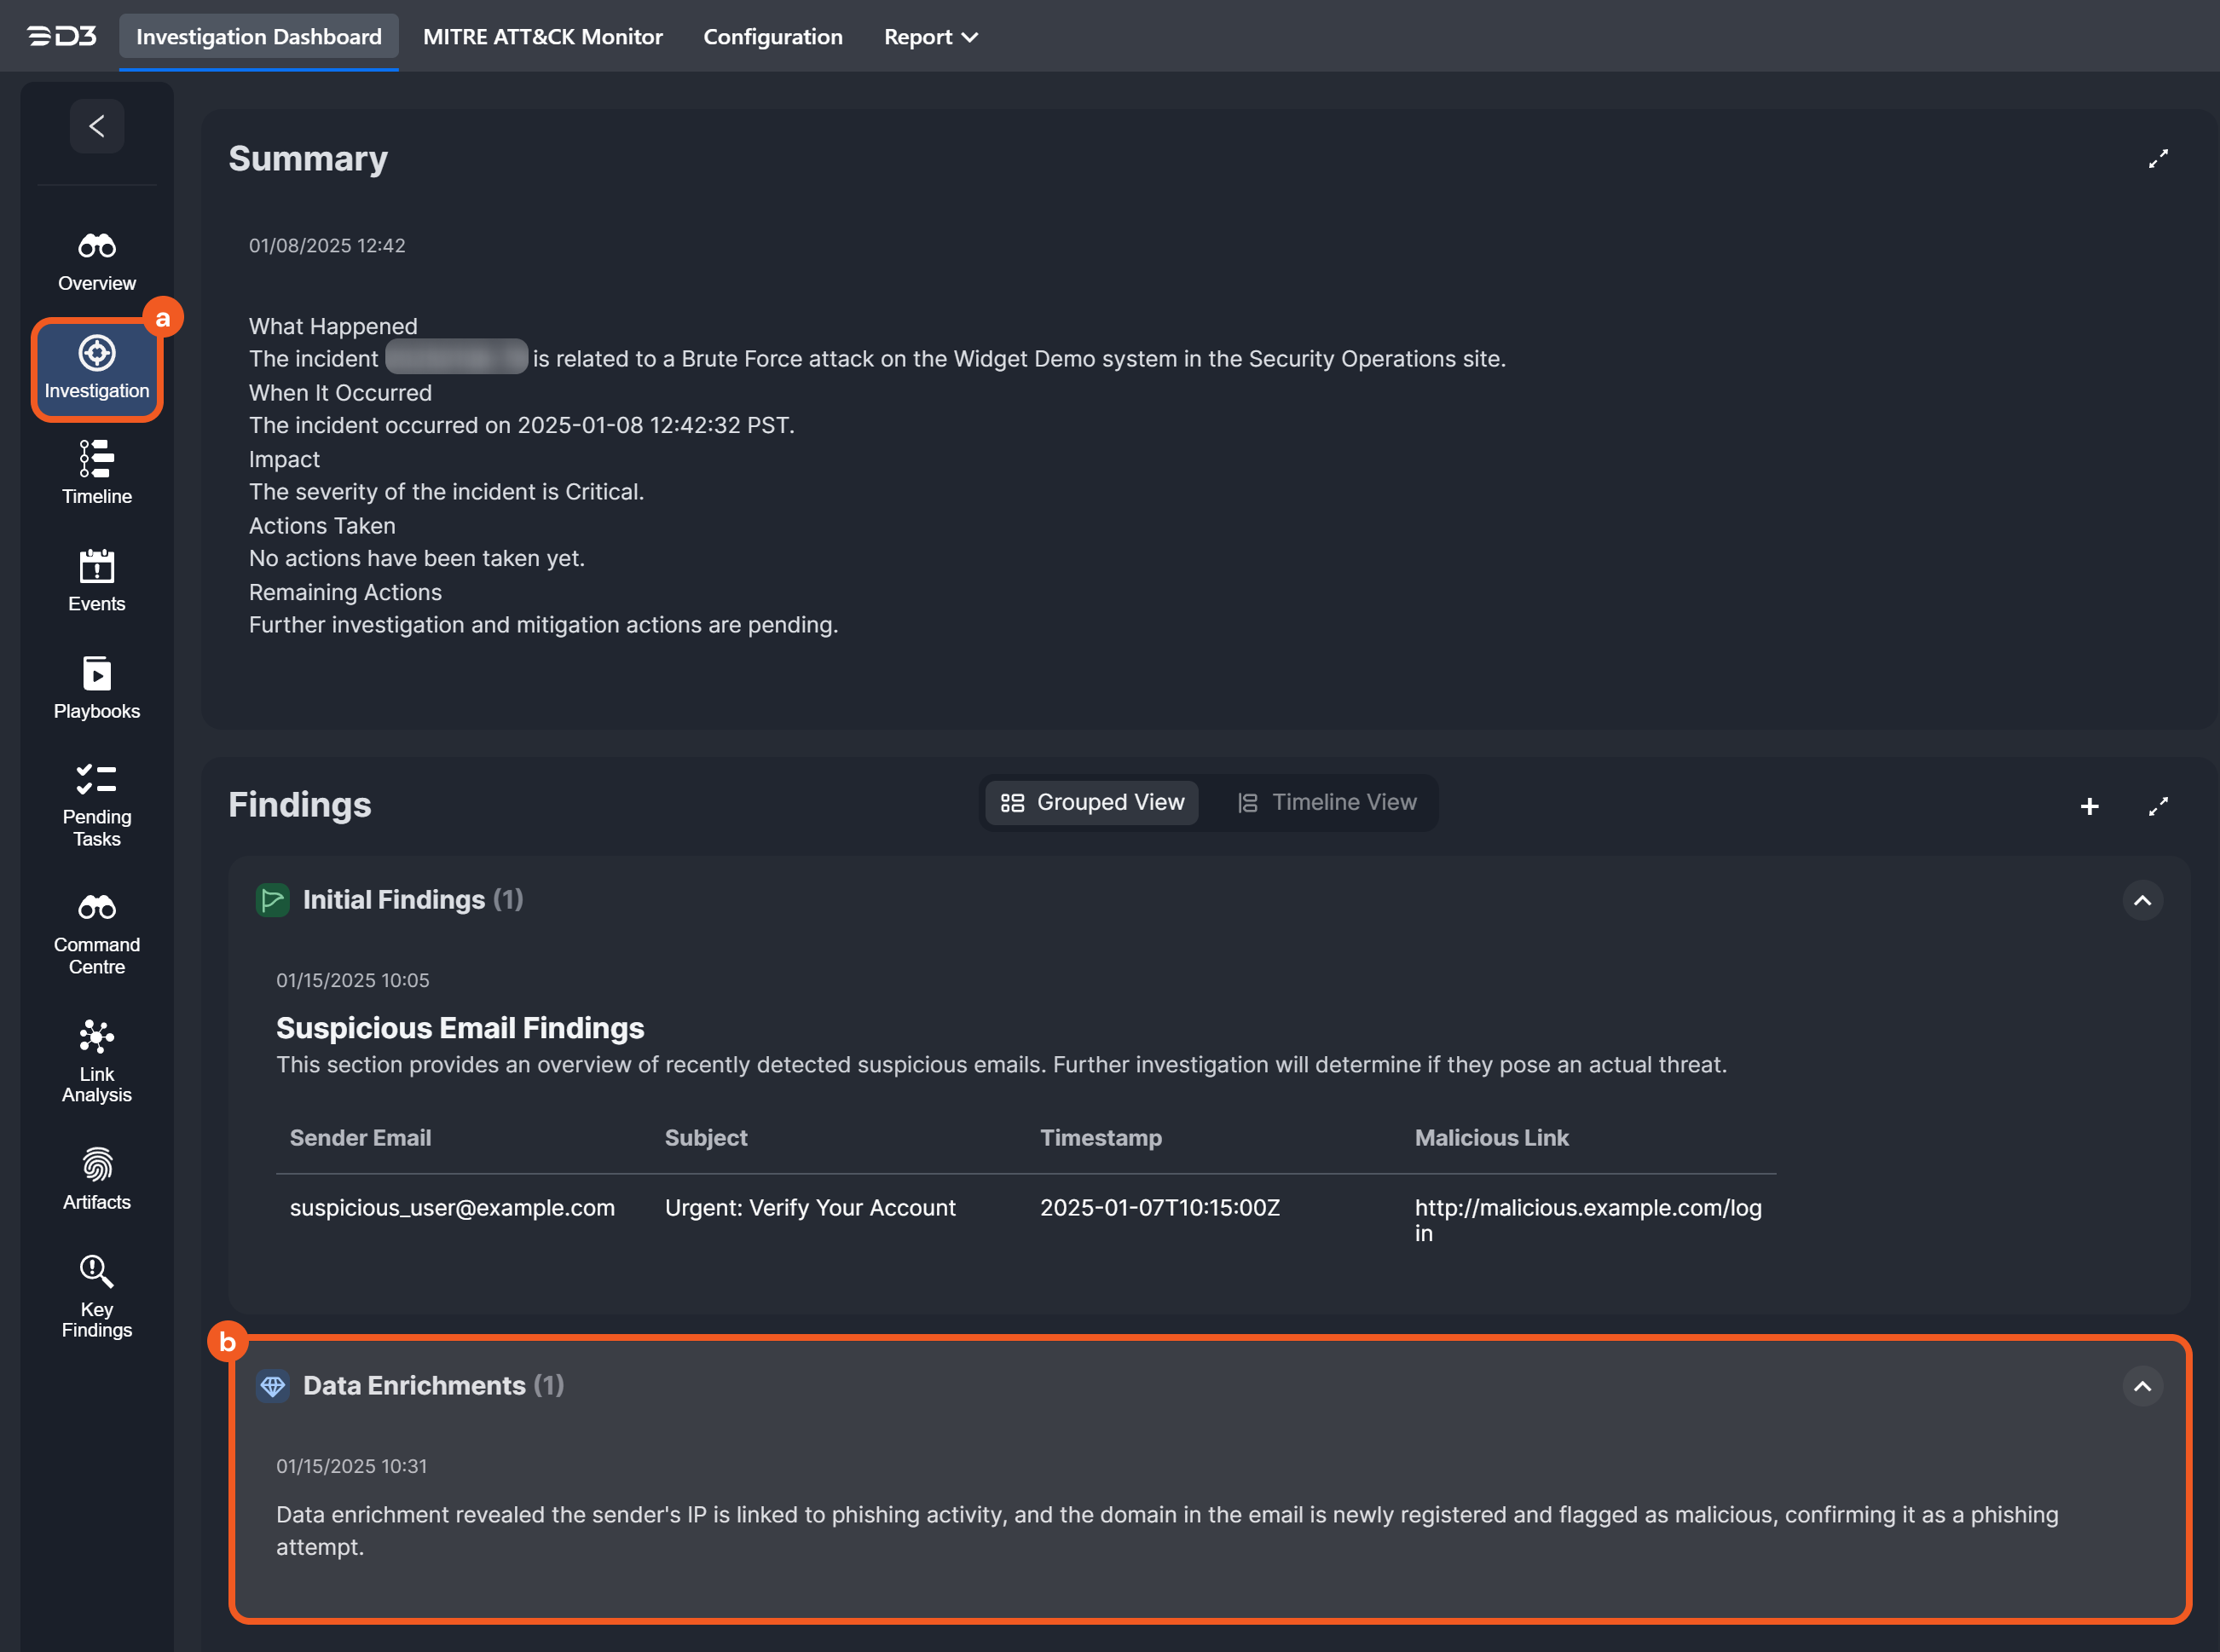
Users can switch between views the Grouped View and Timeline View when reviewing findings.
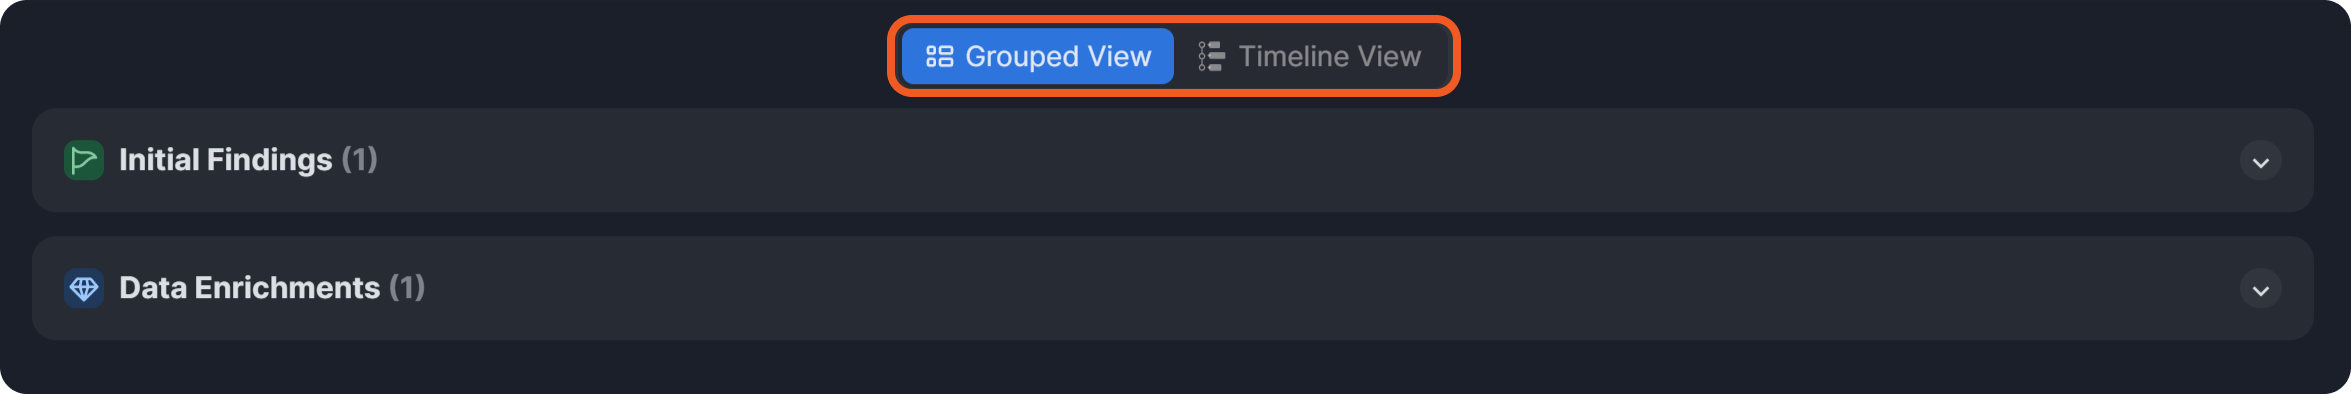
Grouped View
In the grouped view, findings are organized into categories, such as Initial Findings and Data Enrichments.
.png?inst-v=e416ef0a-975f-4240-8b76-b2350608028d)
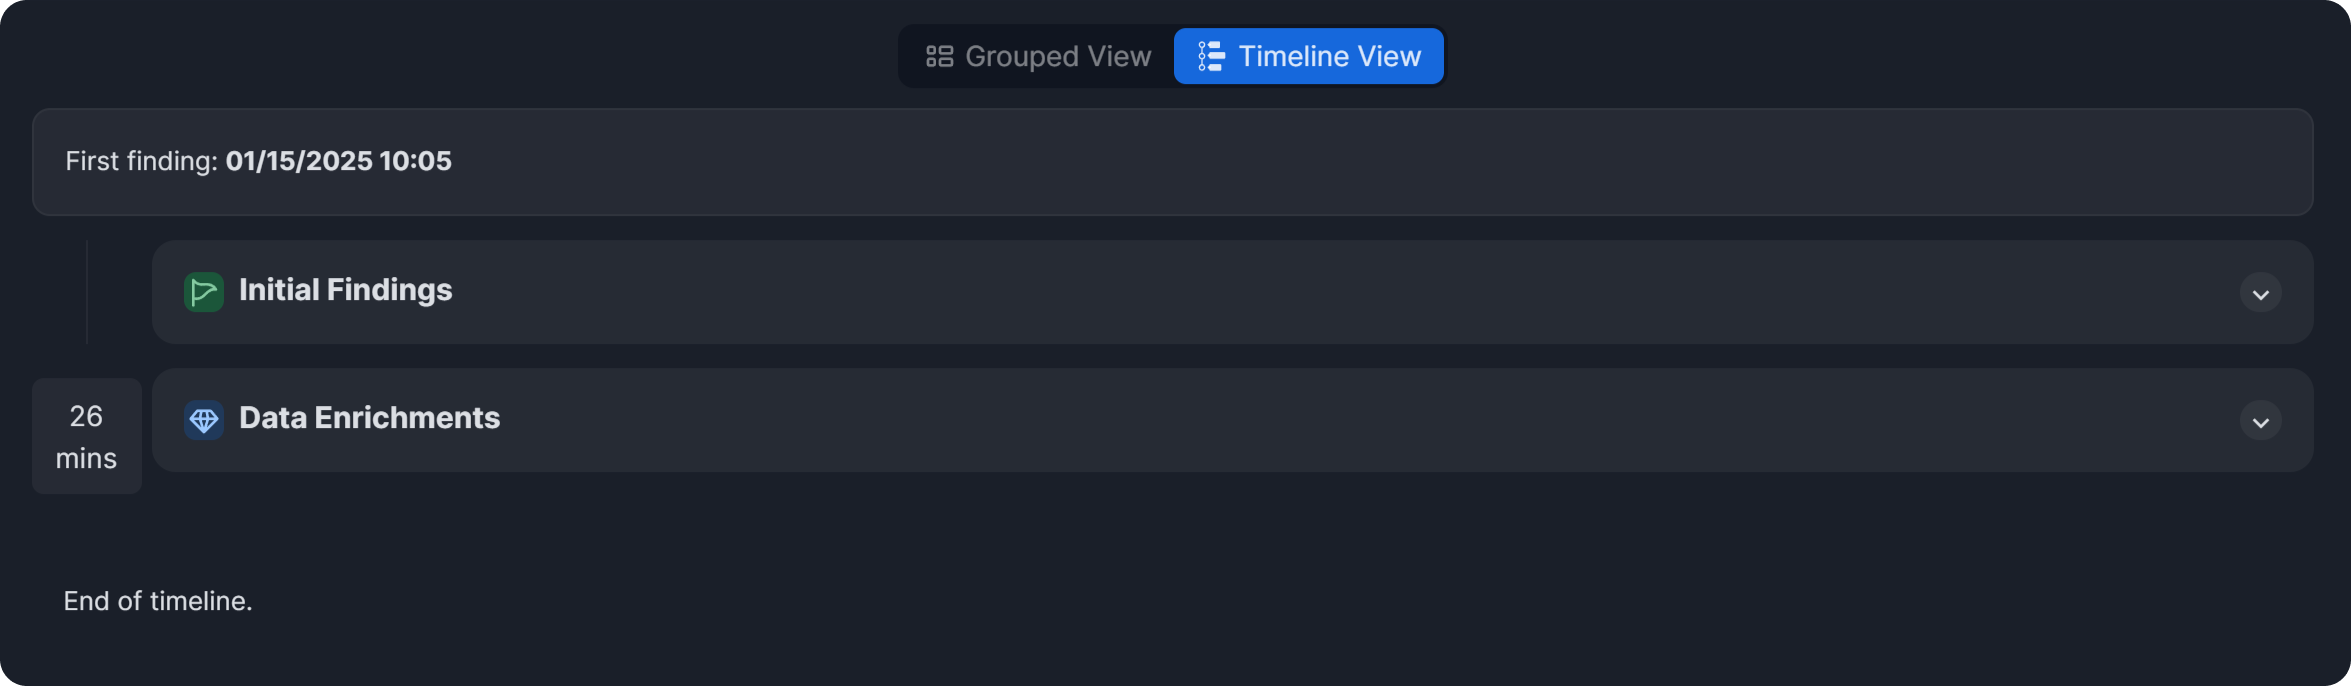
Timeline View
In the timeline view, findings are displayed in chronological order from top to bottom, starting with the earliest added finding.
HTML
%201-20241231-185037.png?inst-v=e416ef0a-975f-4240-8b76-b2350608028d)
The new HTML widget allows users to dynamically add custom HTML content, allowing the display of richly formatted information.
To edit the content, hover over the HTML widget and click on the
icon.To clear the HTML widget, hover over the HTML widget, click on the
icon, then click on the Clear button.
Incident Form
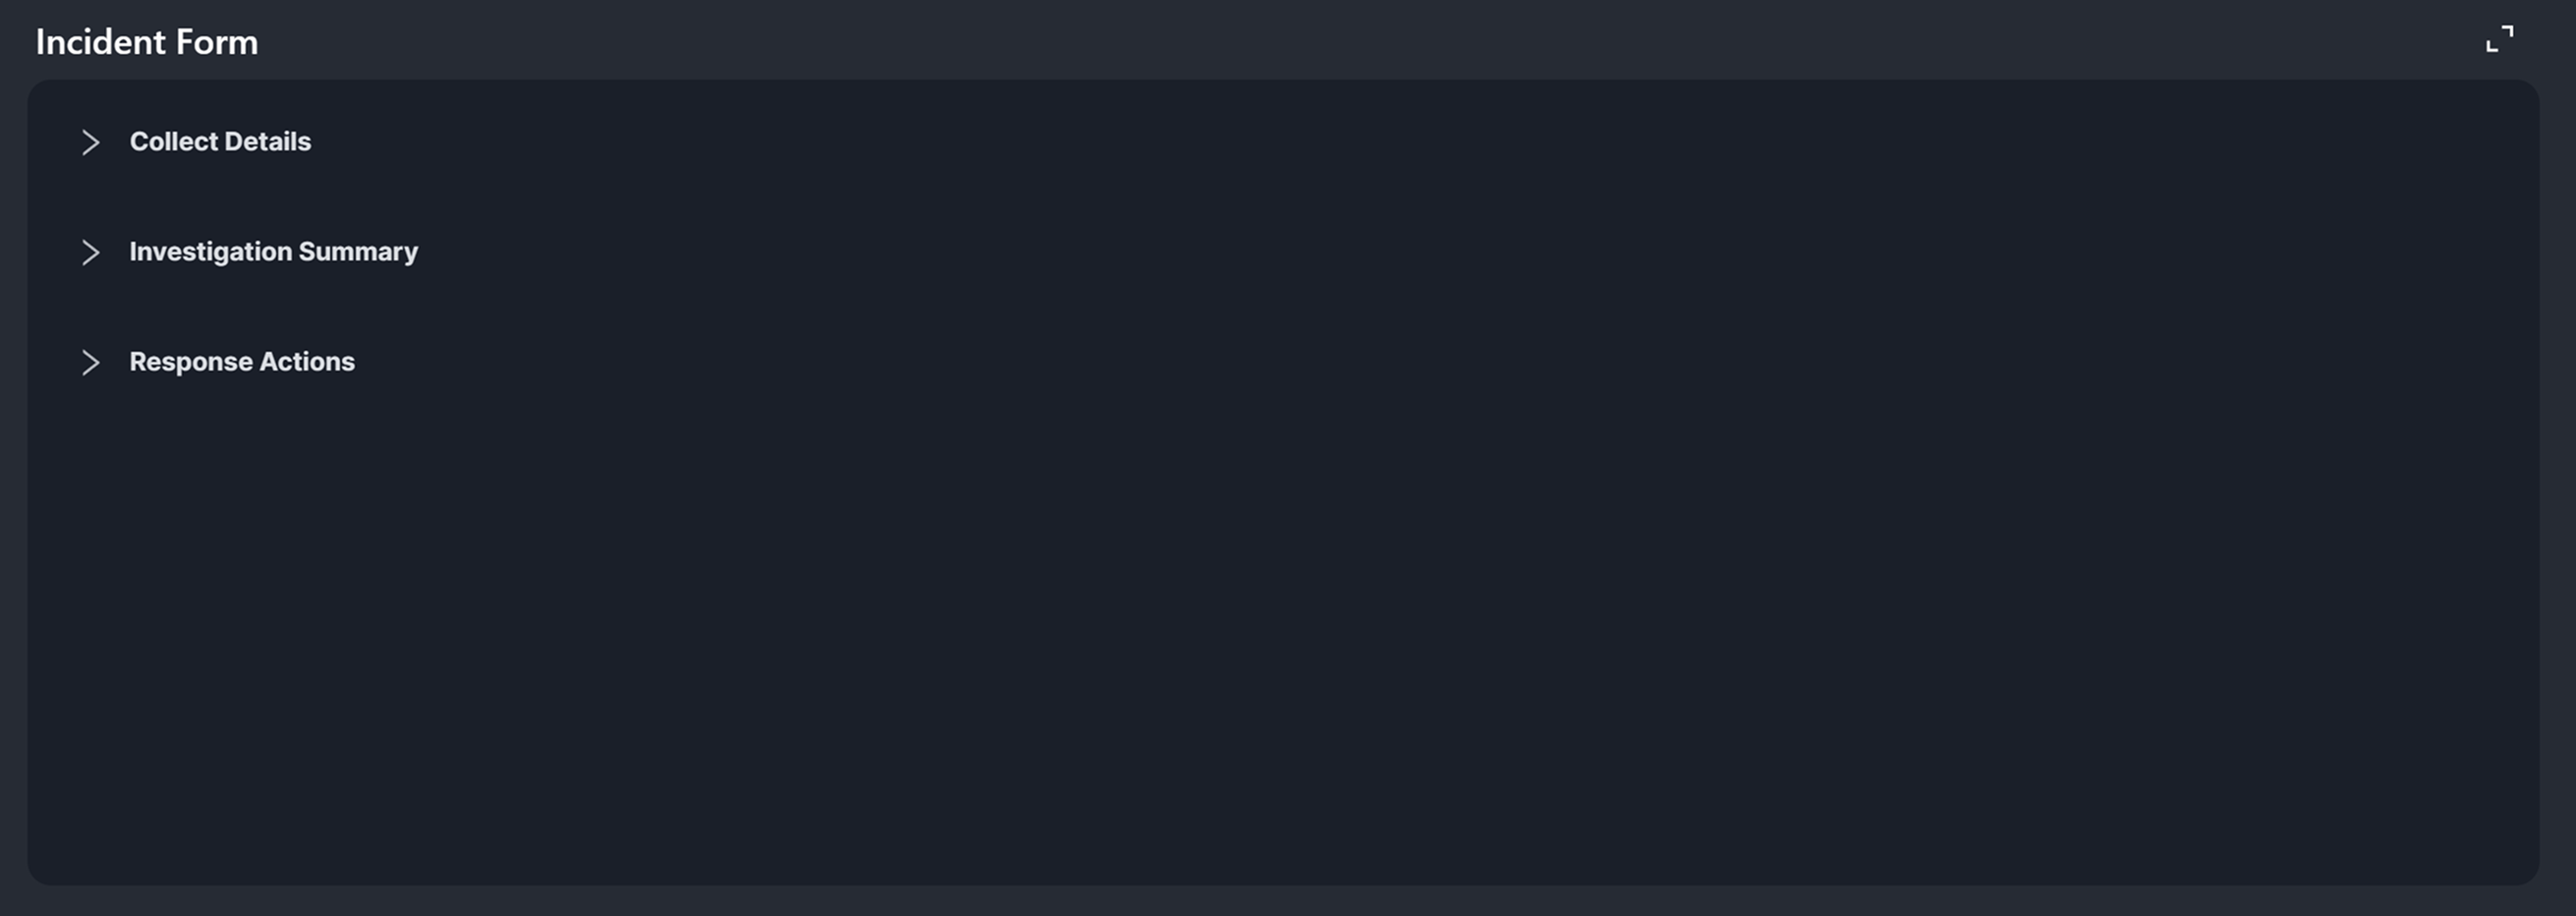
The Incident Form widget allows users to add or update information about the incident using the incident forms associated with the incident. For details on creating and filling out an incident form, refer to Creating an Incident Form and Filling Out the Incident Form During an Investigation, respectively.
Investigation Team
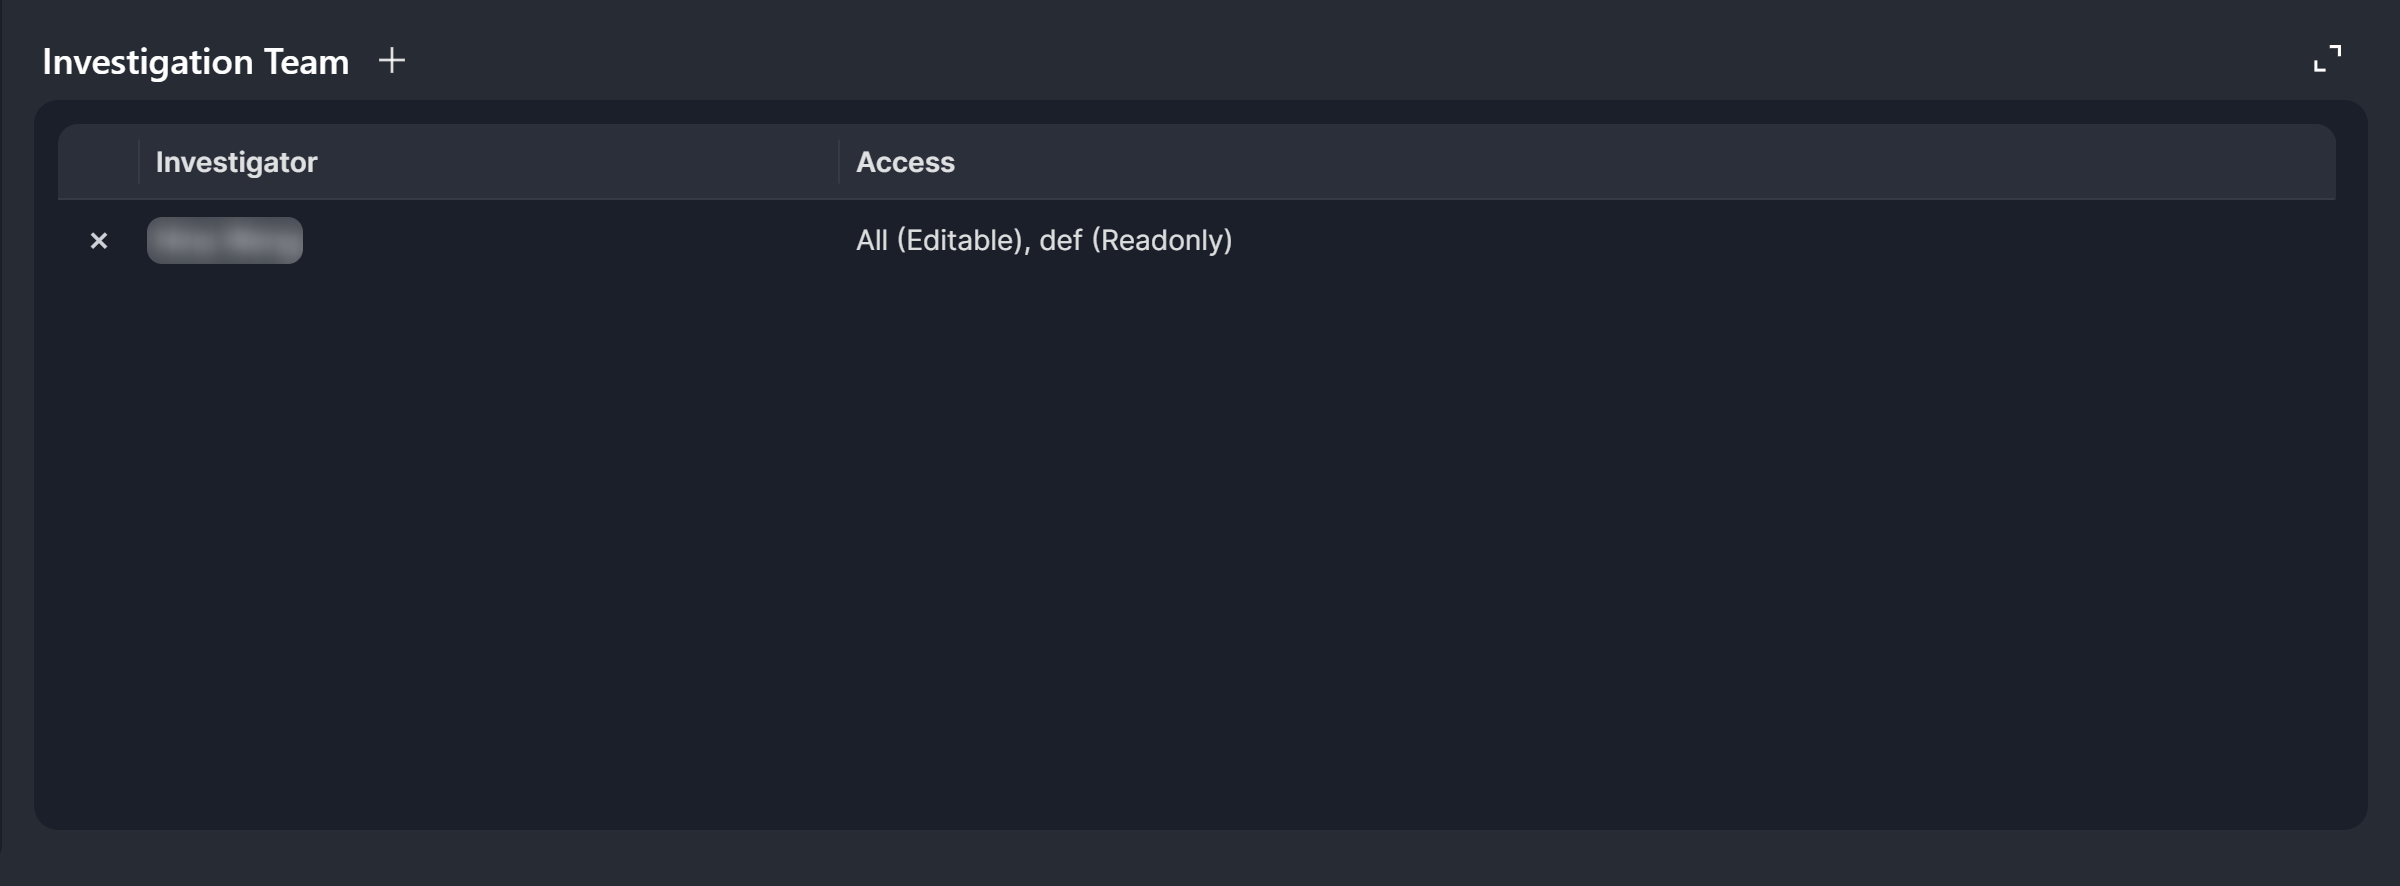
The Investigation Team widget displays users assigned to work on the incident and their access level. It also allows users to edit the team.
Click on the
 button.
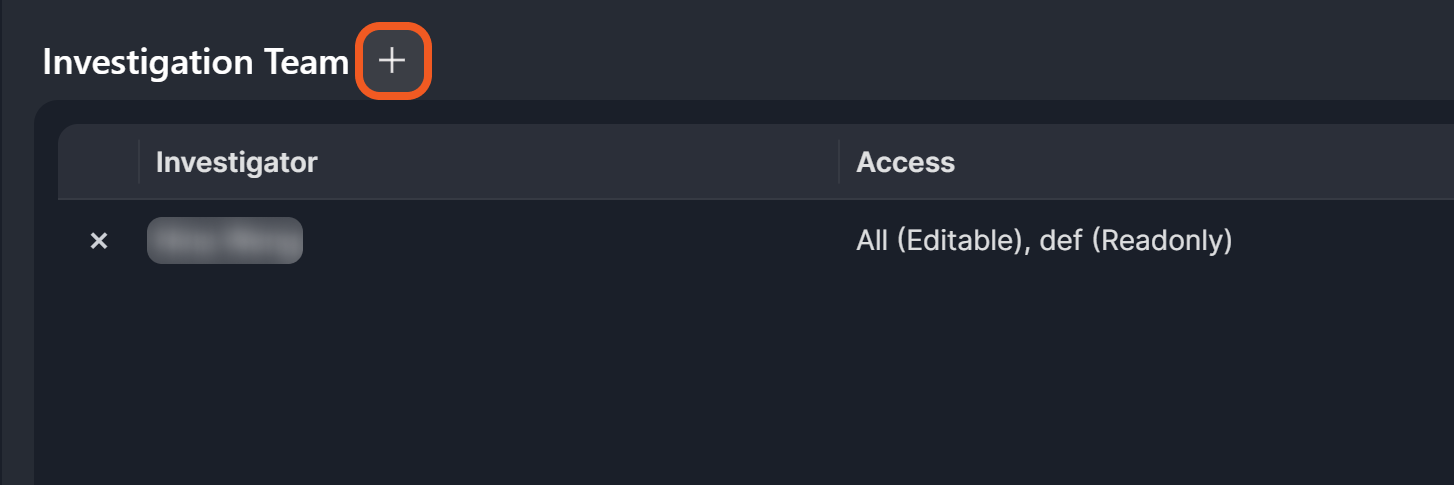
Add the investigators.
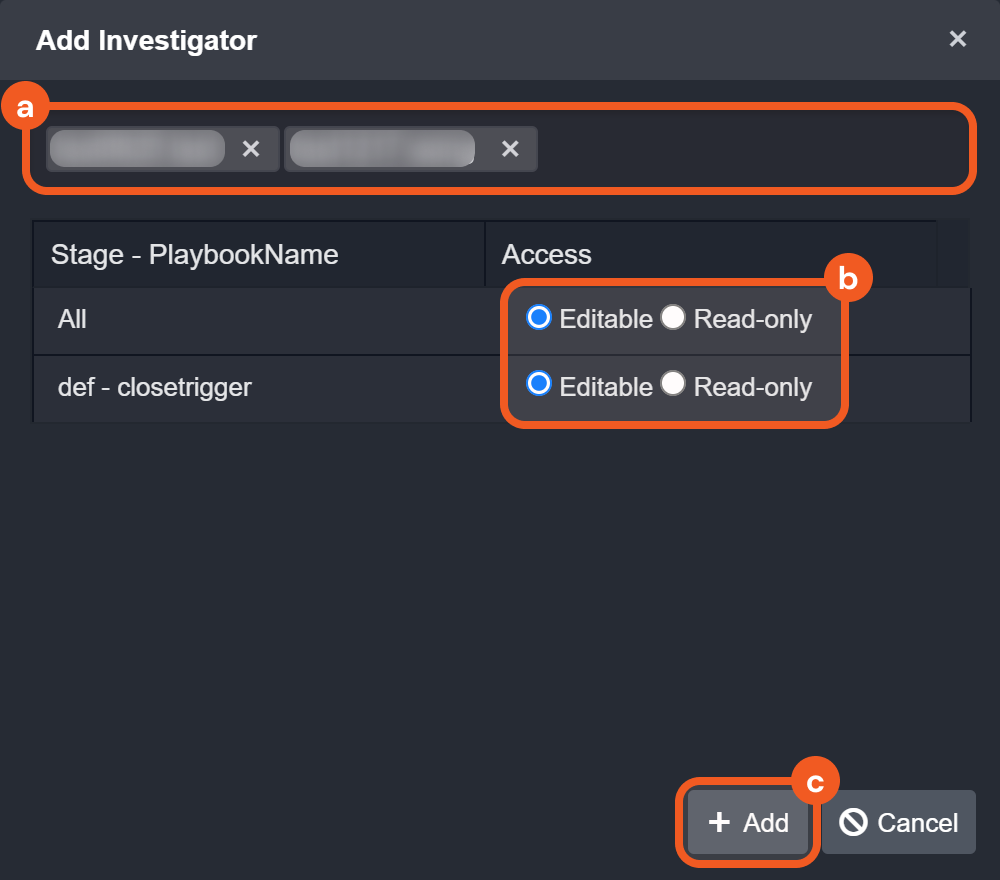
Search for and select the users to add by their names.
Define their access level as constrained by stage tasks.
Click on the + Add button.
Click on the
 button to delete the user.
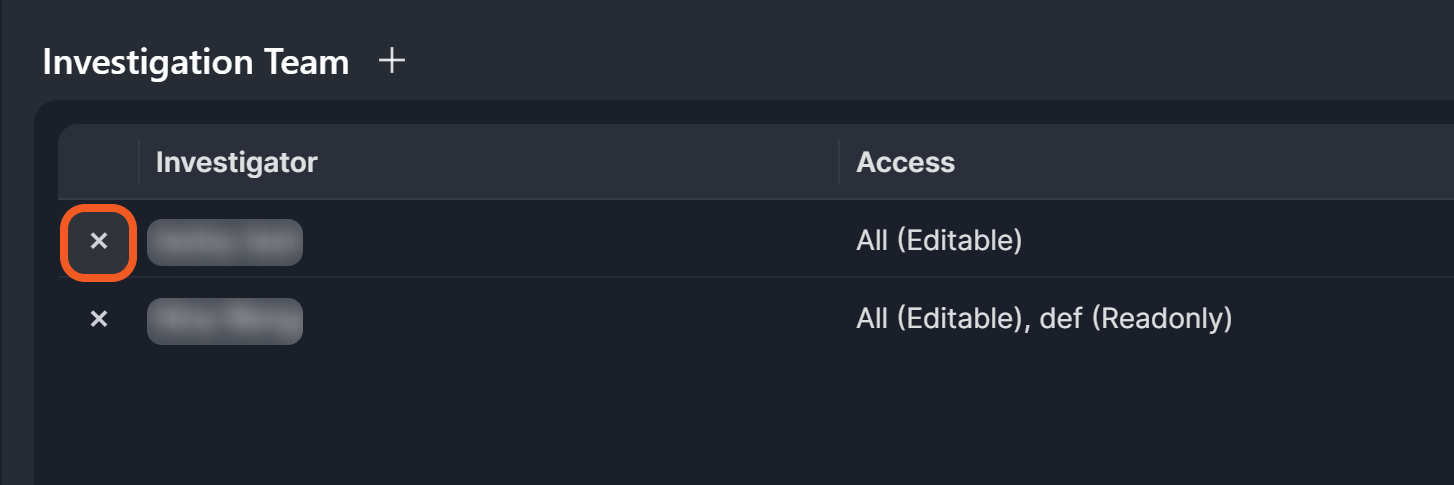
Click on the
 button.
Modify the investigator’s access level.
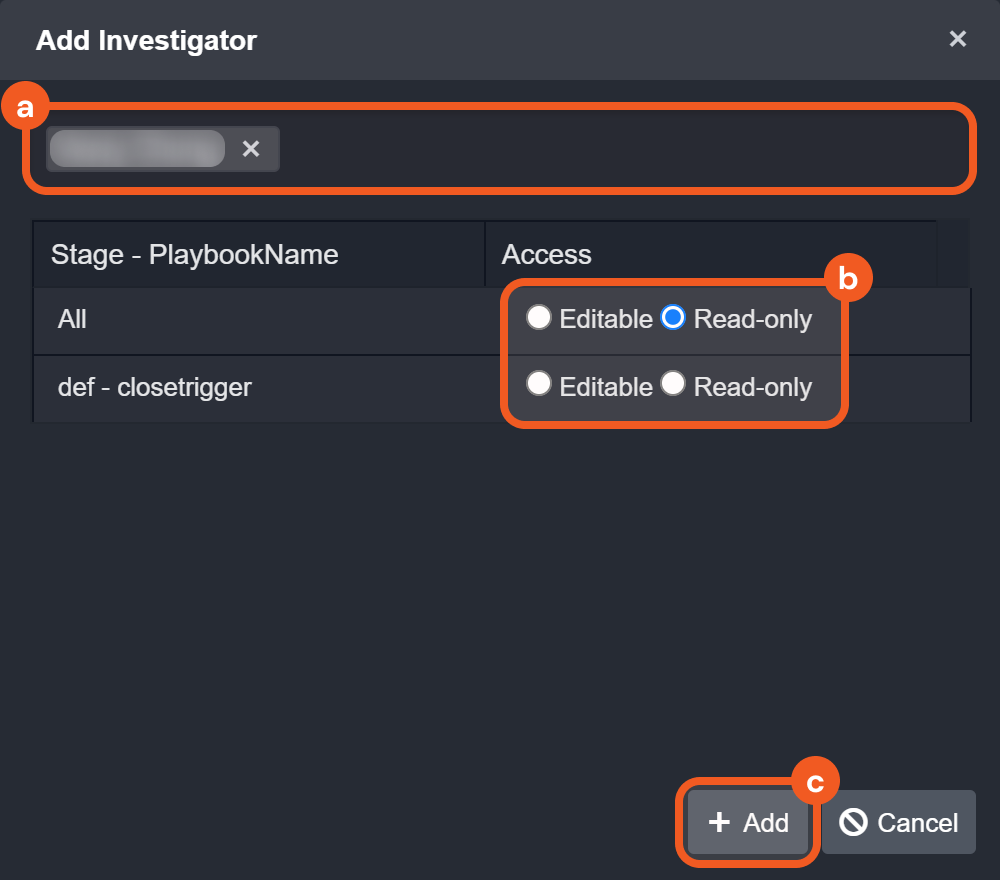
Search for and select the user whose access level needs to be updated.
Update their level of access.
Click on the + Add button.
JSON Table
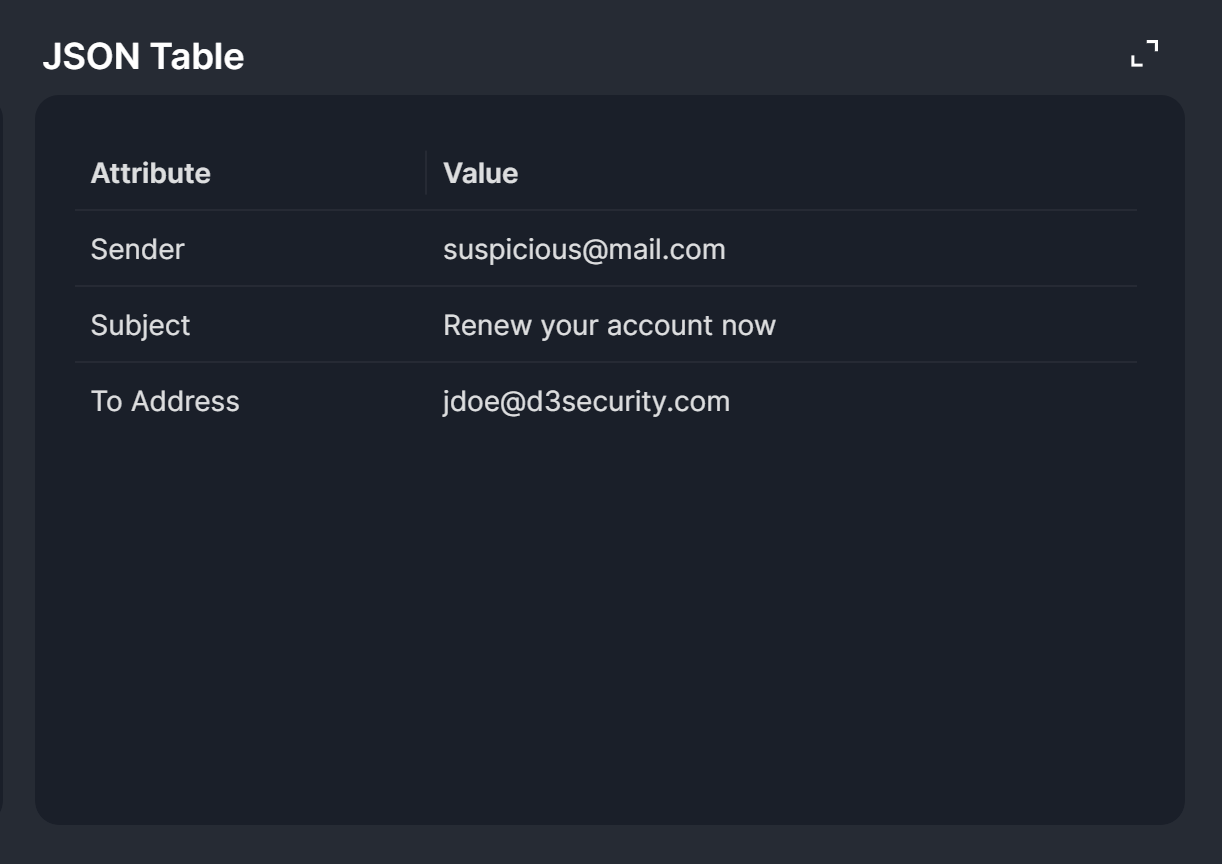
The JSON Table widget allows users to add a table containing custom JSON data into the incident. This data can be used as input for playbook tasks that support dynamic values.
Click on the
icon.Add the data in JSON, then click on the
button to save.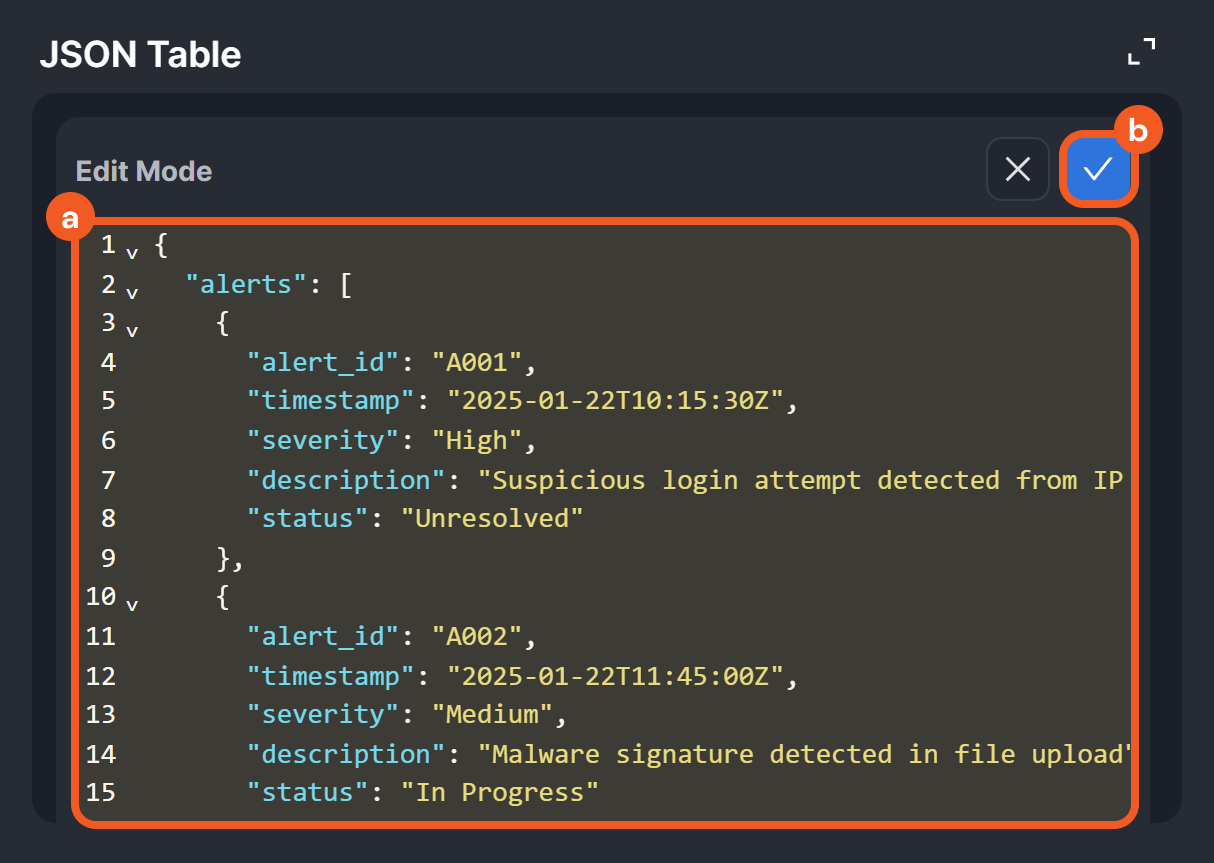
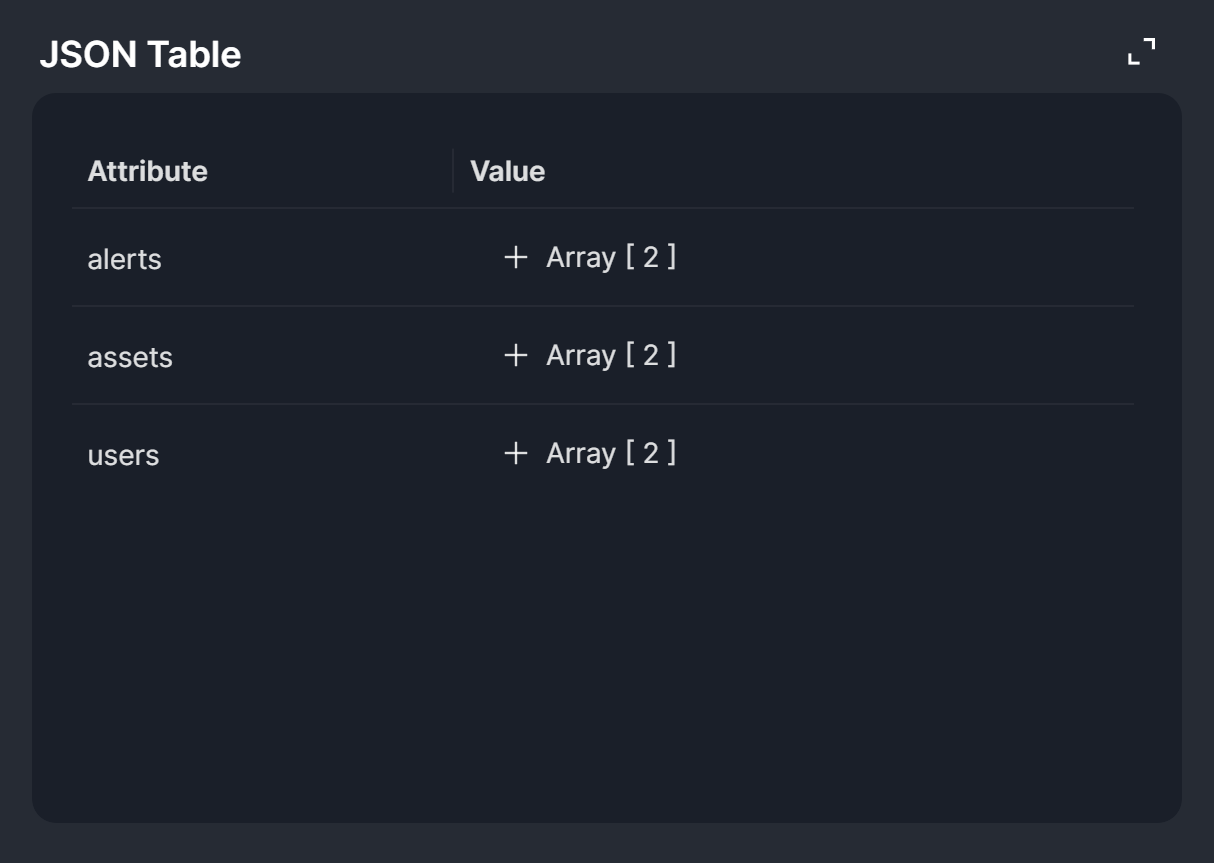
Confirm that the table can be rendered properly.
RESULT
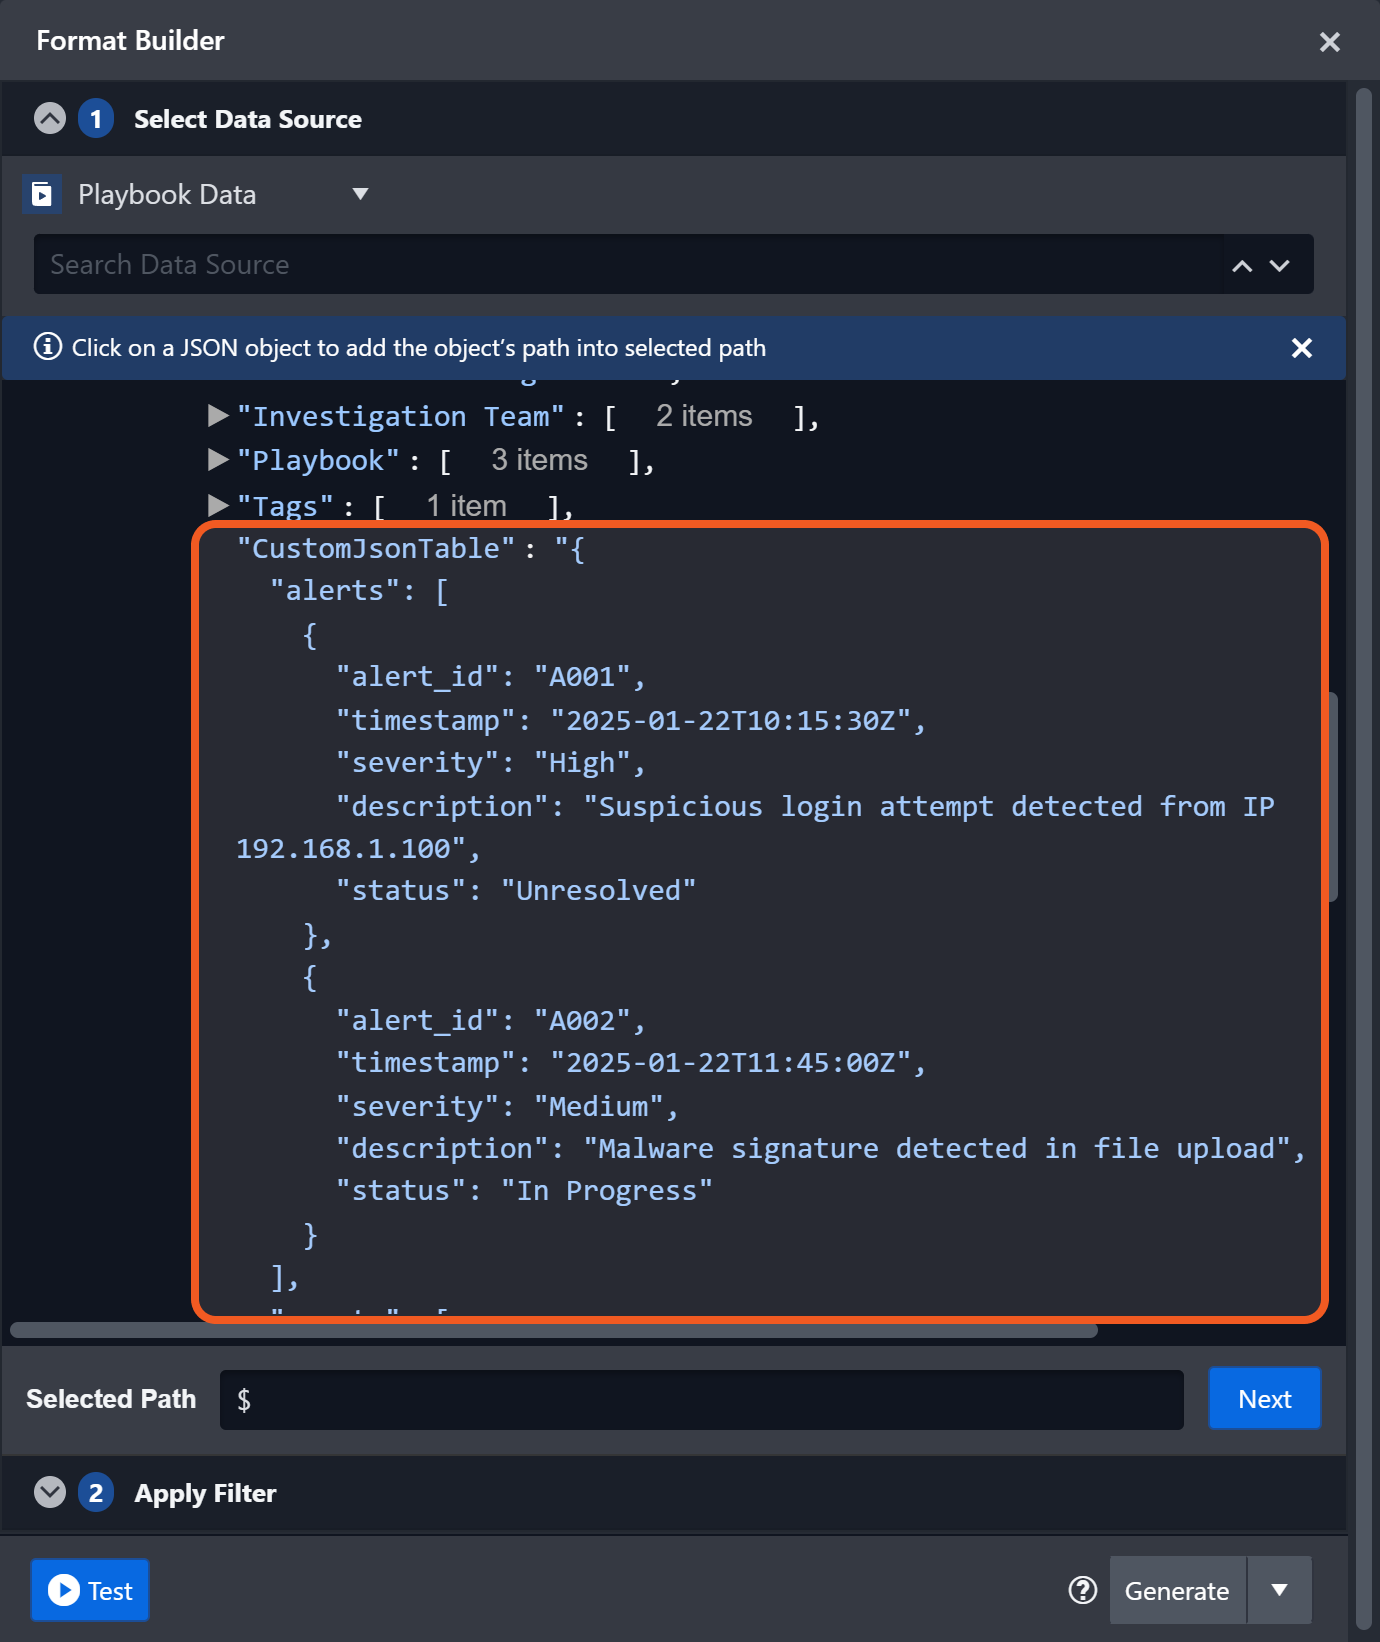
Users can use this JSON data as input for playbook tasks that support dynamic input values, selectable at the path $.DataSource.incident.CustomJsonTable.
Linked Artifacts
.png?inst-v=e416ef0a-975f-4240-8b76-b2350608028d)
The Linked Artifacts widget enables users to associate artifacts with the incident. Users can click on either the button or the Add Linked Artifact button to link an existing artifact to the incident or create a new artifact to link to the incident.
After linking artifacts to the incident, users can access their details and execute commands on them. Linked artifacts are also displayed in the Link Analysis tab.
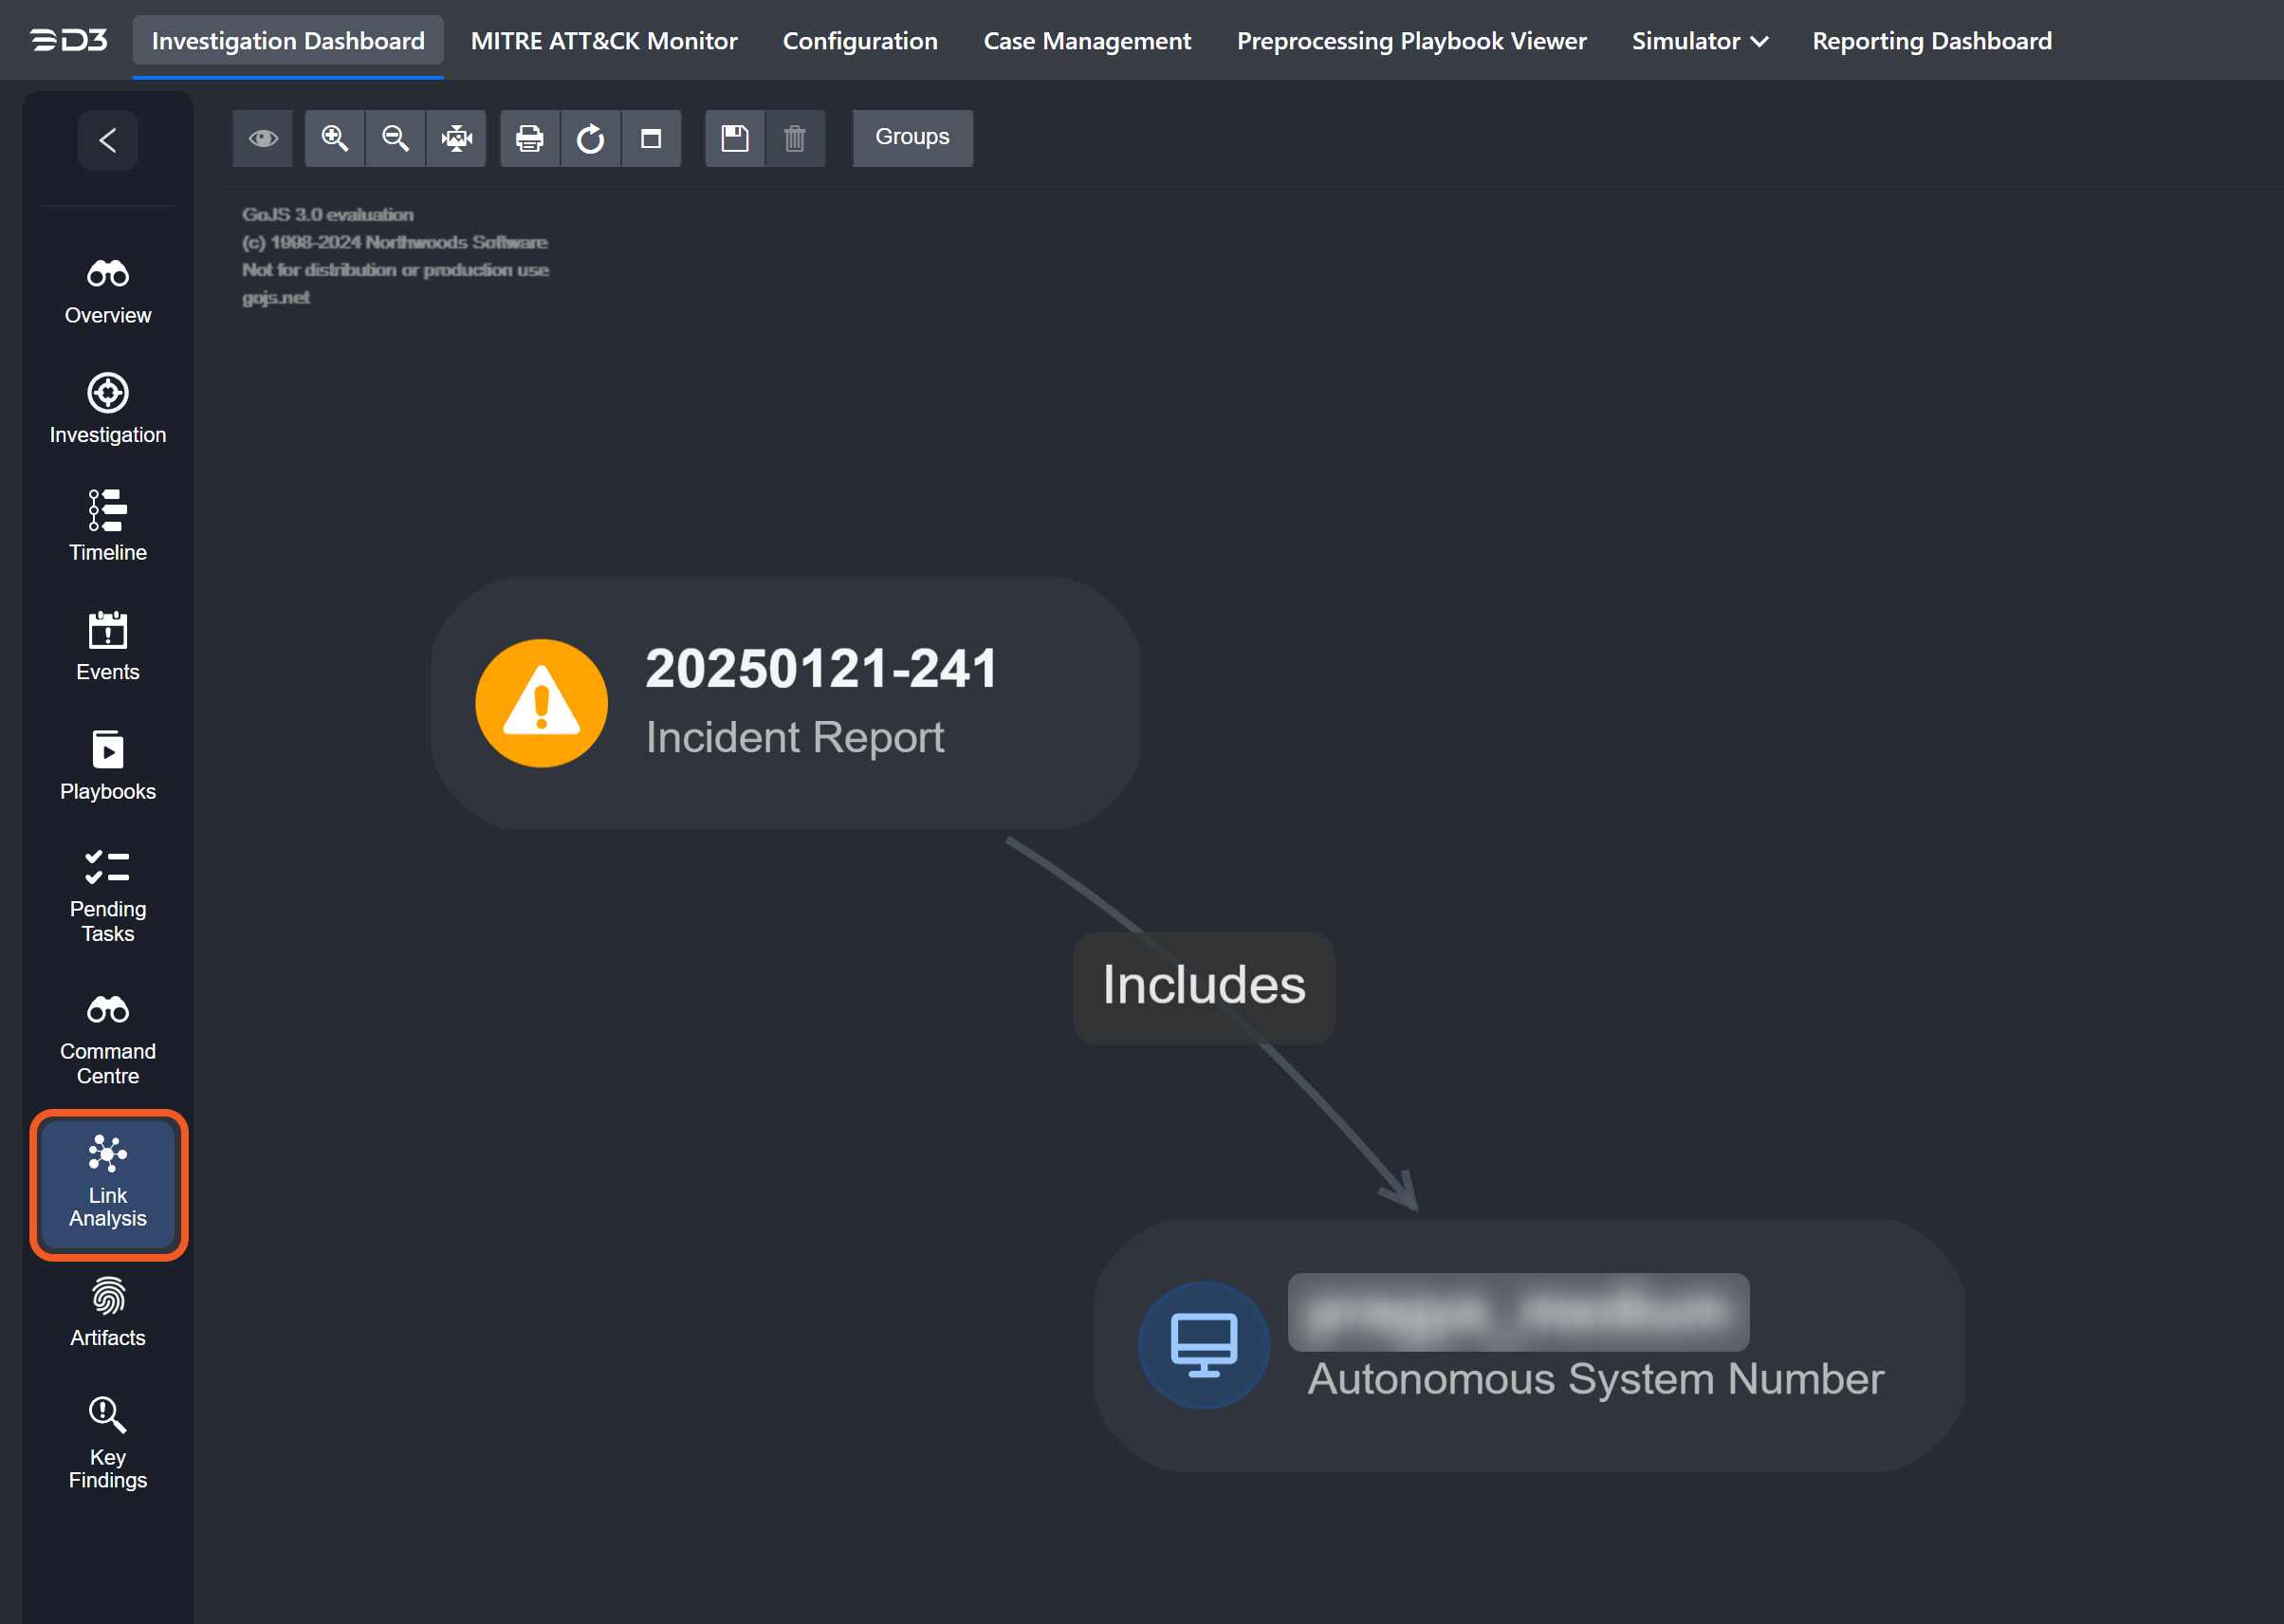
Linked Incident
.png?inst-v=e416ef0a-975f-4240-8b76-b2350608028d)
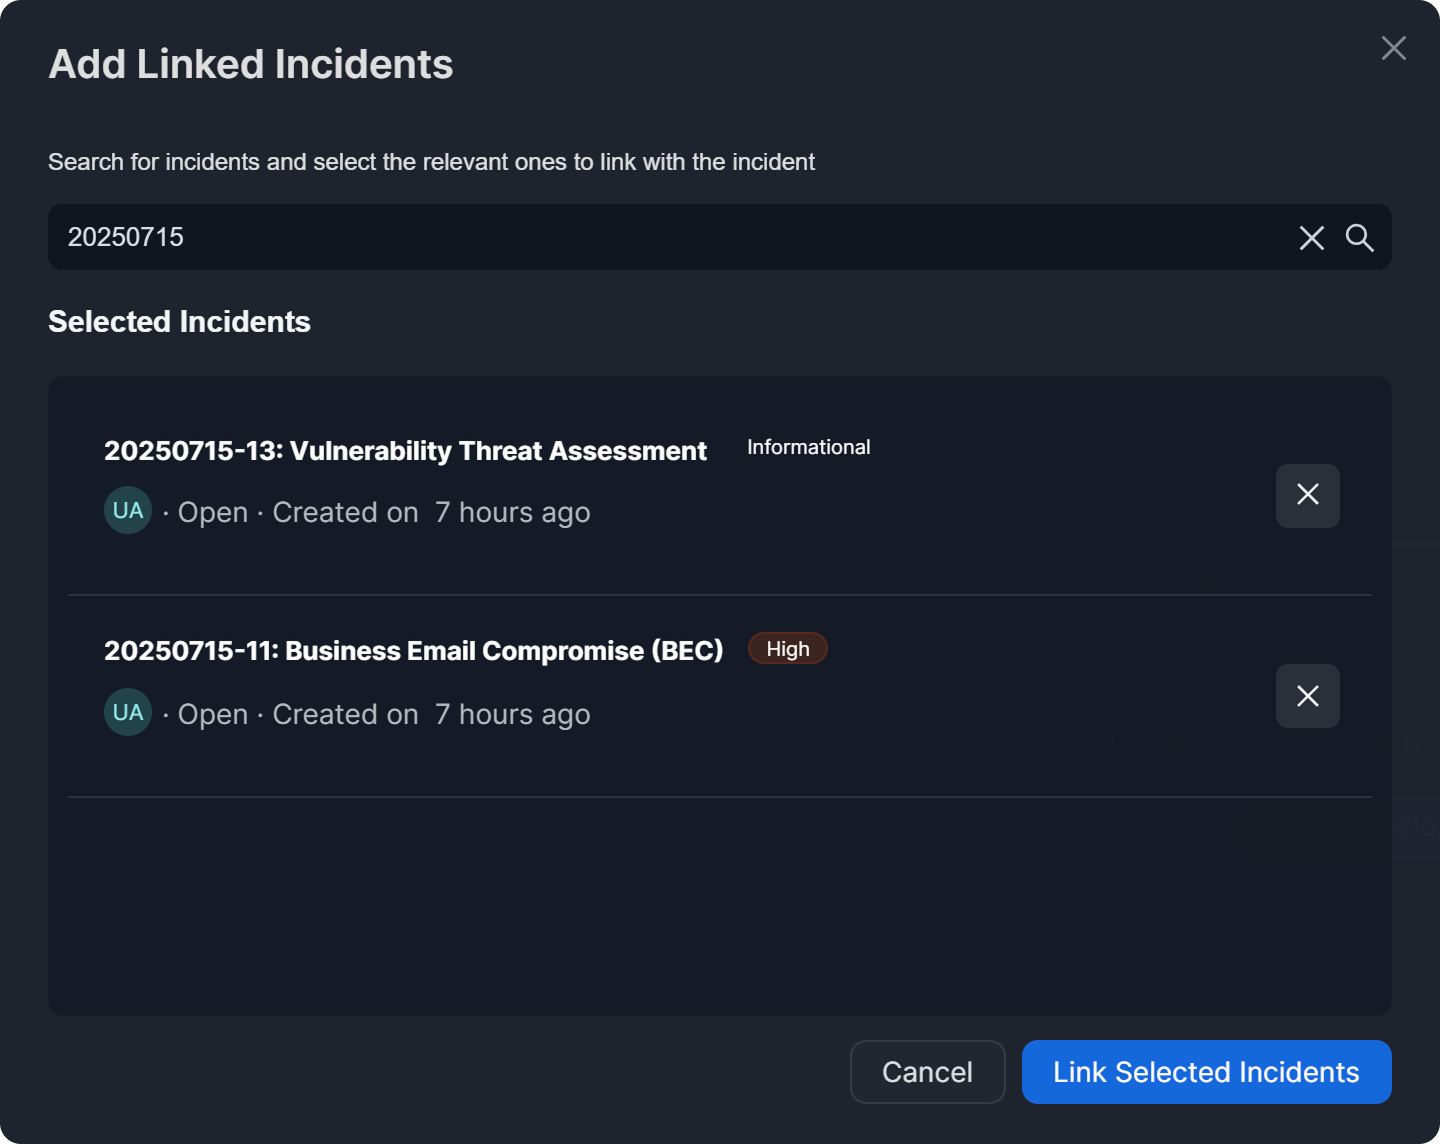
The Linked Incidents widget enables users to associate the current incident with other incidents. It presents a structured list that includes the incident number, title, type, status, creation date, owner, and associated artifacts.
Hovering over the owner icon, the text after "Created On", or any artifact reveals a tooltip with additional details.
Exact incident creation date and time
-20241231-005430.png?inst-v=e416ef0a-975f-4240-8b76-b2350608028d)
Incident owner
-20241231-010617.png?inst-v=e416ef0a-975f-4240-8b76-b2350608028d)
Email address artifact
-20241231-005439.png?inst-v=e416ef0a-975f-4240-8b76-b2350608028d)
File artifact
-20241231-005447.png?inst-v=e416ef0a-975f-4240-8b76-b2350608028d)
Internal IP artifact
-20241231-011026.png?inst-v=e416ef0a-975f-4240-8b76-b2350608028d)
.png?inst-v=e416ef0a-975f-4240-8b76-b2350608028d)
To copy a linked incident’s URL, hover over that incident and click on the
 icon.
icon.To unlink an incident, hover over that incident and click on the
-20241231-011540.png?inst-v=e416ef0a-975f-4240-8b76-b2350608028d) icon.
icon.To navigate to the linked incident, click the
.png?inst-v=e416ef0a-975f-4240-8b76-b2350608028d) icon.
icon.To see a summary of the linked incident, click the
.png?inst-v=e416ef0a-975f-4240-8b76-b2350608028d) icon.
icon.
Clicking the icon opens a summary of the linked incident with the following information: the incident link, conclusion, and notes.
.png?inst-v=e416ef0a-975f-4240-8b76-b2350608028d)
Notes
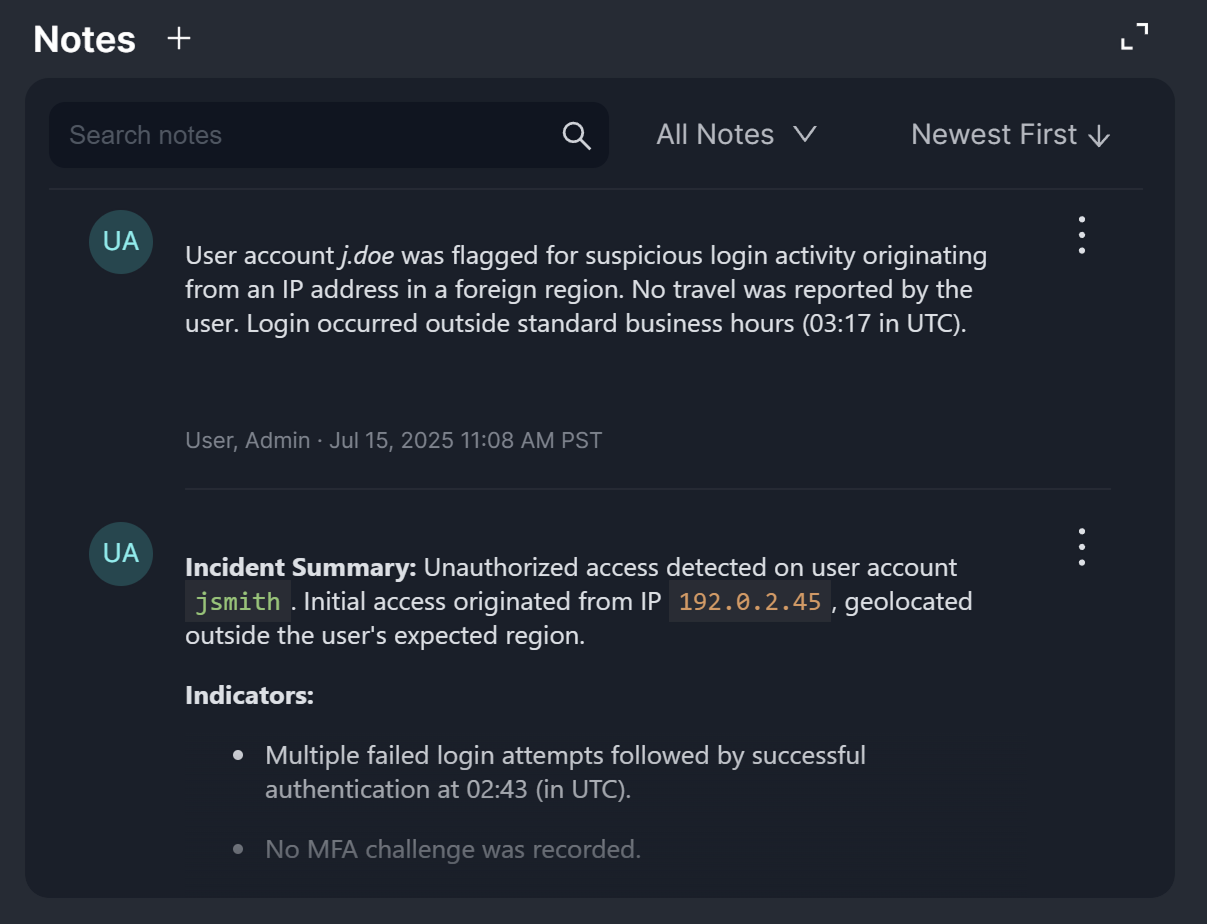
The Notes widget displays all notes associated with the incident. It also enables users to add new notes and perform keyword-based searches using the search bar.
Click the
%201-20241231-173254.png?inst-v=e416ef0a-975f-4240-8b76-b2350608028d) button.
button. .png?inst-v=e416ef0a-975f-4240-8b76-b2350608028d)
Select the desired action from the dropdown menu:
.png?inst-v=e416ef0a-975f-4240-8b76-b2350608028d)
Click Edit to modify the note content.
Click Delete to permanently remove the note.
Click View History to see previous versions and changes made to the note.
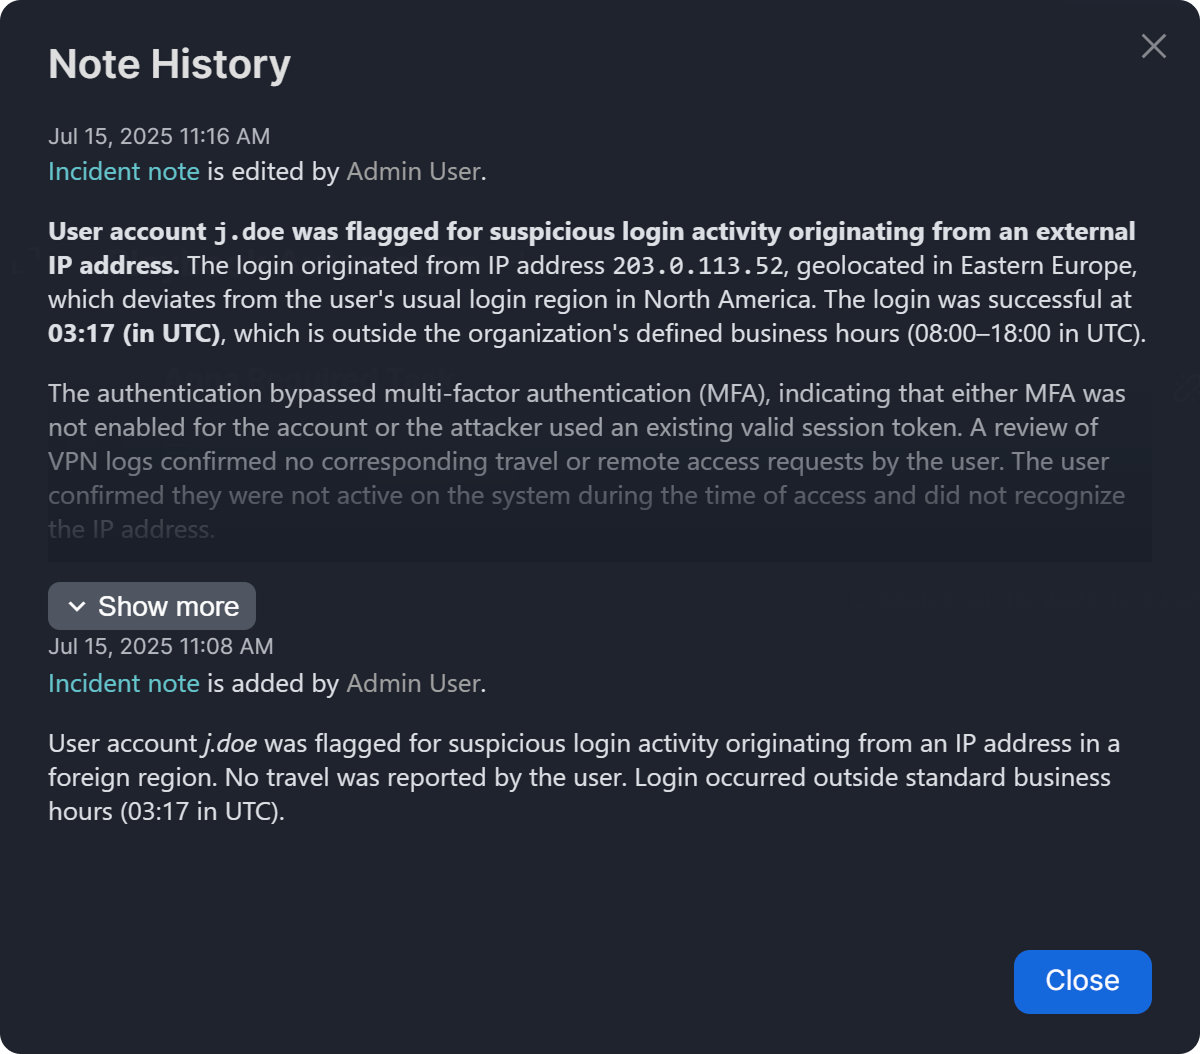
Follow the on-screen prompts to complete the selected action.
Playbook Automation
-20241231-015352.png?inst-v=e416ef0a-975f-4240-8b76-b2350608028d)
The Playbook Automation widget supports playbook bulk selection, same-page unlinking and viewing, filtering of custom or built-in playbooks, and filtering by integration commands used within playbooks.
Hover over that playbook and click on the
icon. -20241231-021212.png?inst-v=e416ef0a-975f-4240-8b76-b2350608028d)
Enter a reason for unlinking, then click on the Unlink button.
%201%20(1)-20241231-021952.png?inst-v=e416ef0a-975f-4240-8b76-b2350608028d)
Clicking a playbook card renders a modal containing the executing playbook, identical to accessing it via the Playbooks sidebar menu.
-20241231-022415.png?inst-v=e416ef0a-975f-4240-8b76-b2350608028d)
Recommendations
The Recommendations widget enables users to view, add, and edit analyst recommendations directly from the Overview tab. The data displayed in this widget mirrors the information in the Recommendations section of the Investigation tab.
The process of adding a recommendation, whether with a data table or HTML Rich Text, is identical to adding a finding, with the exception that the category dropdown is available only for findings.
Remediations & Mitigations
The Remediations & Mitigations widget enables users to view, add, and edit analyst remediation and mitigation strategies directly from the Overview tab. The data displayed in this widget mirrors the information in the Remediations & Mitigations section of the Investigation tab.
The process of adding a remediation and mitigation strategy, whether with a data table or HTML Rich Text, is identical to adding a finding, with the exception that the category dropdown is available only for findings.
Investigation Summary
.png?inst-v=e416ef0a-975f-4240-8b76-b2350608028d)
The Investigation Summary widget (left) and the Summary section in the Investigation tab (right).
The Investigation Summary widget mirrors the content of the Summary section found in the Investigation tab of the sidebar. All incident summaries are auto-generated at the time of incident creation. Users can edit the summary by clicking the edit icon and delete it by clicking the trash icon, both of which appear on hover.
.png?inst-v=e416ef0a-975f-4240-8b76-b2350608028d)
Tasks
.png?inst-v=e416ef0a-975f-4240-8b76-b2350608028d)
The Tasks widget provides a clear view of completed, upcoming and overdue playbook and ad hoc tasks. It also includes a graphical progress bar to visually track completion.
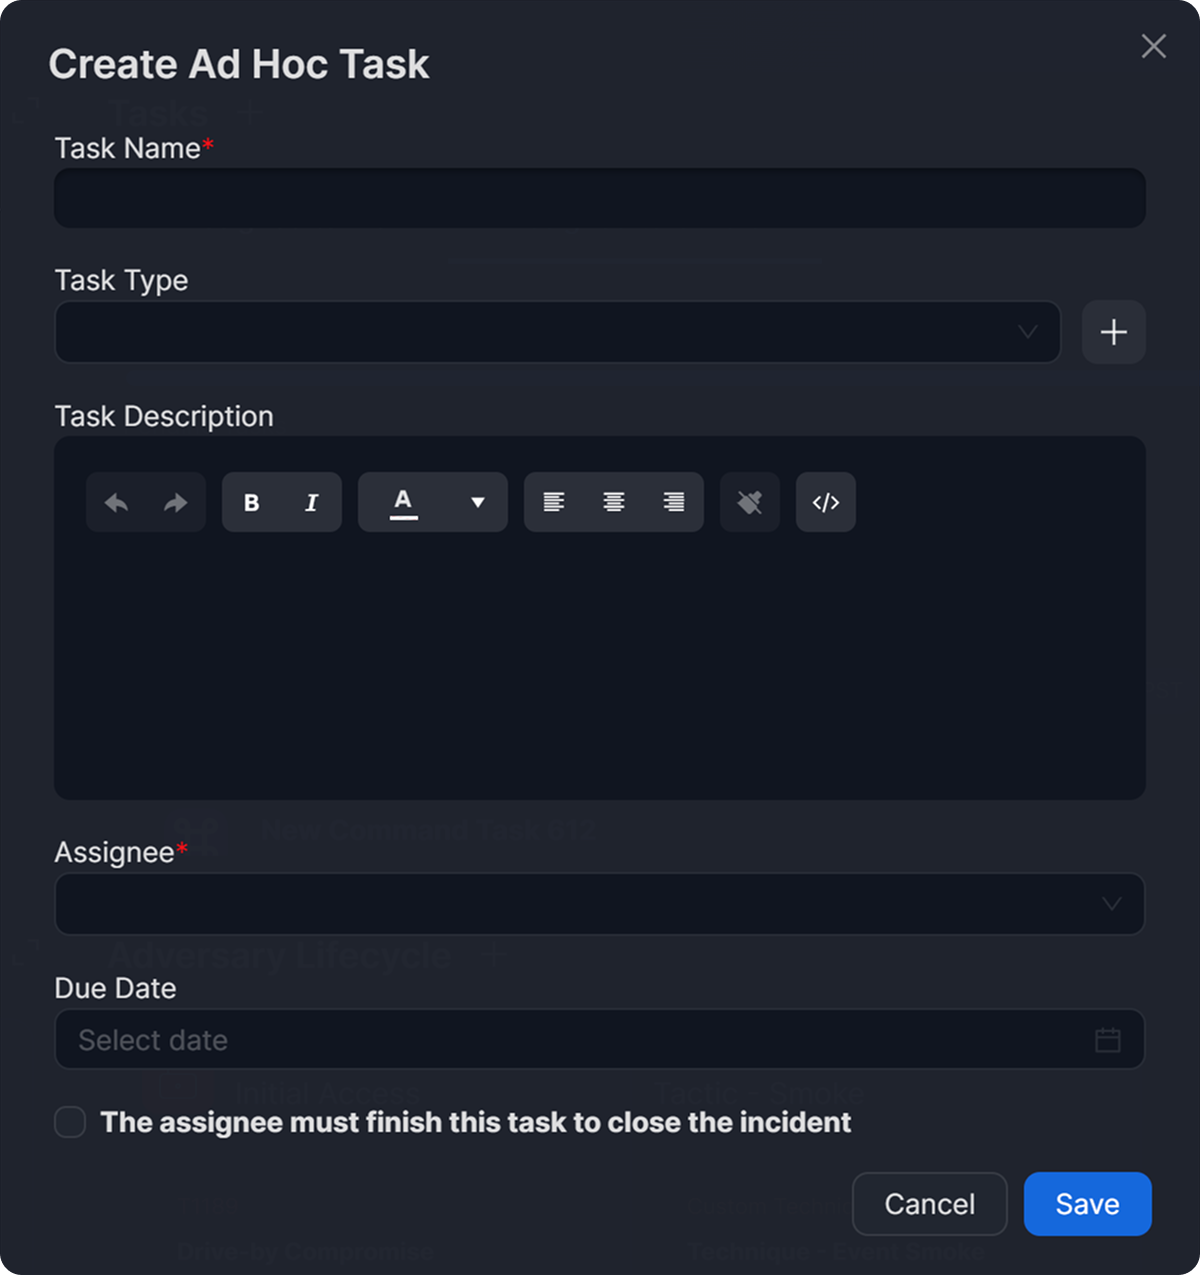
Users can click the ![]() button on this widget or use the Ad hoc Tasks quick action available in the header panel to add an ad hoc task.
button on this widget or use the Ad hoc Tasks quick action available in the header panel to add an ad hoc task.
Click the
%201-20241228-003935.png?inst-v=e416ef0a-975f-4240-8b76-b2350608028d) button beside the Tasks widget header or the Ad-hoc Task button in the header panel.
button beside the Tasks widget header or the Ad-hoc Task button in the header panel. -20241228-003410.png?inst-v=e416ef0a-975f-4240-8b76-b2350608028d)
-20241228-003712.png?inst-v=e416ef0a-975f-4240-8b76-b2350608028d)
Fill in the Create Ad Hoc Task form as required.