
New Features
Queries Module
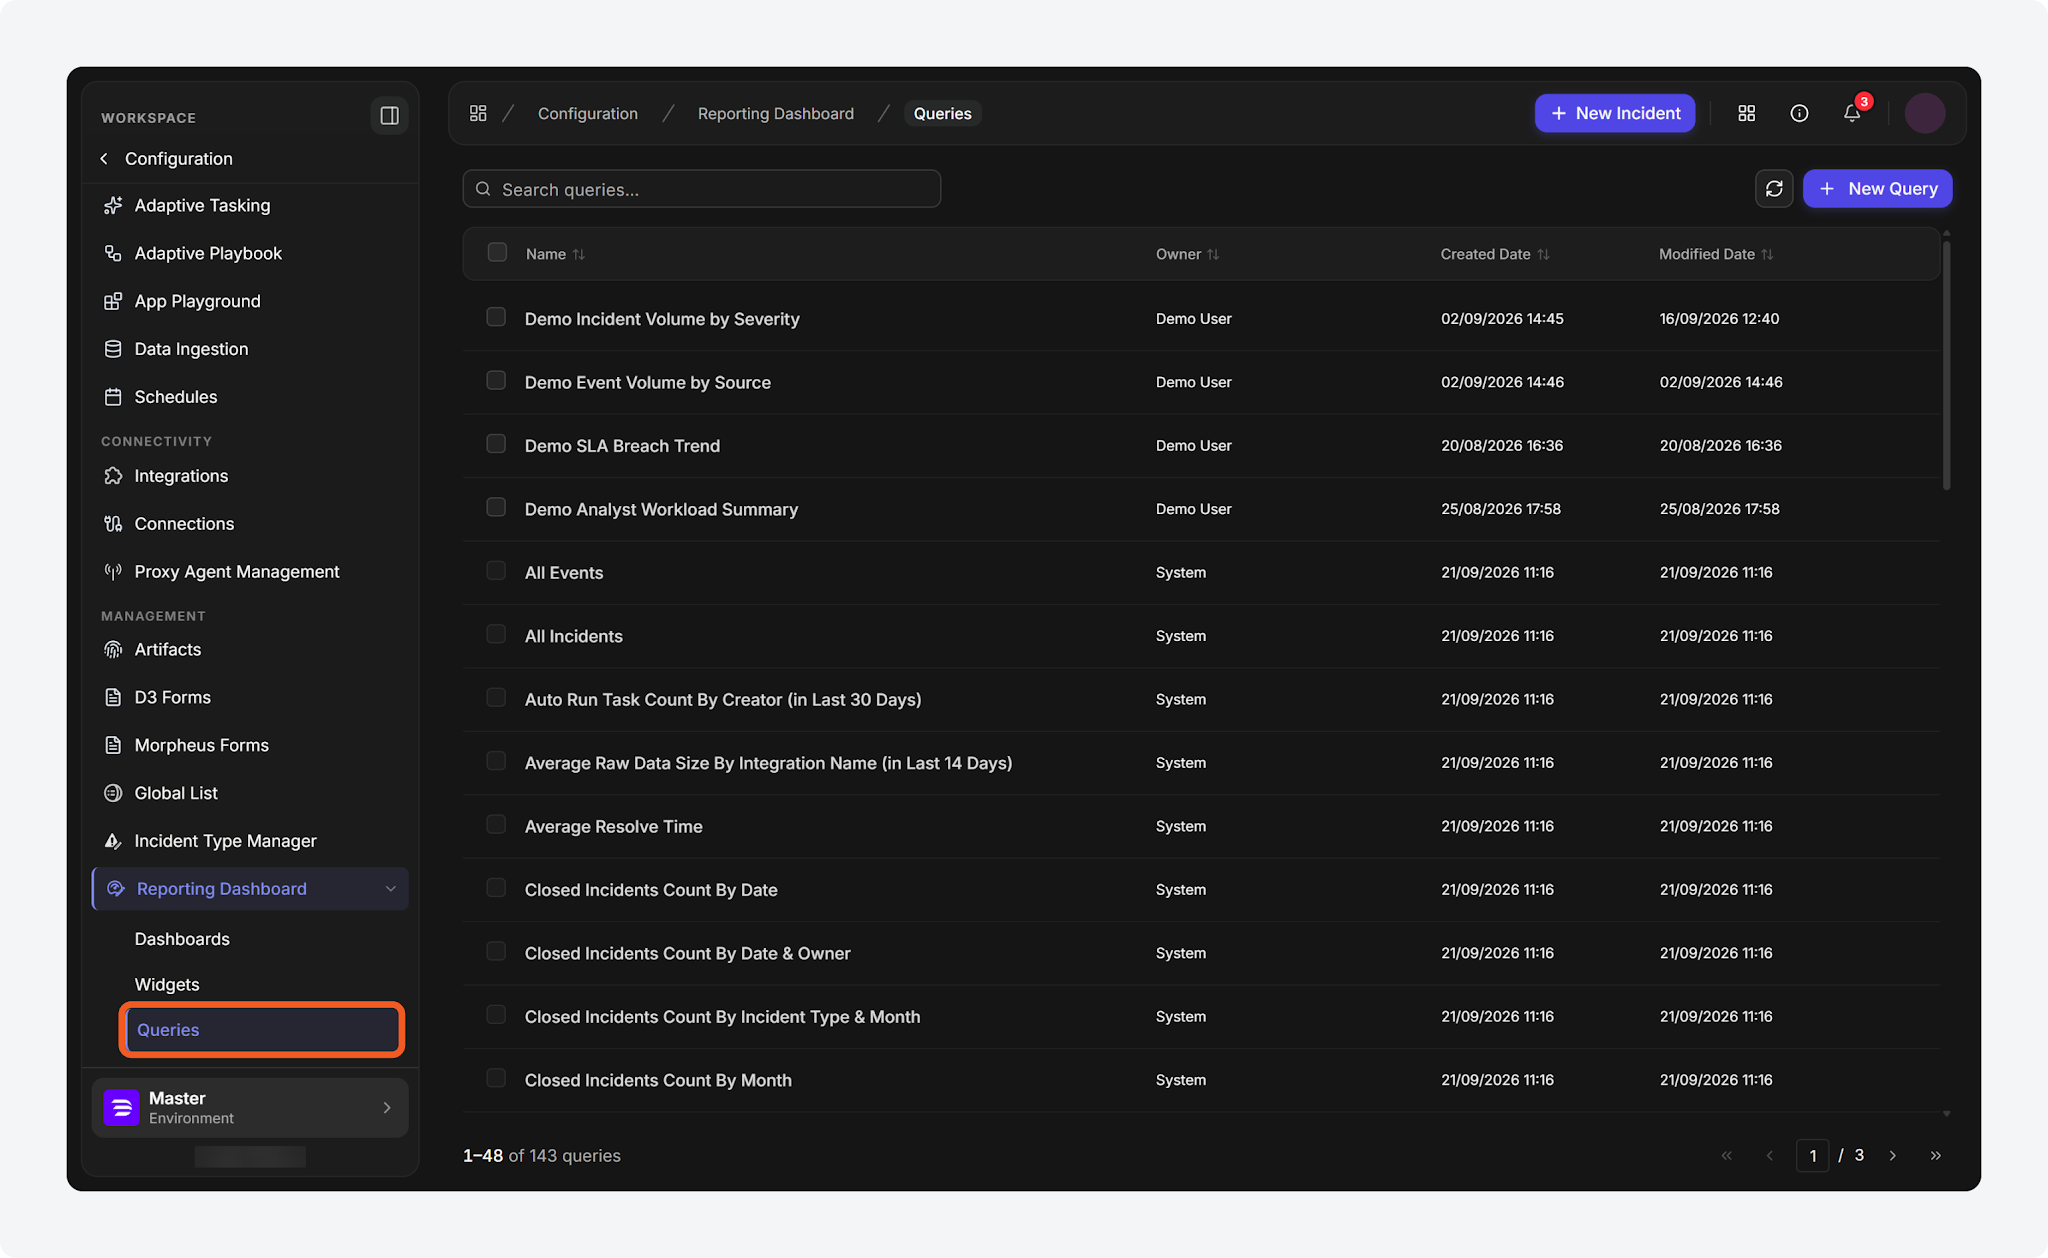
A Queries module is now available in the new UI, under Configuration > Reporting Dashboard, centralizing query management and promoting reuse. When creating a query, users select the data source, site, and date range, run the query, and save it. Saved queries can be reused across multiple widgets, with updates automatically applied to every widget that references them.
FEATURE FLAG
Access requires the Feature.NewReportingDashboards.Enabled feature flag.
Access Controls for Saved Queries
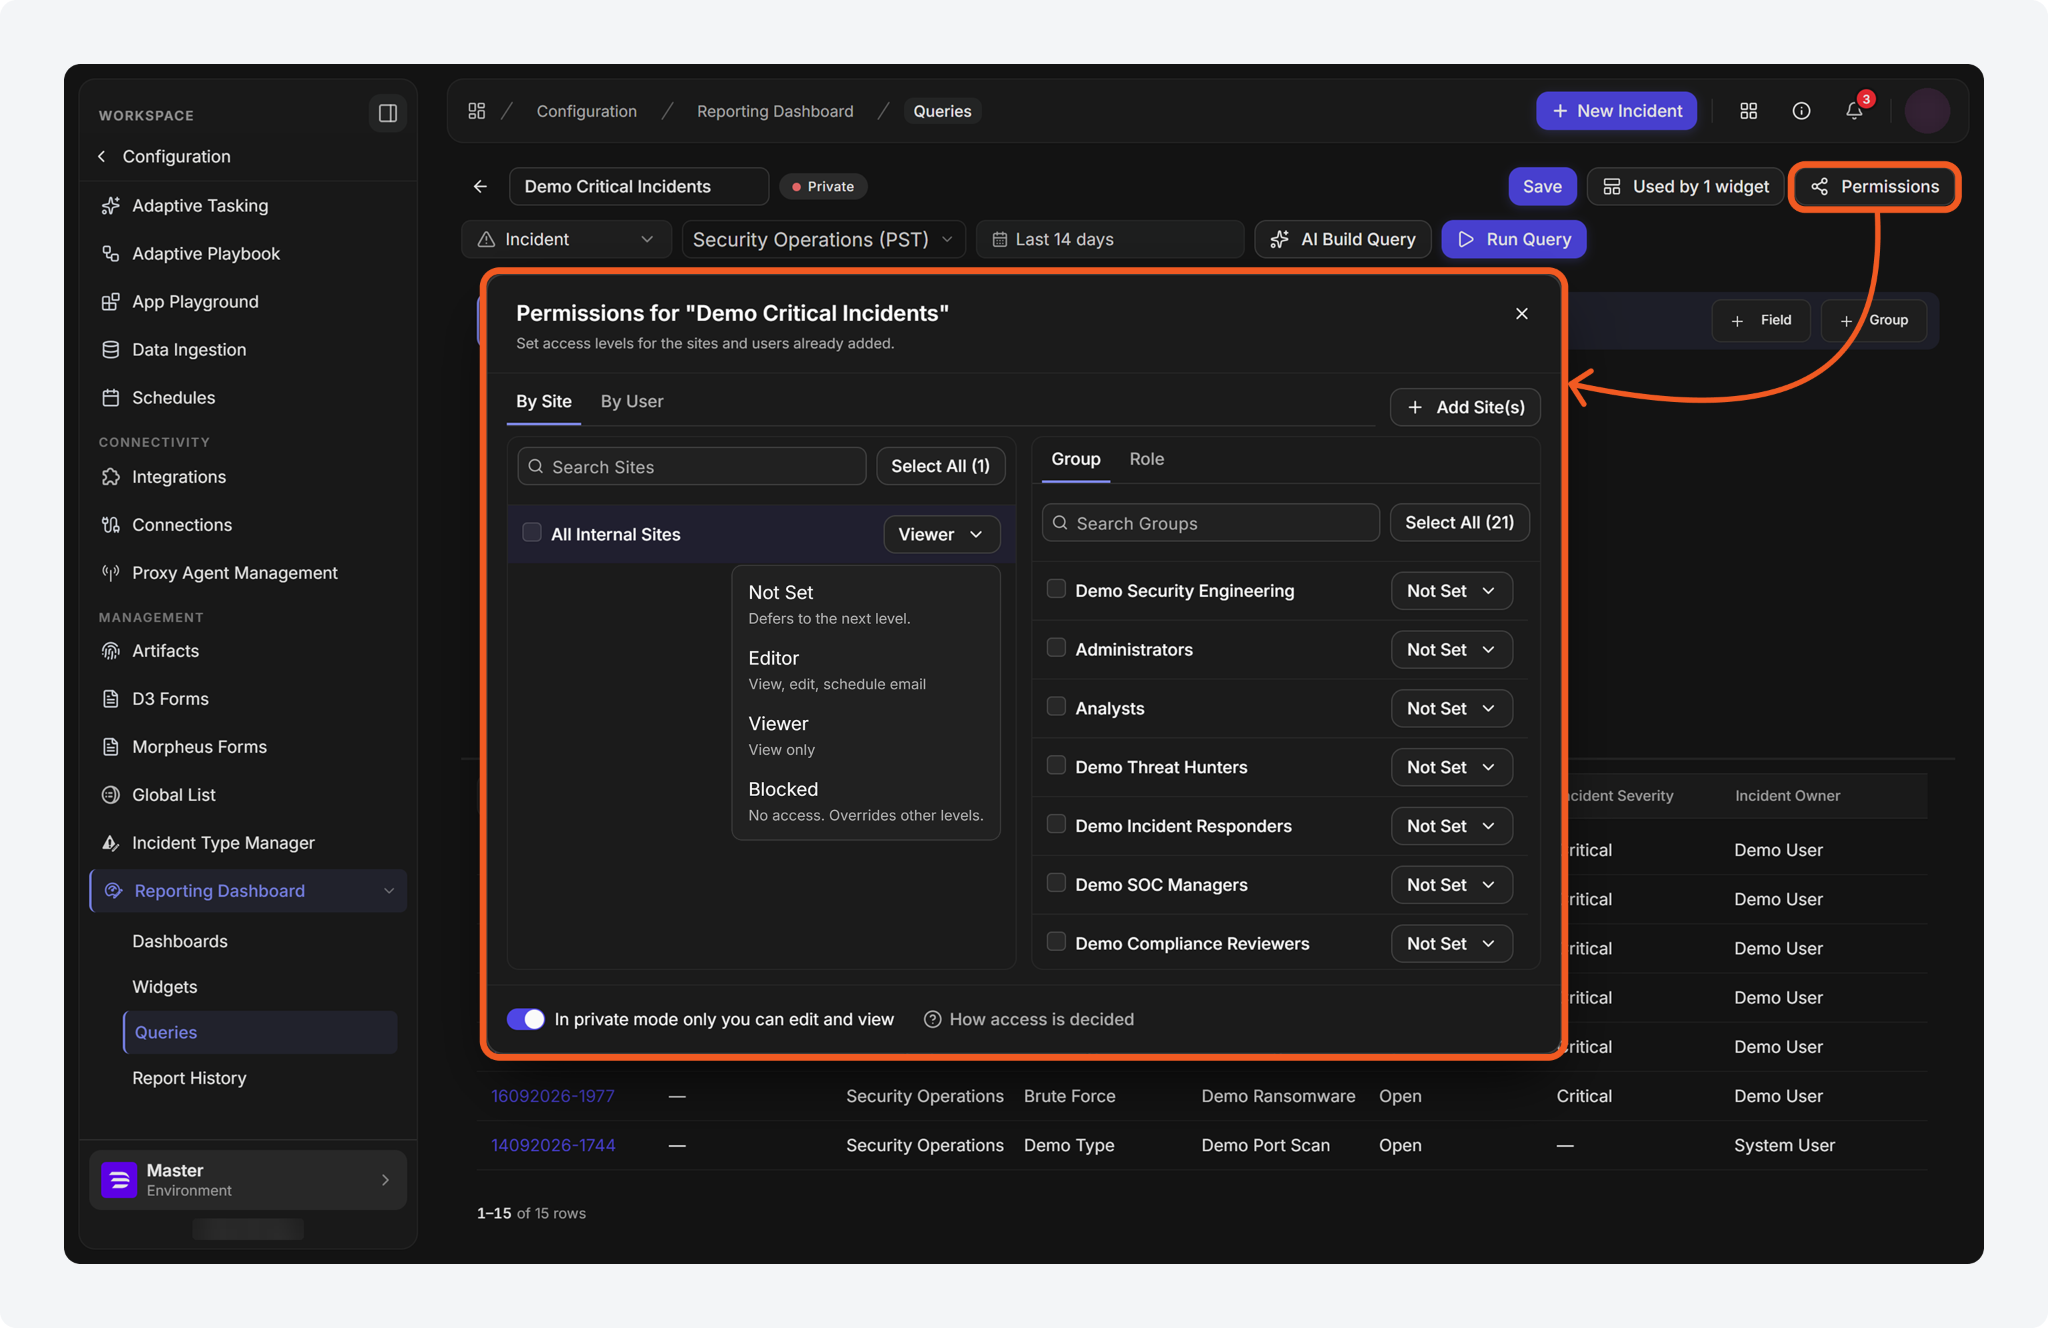
Within the Queries module, users can restrict who can view or edit a saved query. See Access Rules and Precedence. Queries that the user cannot edit open in read-only mode, preventing unauthorized changes. Previously created queries inherit widget restrictions, and all others default to owner-only access.
FEATURE FLAG
Access requires the Feature.NewReportingDashboards.Enabled feature flag.
Self-Service Account Recovery
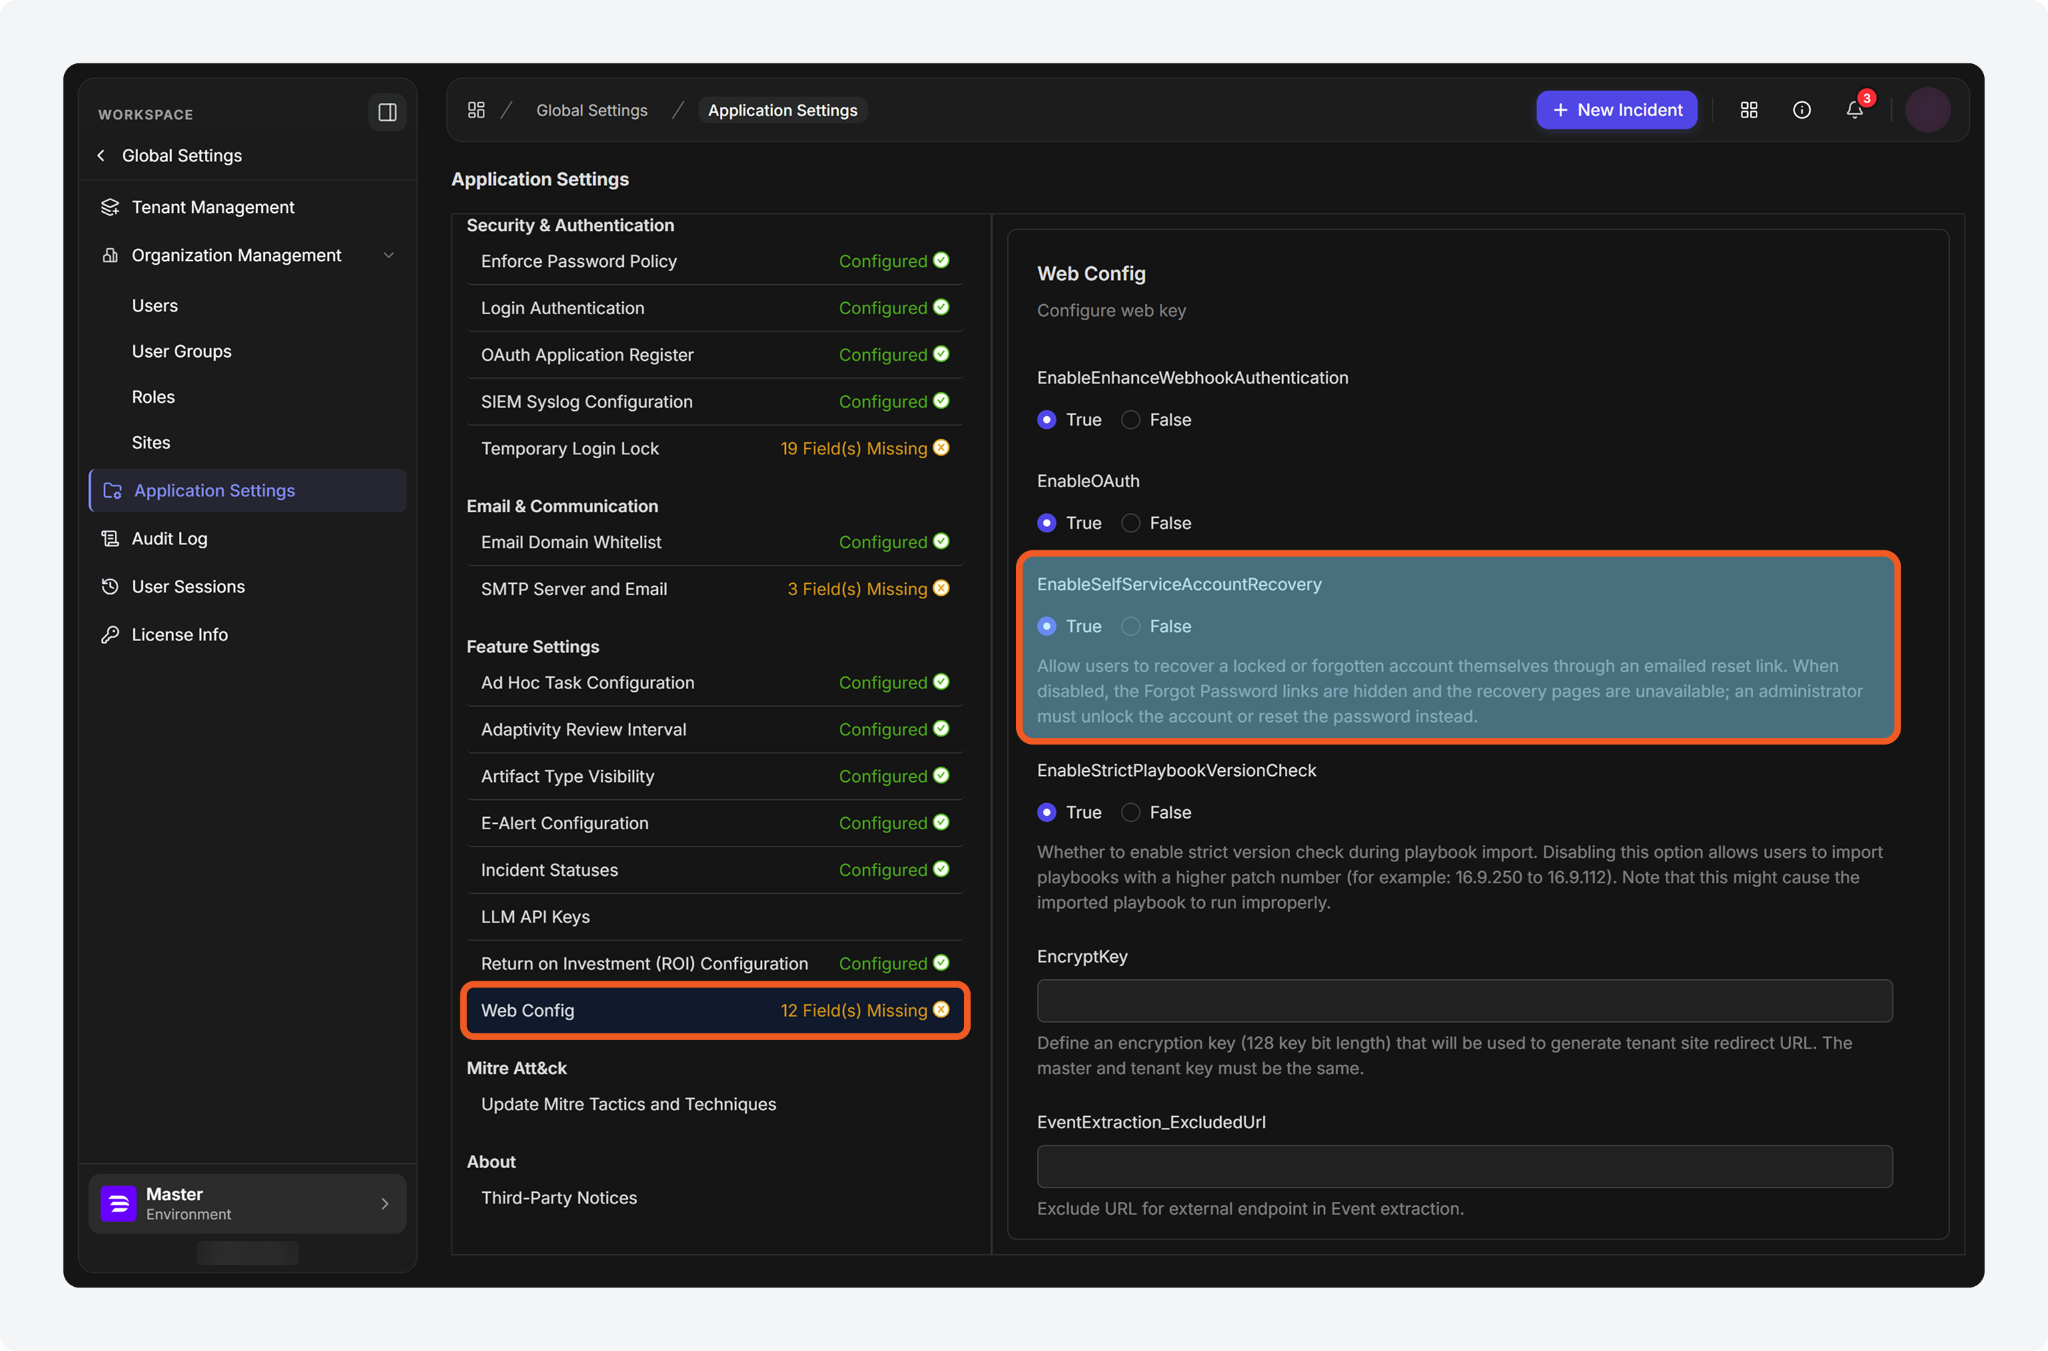
Users can now clear account lockouts through an emailed password-reset link in both the new UI and the classic view. A locked sign-in screen now offers a "Reset your password to unlock your account" link in place of an instruction to contact an administrator. Each account is allowed three recovery requests per hour. To enable or disable self-service account recovery, use the EnableSelfServiceAccountRecovery setting under Global Settings > Application Settings > Feature Settings > Web Config. By default, the setting is enabled.
RECOVERY SCOPE
Self-service recovery is available only for accounts that use General Authentication. IdP-managed accounts require an administrator to clear a lockout.
Incident Workspace Widget Visibility
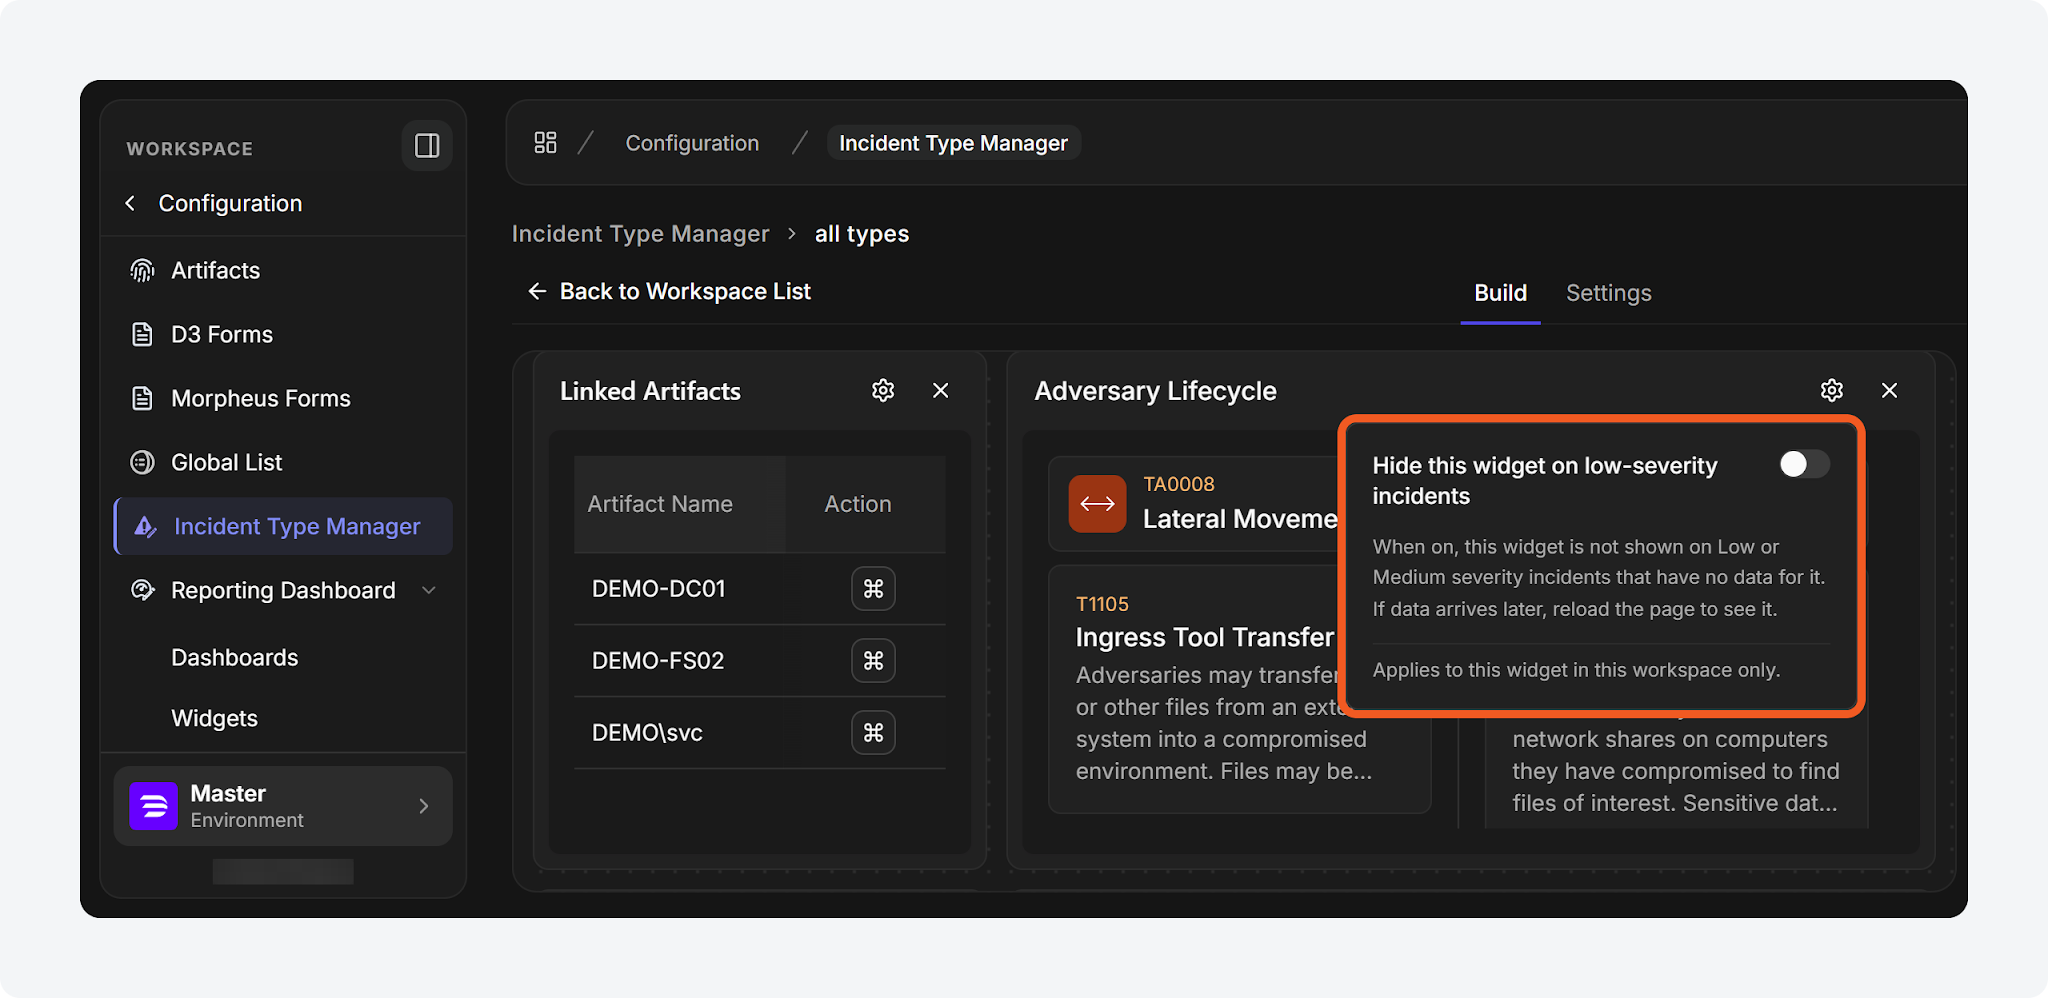
In the new UI incident workspace builder, clicking a widget's gear icon opens a popover containing a "Hide this widget on low-severity incidents" toggle. When enabled, this option hides the selected widget in the current workspace for low- and medium-severity incidents that contain no data for it, reducing unnecessary scrolling. If data becomes available later, refreshing the incident workspace displays the widget again. By default, hiding is disabled.
Incident Quick View Layouts
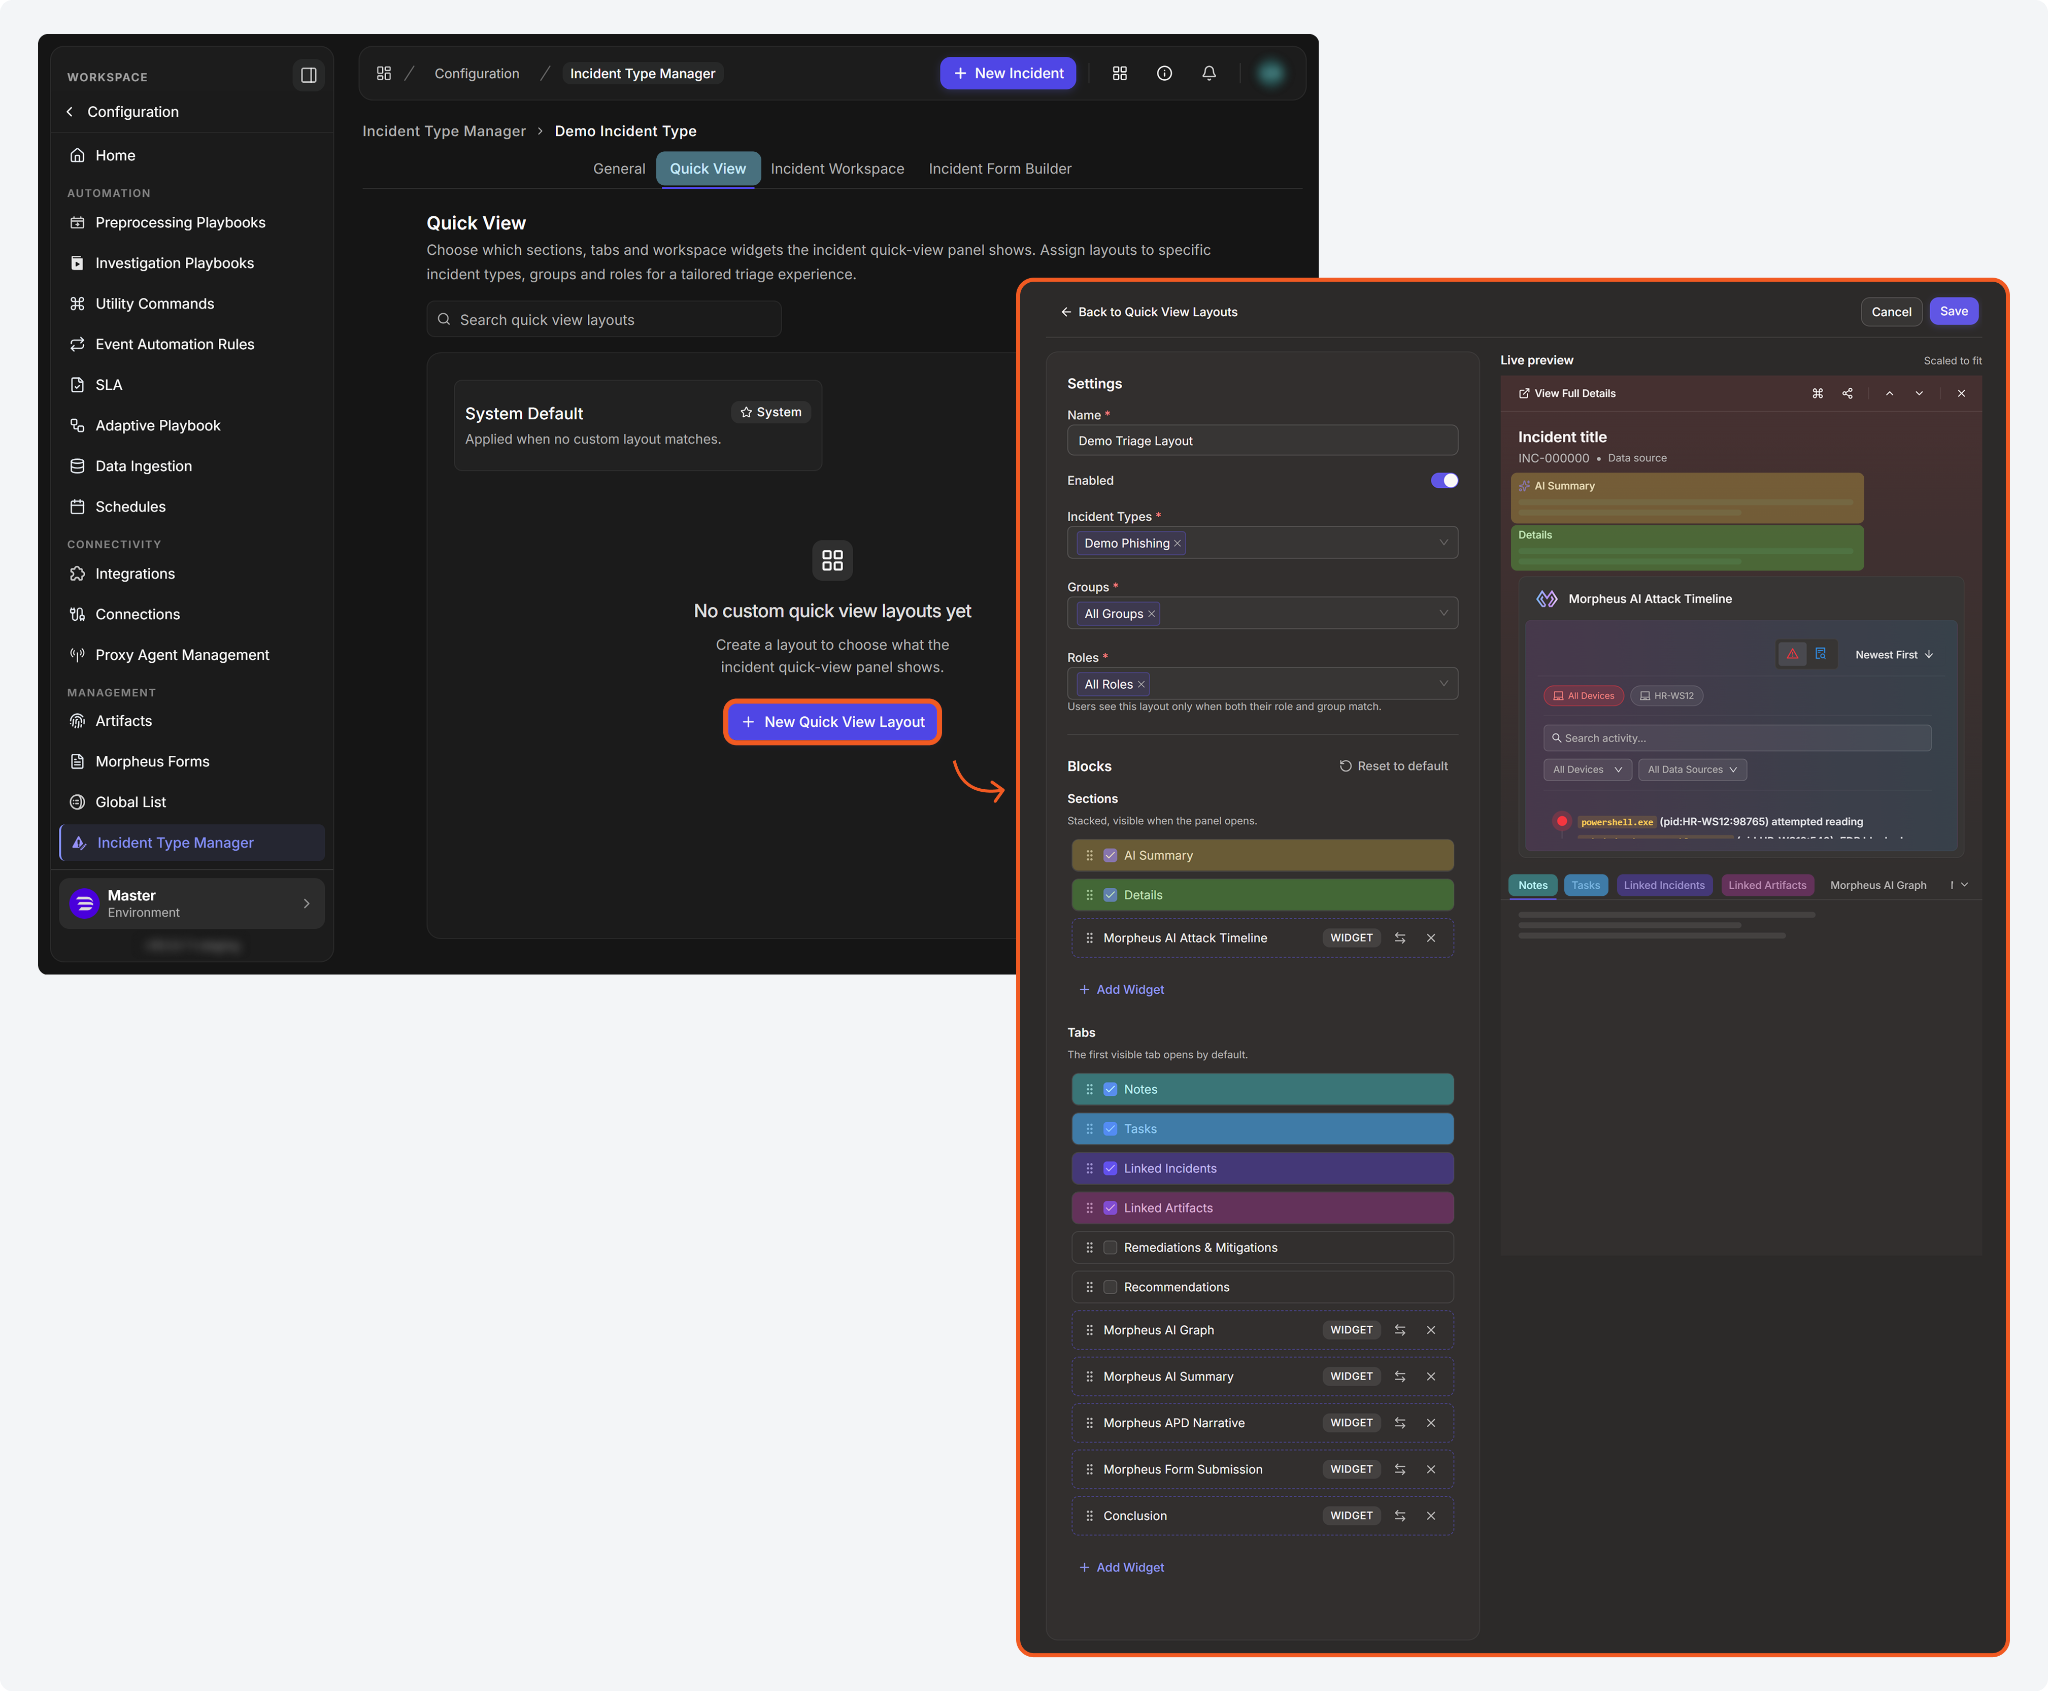
In the new UI, the Incident Type Manager module now includes a Quick View tab for creating custom layouts for the incident dashboard quick-view panel. Administrators can show, hide, and reorder the panel's components, add incident workspace widgets, and assign each layout to specific incident types, groups, and roles. Component configurations appear in the live preview before saving. A user sees the configured layout only when both their assigned role and group match its configuration. Otherwise, the default layout is displayed.
Command Logs Module
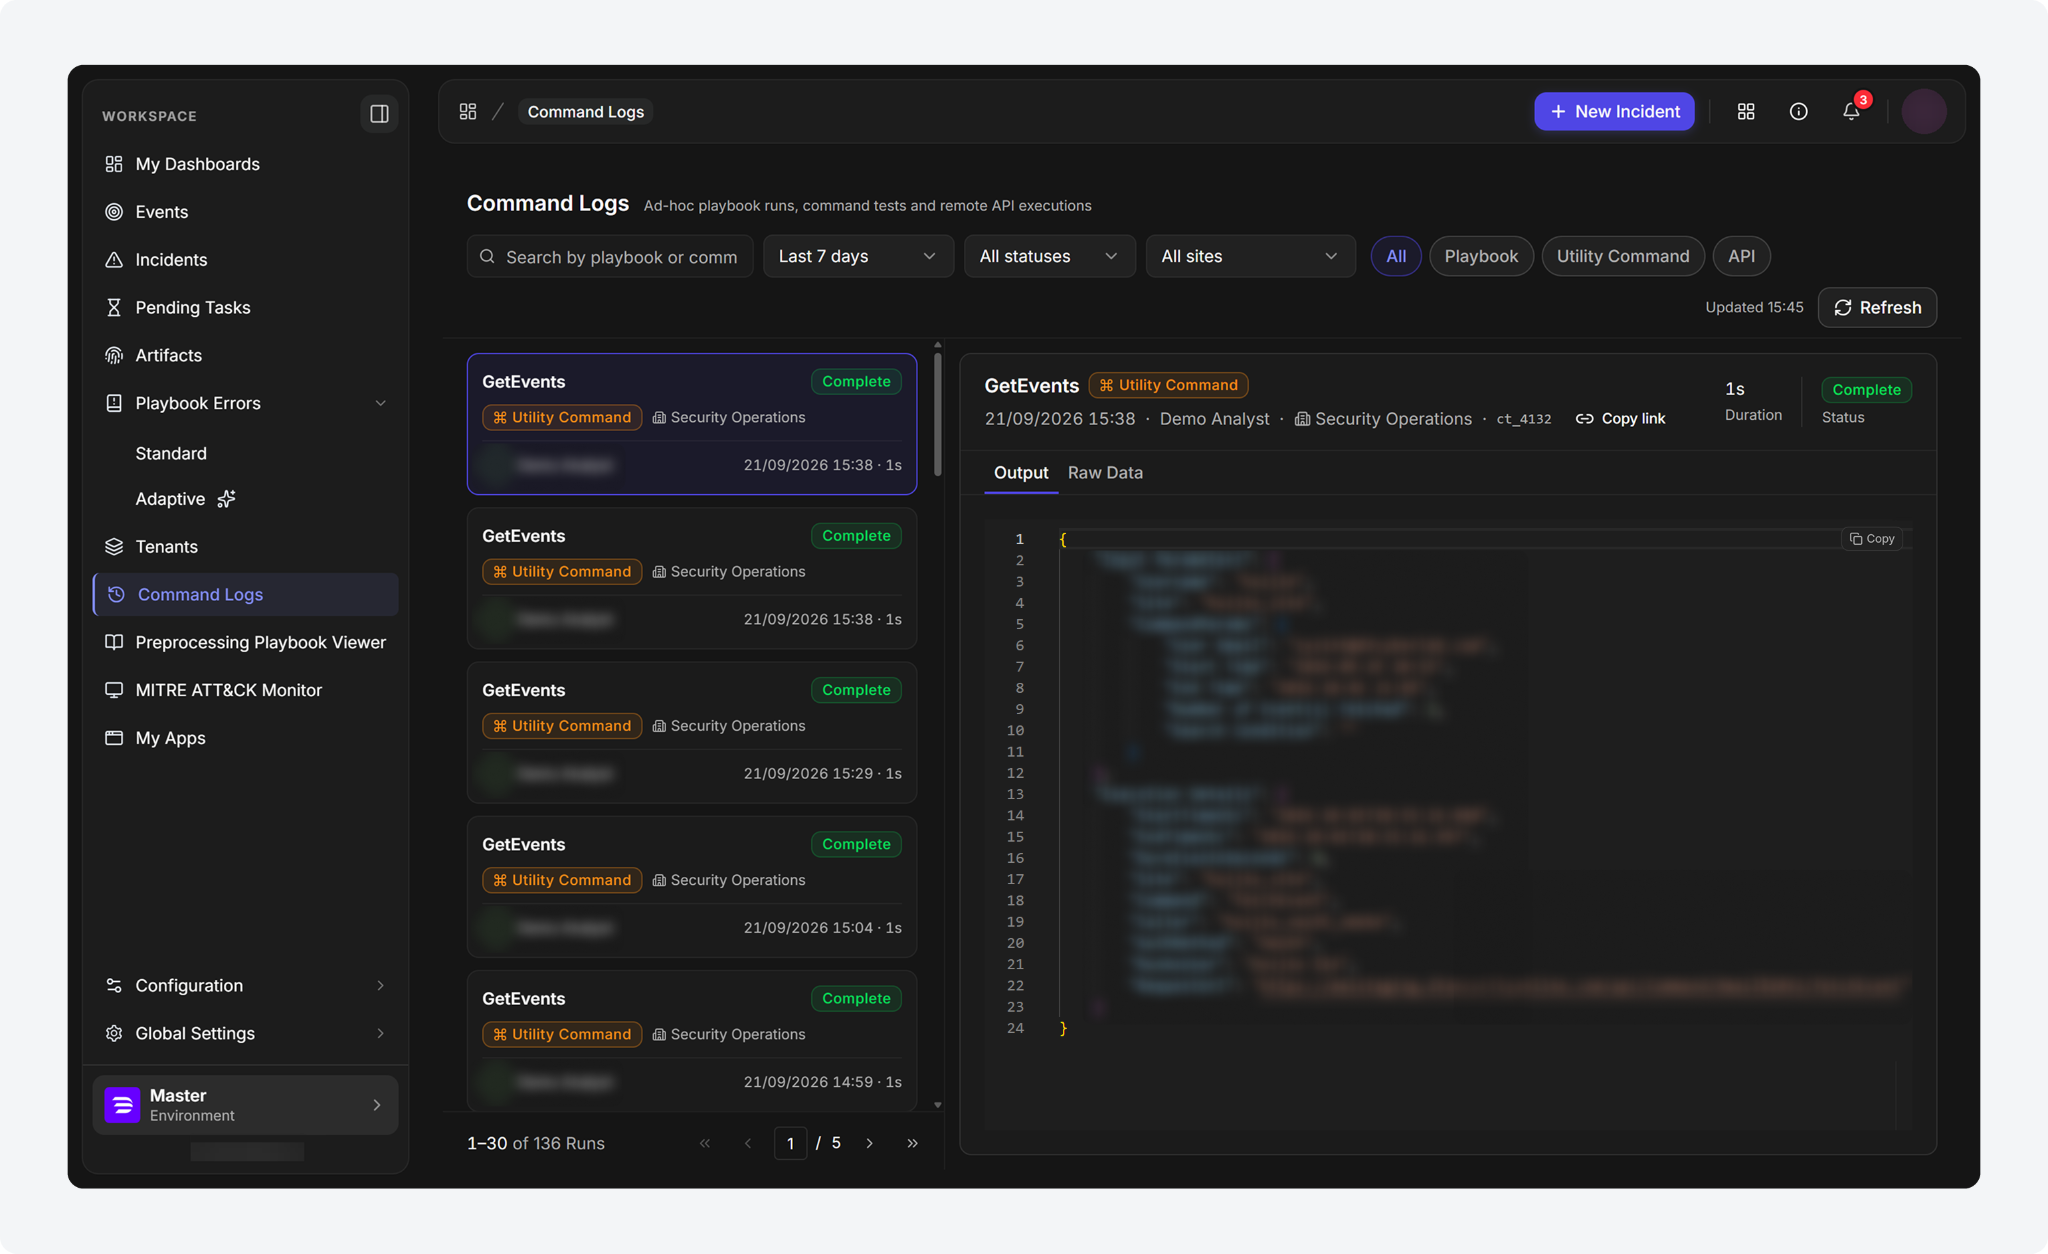
A Command Logs module is now available in the new UI. It keeps a history of ad hoc runs. The module includes playbook runs, utility command runs, and API command runs. Each row shows the run's name, source, site, caller, start time, duration, and status. Users can search runs by name, filter them by time window, status, and site, and open any run to review its details. Access to Command Logs module requires the Preprocessing Playbook Viewer permission, which is assigned through a user's role configuration.
Light Theme
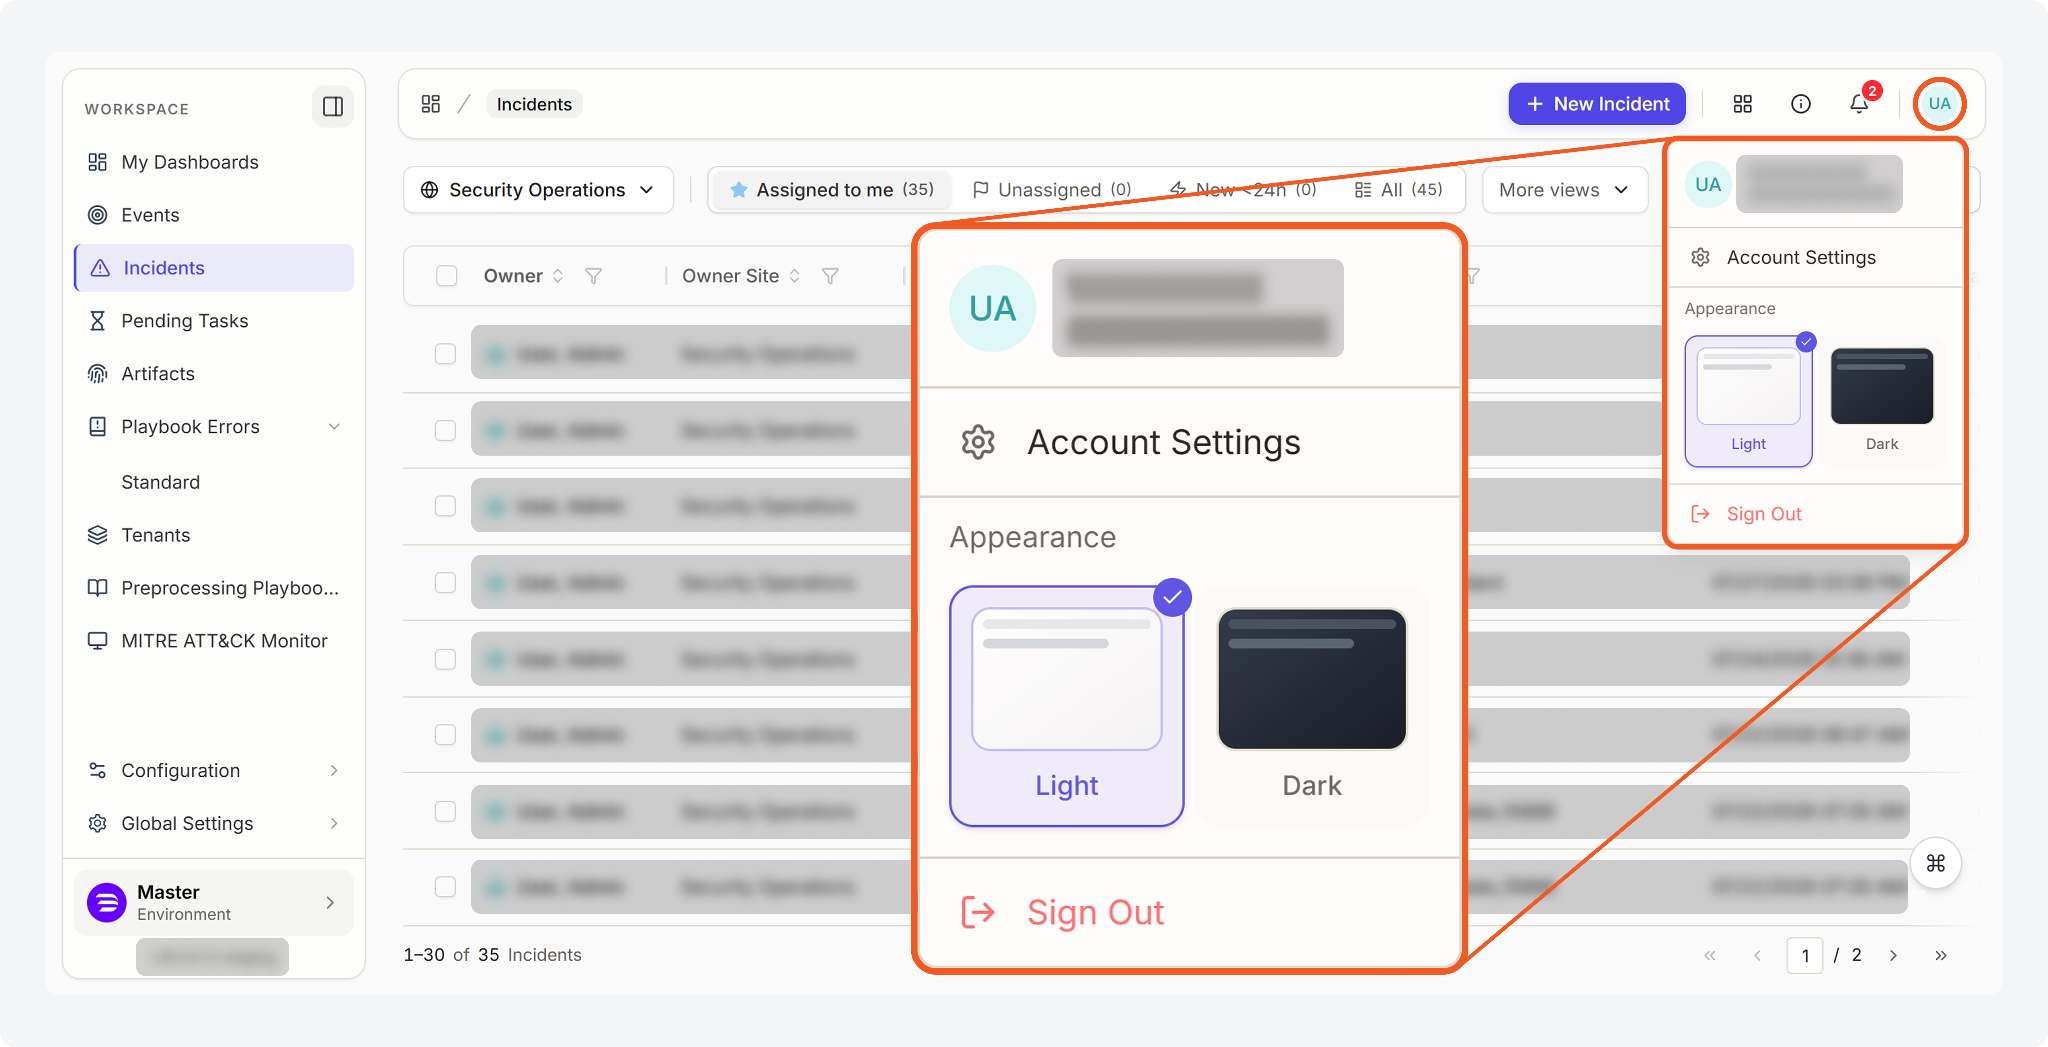
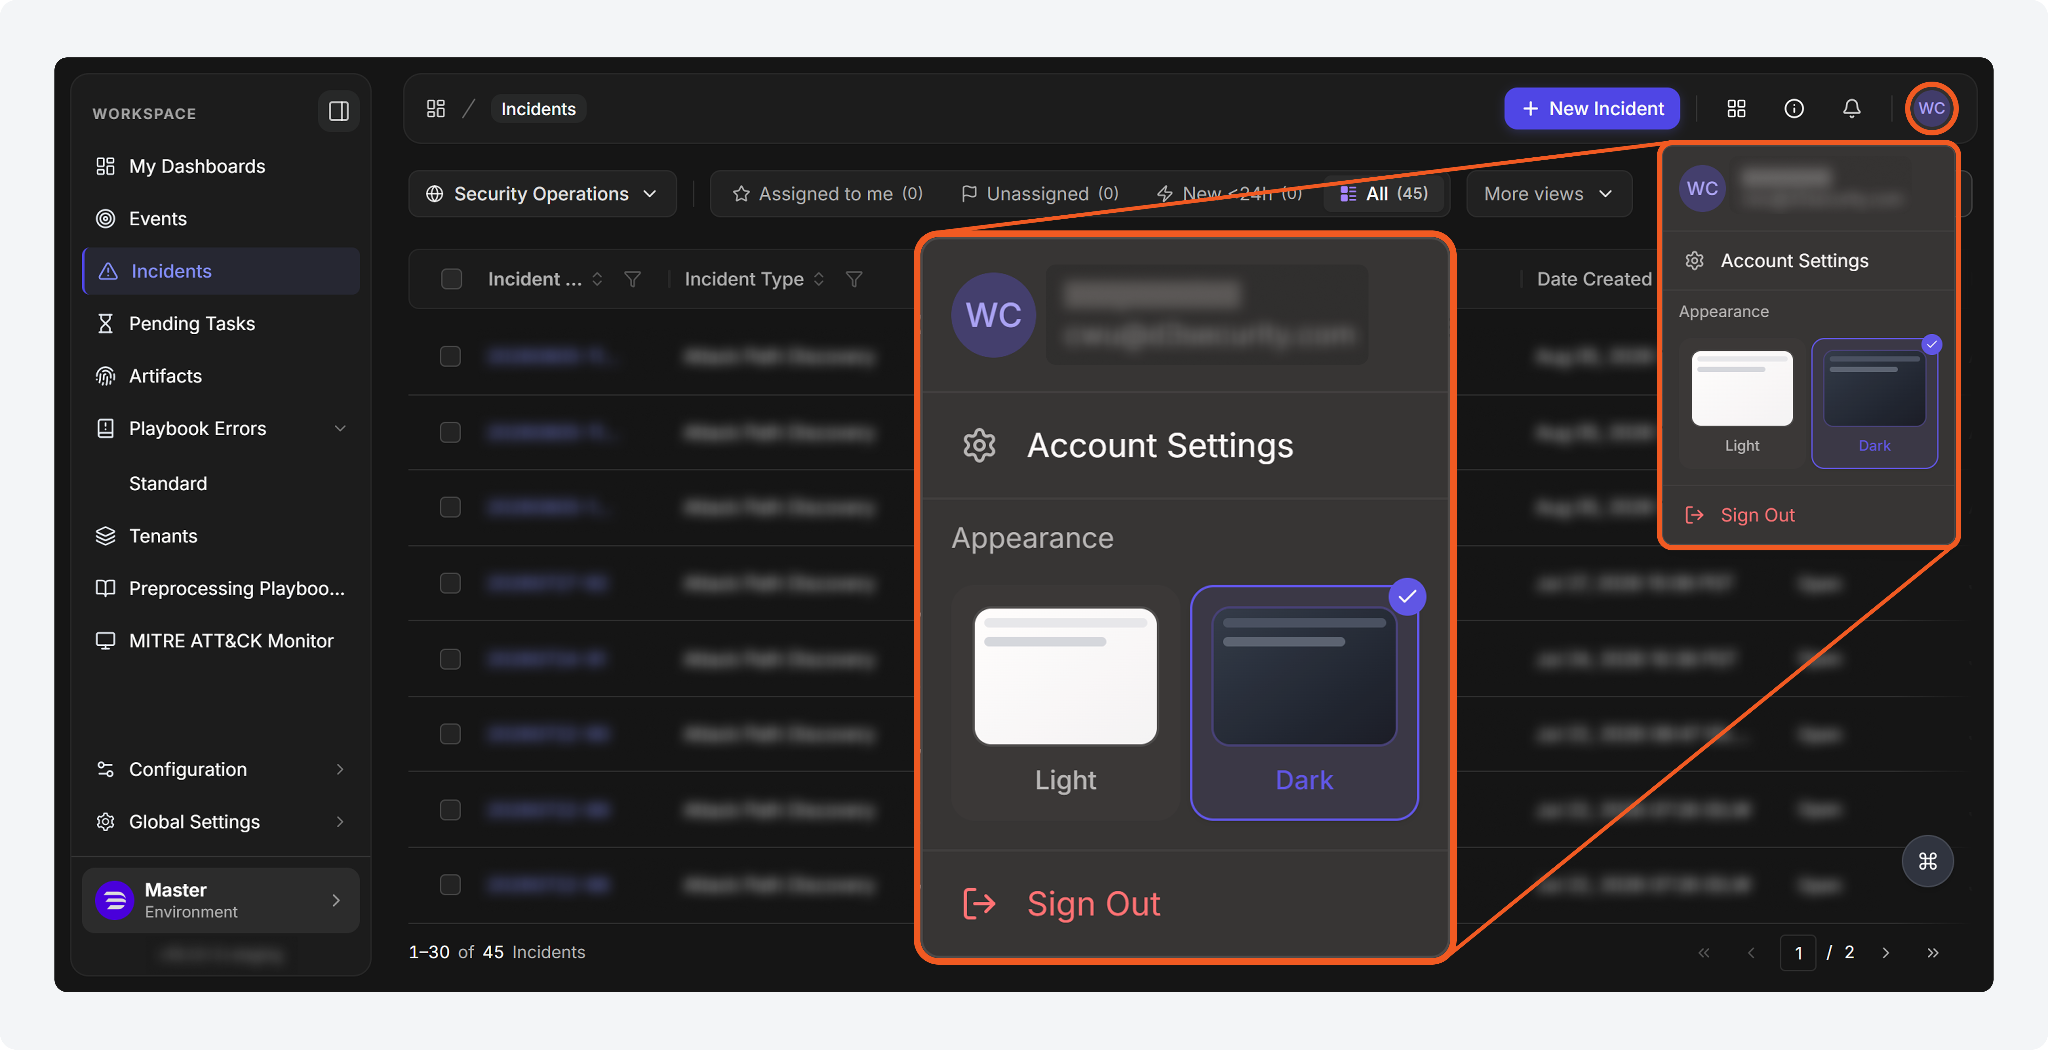
A light theme is now available in the new UI. All D3 users can select Light or Dark under Appearance in the profile menu, at the top-right corner. Each user's theme selection is saved to their account and reapplied on subsequent sign-ins. Dark remains the default.
View Dark Mode
REQUIRED SETTING
The Appearance theme selector requires the EnableThemeSettings application setting, which is disabled by default.
Site Office Hours for SLA
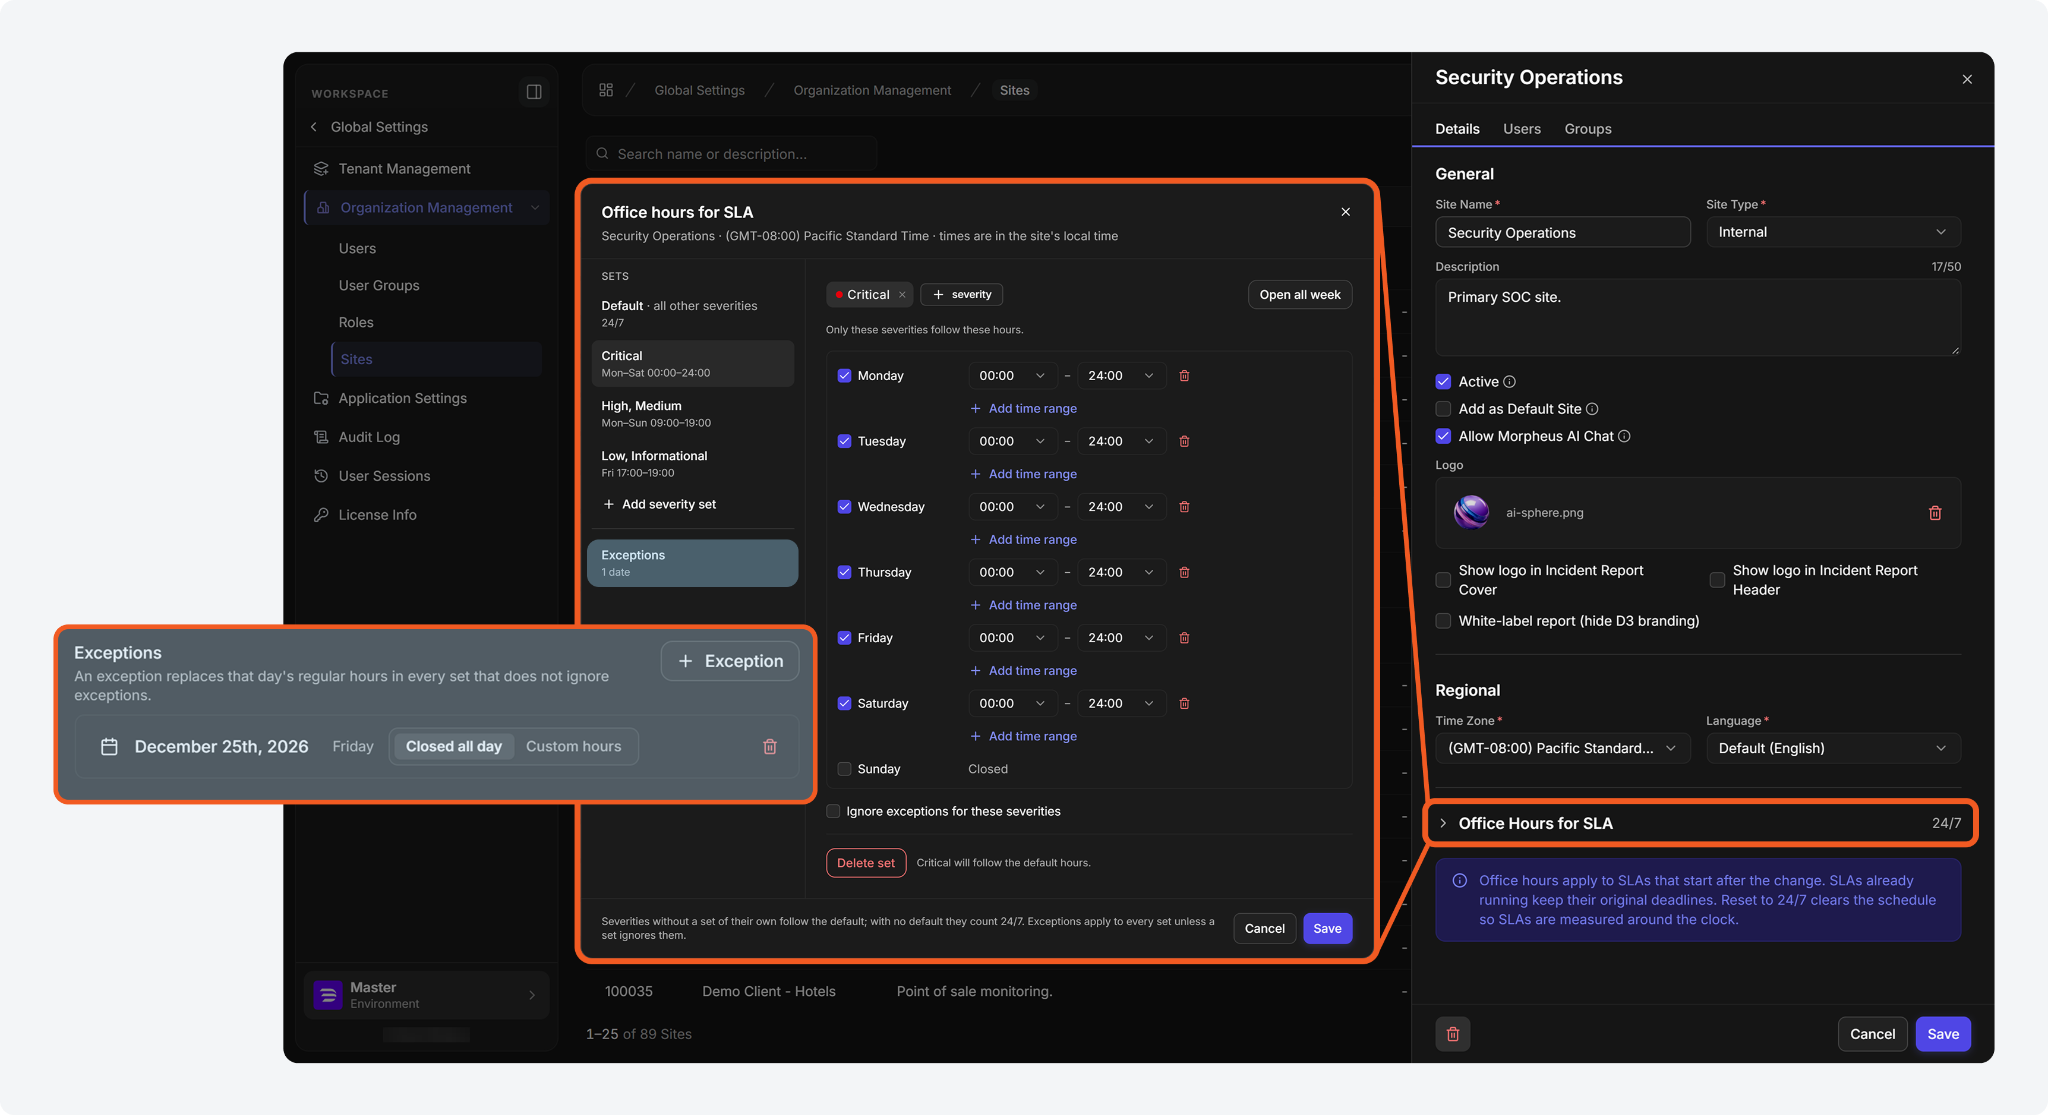
Per-site SLA office (business) hours are now configurable in the new UI, under Global Settings > Organization Management > Sites. Office hours determine when SLA breach timers count down. By default, SLA timers run continuously, 24/7. Administrators can create severity sets containing one or more incident severity levels, and assign each set a weekly schedule with one or more daily intervals. SLA timers pause outside these configured hours. Exceptions, such as holidays, can be configured to pause SLA timers during the configured office hours. An exception can apply to an entire day or specific time intervals. Individual sets can be configured to ignore exceptions.
SLA Rule Pause Conditions
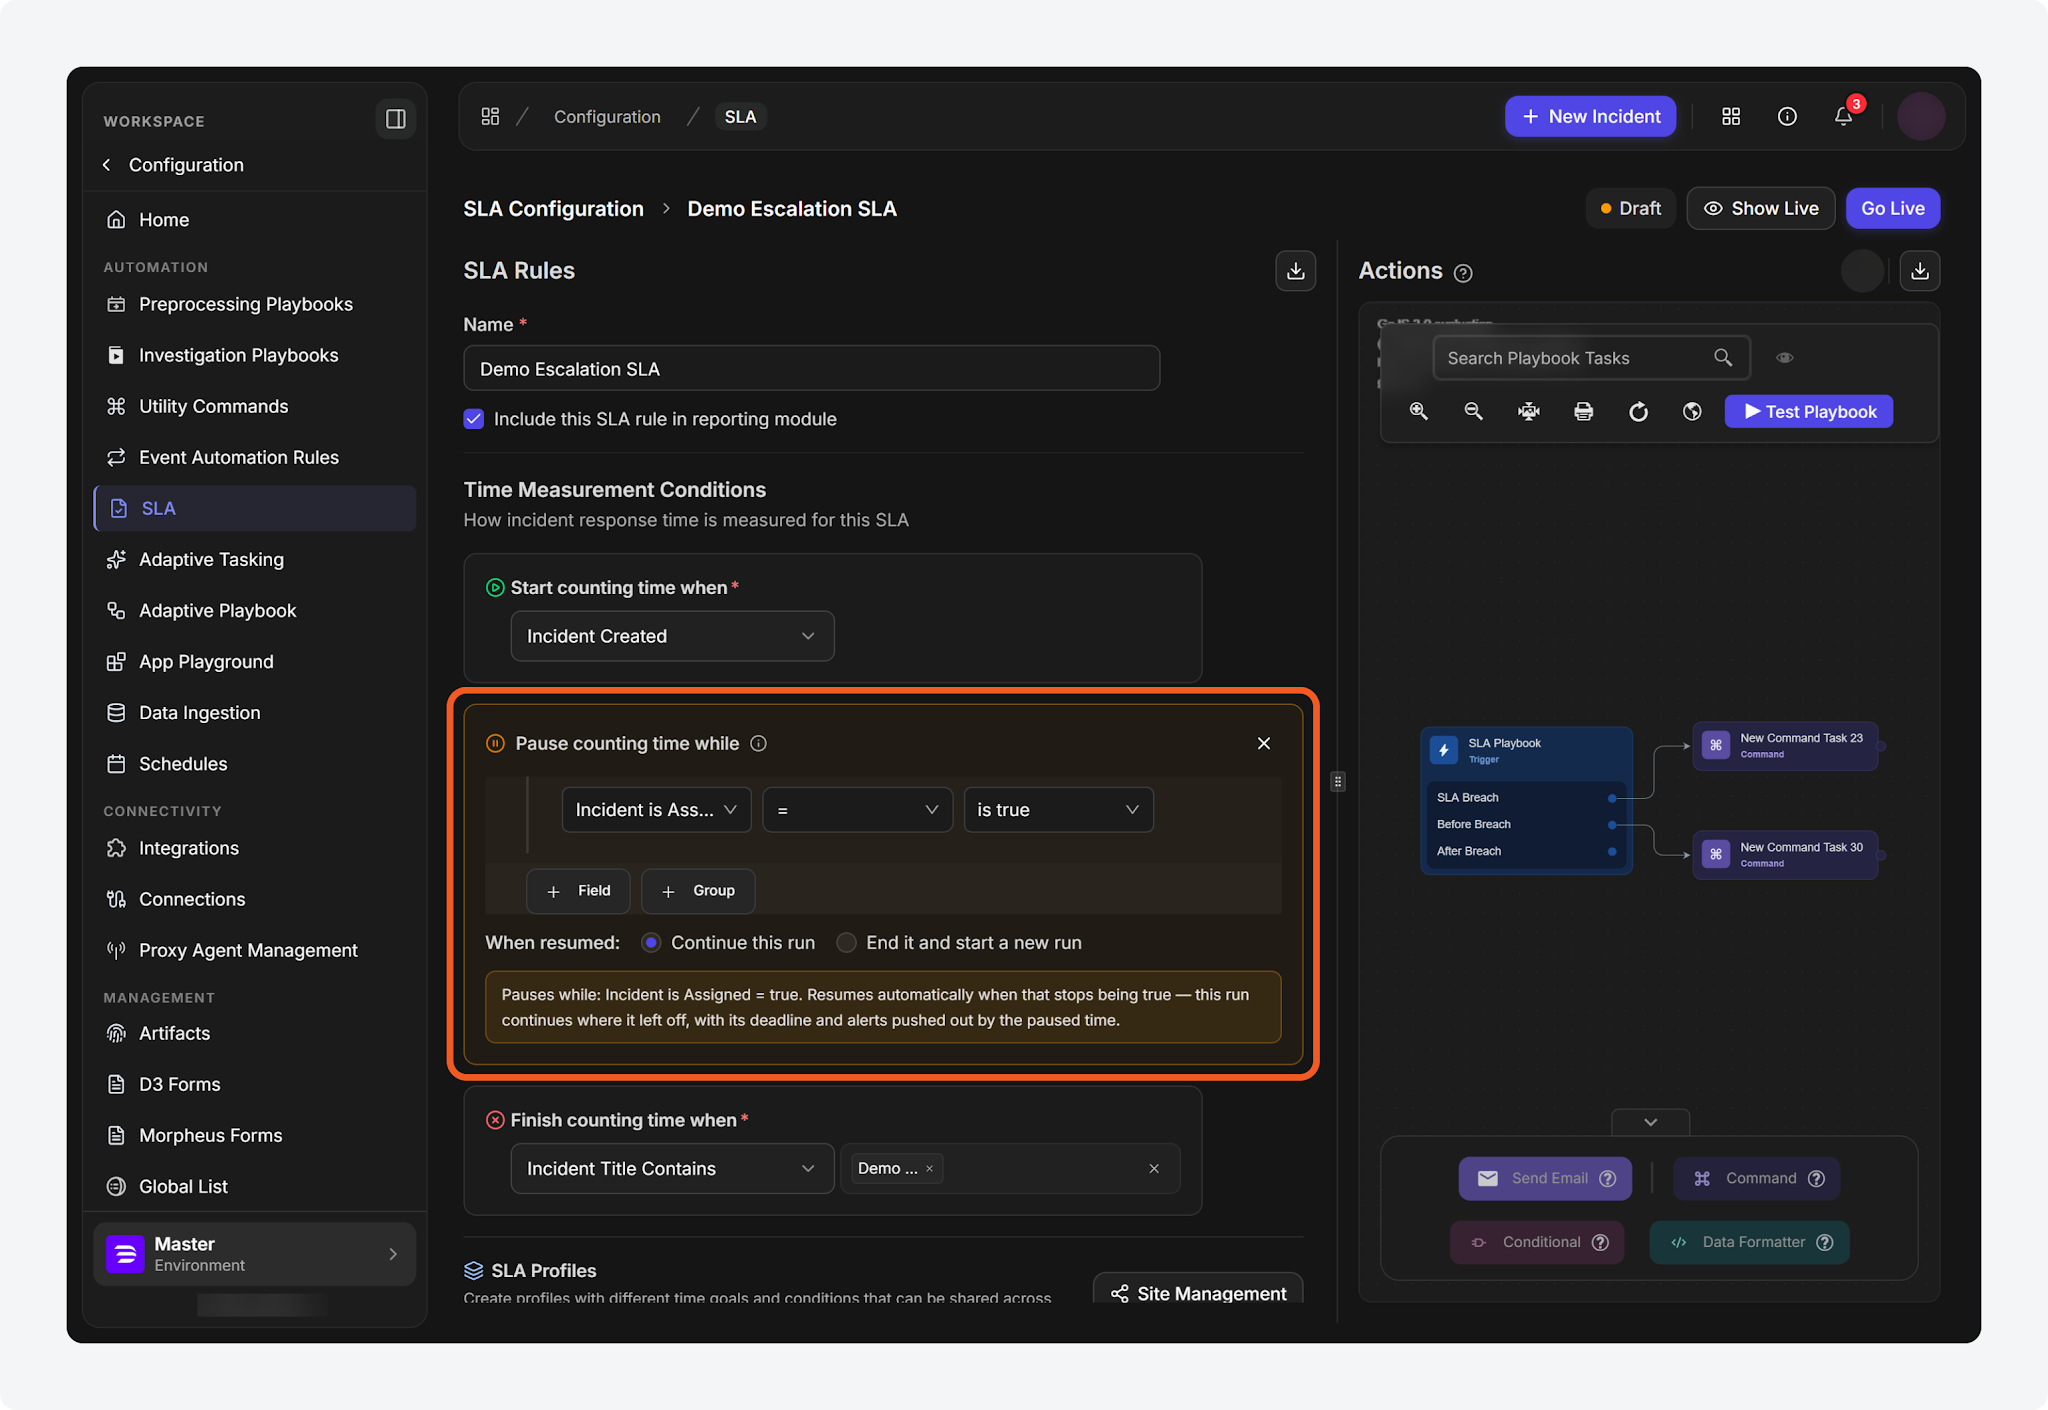
In both the new UI and the classic view, SLA rules can now stop the countdown toward breach while a configured condition is true. Administrators define when the SLA pauses by combining one or more incident conditions with AND/OR logic. When the pause condition becomes false, the SLA resumes according to the "When resumed" setting, which determines whether the same SLA run continues from where it paused or the paused run ends and a new run starts. Breached runs do not pause or start successor runs.
Enhancements
Reporting Editor Workflow
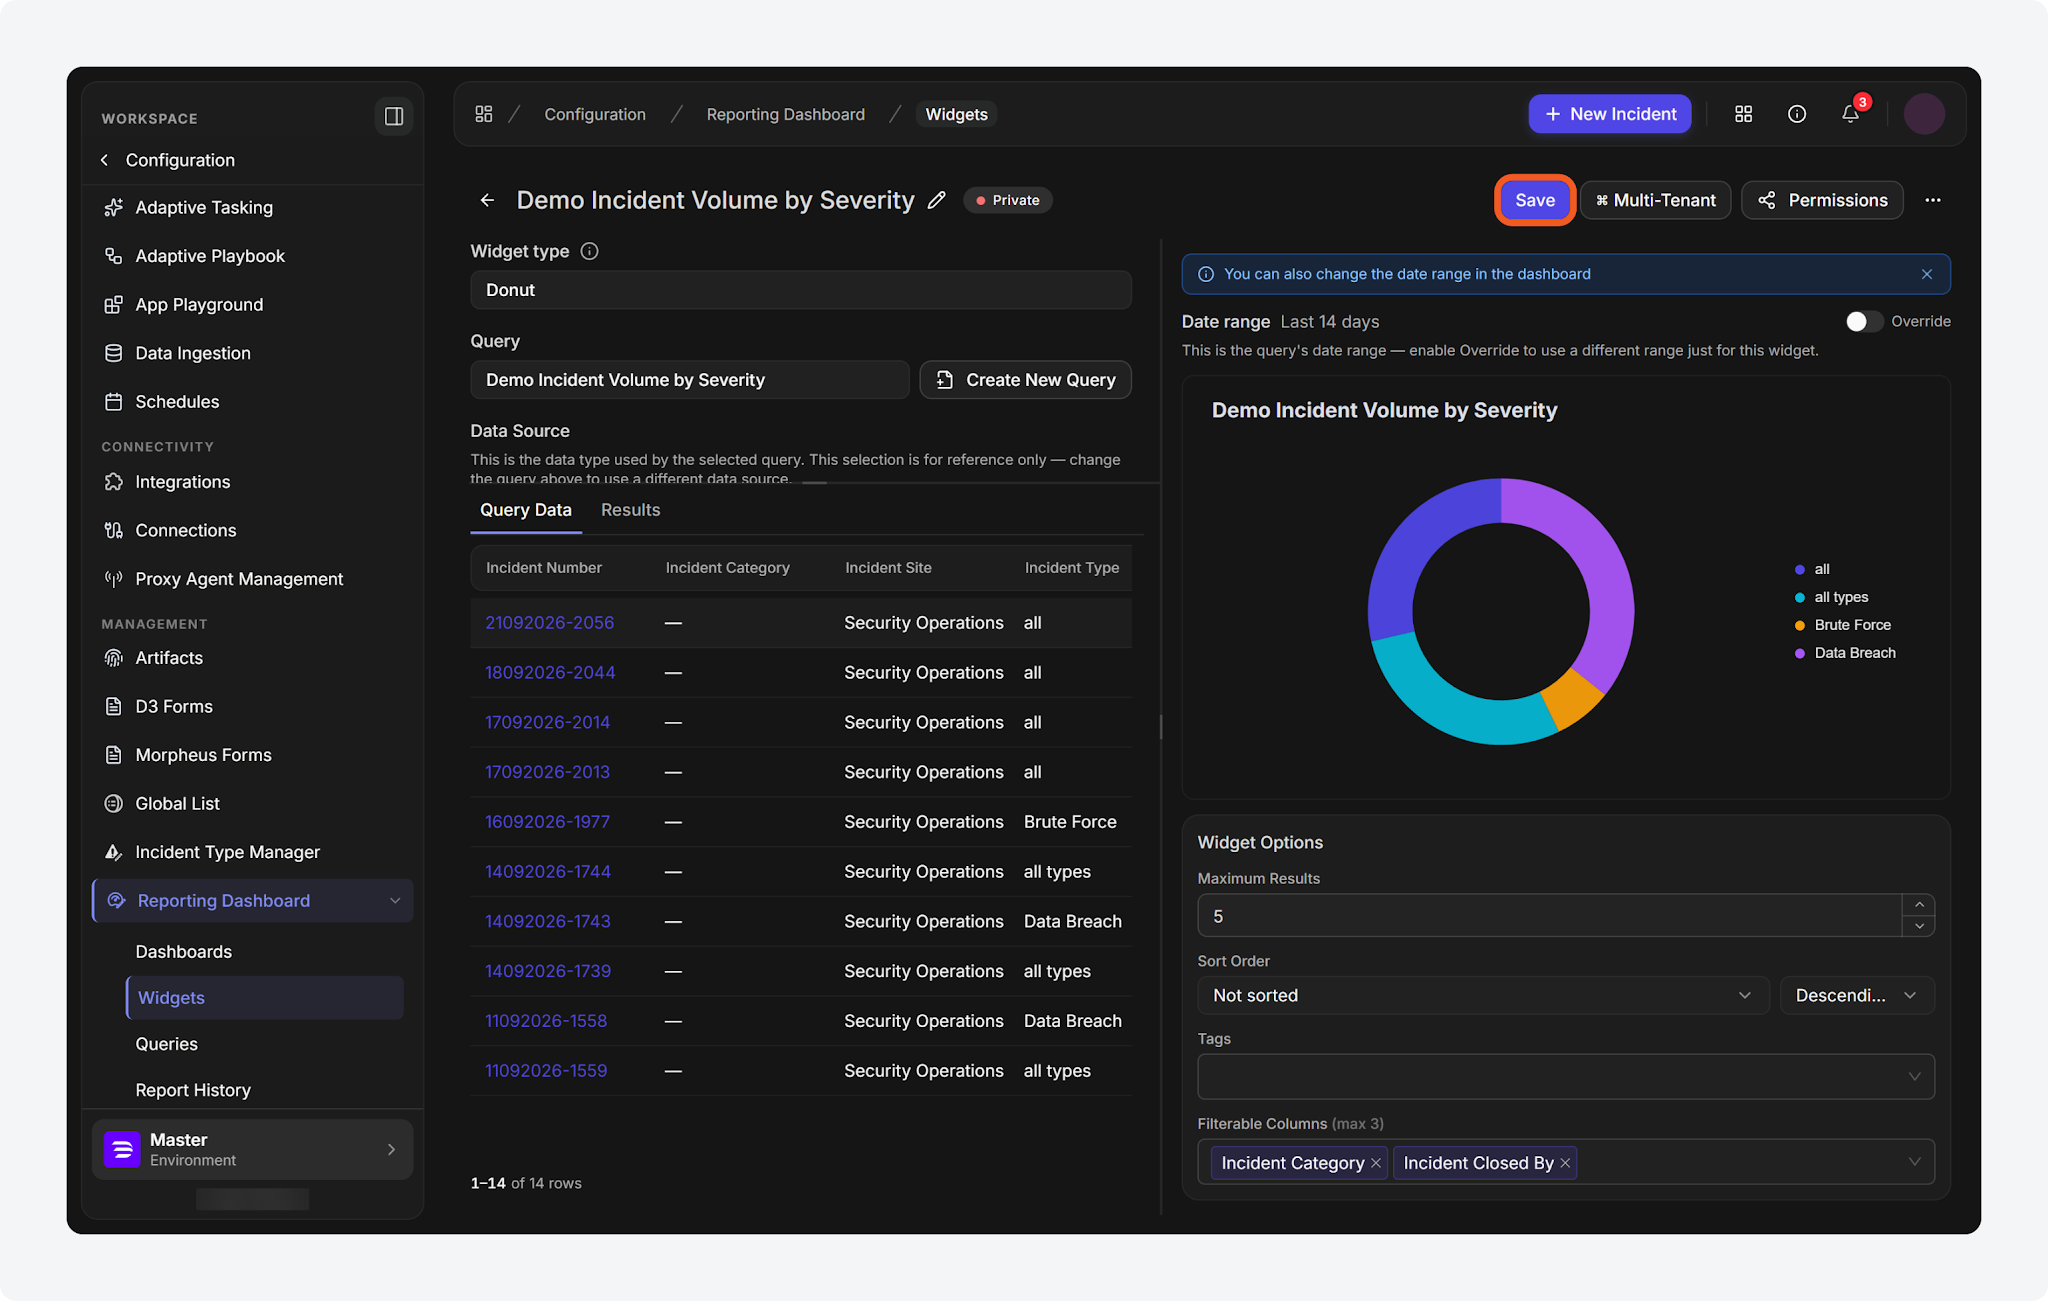
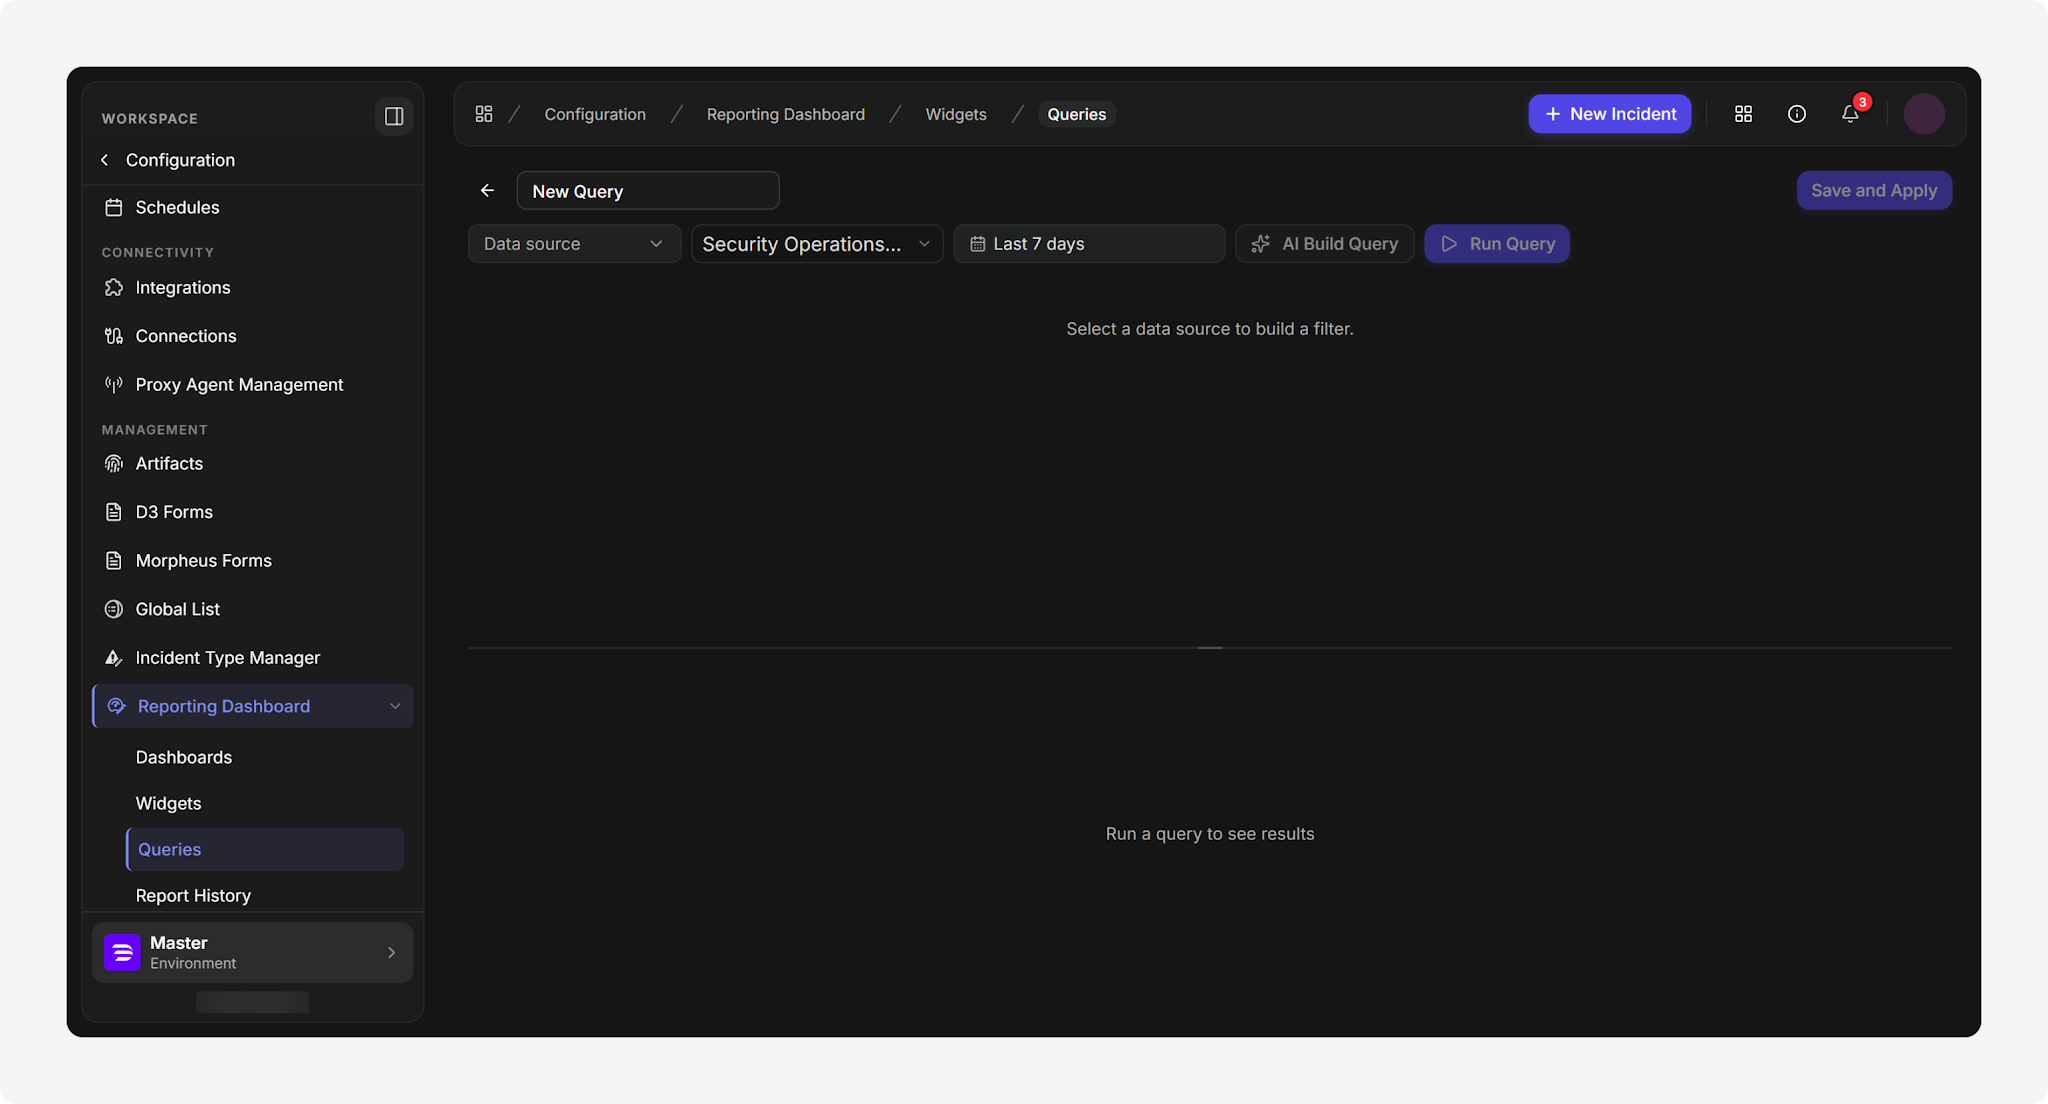
The query and widget editors in the new UI have been updated. Save and Back to Create Widget are now a single Save and Apply action, and the separate Cancel button has been removed, since the back arrow already discards changes. Save stays disabled until required fields are set. A successful save now keeps the user on the record's own editor page instead of returning to the list, so its other actions remain available without reopening it.
Reporting Query Usage Count
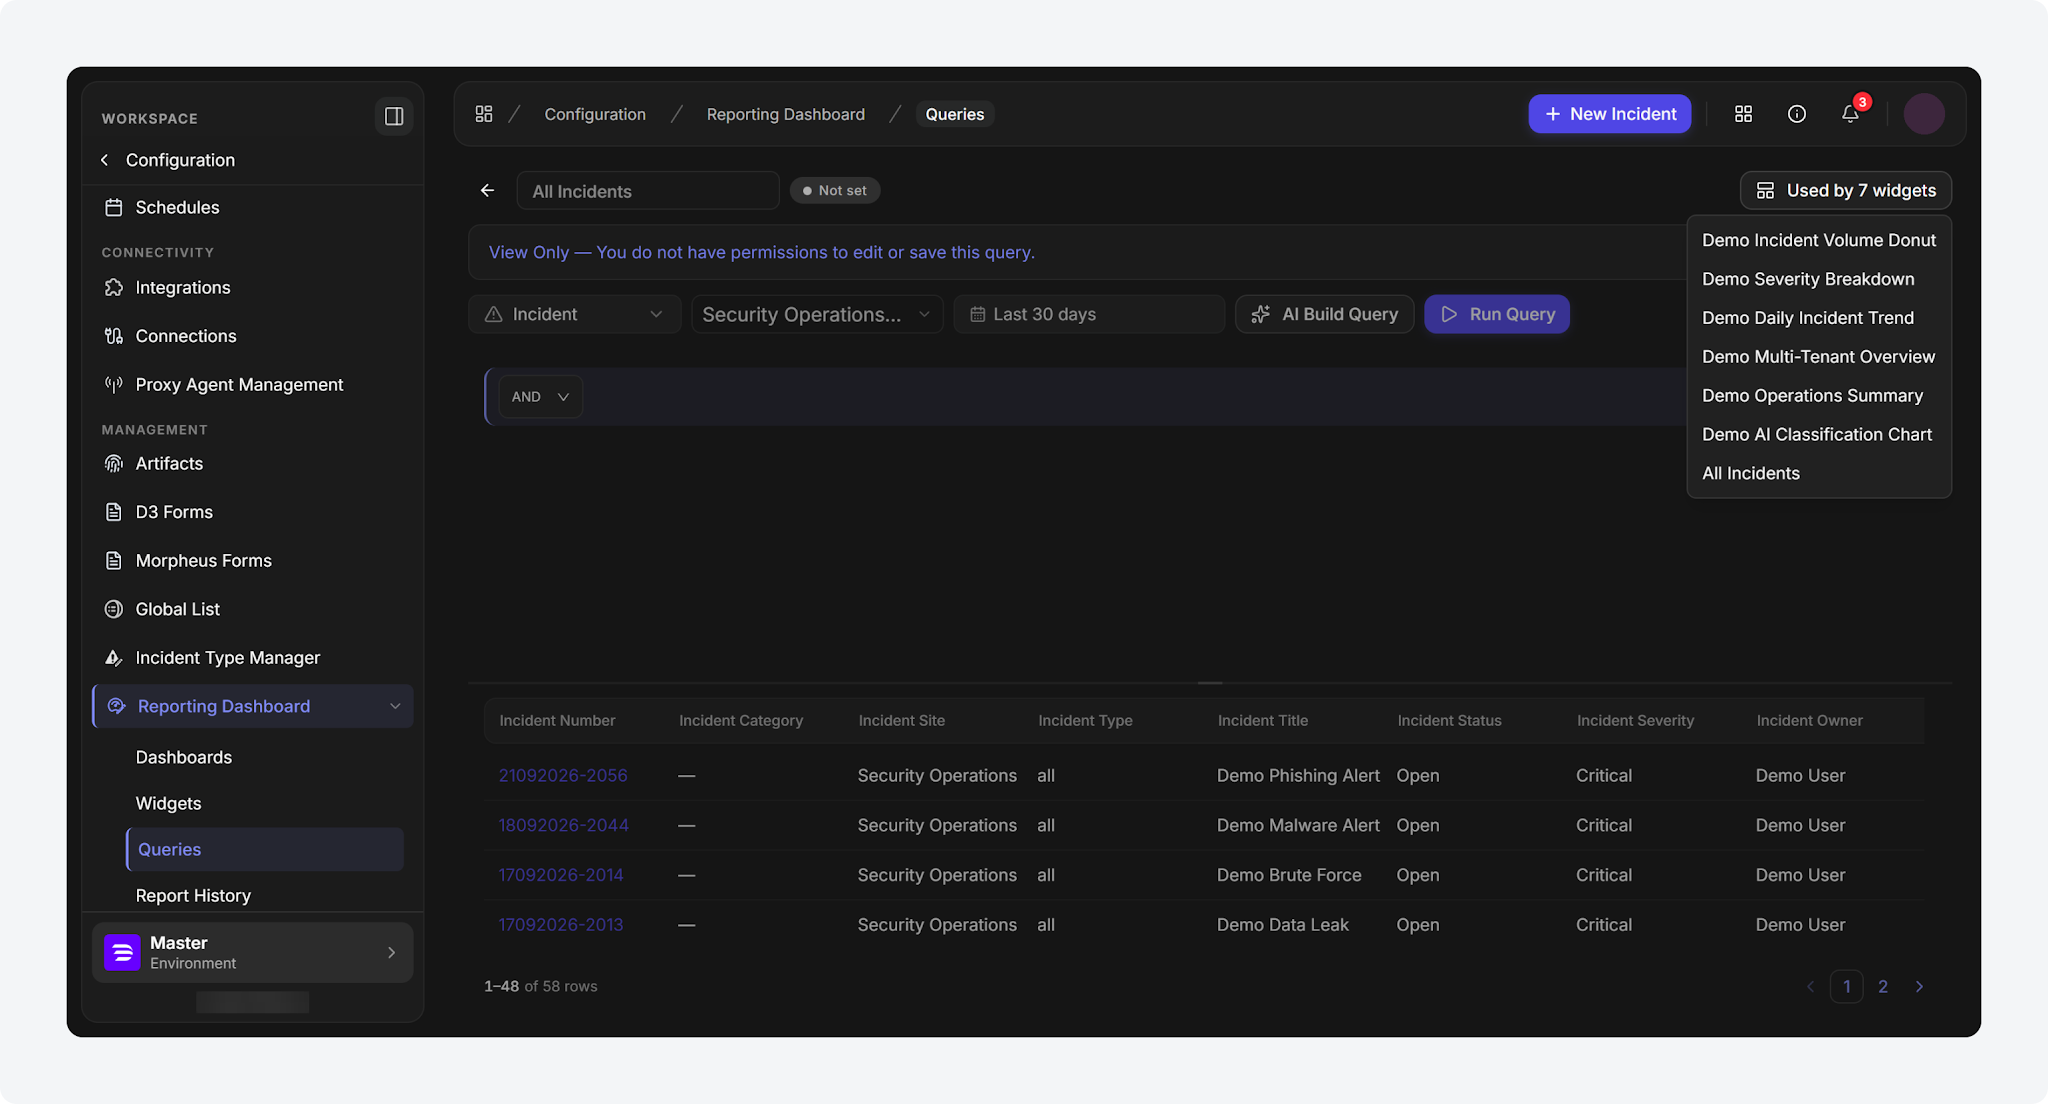
The Reporting Query editor in the new UI now shows how many widgets reference the saved query, in a header button labeled with the live count. Users can open it to see each referencing widget by name and jump directly to its editor, making it possible to check a query's impact before editing or deleting it. When no widget references the query, the button is disabled with a Not used by any widgets tooltip.
Calendar-Boundary Date Presets
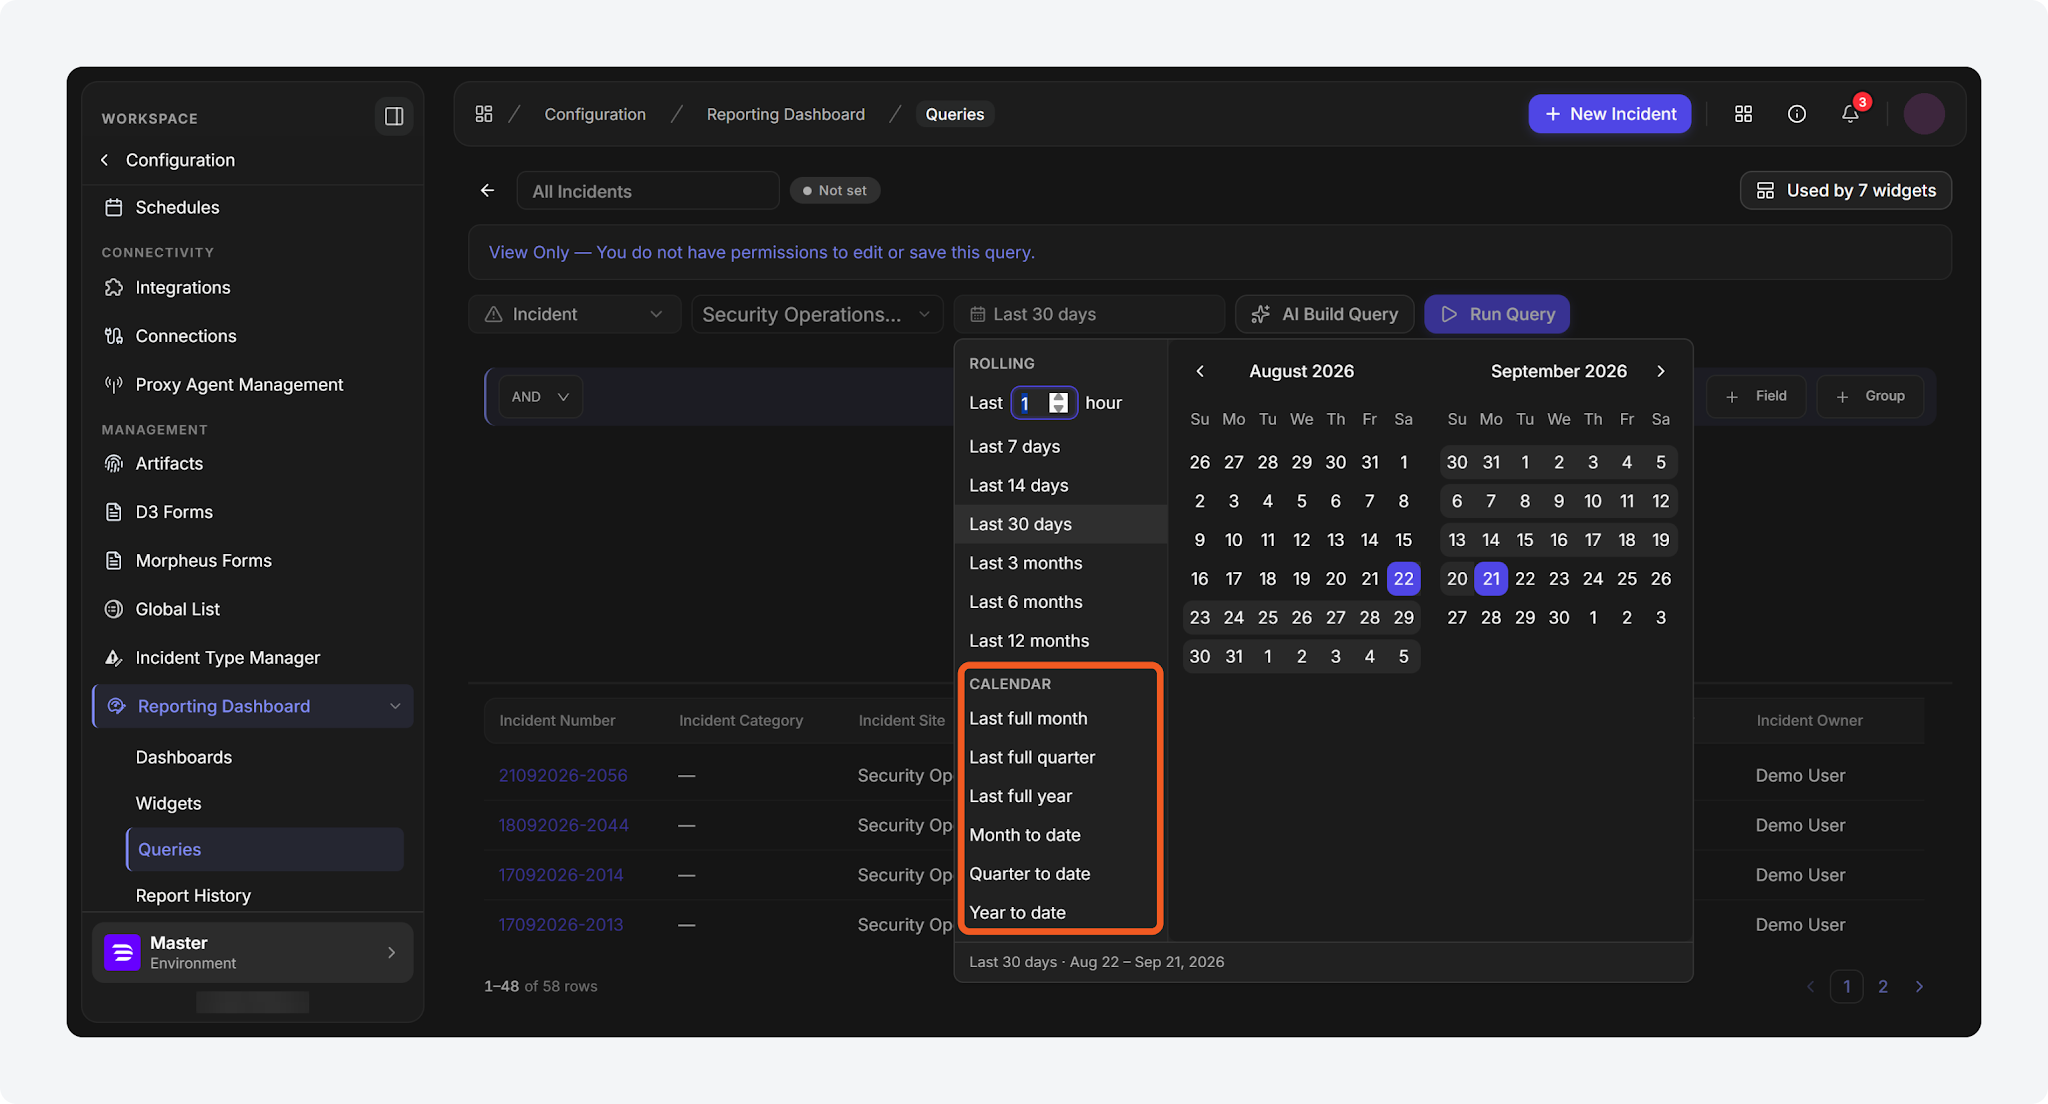
The date-range picker in the Dashboards, Widgets, and Queries editors under Configuration > Reporting Dashboard now includes six calendar-boundary presets, in the new UI. They sit alongside the existing rolling-window presets. Selecting a preset moves the calendar to the matching dates and shows the resolved range in a footer beneath it. Users no longer recalculate and re-pick exact start and end dates for recurring monthly or quarterly reports. A manually dragged range is now labeled Custom, with its dates shown in the footer. Dashboards, widgets, and queries saved before this release are unaffected.
Reporting Dashboards and Widgets
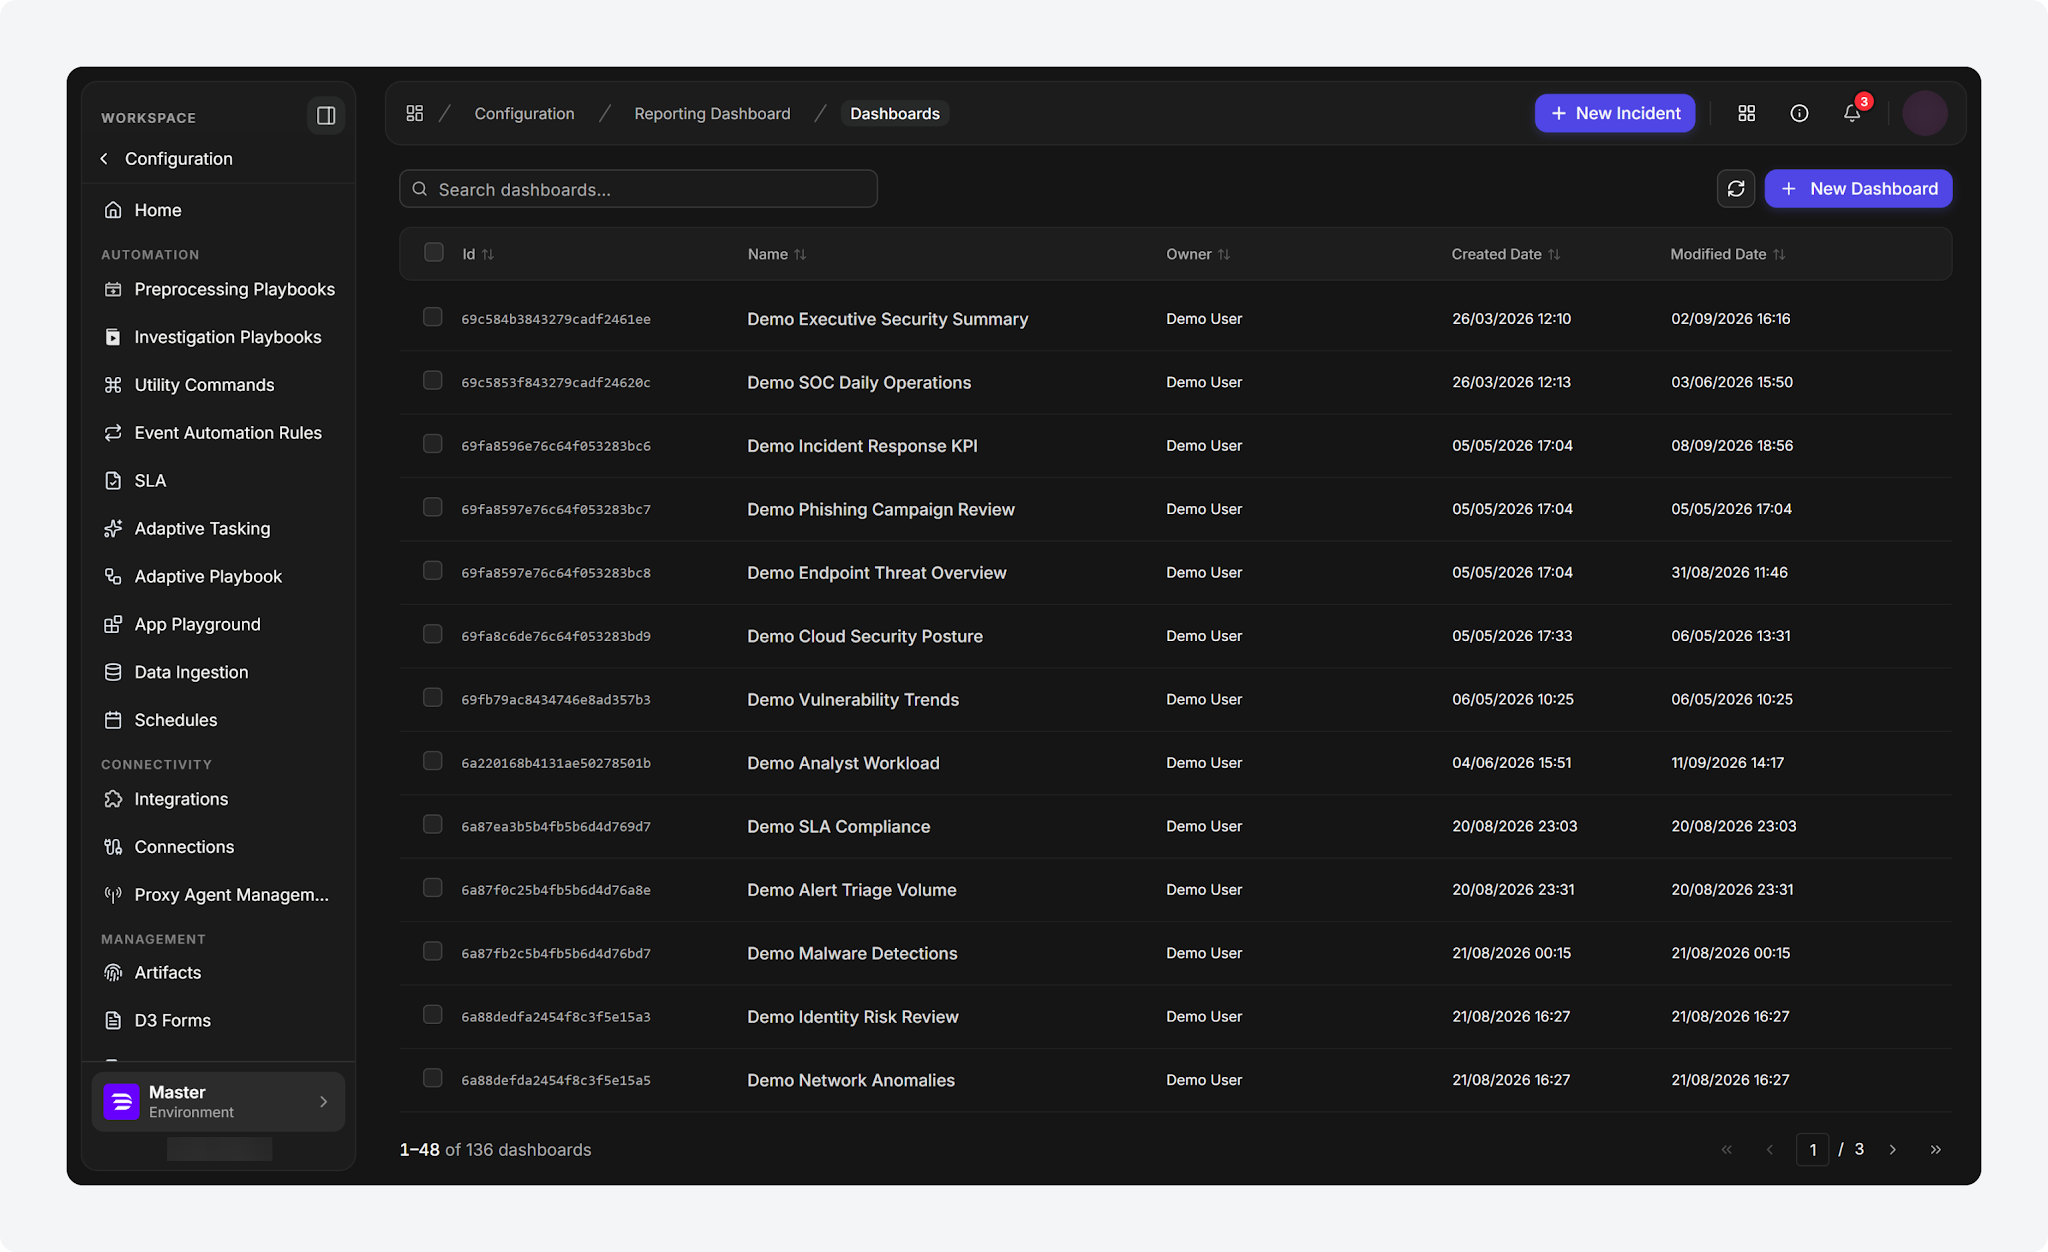
The My Dashboards page, along with the Dashboards and Widgets pages under Configuration > Reporting Dashboard, now renders natively in the new UI instead of loading an embedded classic-view frame. This removes the wait for that frame to load. All existing dashboard and widget creation, editing, and configuration capabilities carry over unchanged.
FEATURE FLAG
Access requires the Feature.NewReportingDashboards.Enabled feature flag.
Artifact-Driven Morpheus AI Graph
The Morpheus AI graph on the incident workspace in the new UI is now artifact-driven. Analysts can click a node that resolves to an incident artifact to open that artifact's details without leaving the graph. Nodes that share an artifact are merged into one, and unresolved nodes are dimmed. An isolated node states why it could not be connected. The Show Artifacts toggle, which had no effect, has been removed.
Artifacts Configuration Page Revamp
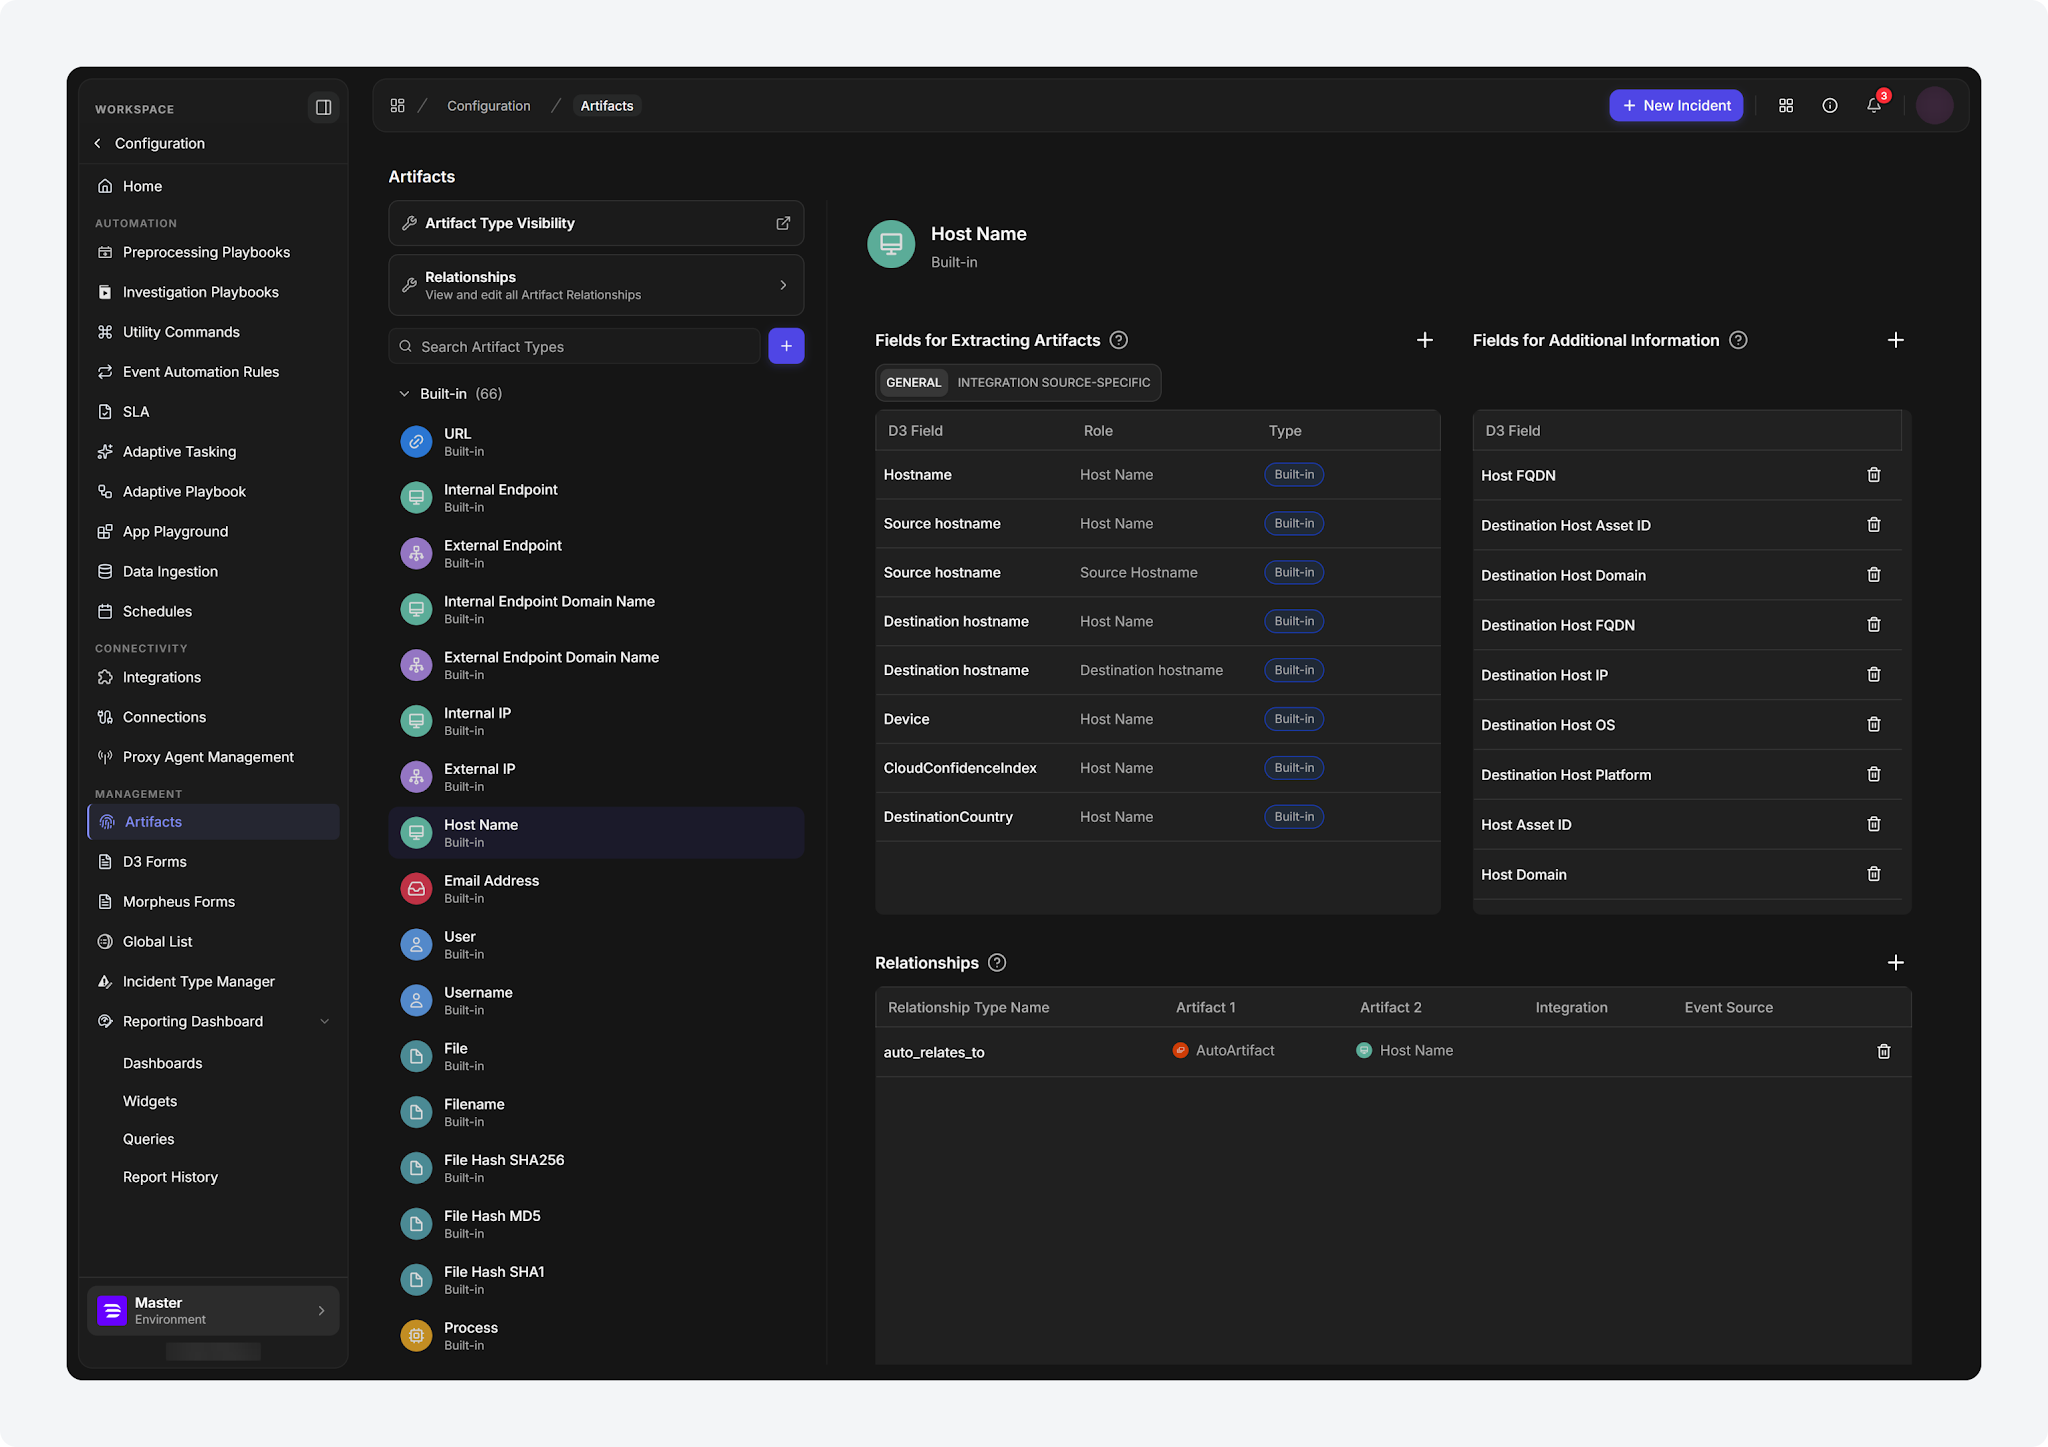
The Artifacts page in Configuration > Management has been rebuilt in the new UI. It now uses the same layout and controls as the rest of the Configuration module, replacing the older interface that was previously embedded inside the page. Artifact type configuration is otherwise unchanged.
Custom Incident Status Limit
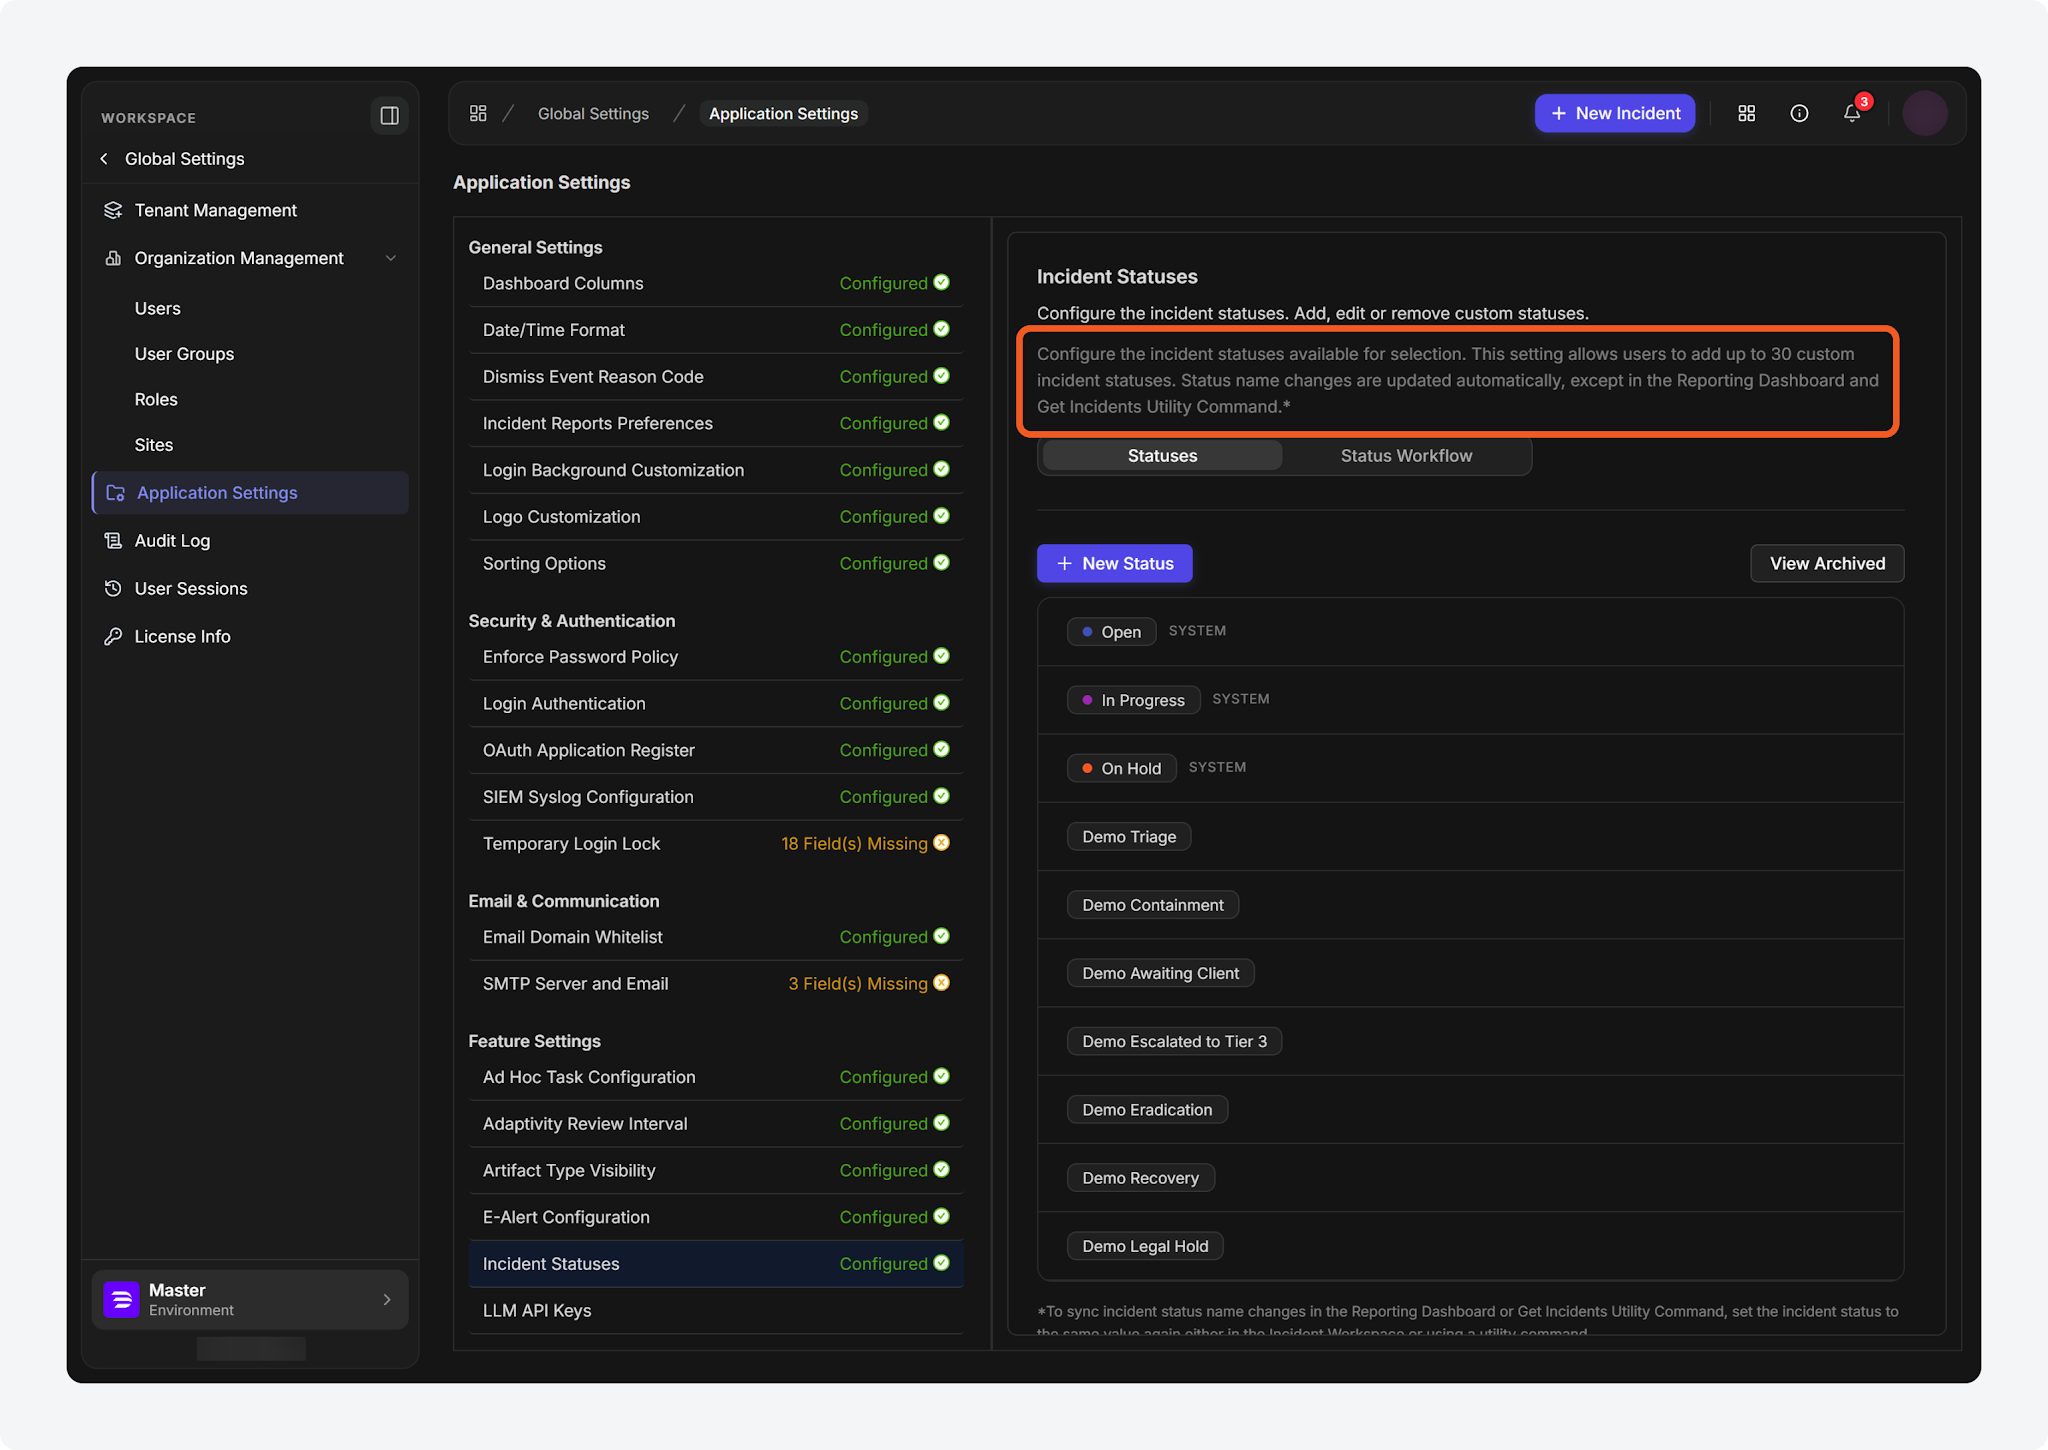
The maximum number of active custom incident statuses has been raised from 10 to 30, in both the new UI and the classic view. Administrators can now add up to 30 under Global Settings > Application Settings > Incident Statuses before the New Status control is disabled, which supports managed service providers whose tenants each run a different incident workflow. Existing statuses and the rest of incident status configuration are unchanged.
Playbook Task Run Confirmation
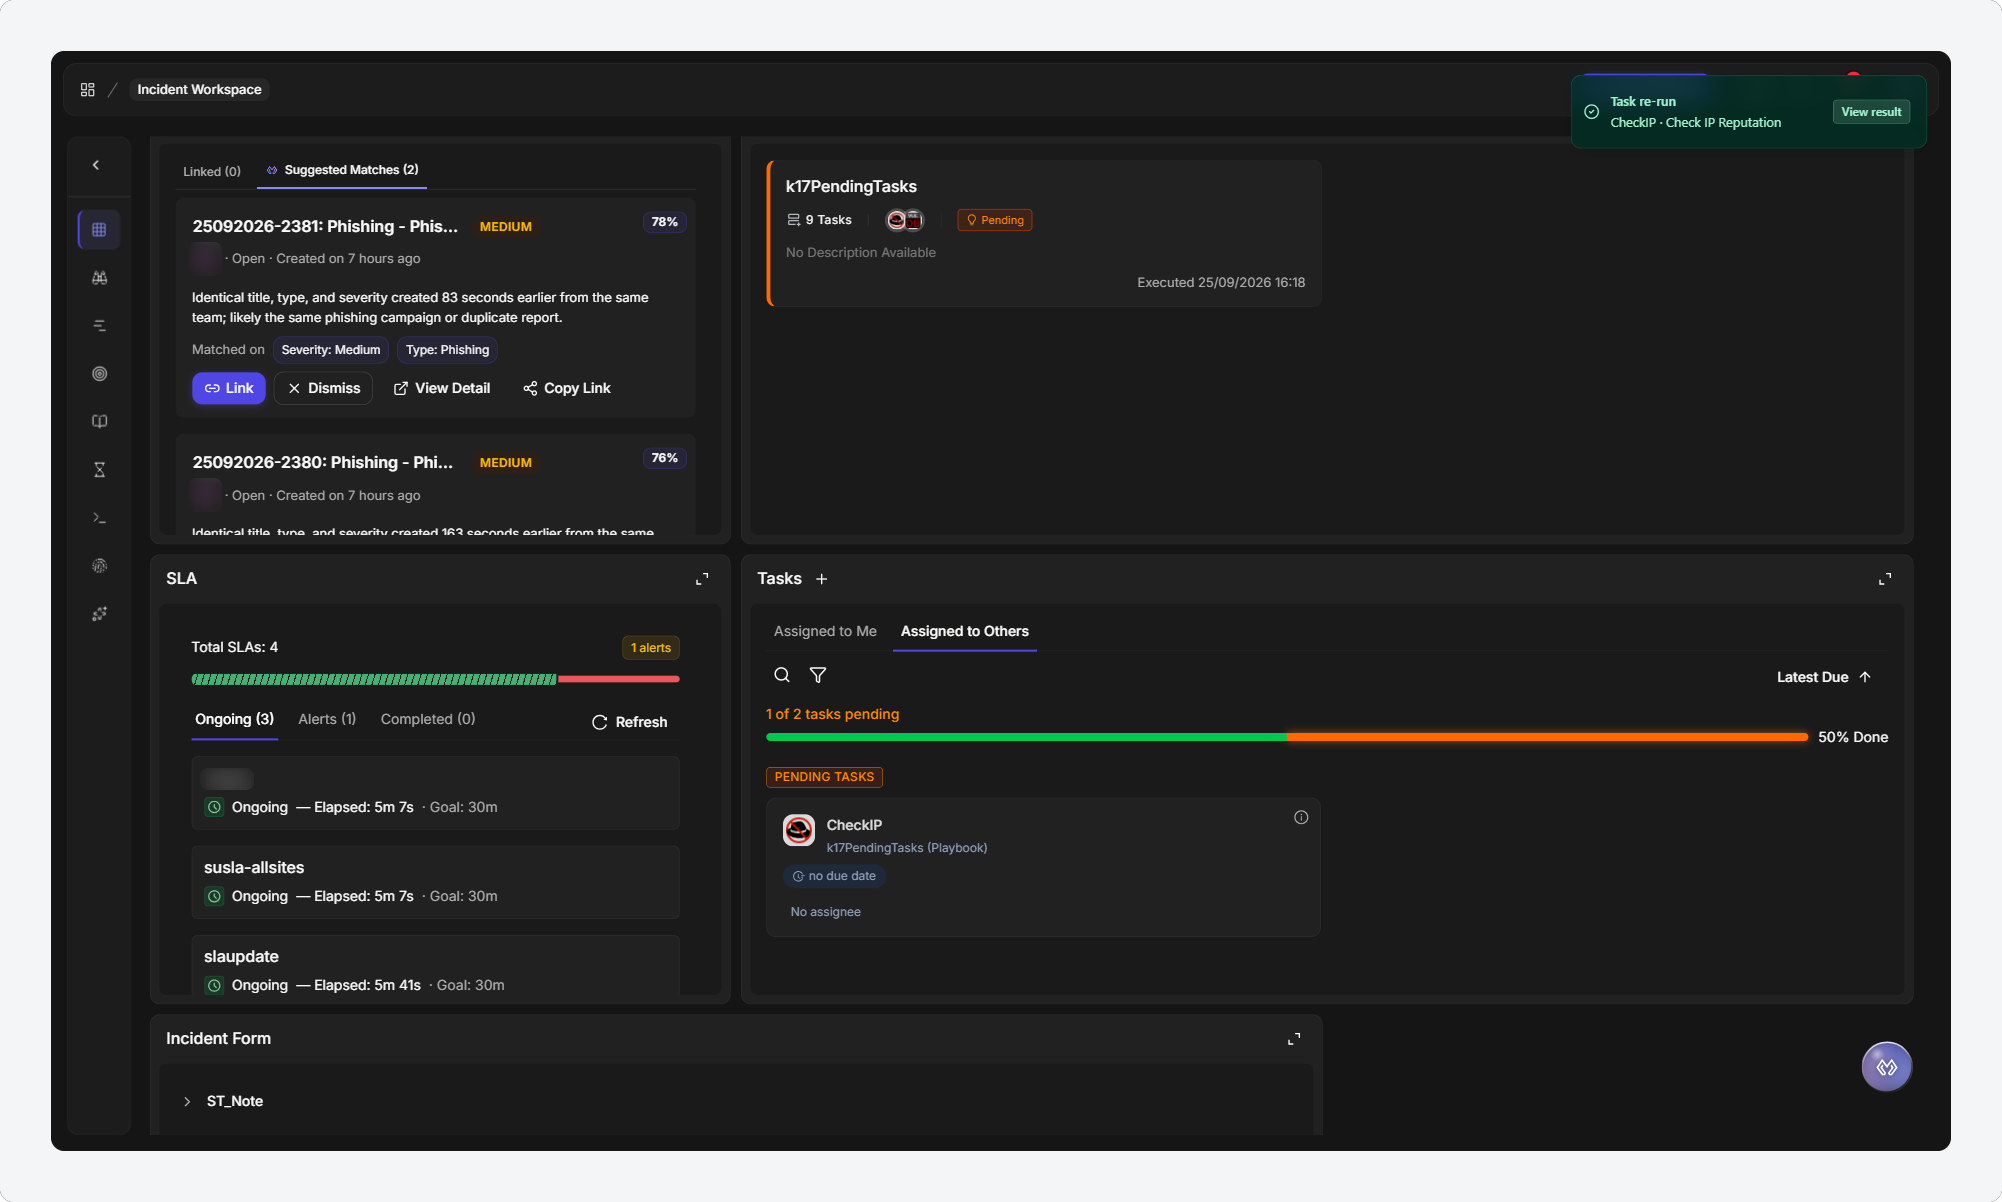
Running a manual playbook task now closes the task detail dialog and shows a confirmation naming the task and its command, in both the new UI and the classic view. Analysts working through several tasks no longer have to dismiss the dialog after each one. In the new UI the confirmation offers View result, which reopens the task report, and a run that is still executing is reported as started rather than completed. A run that fails keeps the dialog open with the reason returned by the command, which the new UI previously did not report.
Adaptive Tasking Conversation History
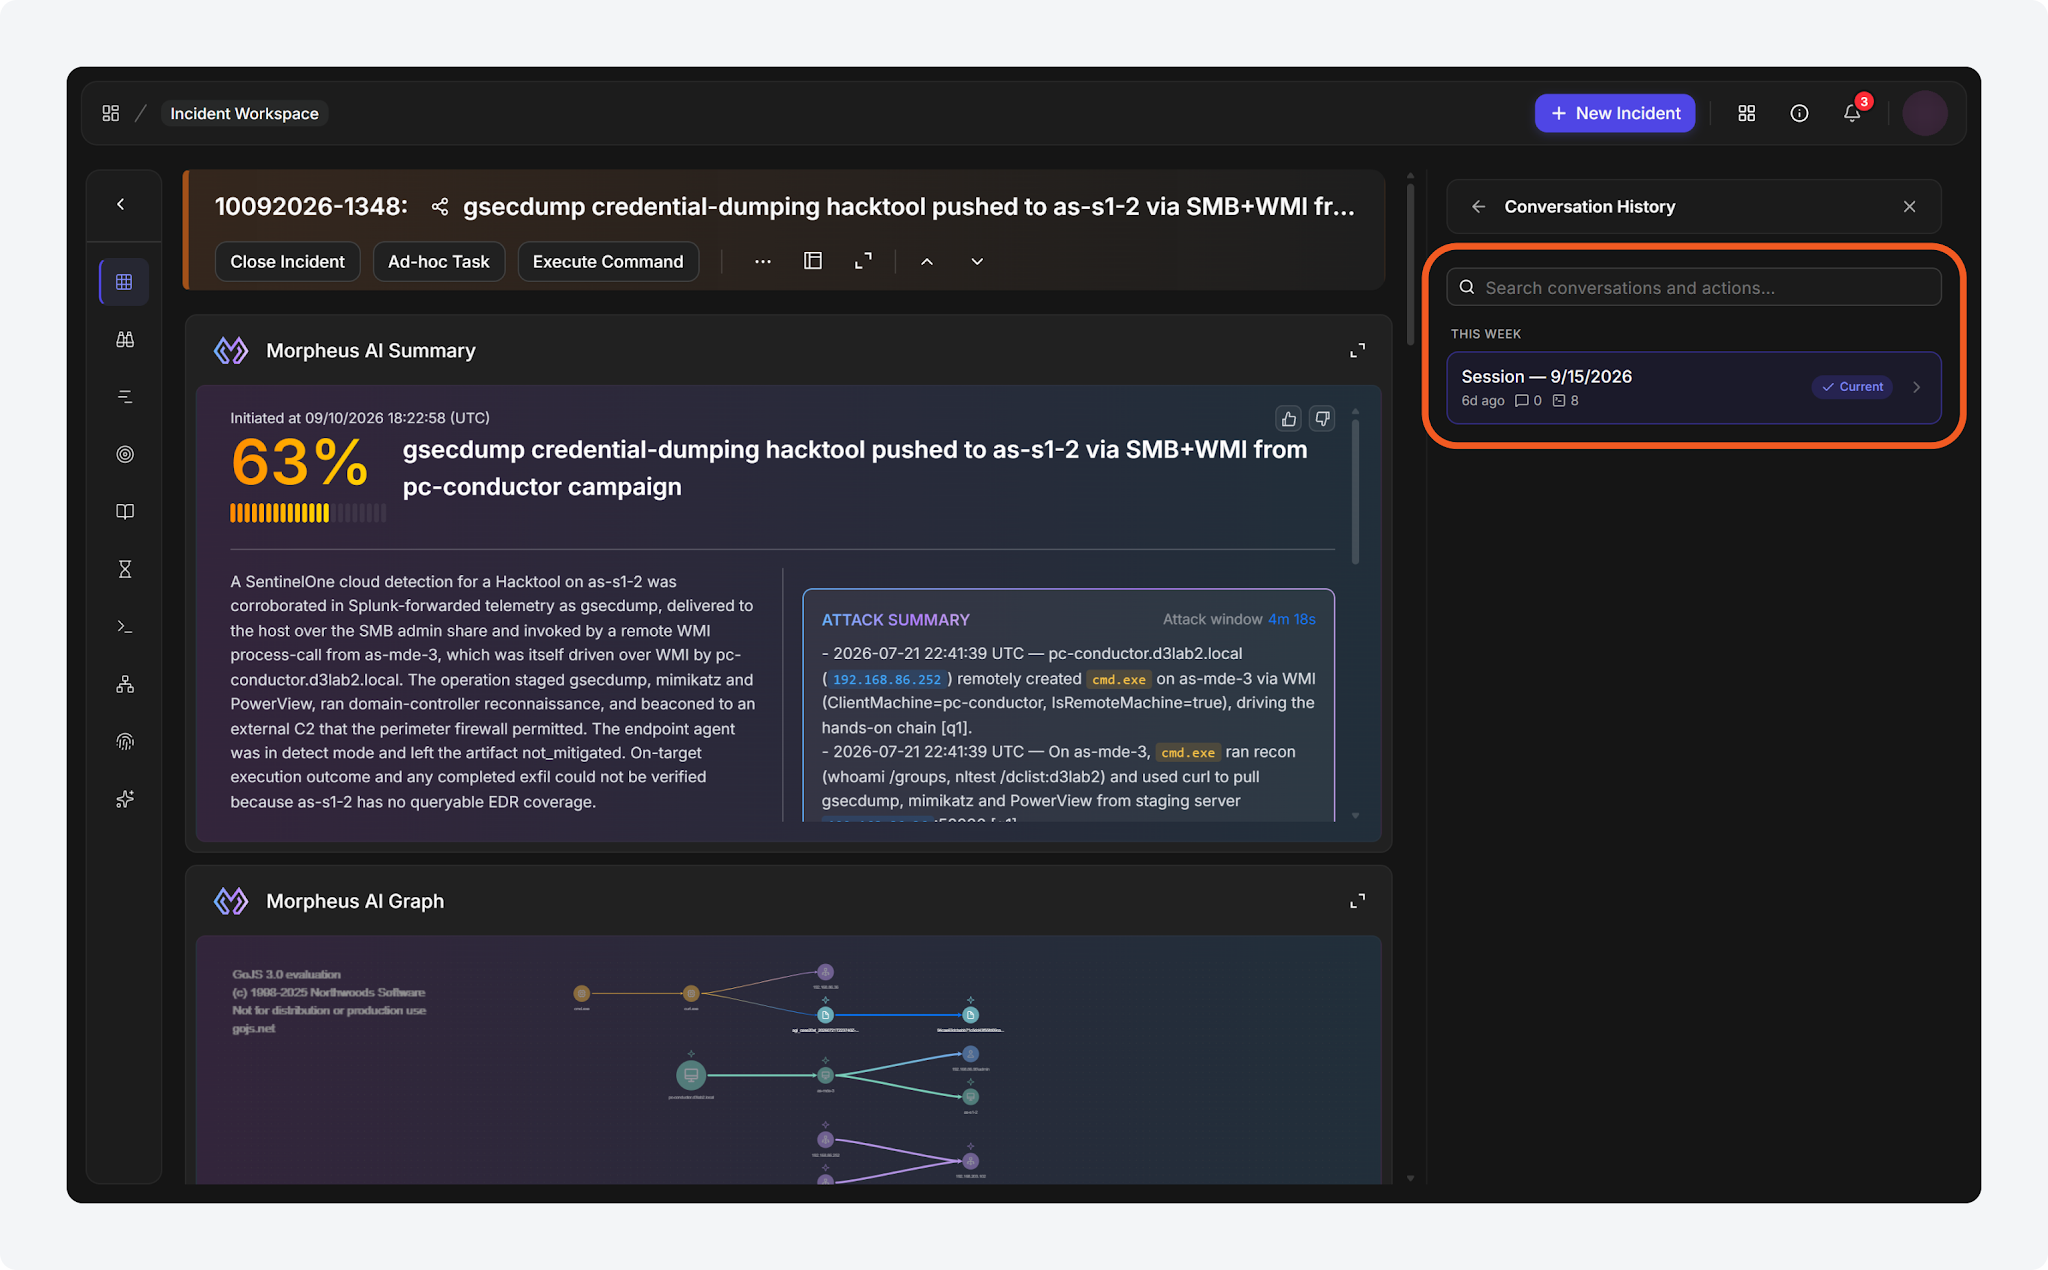
A conversation history is now available in the Adaptive Tasking panel in the new UI, opened from the history icon in the panel header. Users can revisit their own earlier conversations on an incident and replay one read-only. An Actions view lists every command Morpheus attempted, including those blocked by policy, with its risk class, target, outcome, and approver. An action can therefore be attributed to whoever authorized it. Conversations that predate the upgrade remain available for replay, though their Actions view is empty because action records begin at the upgrade.
ACCESS REQUIREMENTS
Access requires the Adaptive Tasking feature flag, the Morpheus AI chat permission, and the site-level AI chat setting.
One-Click OAuth Credential Setup
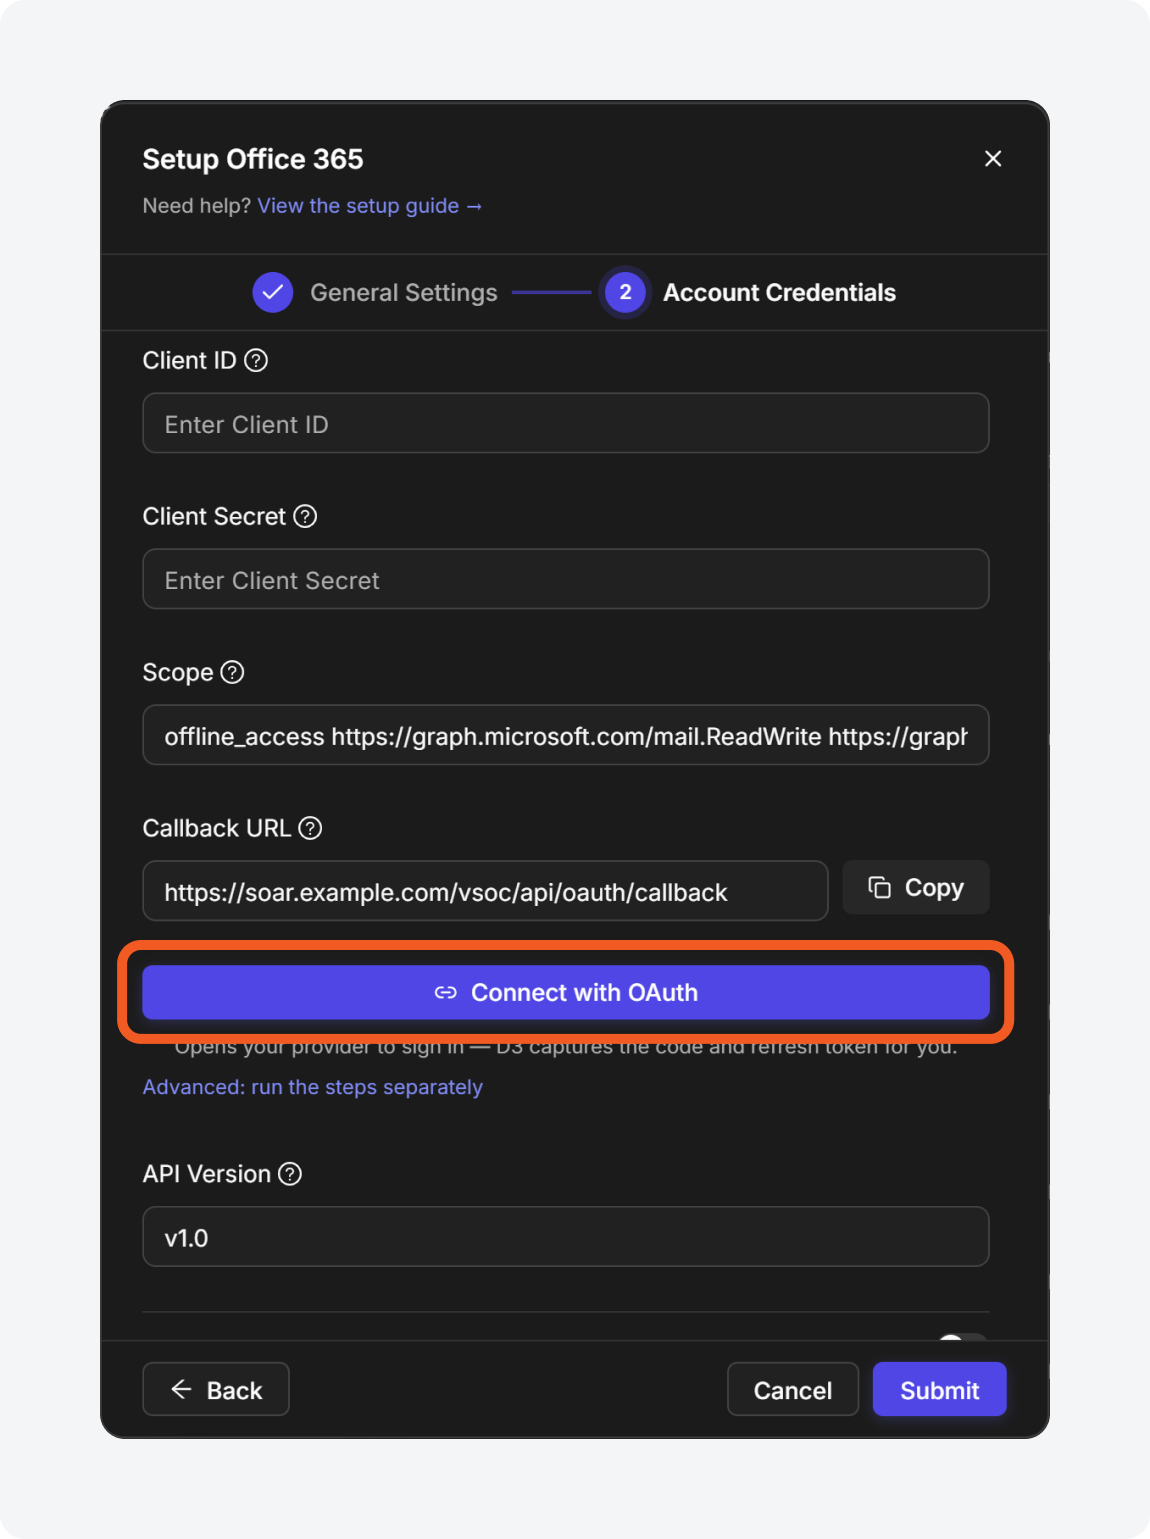
Integrations that require both an authorization code and a refresh token can now be authorized from a single Connect with OAuth button in the new UI. The button sits on the Account Credentials step of the Add Connection and Edit Connection dialogs, below the Callback URL field, once Grant Type is set to Authorization Code. D3 runs the provider sign-in and the token exchange in one action, so the authorization code no longer has to be moved between two fields before it expires. Once a token is returned, the section shows a Connected state with a Disconnect option. The previous two-button flow remains available under Advanced: run the steps separately.
Integration Documentation Access
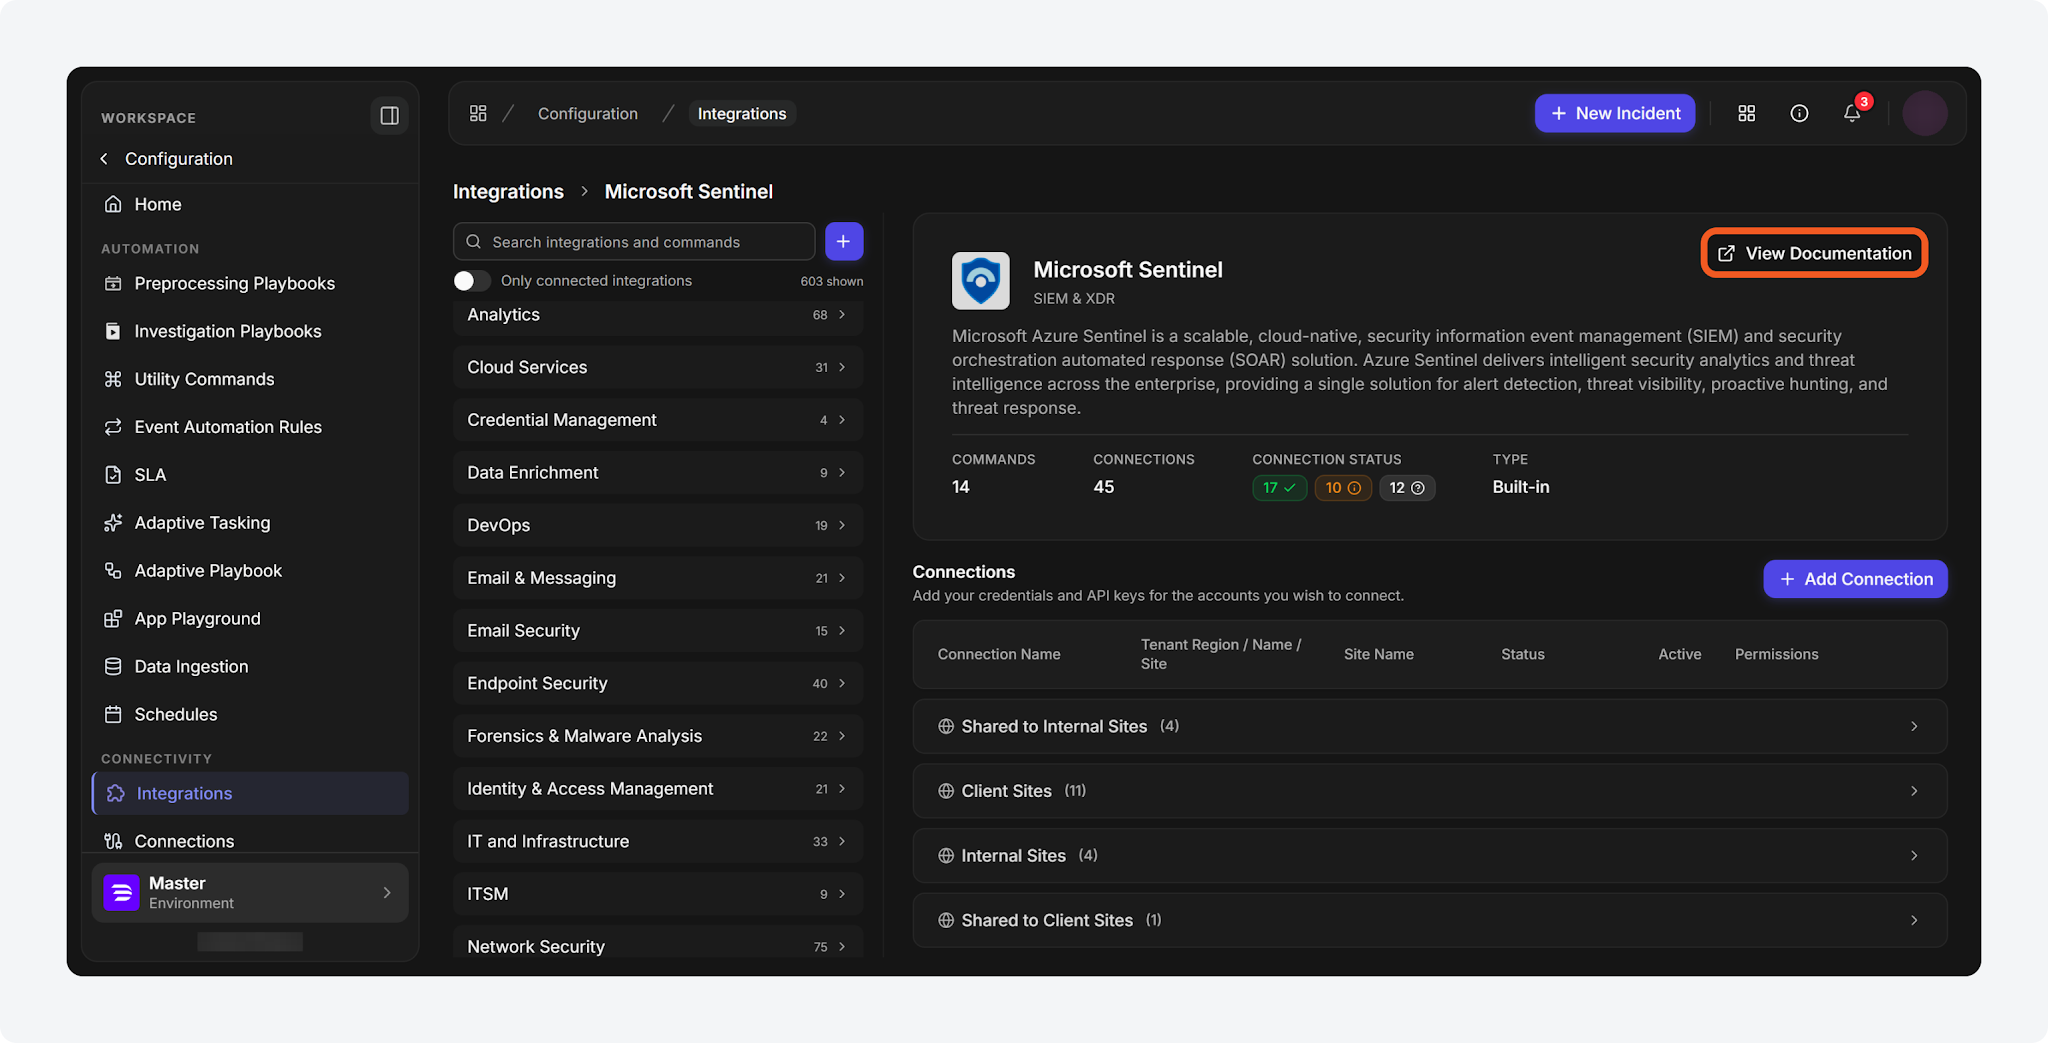
A View Documentation button is now available in the summary panel of an integration, under Configuration > Integrations in the new UI. It opens the integration's published document on the D3 documentation site in a new browser tab. Users no longer have to leave D3 to search for the integration they are configuring. The button appears only on built-in integrations that have a published document. Custom integrations, and built-in integrations without one, are unchanged.
Multi-Site Data Ingestion Schedules
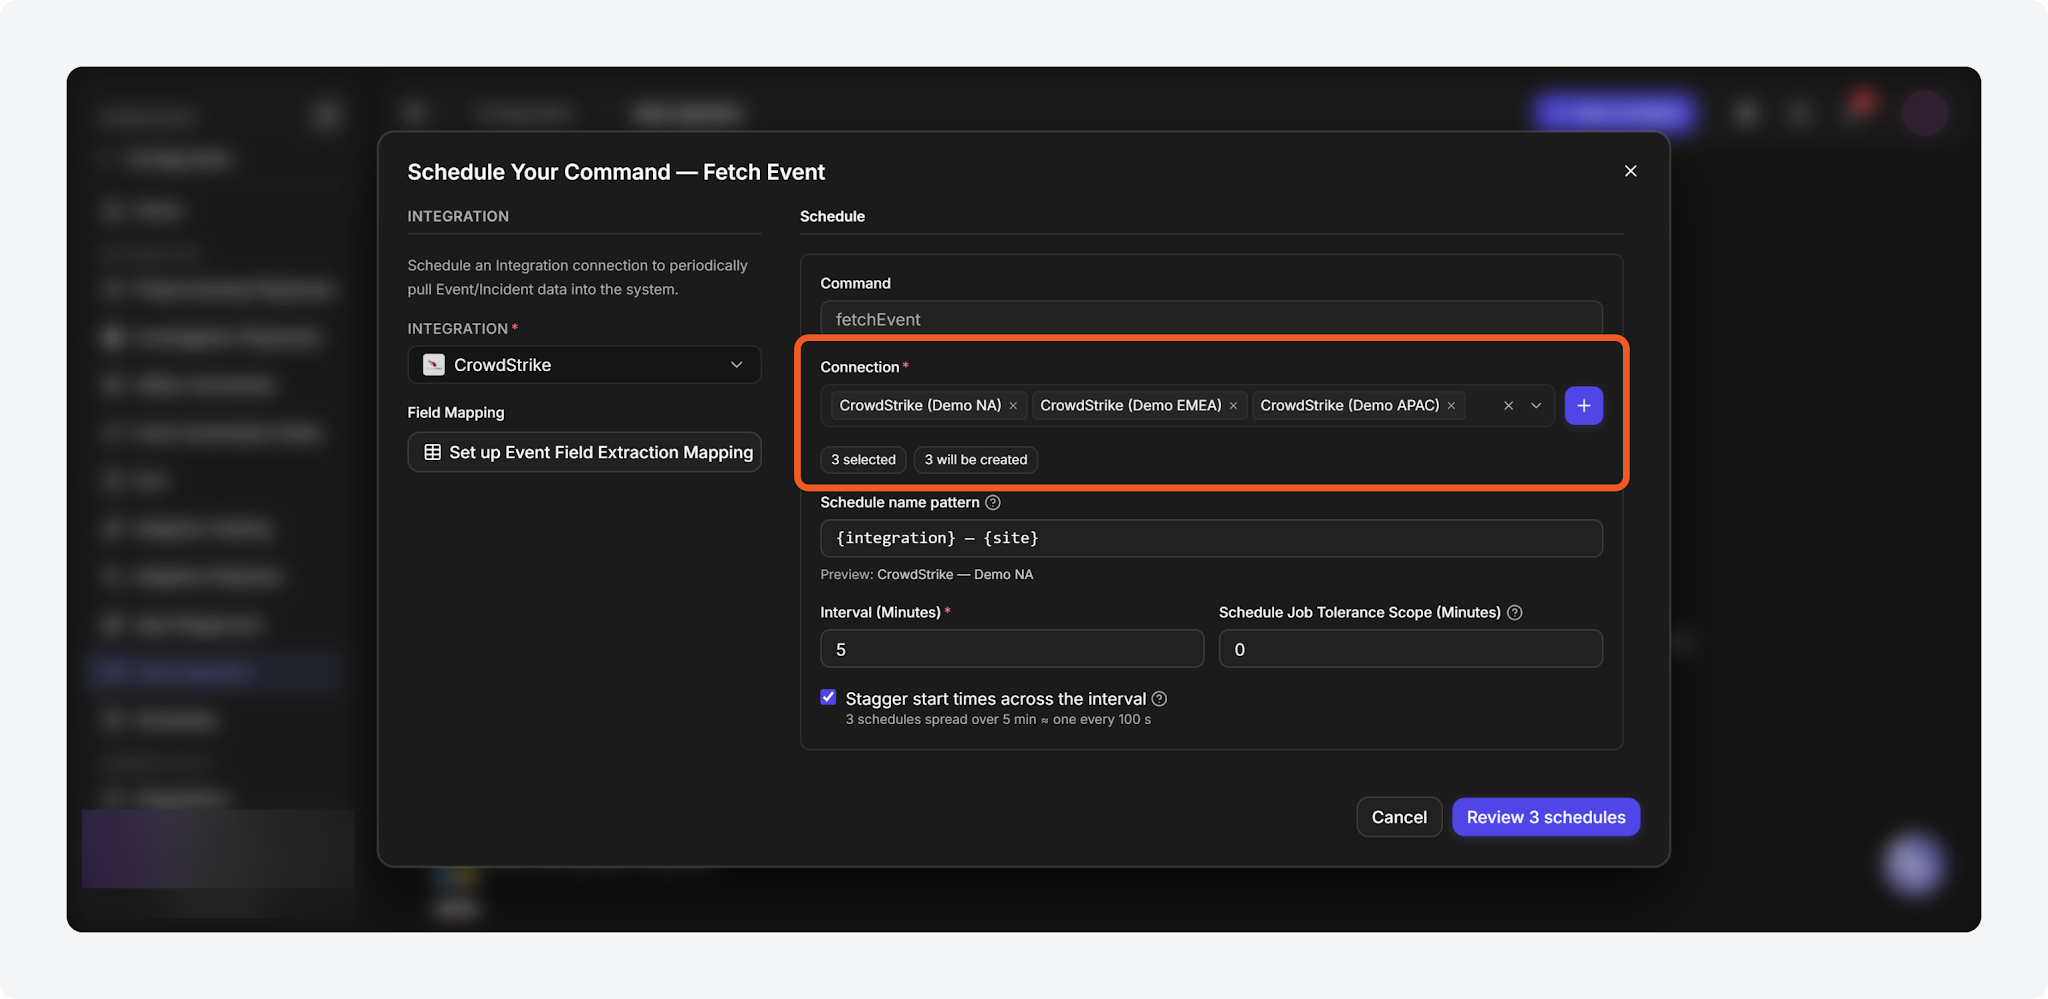
Schedule setup in Configuration > Automation > Data Ingestion now accepts multiple connections in the new UI, creating one schedule per selected connection. Administrators can name the batch from a pattern and set an Attack Path Discovery (APD) default that individual rows override. This removes the need to repeat the form for every site and to enable APD on each schedule separately. Selecting one connection leaves the setup unchanged, except that APD can now be enabled during creation rather than only after saving.
Utility Commands
New Commands
The following utility commands have been added to this release.
|
Commands |
Functionality |
|---|---|
|
Get APD Result by Incident Number |
Returns an incident's full Attack Path Discovery (APD) result as a single JSON object from its incident number. Playbook authors no longer bind five separate data-source paths to assemble it. The Included Sections input limits the result to named sections: Summary, AttackTimeline, QueryLog, QueryLogFull, RemediationTimeline, Graph, Narrative, Artifacts, Notes, and EventReports. QueryLogFull is returned only when named explicitly. An unrecognized section name is reported without failing the call. |
|
Get APD Result by Event ID |
Returns the Attack Path Discovery result for a specified event: the investigation report, the run status, and the incident the event was escalated into, if any. Because it is keyed by event rather than incident number, results can be retrieved for events that were never escalated. An optional parameter limits the response to specific sections. |
Updated Commands
The following utility commands were updated in this release.
|
Commands |
Changes |
|---|---|
|
Publish Playbook to Sites |
Renamed from Publish Live Playbooks across Sites and given an optional Submit Draft to Live input. Setting it to True makes the playbook's open draft live, exactly as the editor's Submit button does, and publishes that new version in the same run. An onboarding playbook no longer stops for a manual submit. The input defaults to False and is ignored when Action is Remove. |