.png)
16.1
Global User Indicator
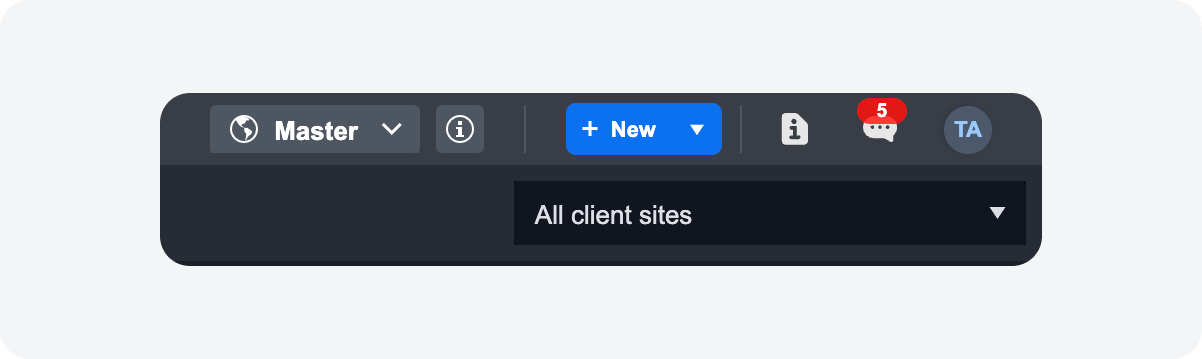
The user icon in the upper right corner has been replaced with an icon that indicates the user's initials. This provides a convenient reference point for administrators who are managing multiple accounts, roles, and sites, allowing them to quickly identify the logged-in user.
Reporting Dashboard Enhancement
Drill Down Details Popup
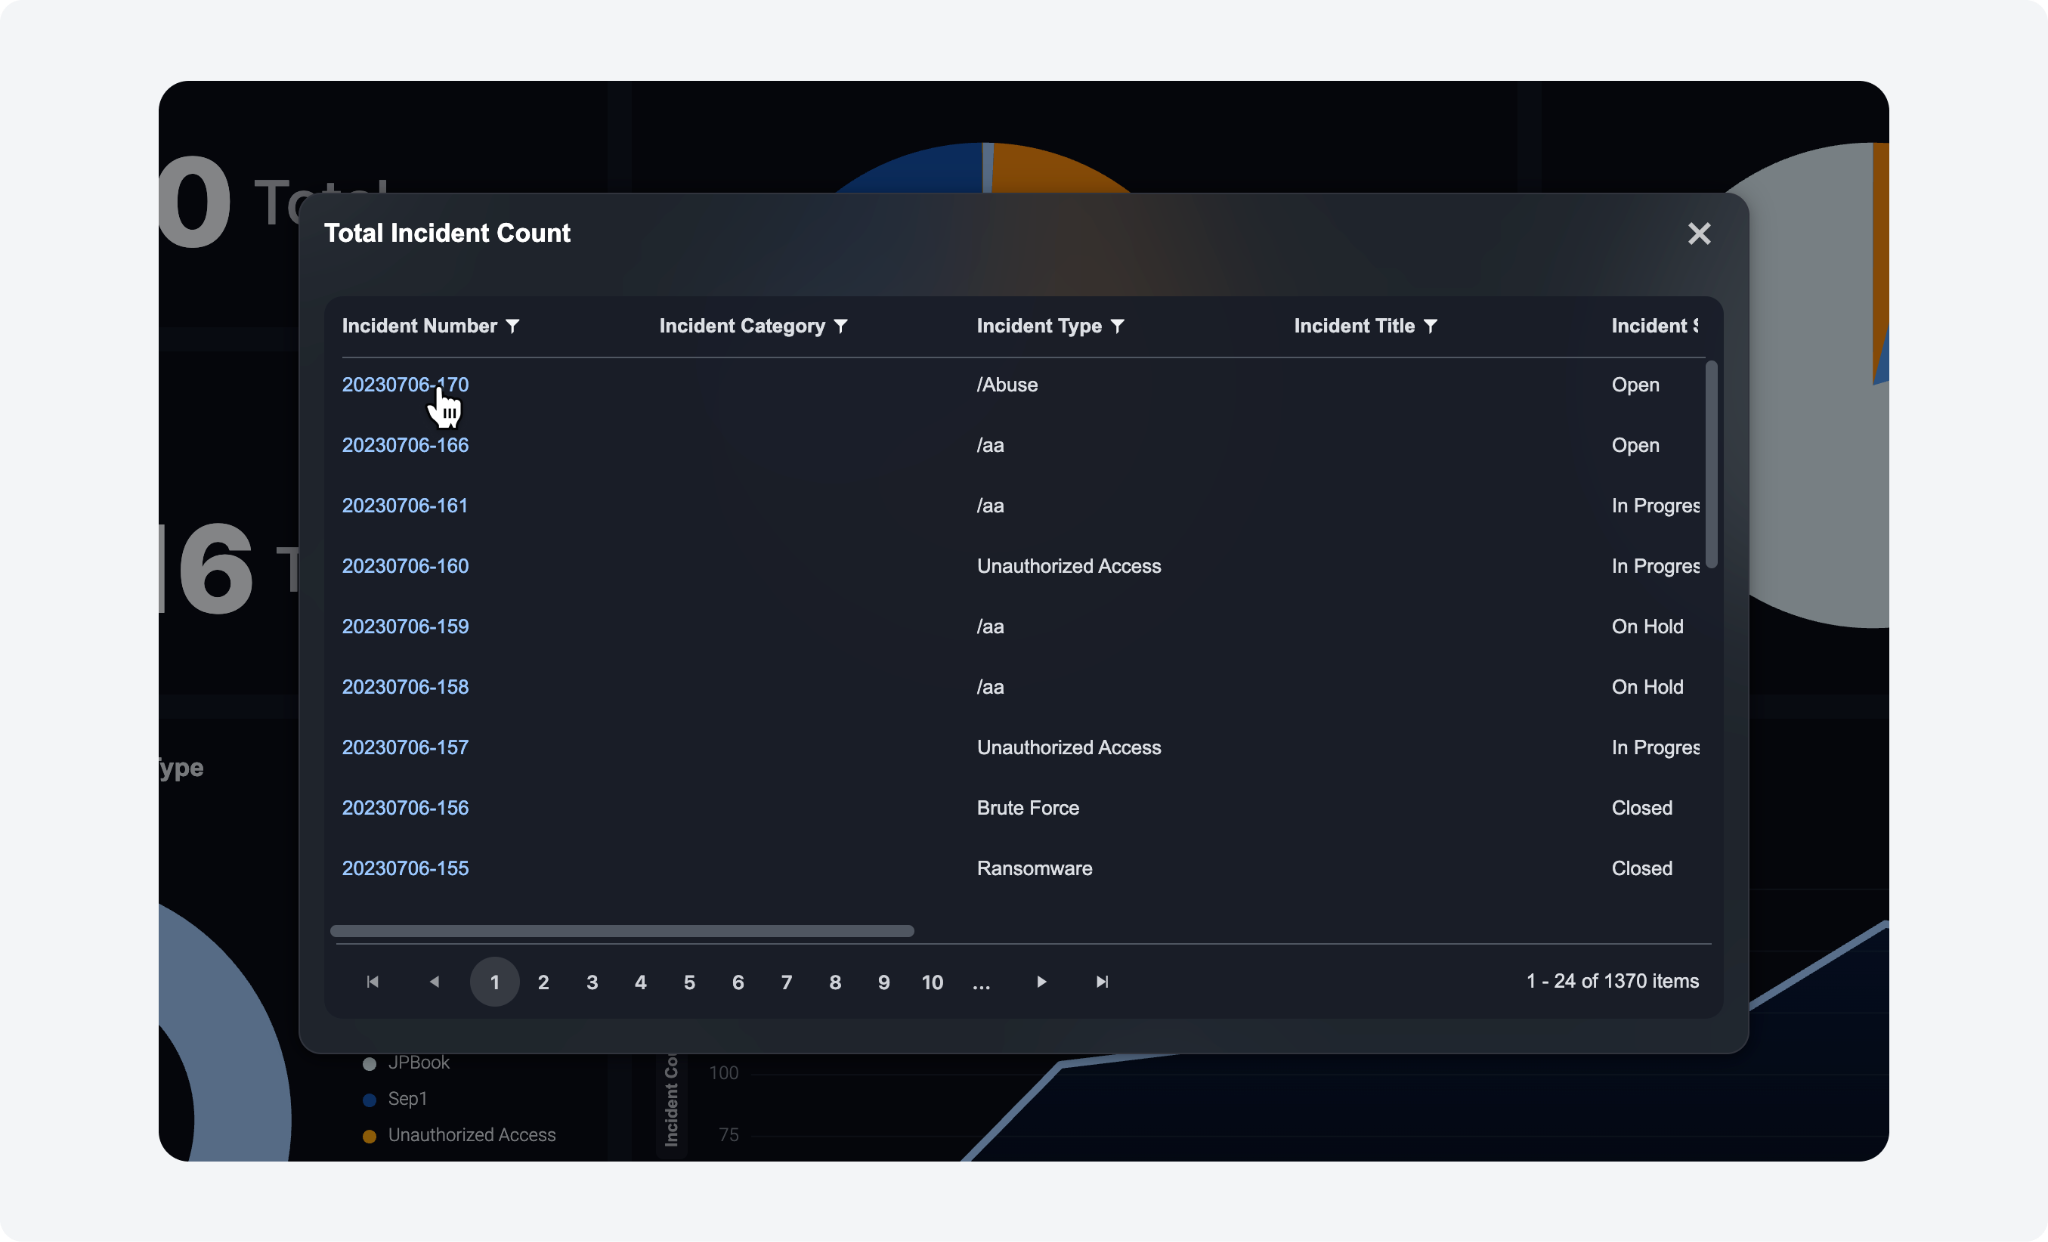
We have improved the widget details viewing experience in the Reporting Dashboard module. Instead of being redirected to a new page, a popup now appears with additional details when clicking into a widget. This change ensures a smoother workflow and eliminates the need to leave the dashboard module.
Investigation Dashboard Enhancement
New Column for Events: Event Playbook
A new column has been added to the events dashboard to provide visibility into the specific event playbook applied to each event, streamlining event management and enabling improved incident analysis for more effective security response and compliance auditing.
Incident Workspace Enhancement
Editing History for Incident Notes
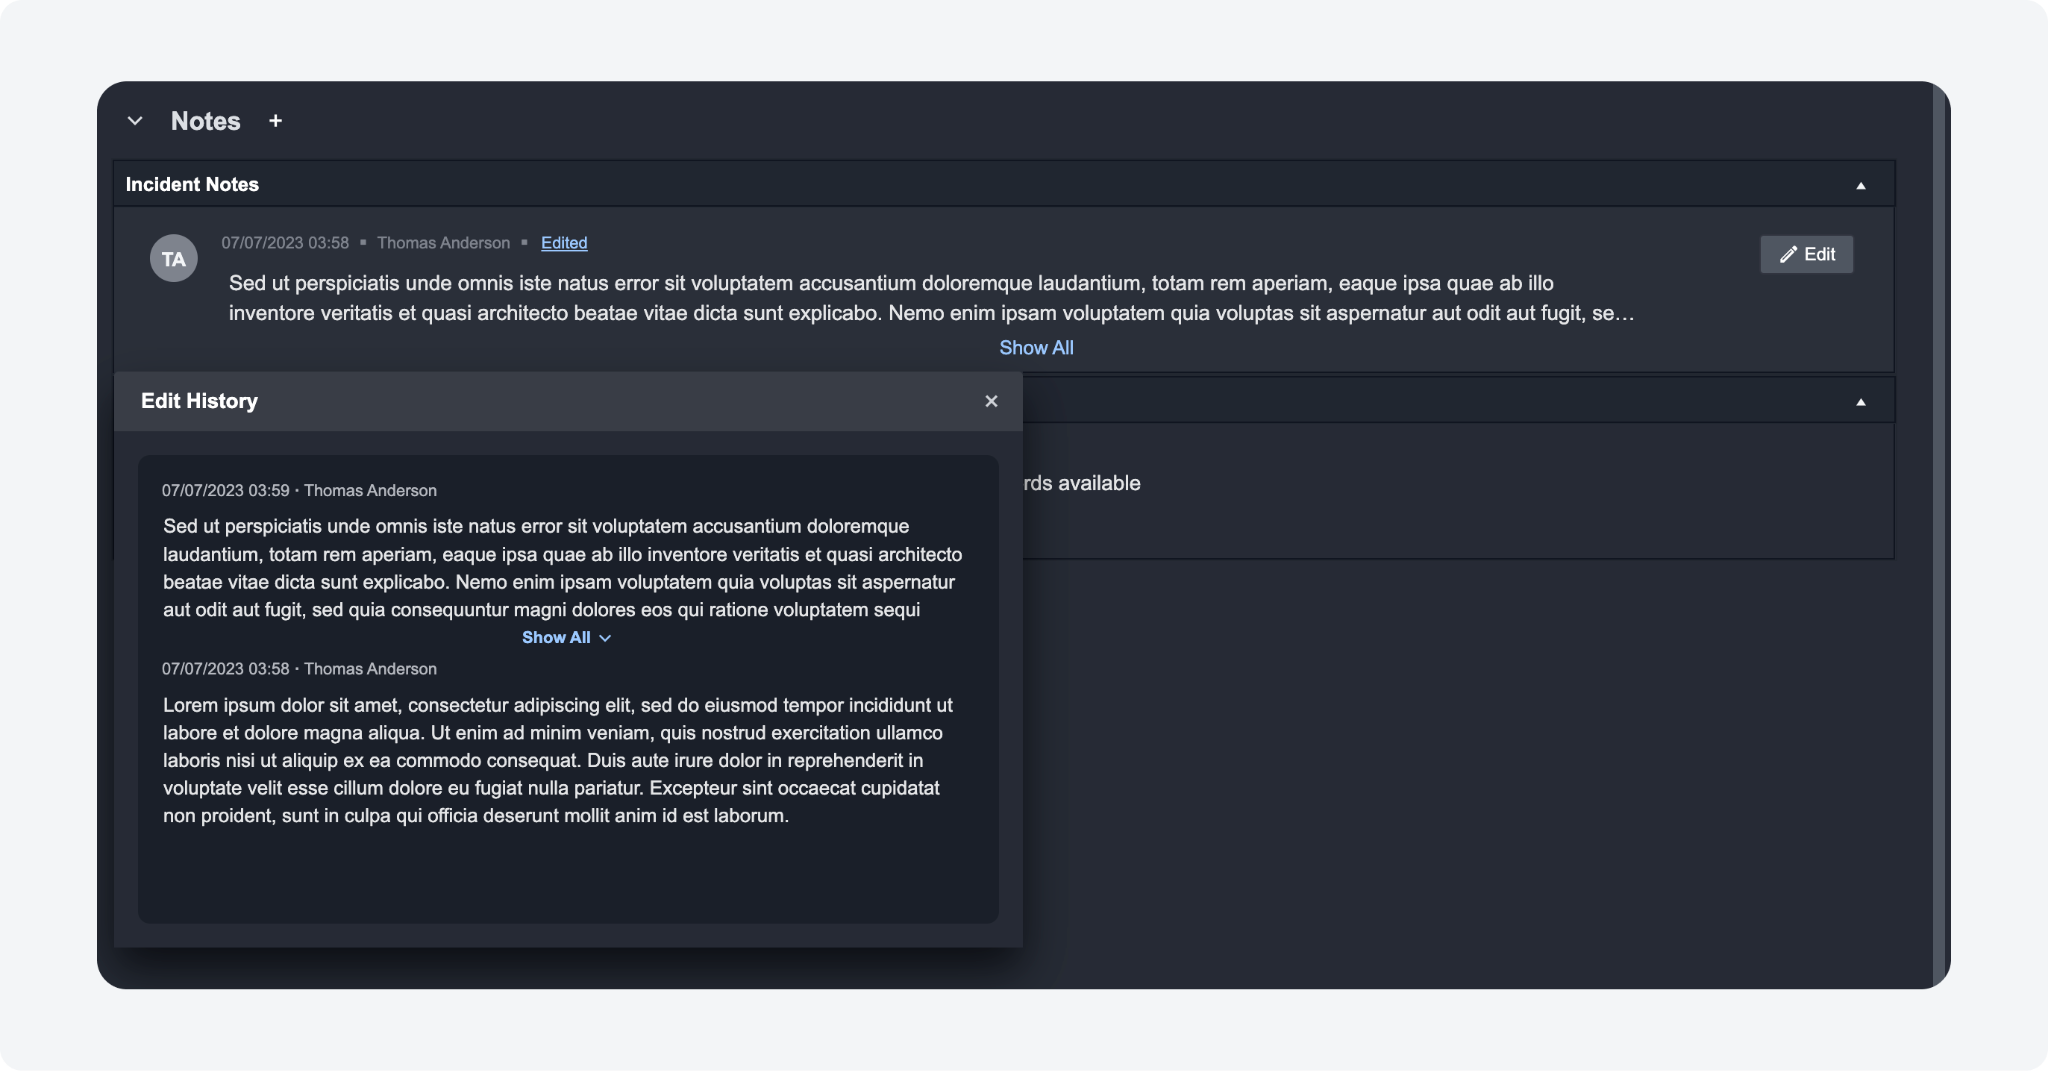
The Notes section in the Overview Tab has been enhanced to include a comprehensive edit history for incident notes. Whenever a note is edited, an "Edited" link will be displayed, allowing you to access the complete edit history with a single click. Additionally, the incident note edit history is also viewable in the incident's Command Centre.
This serves to enhance accountability, collaboration, and documentation by effectively tracking and displaying all modifications made to incident notes. It facilitates auditing processes, ensuring transparency and thoroughness in recording and reviewing changes.
New Column for the Events Tab: Event Playbook
A new column has been added to the Events Tab to provide visibility into the specific event playbook applied to the incident's events.
Collapsible Sections in Overview Tab
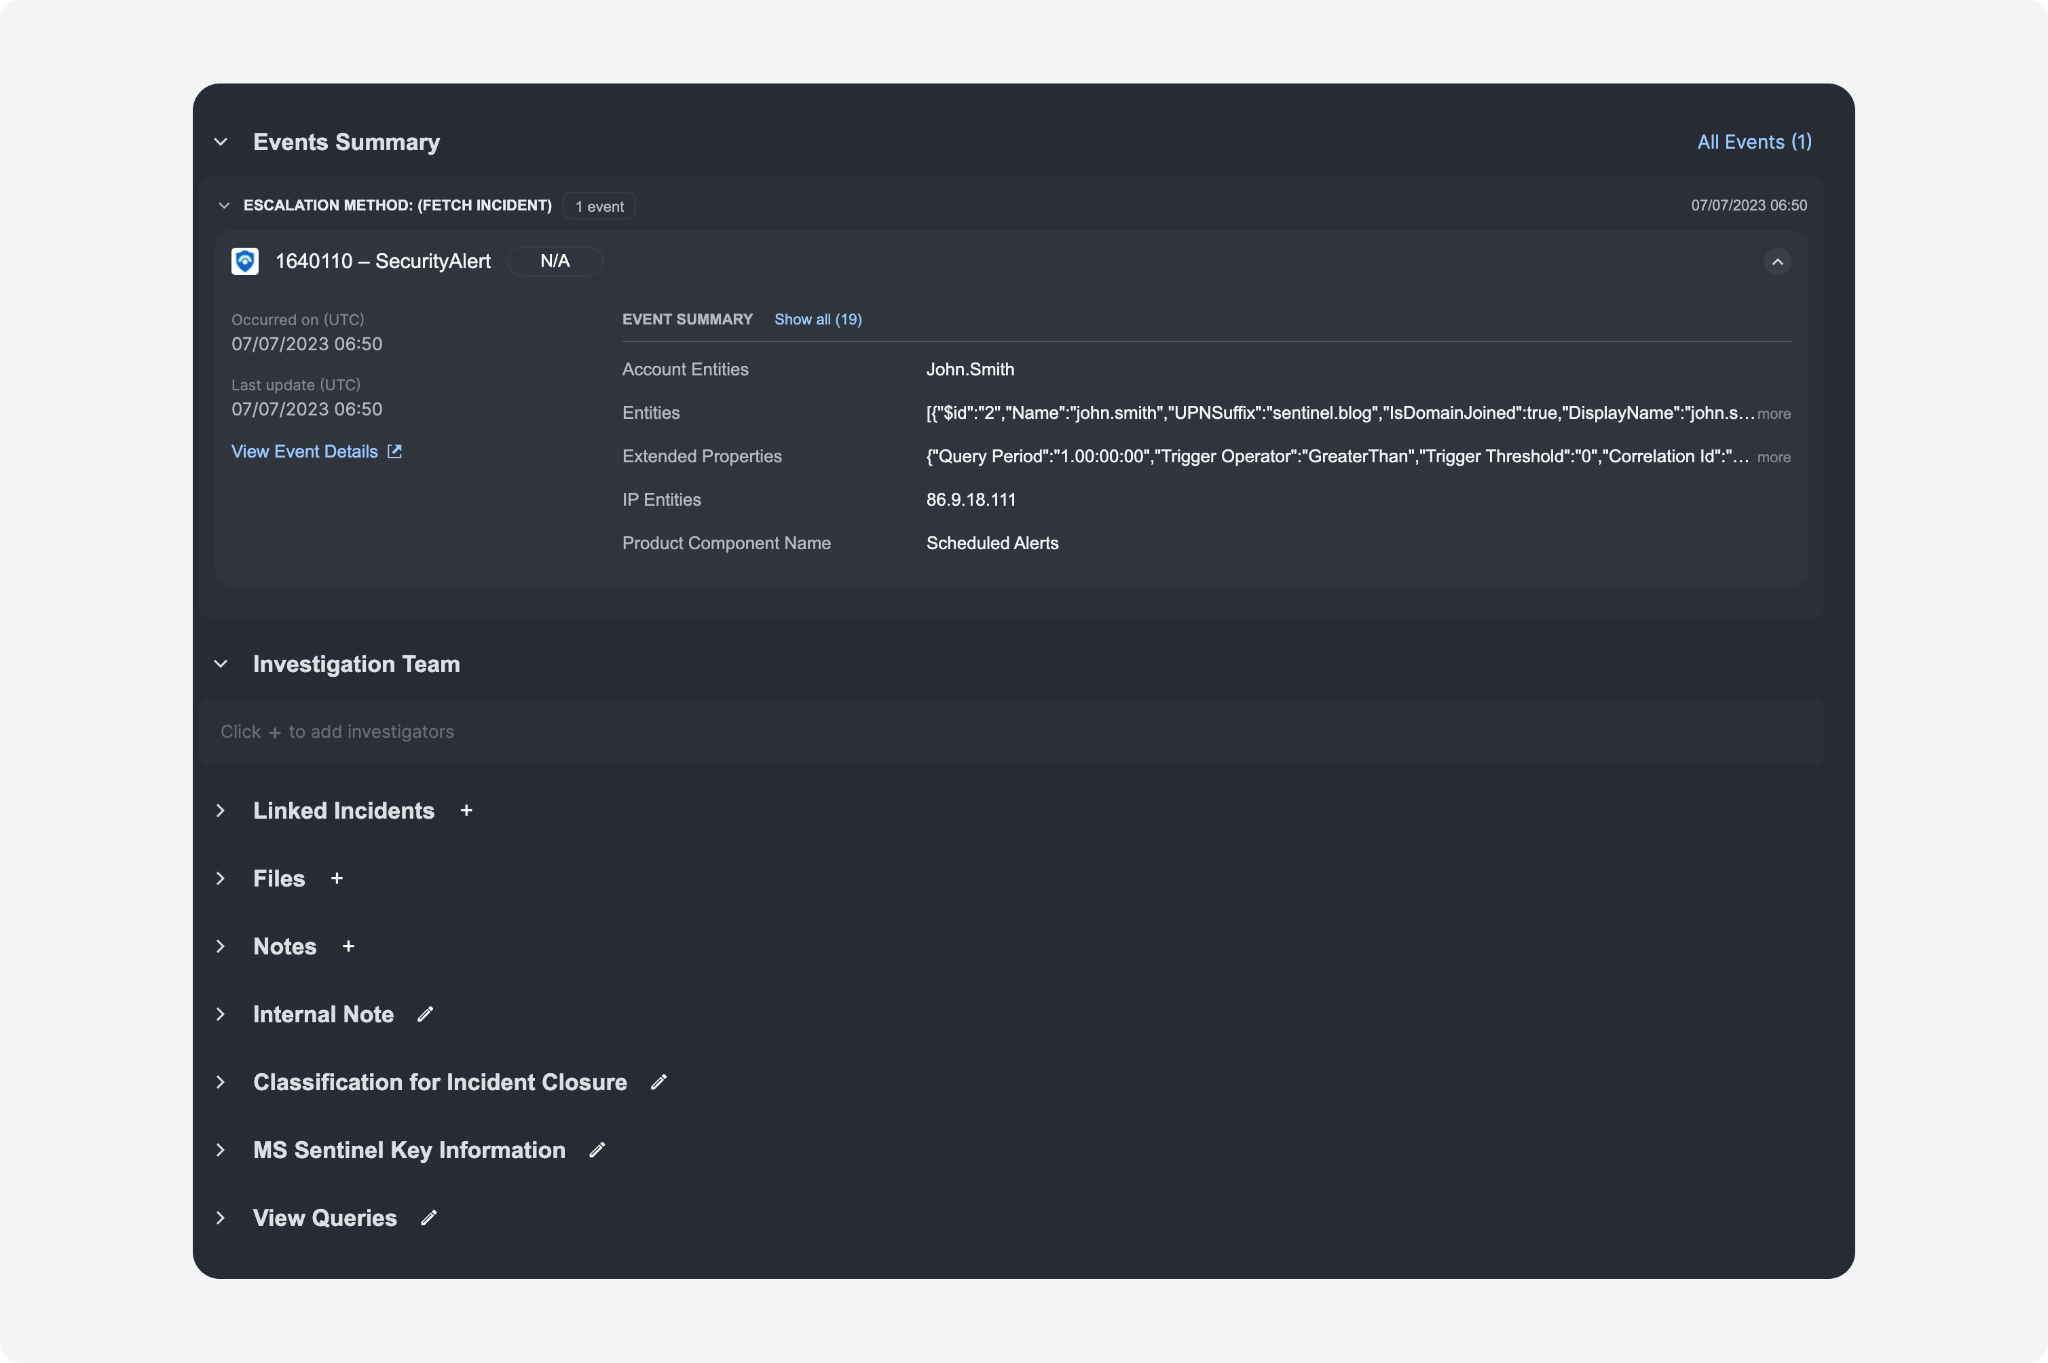
In the Overview Tab, the Events Summary, Investigation Team, Linked Incidents, Files, Notes, and custom incident form sections are collapsible. Sections are collapsed by default if they contain no data.
Data Ingestion

New Additional Settings for Webhook: JSON Path and Global List for Site Mapping (Shared to All Client Sites)
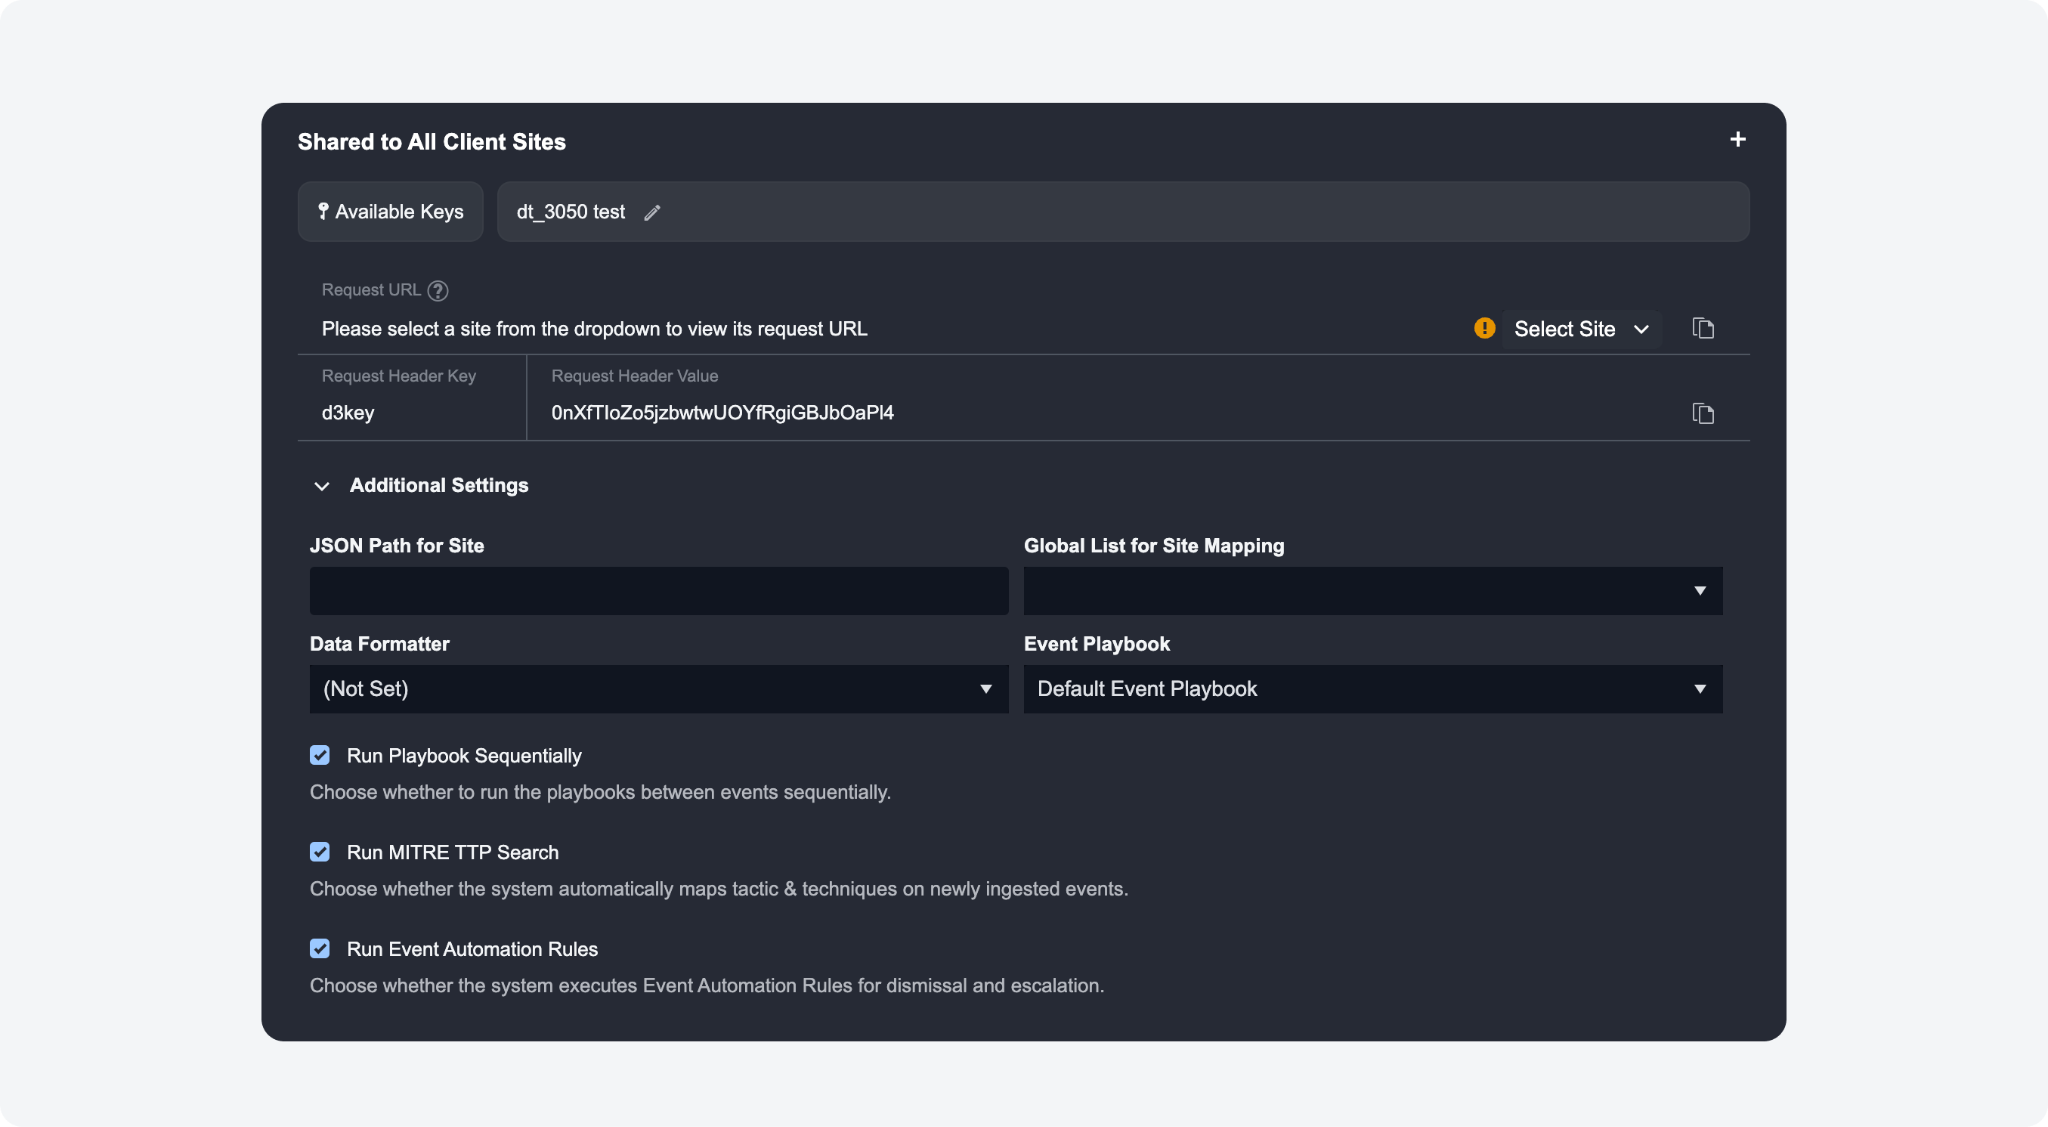
Two parameters under Additional Settings have been added for webhook data ingestion under Shared to All Client Sites:
JSON Path for Site: An optional parameter that allows you to specify the JSON path containing site information in the retrieved data. By specifying the JSON path, you can directly extract the site name or ID from the retrieved data.
Global List for Site Mapping: An optional parameter that works in conjunction with the JSON Path for Site parameter. It selects a global list that maps field values from the JSON path to their corresponding site names. Based on the specified global list, data is ingested into the correct site by matching the extracted value from the JSON path with the appropriate site name.
For Managed Service Providers (MSSPs) managing multiple client sites, these settings can offer some key benefits:
Streamlined Management: MSSPs can manage all client sites with a single webhook URL, reducing setup complexity.
Efficient Data Handling: With global list site mapping, data is automatically segregated and ingested into the correct site, increasing efficiency and reducing errors.
Reduced Maintenance and Enhanced Scalability: Fewer webhook URLs means less maintenance, and adding new client sites as simple as updating the global list.
Improved Security: Automatic data ingestion mitigates the risk of data spillage between client sites.
New Additional Setting for Schedule: Schedule Job Tolerance (Minutes)
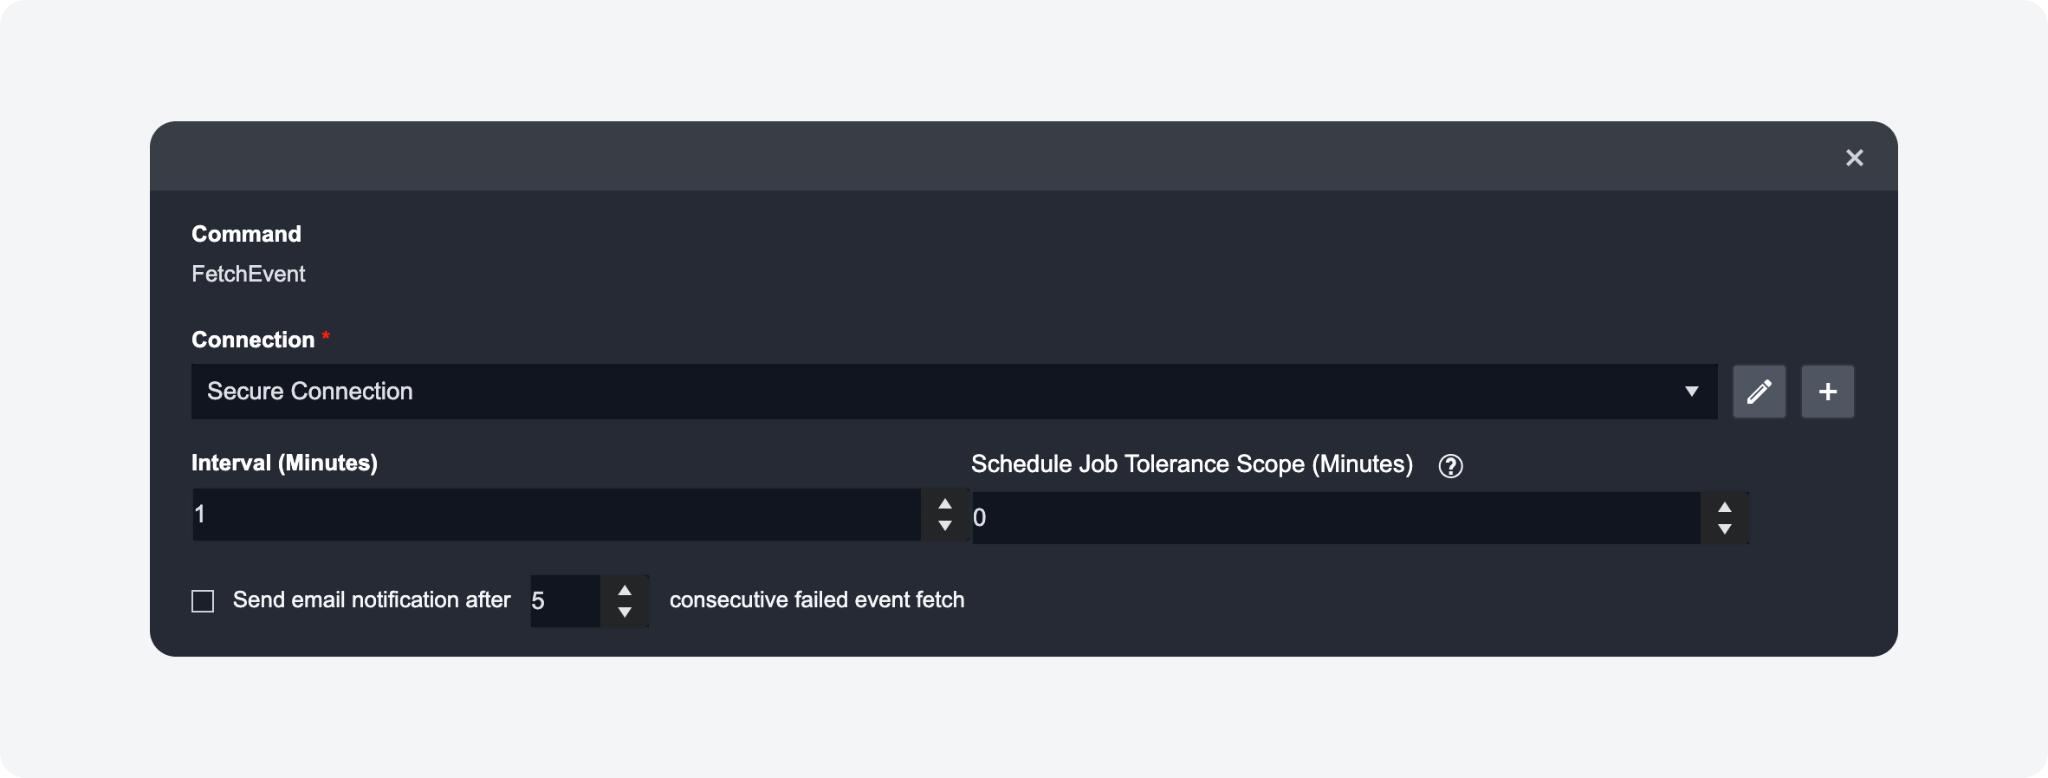
The Schedule Job Tolerance Scope parameter has been added to the data ingestion schedule configuration page. This sets how many minutes data can be ingested before or after the specified start and end time, so that no data is lost. The data will start being ingested from the time that is {Start Time - Tolerance Scope}. The schedule job tolerance scope is calculated separately and does not change any Tolerance Scope command parameters.
New Additional Setting for Schedule & Webhook: Run Playbook Sequentially
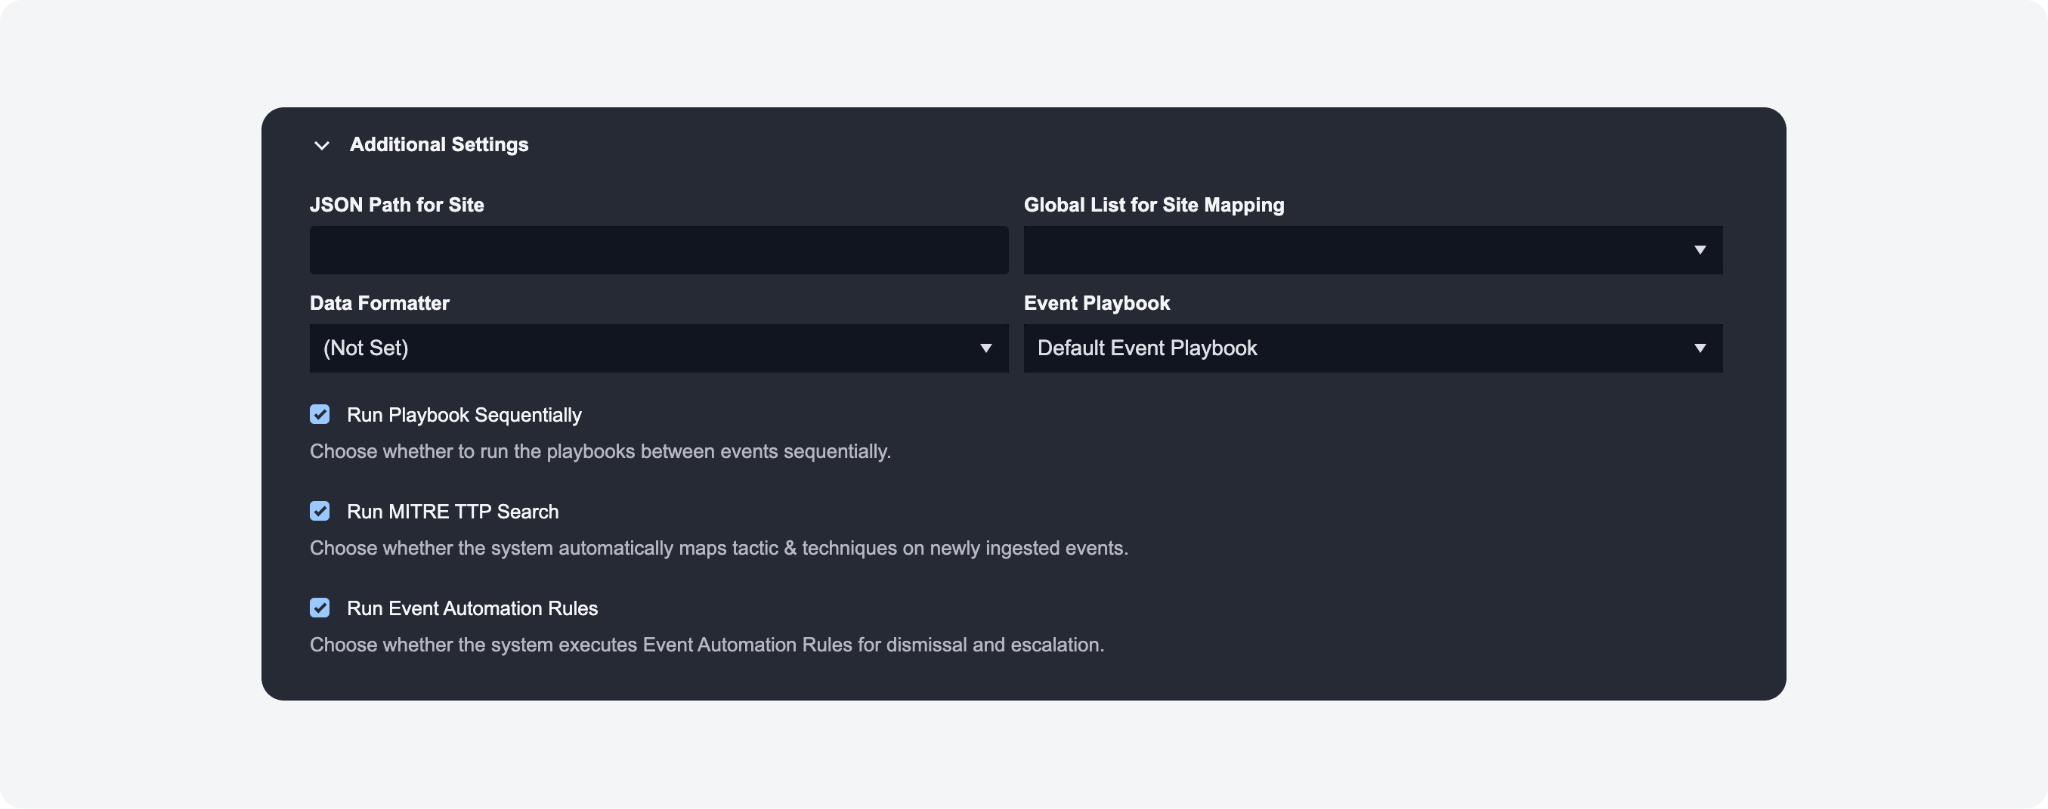
You can enable the Run Playbook Sequentially option if you select an event playbook in Additional Settings while setting up a data ingestion schedule or webhook. It enables the sequential processing of event playbooks for datasets containing multiple alerts. This enhances the correlation between events and incidents by ensuring that alerts are processed in a specific order, resulting in a more streamlined event and incident correlation process.
Playbook Editor Enhancement
Select Connection by Category
When setting up integration command connections, this newly added option is primarily intended for Managed Security Service Provider (MSSP) playbooks and D3's out-of-the-box playbooks. These often include a codeless playbook nested within them that contains parallel command tasks of different integrations from the same category, such as "Check IP Reputation".
The key function of this feature is to allow the playbook to execute only those parallel tasks that share a common connection name, contingent upon whether the integration for these tasks has a valid connection with the common name in your SOAR environment. Tasks without valid connections will remain in an "N/A" state and will not produce errors. This increases the playbook's adaptability and its capability to manage connections that are not available.
Additionally, the Dynamically Select Connection feature allows the insertion of additional Jinja logic to accommodate a variety of use cases. One typical example is the mapping of different client sites to distinct connection names.
Utility Command Enhancement

Link Artifacts Related Incidents
The Link Artifacts Related Incidents command has been redesigned with input parameters to let you fine tune the incident-artifact correlation logic. The configurable input parameters include:
Artifacts Types: You now have the ability to filter correlated artifacts based on specific artifact types.
Artifact Names: Correlate incidents using specific artifact names.
Incident Link Criteria: Decide how you'd like to link your artifacts - whether through partial or full matches based on specified criteria.
Incident Sites: Define the scope of your search for related incidents by specifying sites. The system will search within the list of sites you provide, whether they're internal or client-specific. If no specific sites are mentioned, the system defaults to searching where the incident occurred.
Incident Status: Filter your artifact correlations based on the status of the incidents. Options include Open, Closed, In Progress, and On Hold.
Incident Time Range: Define a time range to search for incidents, based on their creation date.
Limit: Set a limit on the number of linked incidents. If the limit is not specified or exceeds 50, the system will default to linking a maximum of 50 incidents that fit the specified criteria.
Order: Determine the order in which your incidents link - ascending or descending. By default, the system links incidents in descending order, starting with the most recent.
The utility command has multiple use cases. It can help identify and link incidents involving newly discovered threat artifacts, aiding in threat identification and enhancing cyber defense. It can also be used to connect incidents with similar threat artifacts, enabling more informed incident response strategies, and to identify recurring threats for proactive security measures.
Organization Management Enhancement

Roles: Edit Closed Incident Permission
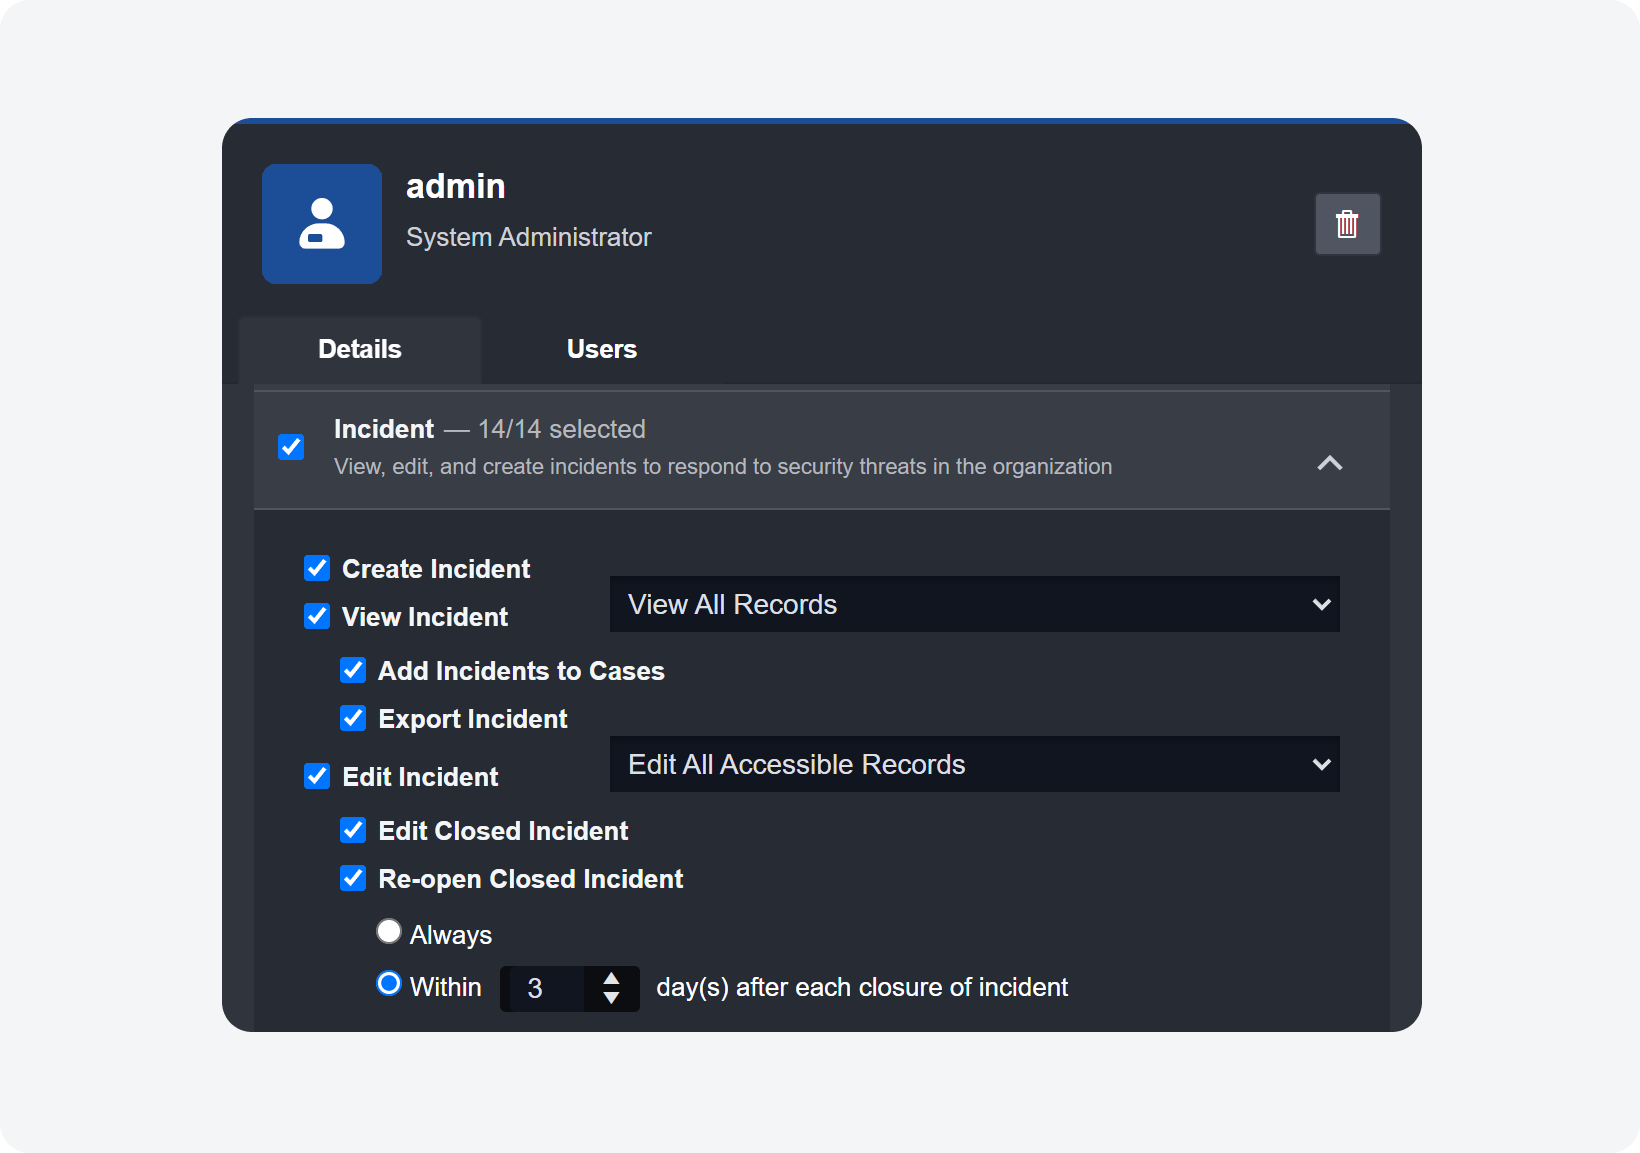
An option that allows you to set a time range for Re-open Closed Incident has been added under the Edit Incident permission settings when configuring Roles. System administrators have the option to choose between two settings when it comes to reopening closed incidents: "Always" or "Within a specified number of days after each closure of Incident".
Proxy Agent Update

We have released a new version of the proxy agent alongside D3 SOAR version 16.1. To ensure compatibility, please upgrade your proxy agent to version 16.1. For instructions on how to update a proxy agent, please refer to the Agent Management section in the user guide.
Integrations

New Integrations
The following integrations have been added to this release of D3 SOAR.
Integration Name | Description |
Devo Alerts | Devo SIEM is a cloud-based data logging and security analytics platform designed to improve access to security data across an enterprise. Security teams have access to real-time and historical data to quickly respond to their organization's threat landscape. This integration allows organizations to query and manage alerts as well as other data sources. |
EmailRep | EmailRep is a system of crawlers, scanners, and enrichment services that allow users to collect data on email addresses, domains, and internet personas. |
Updated Integrations
The following integrations have been updated in this release of D3 SOAR.
Integration Name | Changes |
Kaspersky | New commands: Get Execution File, Get Open Ports, List Execution Files, Scan Quarantines Files, Unquarantine Files List Host Tasks: Added the TaskNames key field |
Microsoft Purview Audit alert_v2 | This is an updated version of the Microsoft Purview Audit integration, incorporating all pre-existing commands. It is strongly recommended to use this enhanced version of the integration for optimal performance. Fetch Event: Updated to enable correlation between alertID and audit logs returned by the Management API. |
Microsoft Teams | New commands: List Chats, List Chat Messages, Send Chat Message |
MISP | New commands: Add Object To Events, Add Tags to Attributes, Add Tags to Events, Fetch Event, List Attribute Types & Categories, List Organizations, List Tags, Remove Tags From Attributes, Remove Tags From Events, Search Events, Search Object Templates, Search Tags, Test Connection Enhanced three checkReputation commands to the latest coding convention: Check IP Reputation, Check FileReputation, Check URL Reputation. Converted the following C# commands to Python: Add Event, Edit Event, Publish Event. Search Attributes: Updated the format of return data and enhanced error handling messaging. |
OpenCTI | New commands: Create Observable, List Authors, List External References, List Labels, List Markings |
Trend Micro Cloud One | New commands: Add Firewall Rules To Computers, Add Firewall Rules To Policies, Create Policy, List Policy Default Settings, Modify Policy, Remove Firewall Rules From Computers, Remove Firewall Rules From Policies, Search Computers, Search Firewall Rules, Search Policies |
Trend Micro Vision One | New command: Get Endpoint Info |
Deprecated Integration Commands
The following integration commands have been deprecated in this release of D3 SOAR.
Integration Name | Deprecated Commands |
Trend Micro Cloud One | Add Domains To Permit List Create Domain Filter Configuration Distribute Permit List And Domain Filter To Appliances List Domain Policy Configurations Remove Domains From Permit List Update Domain FilterConfigStatus |
Updated Integrations
The following integrations have been updated in this release of D3 SOAR.
Integration Name | Changes |
Twilio | Added new command “List SMS Messages” |
Kaspersky Security Centre | New Commands “Get user by source IP”, “Get Host Status” |
Azure AD | “List Users” command enhancement |
Microsoft Teams | Adaptive Card Enhancement |
Microsoft 365 Defender | Fetch Incident Enhancement |
16.1.77.0
Release date: 2023-07-24
Updated Integrations
The following integrations have been updated in this release of D3 SOAR.
Integration Name | Changes |
SentinelOne | Added new functionalities: Create a Power Query And Get QueryID Ping a Power Query If Results Haven't Been Retrieved |
Fortigate | Command enhancement for BlockIP and BlockURL |
JIRA | Fetch Event Command Enhancement: Add field for comments |
Cisco ESA | Added new commands: Fetch Event Block domain Block email ID |
16.1.80.0
Release date: 2023-07-25