
17.6.16
New Features
Service Level Agreement (SLA) Module
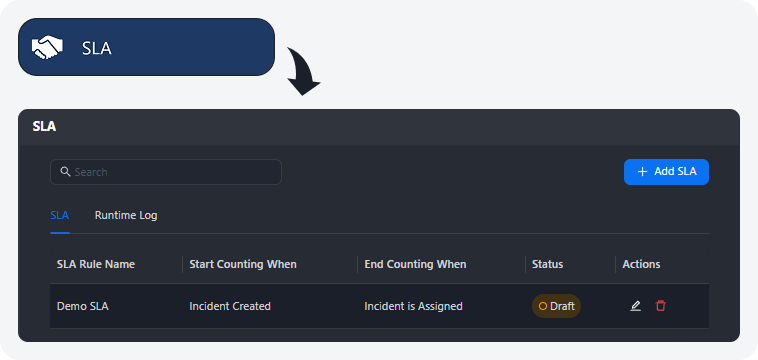
An SLA module has been introduced to enable users to define, enforce, and monitor incident response service-level commitments. Users can now configure SLA timers, fine-tune time goals, and set up automatic pre-breach and post-breach playbook workflows.
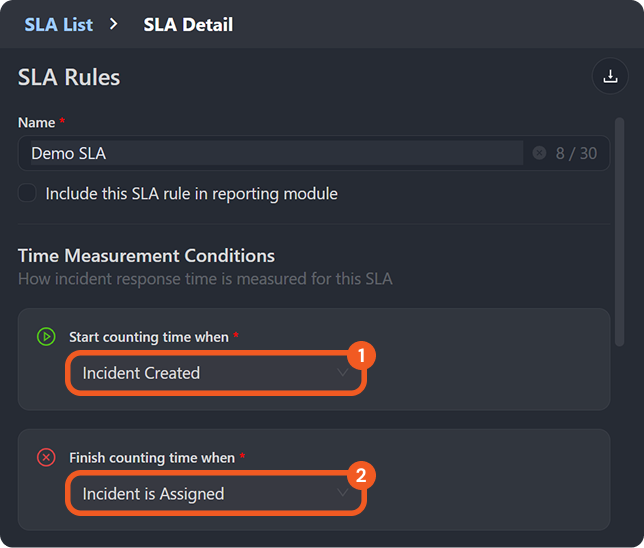
Configure the SLA timer start condition.
In this example, the SLA timer for the Demo SLA rule starts when an incident is created. The rule, however, applies only if the conditions defined in step 4 are also met.Configure the SLA timer end condition.
In this example, the SLA timer for the Demo SLA rule ends when the incident is assigned to a D3 user.
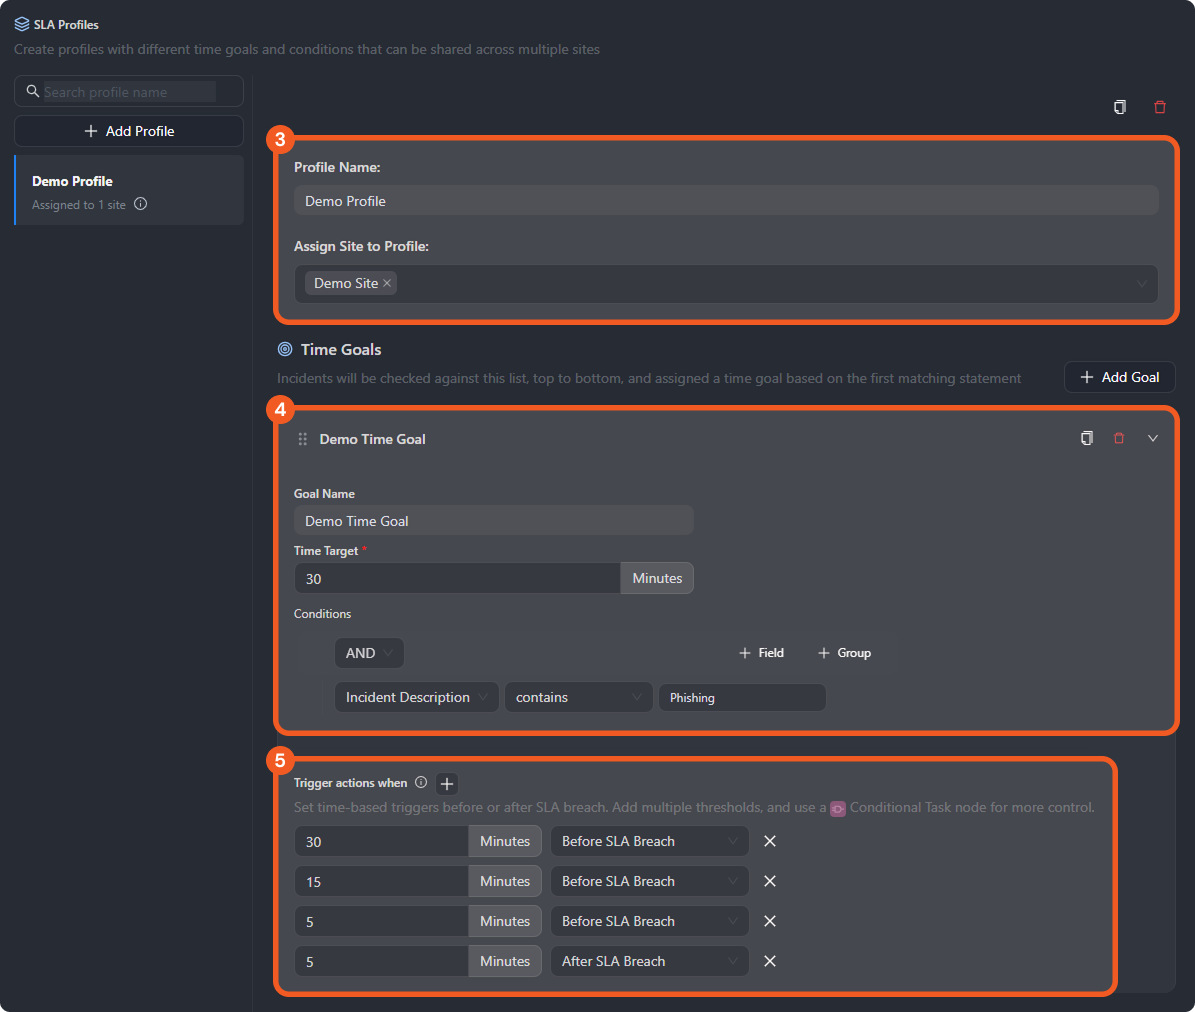
Create an SLA profile.
An SLA profile limits where an SLA rule can apply by restricting it to incidents from specific sites.Configure time target for the SLA and optional rule-matching conditions.
Both the conditions defined here and the SLA timer start condition must be fulfilled for the SLA rule to apply to an incident.Define SLA trigger points.
The thresholds configured in this step trigger the automation workflows built in step 6.
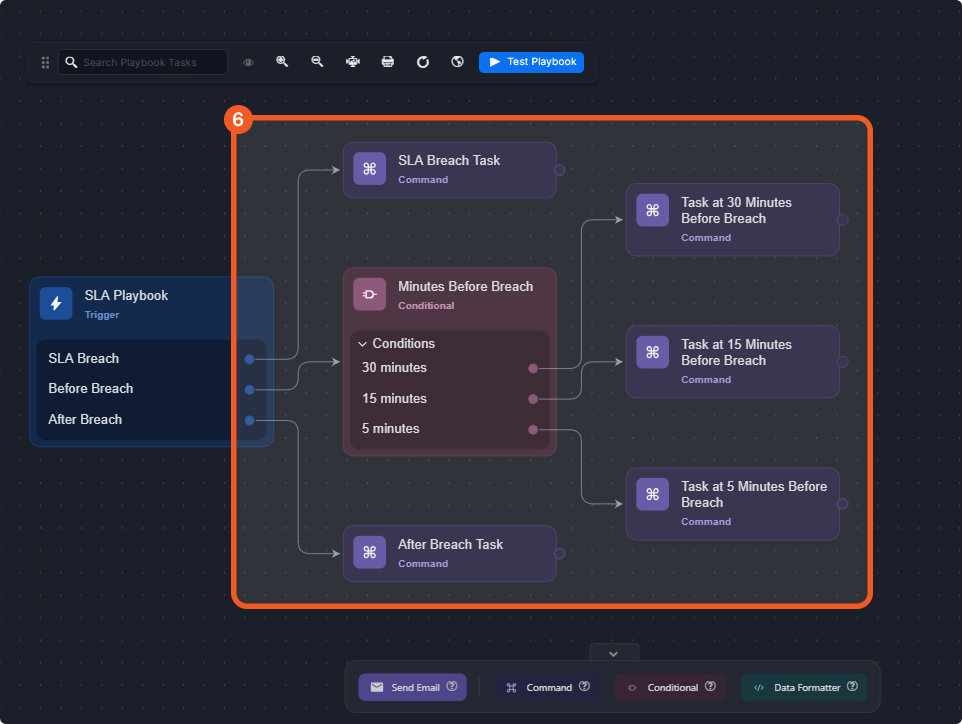
Build automated SLA playbook workflows.
Add task nodes to the relevant SLA playbook trigger branches to automatically execute custom logic when the trigger points configured in step 5 occur.
-20260305-234736.png?inst-v=c16d82f1-7756-4a58-989a-5e5603d47df0)
Within the Runtime Log tab, users can view runtime details of incidents that matched a live SLA rule. These include SLA status, playbook runtimes, actual start and end times, planned end time, and elapsed time against the defined SLA goal.
Incident Dashboard SLA Rule Columns
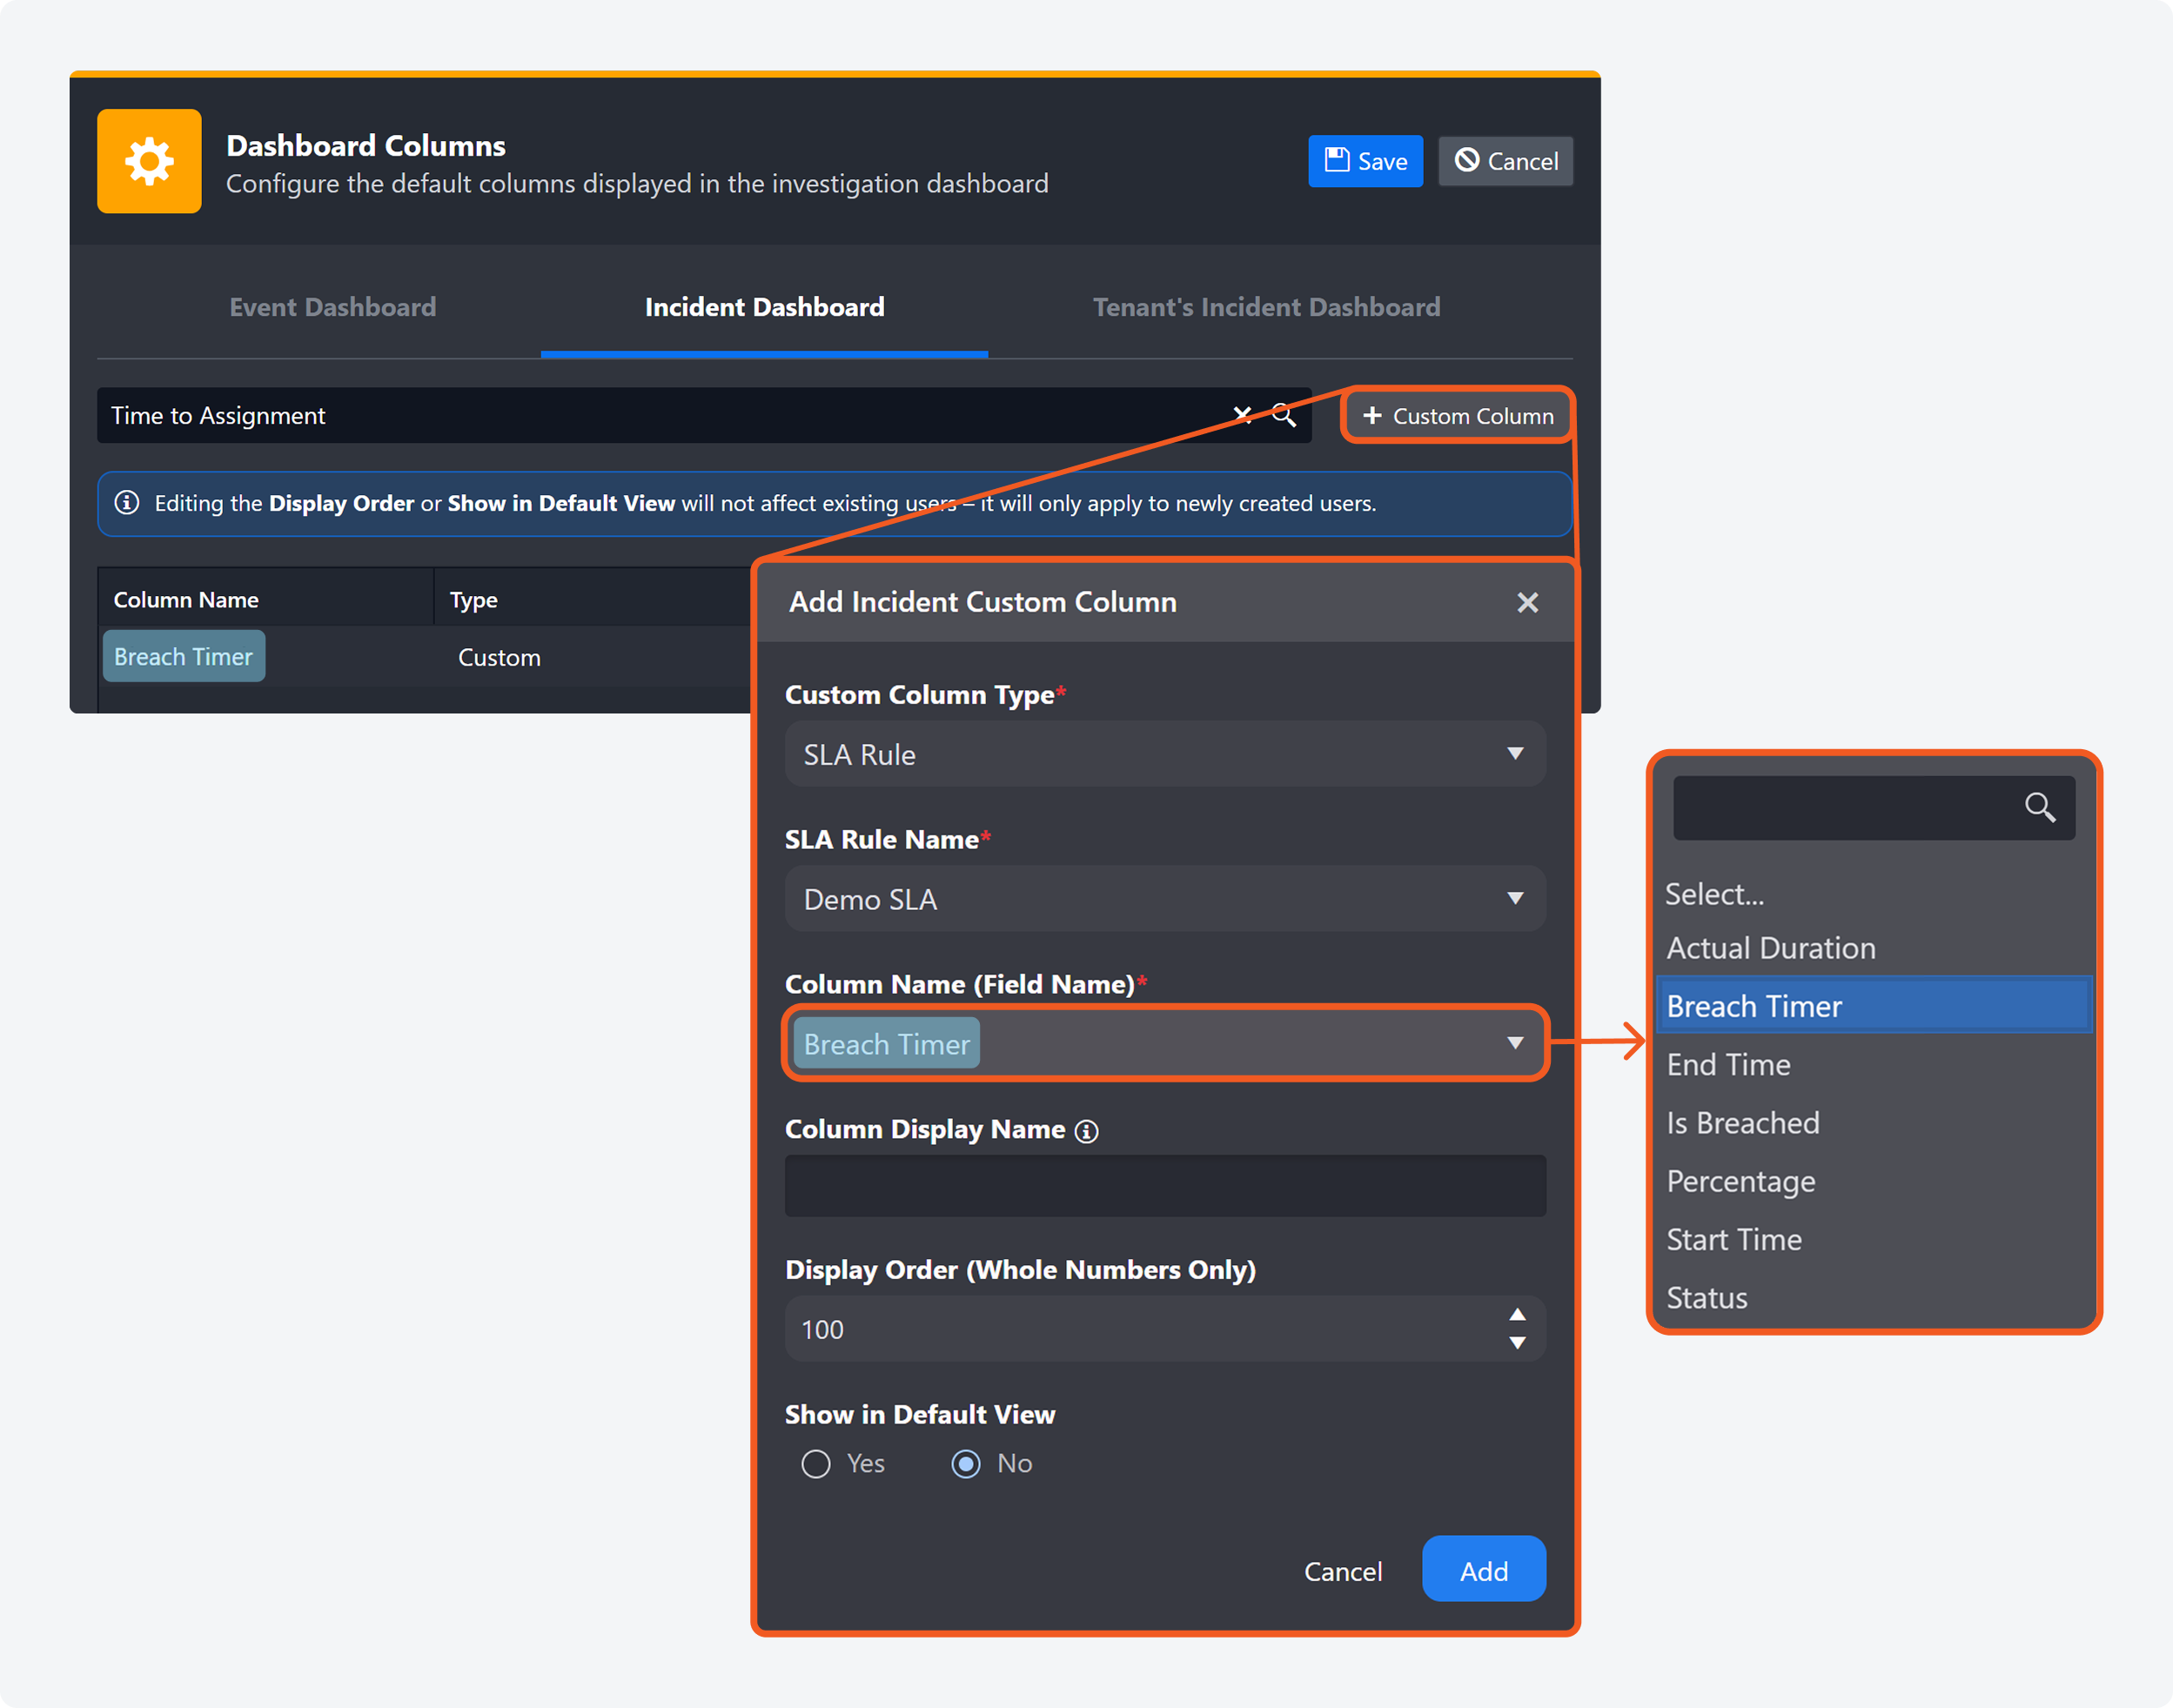
The Application Settings > Dashboard Columns module now supports the SLA Rule custom column type for the incident dashboard, allowing administrators to display SLA-related metrics. Once configured, these custom columns can be displayed in the corresponding sites within the Investigation Dashboard > Incidents module.
SLA Rule custom columns can be displayed (or hidden) in the same way as other columns.
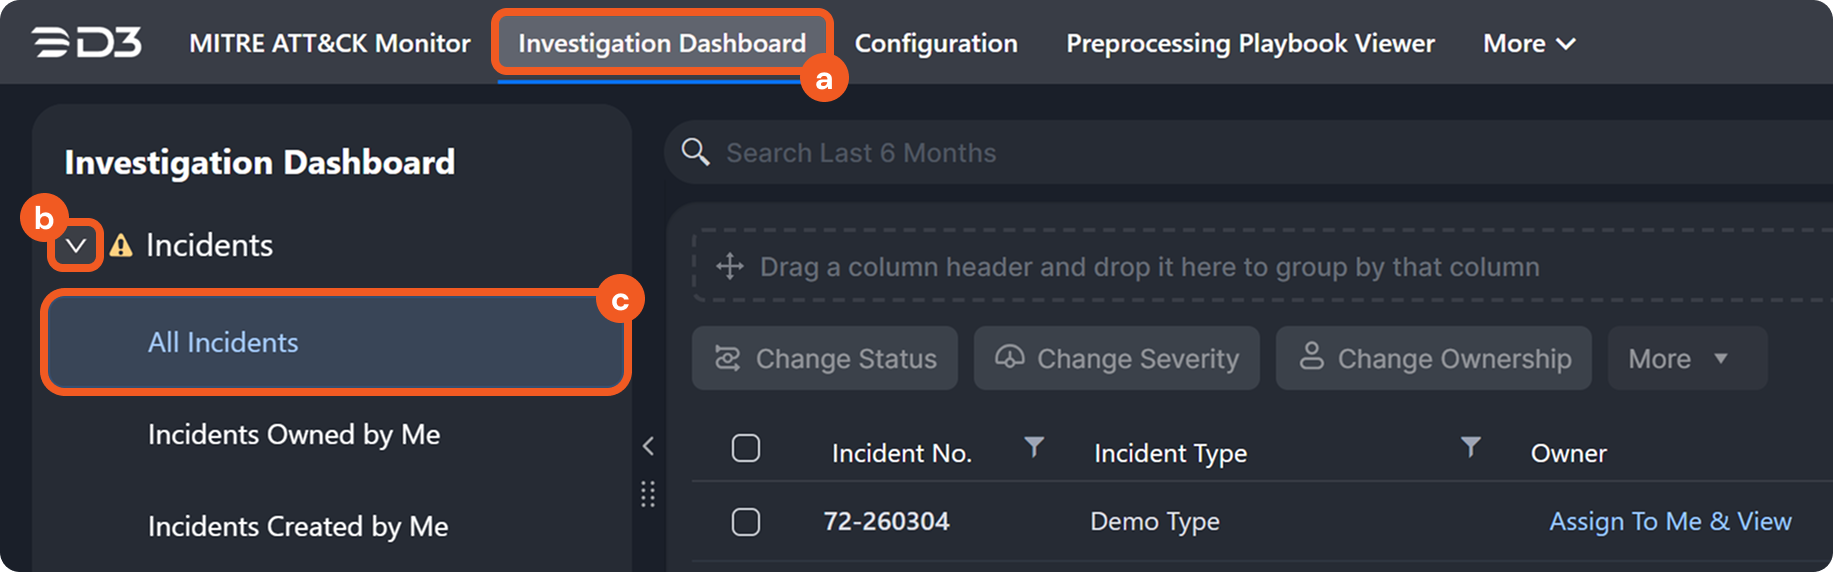
Navigate to the Investigation Dashboard > Incidents > All Incidents module.
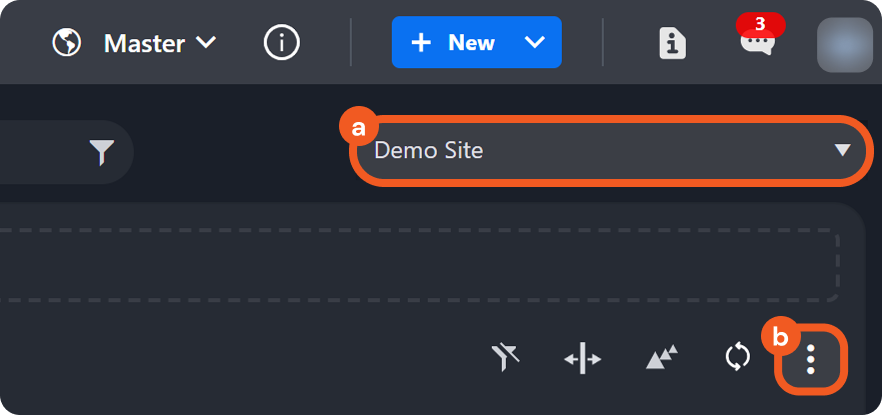
Select the relevant site, then click on the … icon.
Select the desired custom column.
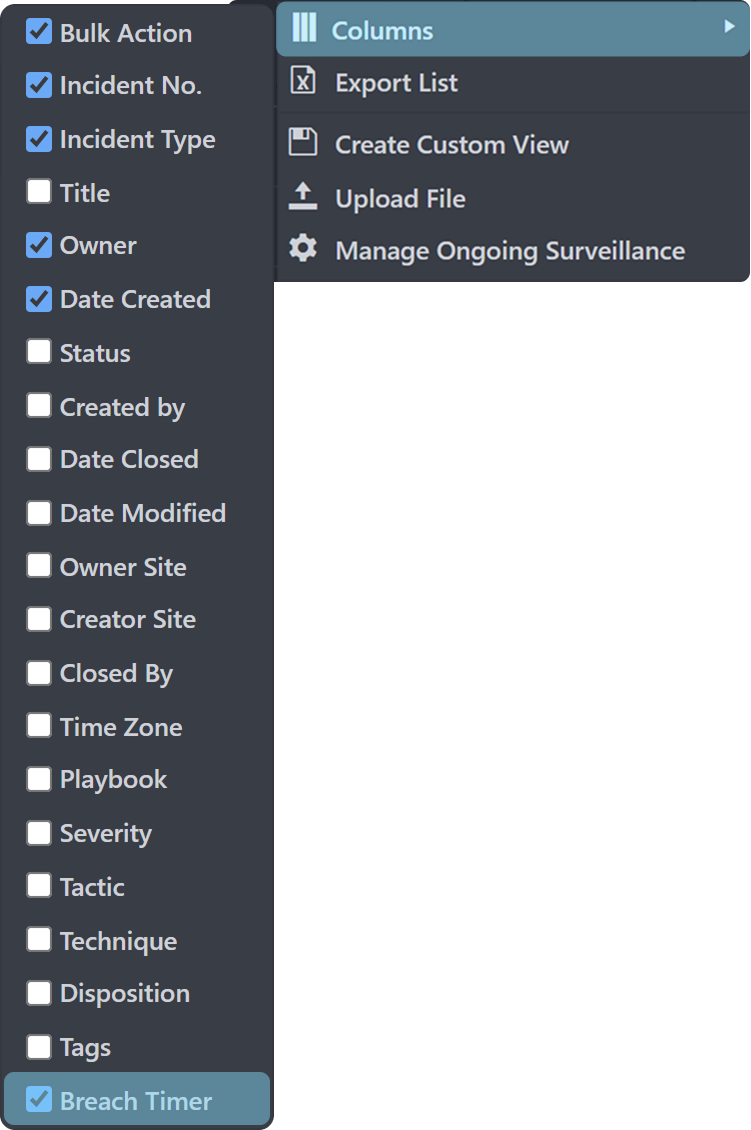
Verify that the column is displayed.

OAuth 2 Webhook Authentication
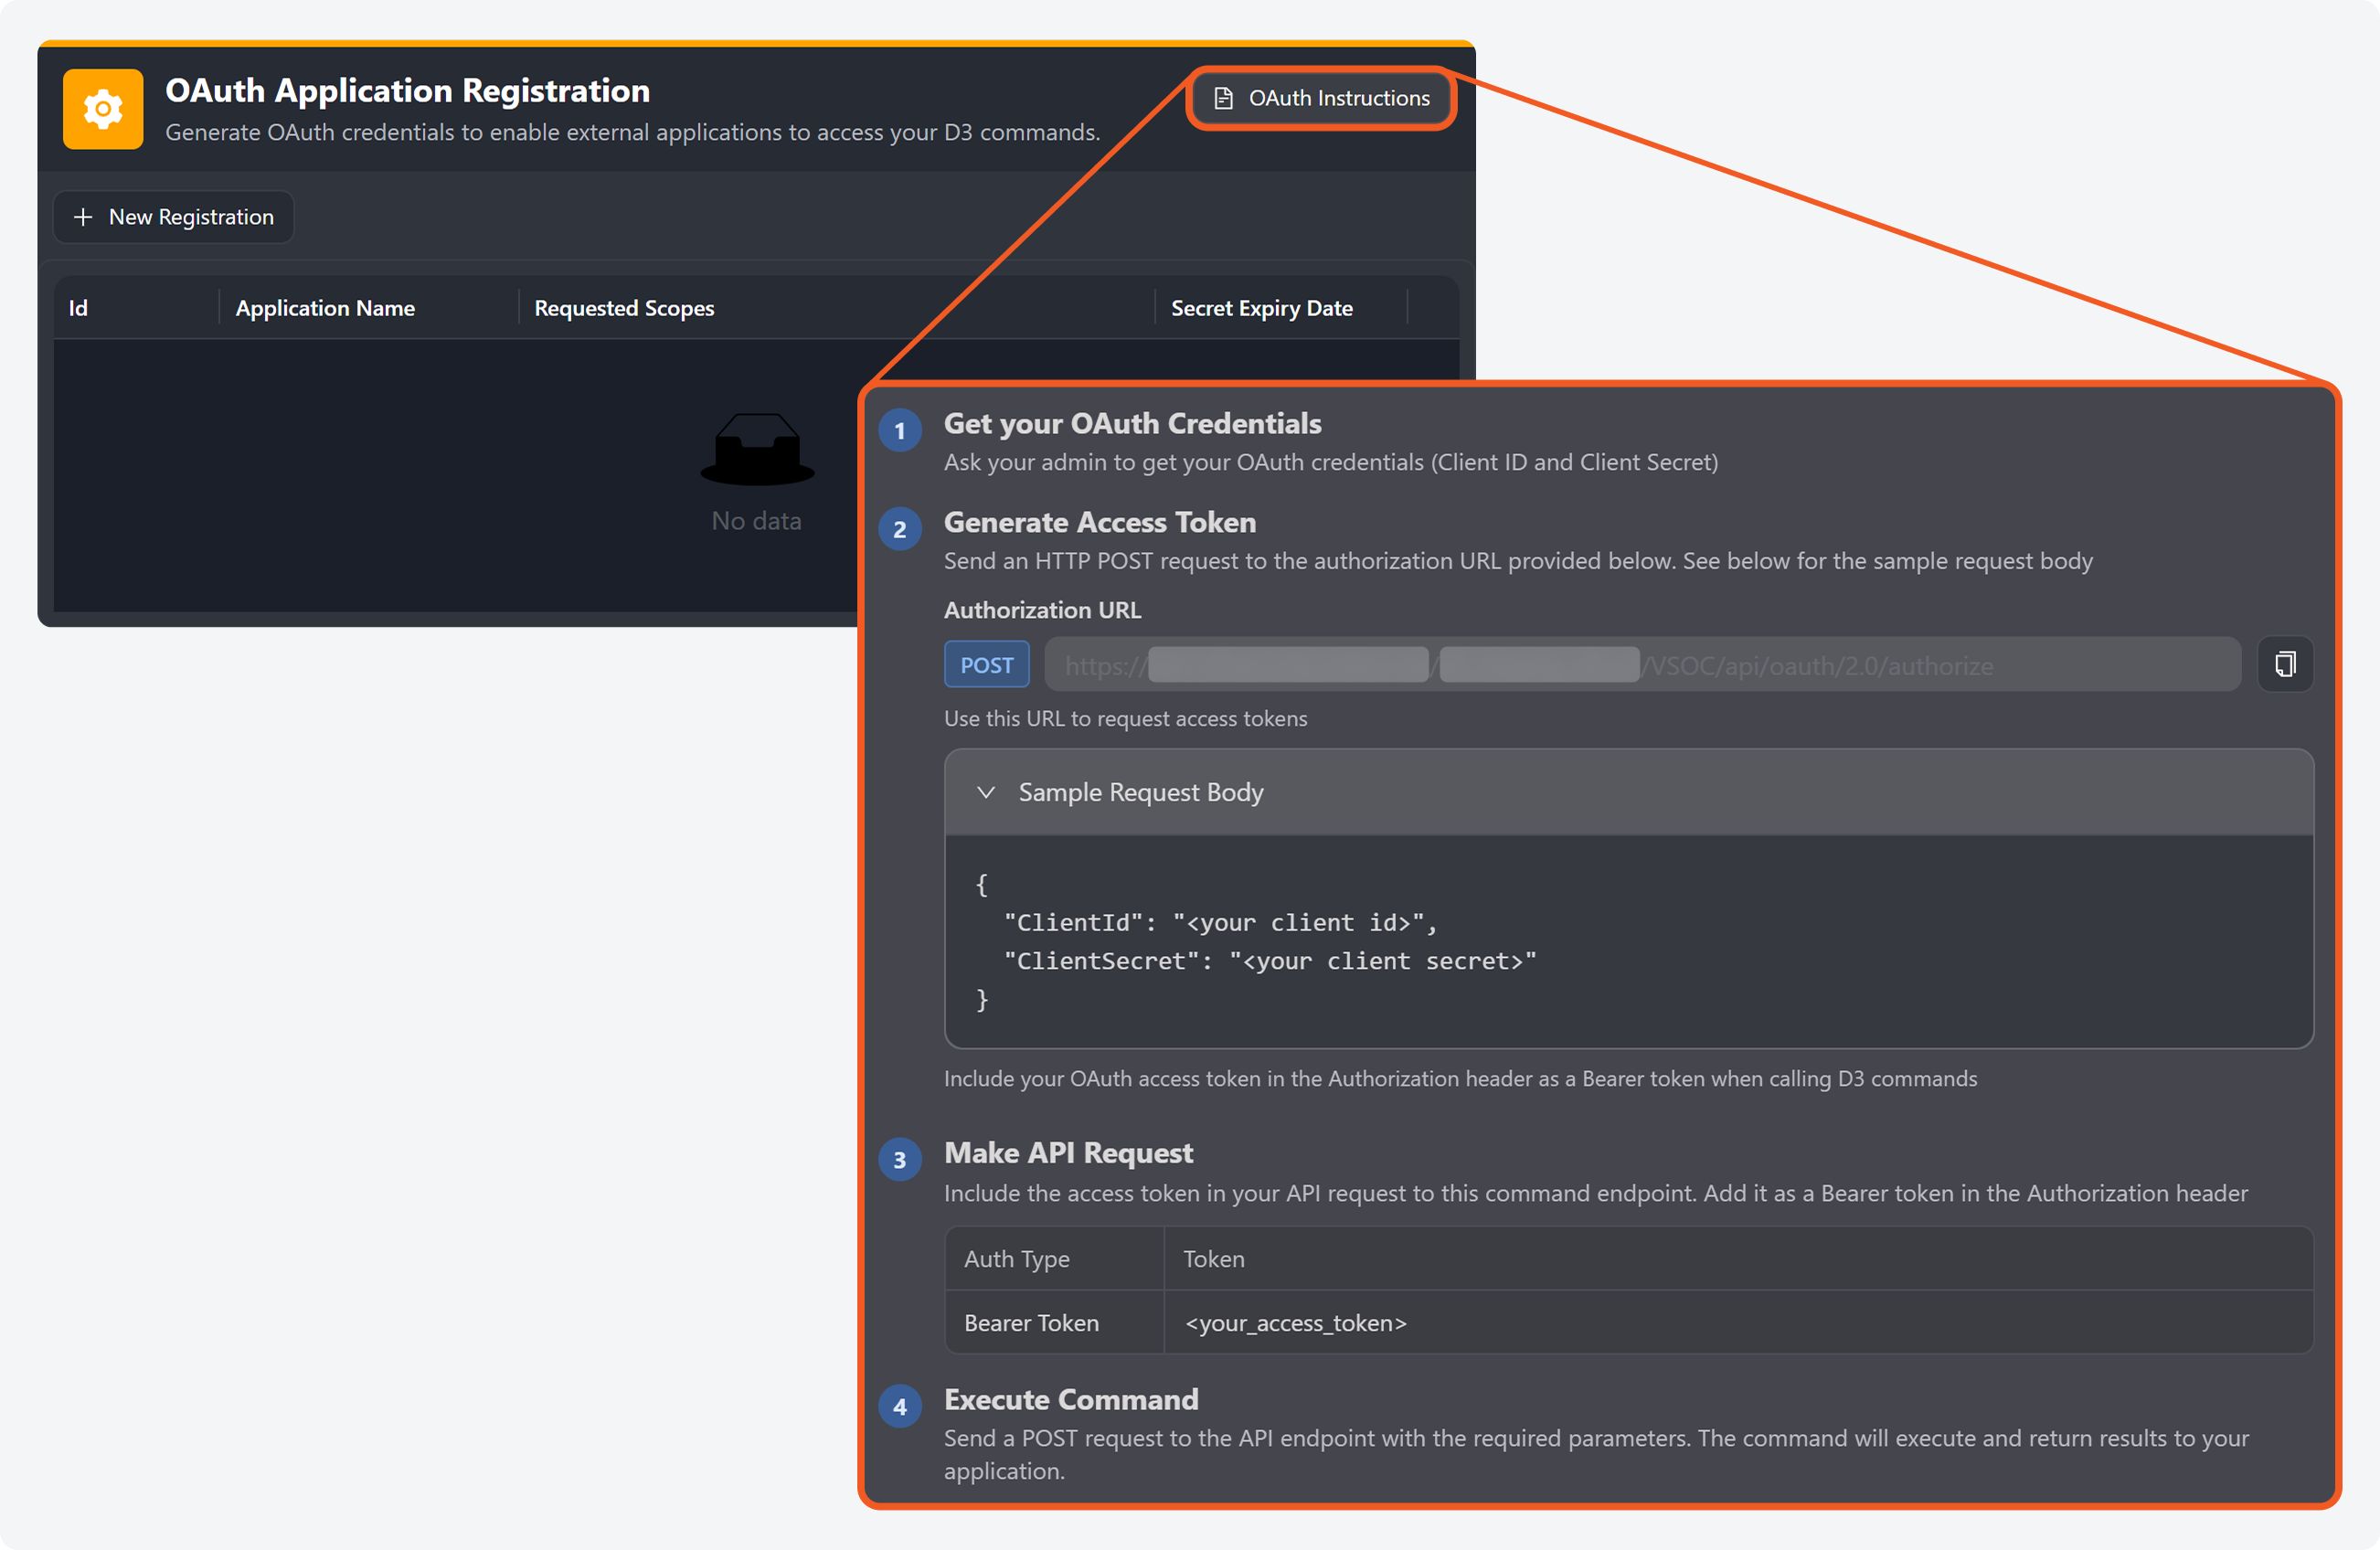
OAuth 2.0 webhook authentication is now supported for more secure execution of D3 commands from external systems. Registering an OAuth application restricts command access to selected sites, users, groups, roles, integrations, and utility commands. The registration process generates a client ID and a one-time client secret, which can be used to obtain a bearer access token with expiration.
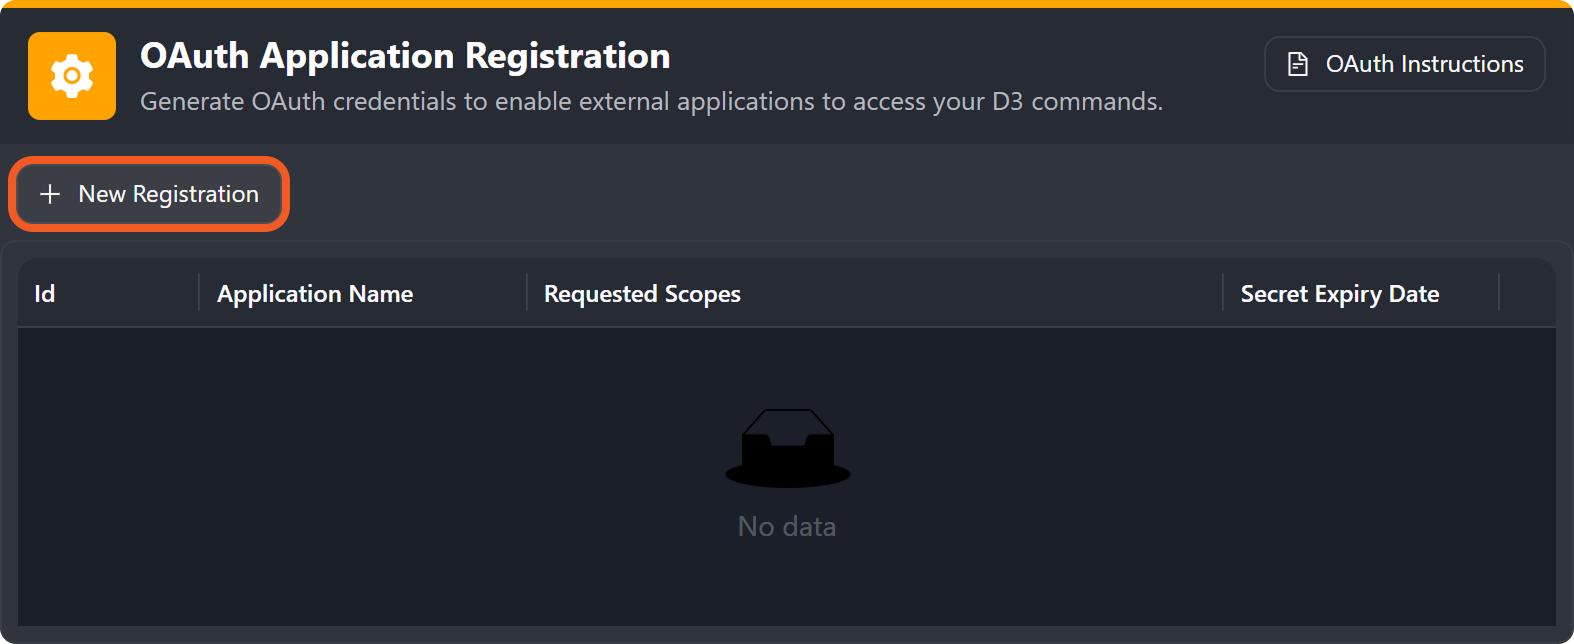
Navigate to Configuration > Application Settings > OAuth Application Registration module, then click on the + New Registration button.
Enter an application name, then click on the Next button.
-20260311-014849.png?inst-v=c16d82f1-7756-4a58-989a-5e5603d47df0)
Configure site and principal access.
-20260311-014922.png?inst-v=c16d82f1-7756-4a58-989a-5e5603d47df0)
Select the sites in which the OAuth application is authorized to execute commands.
Select the users, groups, or roles as which the OAuth application is authorized to execute commands.
Click on the Next button.
Configure OAuth access for integrations and utility commands.
-20260311-014937.png?inst-v=c16d82f1-7756-4a58-989a-5e5603d47df0)
Select the integrations in which the OAuth application is authorized to execute commands.
Select the utility commands the OAuth application is authorized to execute.
Click on the Next button.
Review the OAuth application configuration, then click on the Complete button.
-20260311-014955.png?inst-v=c16d82f1-7756-4a58-989a-5e5603d47df0)
Configure token expiration settings and generate OAuth credentials.
-20260311-015012.png?inst-v=c16d82f1-7756-4a58-989a-5e5603d47df0)
Enter the Access Token TTL in minutes.
Enter the Client Secret TTL in days.
Click on the Get Credentials button.
Securely store the OAuth credentials.
-20260311-015023.png?inst-v=c16d82f1-7756-4a58-989a-5e5603d47df0)
Send a request to generate an OAuth access token.
-20260311-015043.png?inst-v=c16d82f1-7756-4a58-989a-5e5603d47df0)
Retrieve the OAuth access token.
-20260311-015115.png?inst-v=c16d82f1-7756-4a58-989a-5e5603d47df0)
Copy the access_token value returned in the response body.
Click on the Auth tab.
Configure the request authorization using the OAuth access token.
-20260311-015129.png?inst-v=c16d82f1-7756-4a58-989a-5e5603d47df0)
Select Bearer Token from the Auth Type dropdown.
Paste the access_token value from step 9a into the Token field.
Navigate to the desired command, then retrieve the command request details.
-20260311-015148.png?inst-v=c16d82f1-7756-4a58-989a-5e5603d47df0)
Execute the command using the OAuth access token.
-20260311-015242.png?inst-v=c16d82f1-7756-4a58-989a-5e5603d47df0)
Enhancements
D3 Forms Module
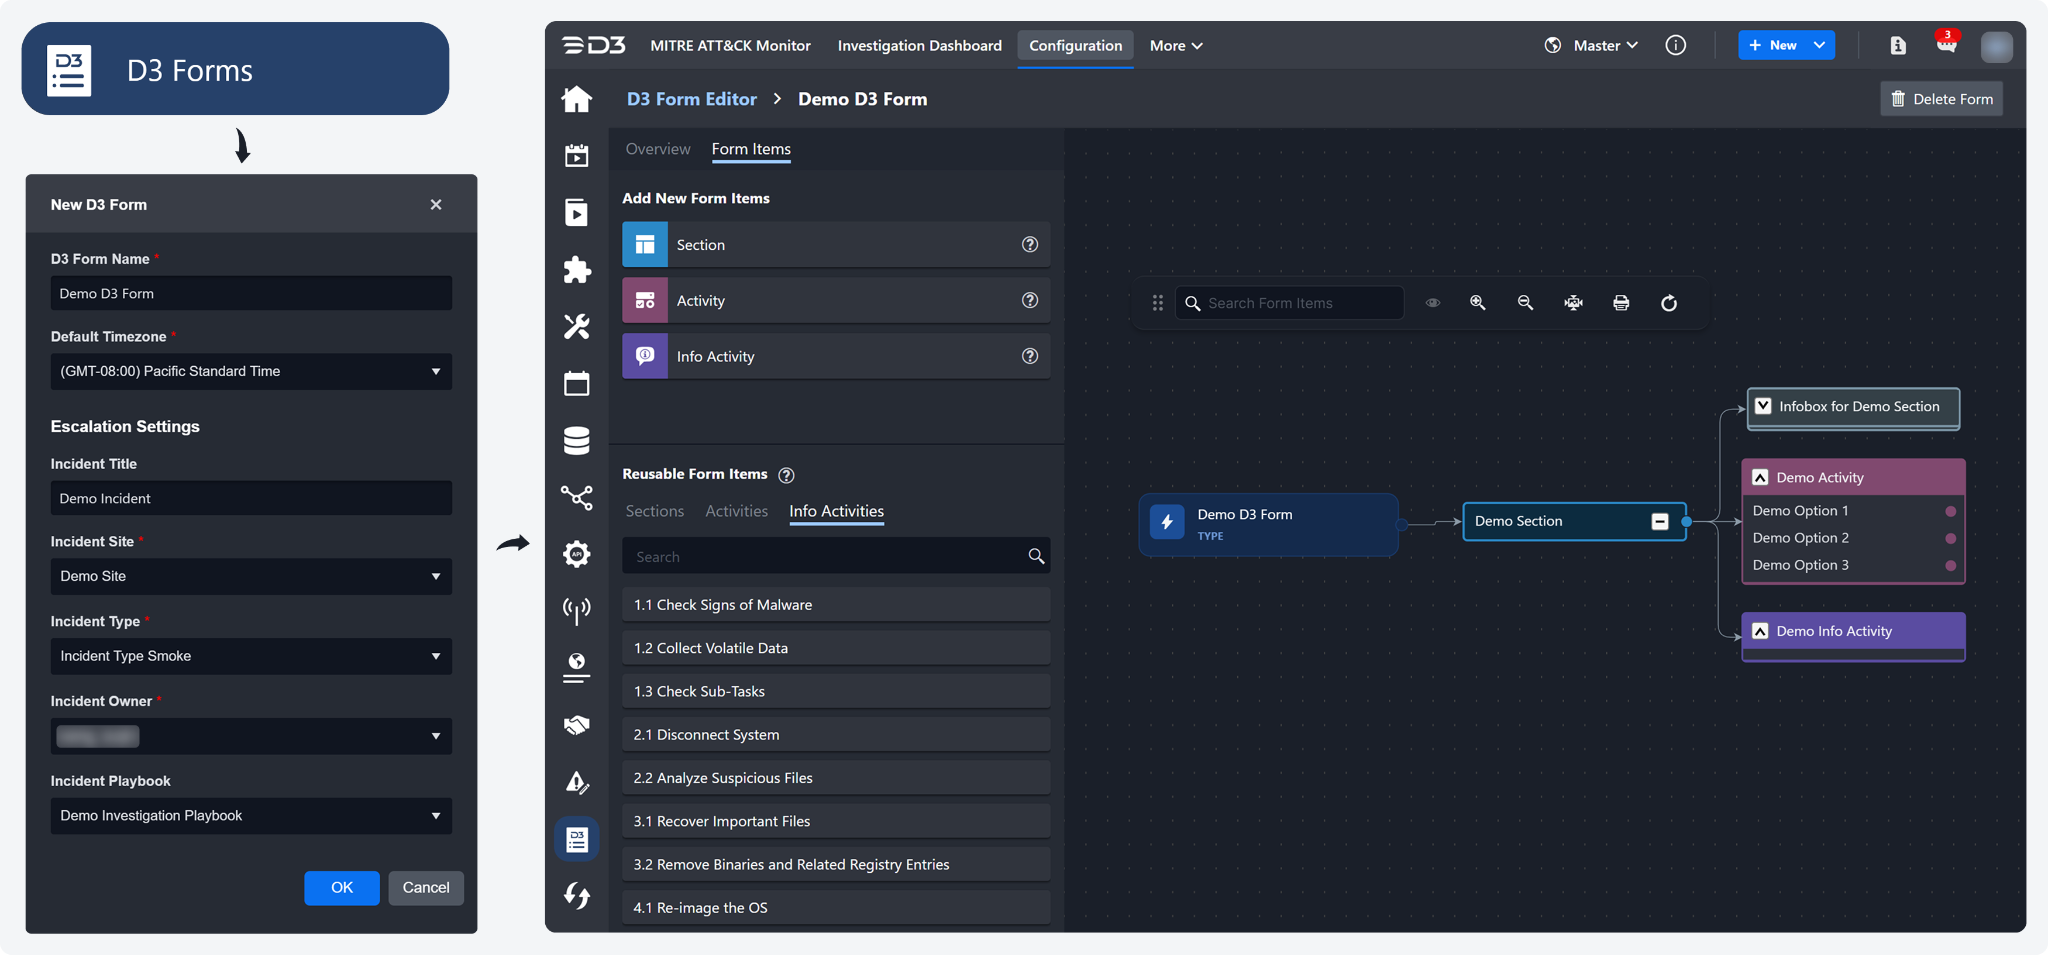
The Forms configuration under Advanced Settings > E-Alert is now also available through a dedicated module called D3 Forms. This means that for a corresponding form within the form portal, users will see the sections and form fields configured from the D3 Forms module. All other E-Alert settings remain configured under Advanced Settings > E-Alert.
The D3 Forms module requires a specific role-based permission to render.
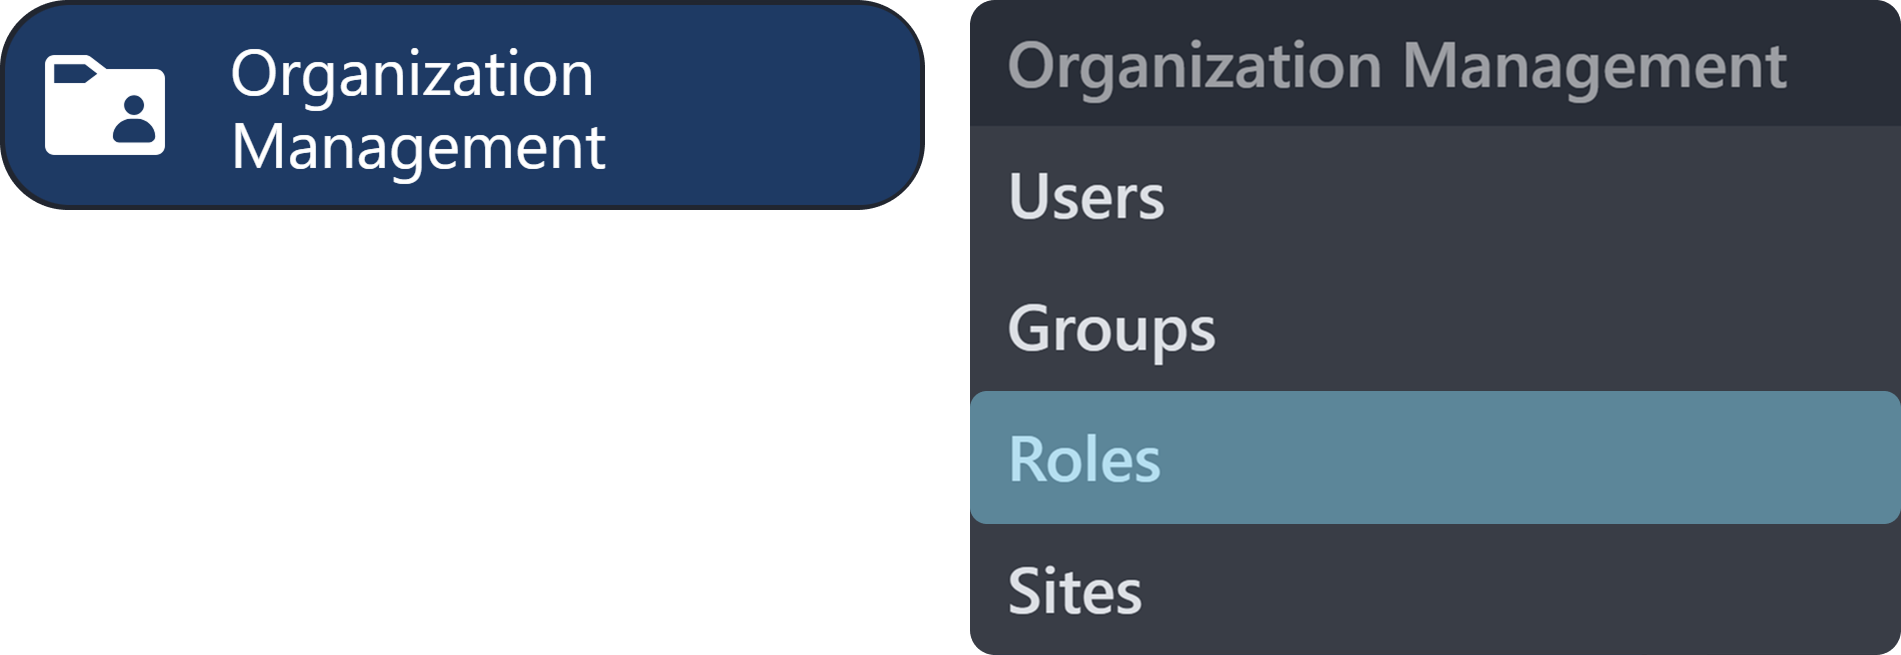
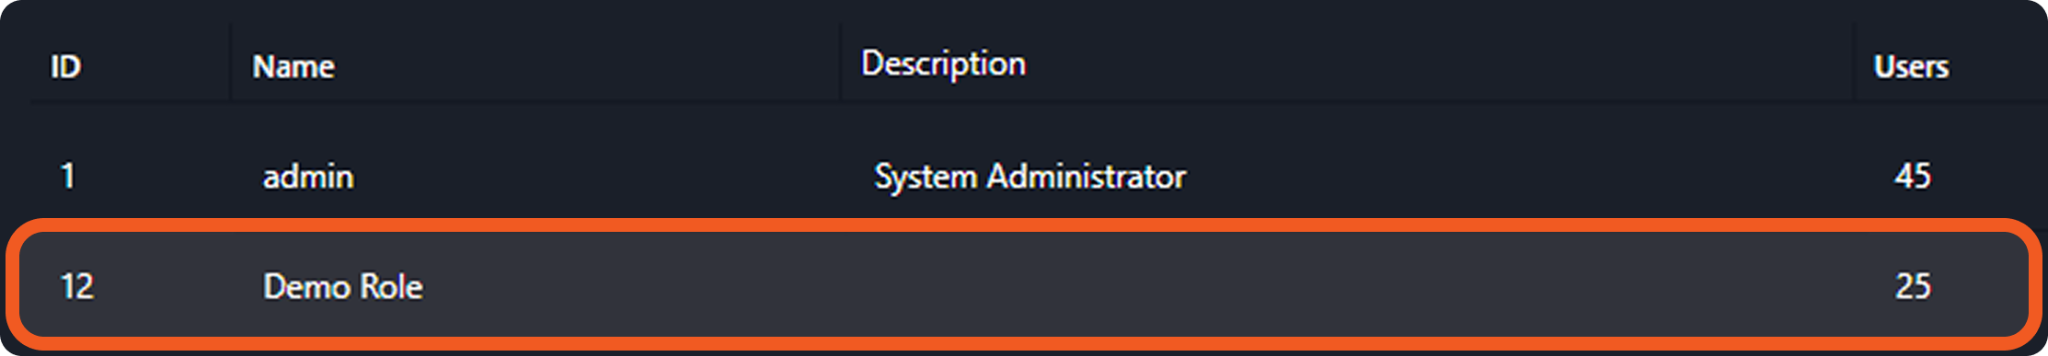
Navigate to the Configuration > Organization Management > Roles page.
Select the relevant role.
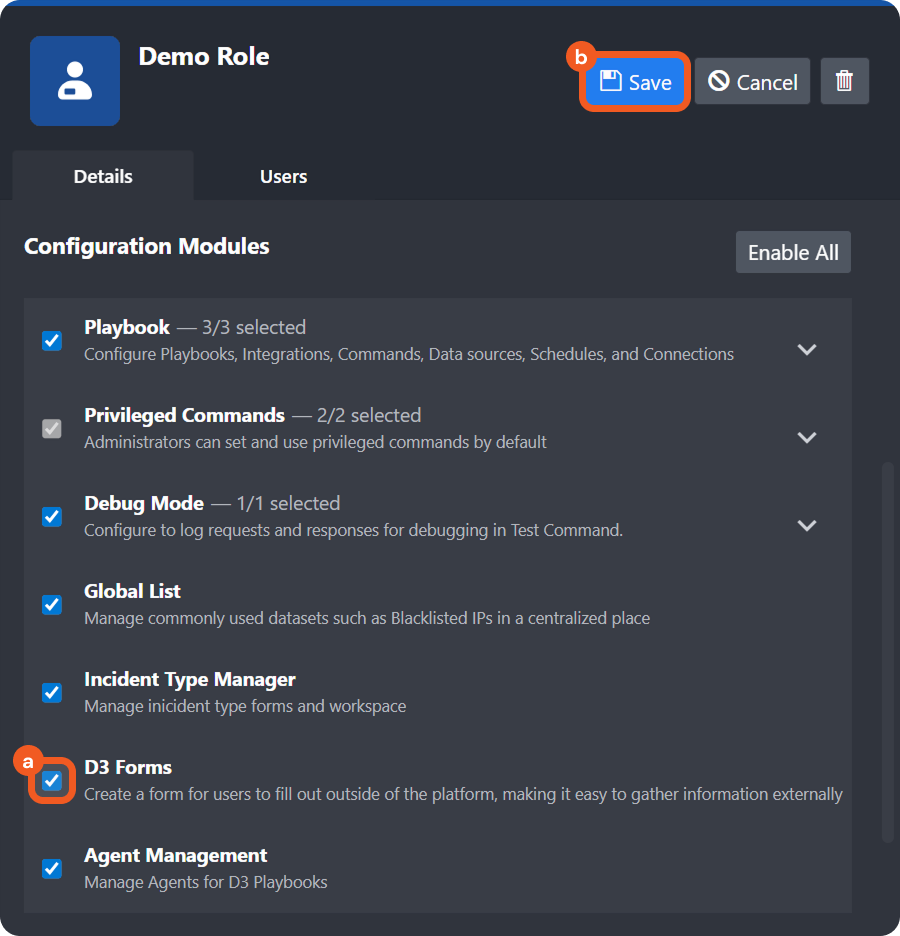
Tick the D3 Forms checkbox under the Configuration Modules section, then click Save.
REMINDER
After an E-Alert form submission, information from all non-attachment form fields appears in the Description widget of the associated incident workspace.
Integrations
New Integrations
The following integrations have been added to this release of D3 SOAR.
Integration Name | Description |
Cyberhaven | Cyberhaven is a data loss prevention platform that monitors and protects sensitive data by tracking its movement across endpoints, applications, and cloud services. |
Updated Integrations
The following integrations have been updated in this release of D3 SOAR.
Integration Name | Changes |
Atlassian Confluence Cloud | New Command:
|
Logpoint Director | New Command:
Enhanced Command:
|
Microsoft Defender XDR | New Command:
|