
Wiz
LAST UPDATED: OCTOBER 20, 2025
Overview
Wiz is a unified cloud security platform designed for both cloud security and development teams, offering capabilities for prevention, active detection and response.
D3 SOAR is providing REST operations to function with Wiz.
Wiz is available for use in:
Connection
To connect to Wiz from D3 SOAR, follow this part to collect the required information below:
Parameter | Description | Example |
API endpoint URL | The Wiz API Endpoint URL obtained in Wiz tenants: Profile > User Settings. | https://api.us1.app.wiz.io |
Client ID | The service account client ID used to authenticate the GraphQL API connection. | CLIENT_ID |
Client Secret | The service account secret key used to authenticate the GraphQL API connection. | ***** |
Permission Requirements
Each endpoint in the Wiz API requires a certain permission scope. The following are required scopes for the commands in this integration:
Command | Required Permissions |
Add Issue Comments |
|
Add Issue Comments (Deprecated) |
READER NOTE If an active playbook already uses this deprecated command, keep these scopes as they are—do not change them to match the scopes required for the new Add Issue Comments command. |
Fetch Event |
|
List Projects | read:projects |
Update Issues |
|
Test Connection | read:issues |
Configuring Wiz to Work with D3 SOAR
Retrieve the API Endpoint URL.
Log in to the Wiz UI using your Wiz account.
Select the User Profile icon located in the top right corner of the screen.
Click the User Settings option.
Select the Tenant option from the left options menu.
Copy and save the API Endpoint URL for the D3 vSOC connection.
Retrieve the Client ID and Client Secret.
Navigate to Settings > Service Accounts in the Wiz dashboard.
Click Add Service Account.
Name the new service account (e.g., D3 vSOC Integration).
(Optional) Specify the scope of the service account to particular projects.
Select the permission read:issues, then click Add Service Account.
Copy the Client Secret. This secret will not be available for retrieval again.
Copy the Client ID, which is displayed on the Service Accounts page.
Configuring D3 SOAR to Work with Wiz
Log in to D3 SOAR.
Find the Wiz integration.
Navigate to Configuration on the top header menu.
Click on the Integration icon on the left sidebar.
Type Wiz in the search box to find the integration, then click it to select it.
Click on the + Connection button on the right side of the Connections section. A new connection window will appear.
Configure the following fields to create a connection to Wiz.
Connection Name: The desired name for the connection.
Site: The site on which to use the integration connection. Use the drop-down menu to select the site. The Share to Internal Sites option enables all internal sites to use the connection. Selecting a specific site will only enable that site to use the connection.
Recipient site for events from connections Shared to Internal Sites: This field is displayed when Share to Internal Sites is selected for the Site field, allowing selection of the internal site for deploying the integration connection.
Agent Name (Optional): The proxy agent required to build the connection. Use the dropdown menu to select the proxy agent from a list of previously configured proxy agents.
Description (Optional): The description for the connection.
Tenant (Optional): When configuring the connection from a master tenant site, users can choose the specific tenant sites with which to share the connection. Once this setting is enabled, users can filter and select the desired tenant sites from the dropdowns to share the connection.
Configure User Permissions: Defines which users have access to the connection.
Active: The checkbox that enables the connection to be used when selected.
System: This section contains the parameters defined specifically for the integration. These parameters must be configured to create the integration connection.
1. Input the API endpoint URL.
2. Copy the Client ID from the Wiz platform (refer to Step 2g of Configuring Wiz to Work with D3 SOAR).
3. Input the Client Secret (refer to Step 2f of Configuring Wiz to Work with D3 SOAR).Enable Password Vault: An optional feature that allows users to take the stored credentials from their own password vault. Refer to the password vault connection guide if needed.
Connection Health Check: Periodically checks the connection status by scheduling the Test Connection command at the specified interval (in minutes). Available only for active connections, this feature also allows configuring email notifications for failed attempts.
Test the connection.
Click on the Test Connection button to verify credentials and connectivity. A success alert displays Passed with a green checkmark. If the connection fails, review the parameters and retry.
Click OK to close the alert window.
Click + Add to create and add the configured connection.
Commands
Wiz includes the following executable commands for users to set up schedules or create playbook workflows. With the Test Command function, users can execute these commands independently for playbook troubleshooting.
Integration API Note
For more information about the Wiz API, refer to the Wiz API reference.
READER NOTE
Certain permissions are required for each command. Refer to the Permission Requirements and Configuring Wiz to Work with D3 SOAR sections for details.
Note for Time-related parameters
The input format of time-related parameters may vary based on user account settings, which may cause the sample data in commands to differ from what is displayed. To adjust the time format, follow these steps:
Navigate to Configuration > Application Settings. Select Date/Time Format.
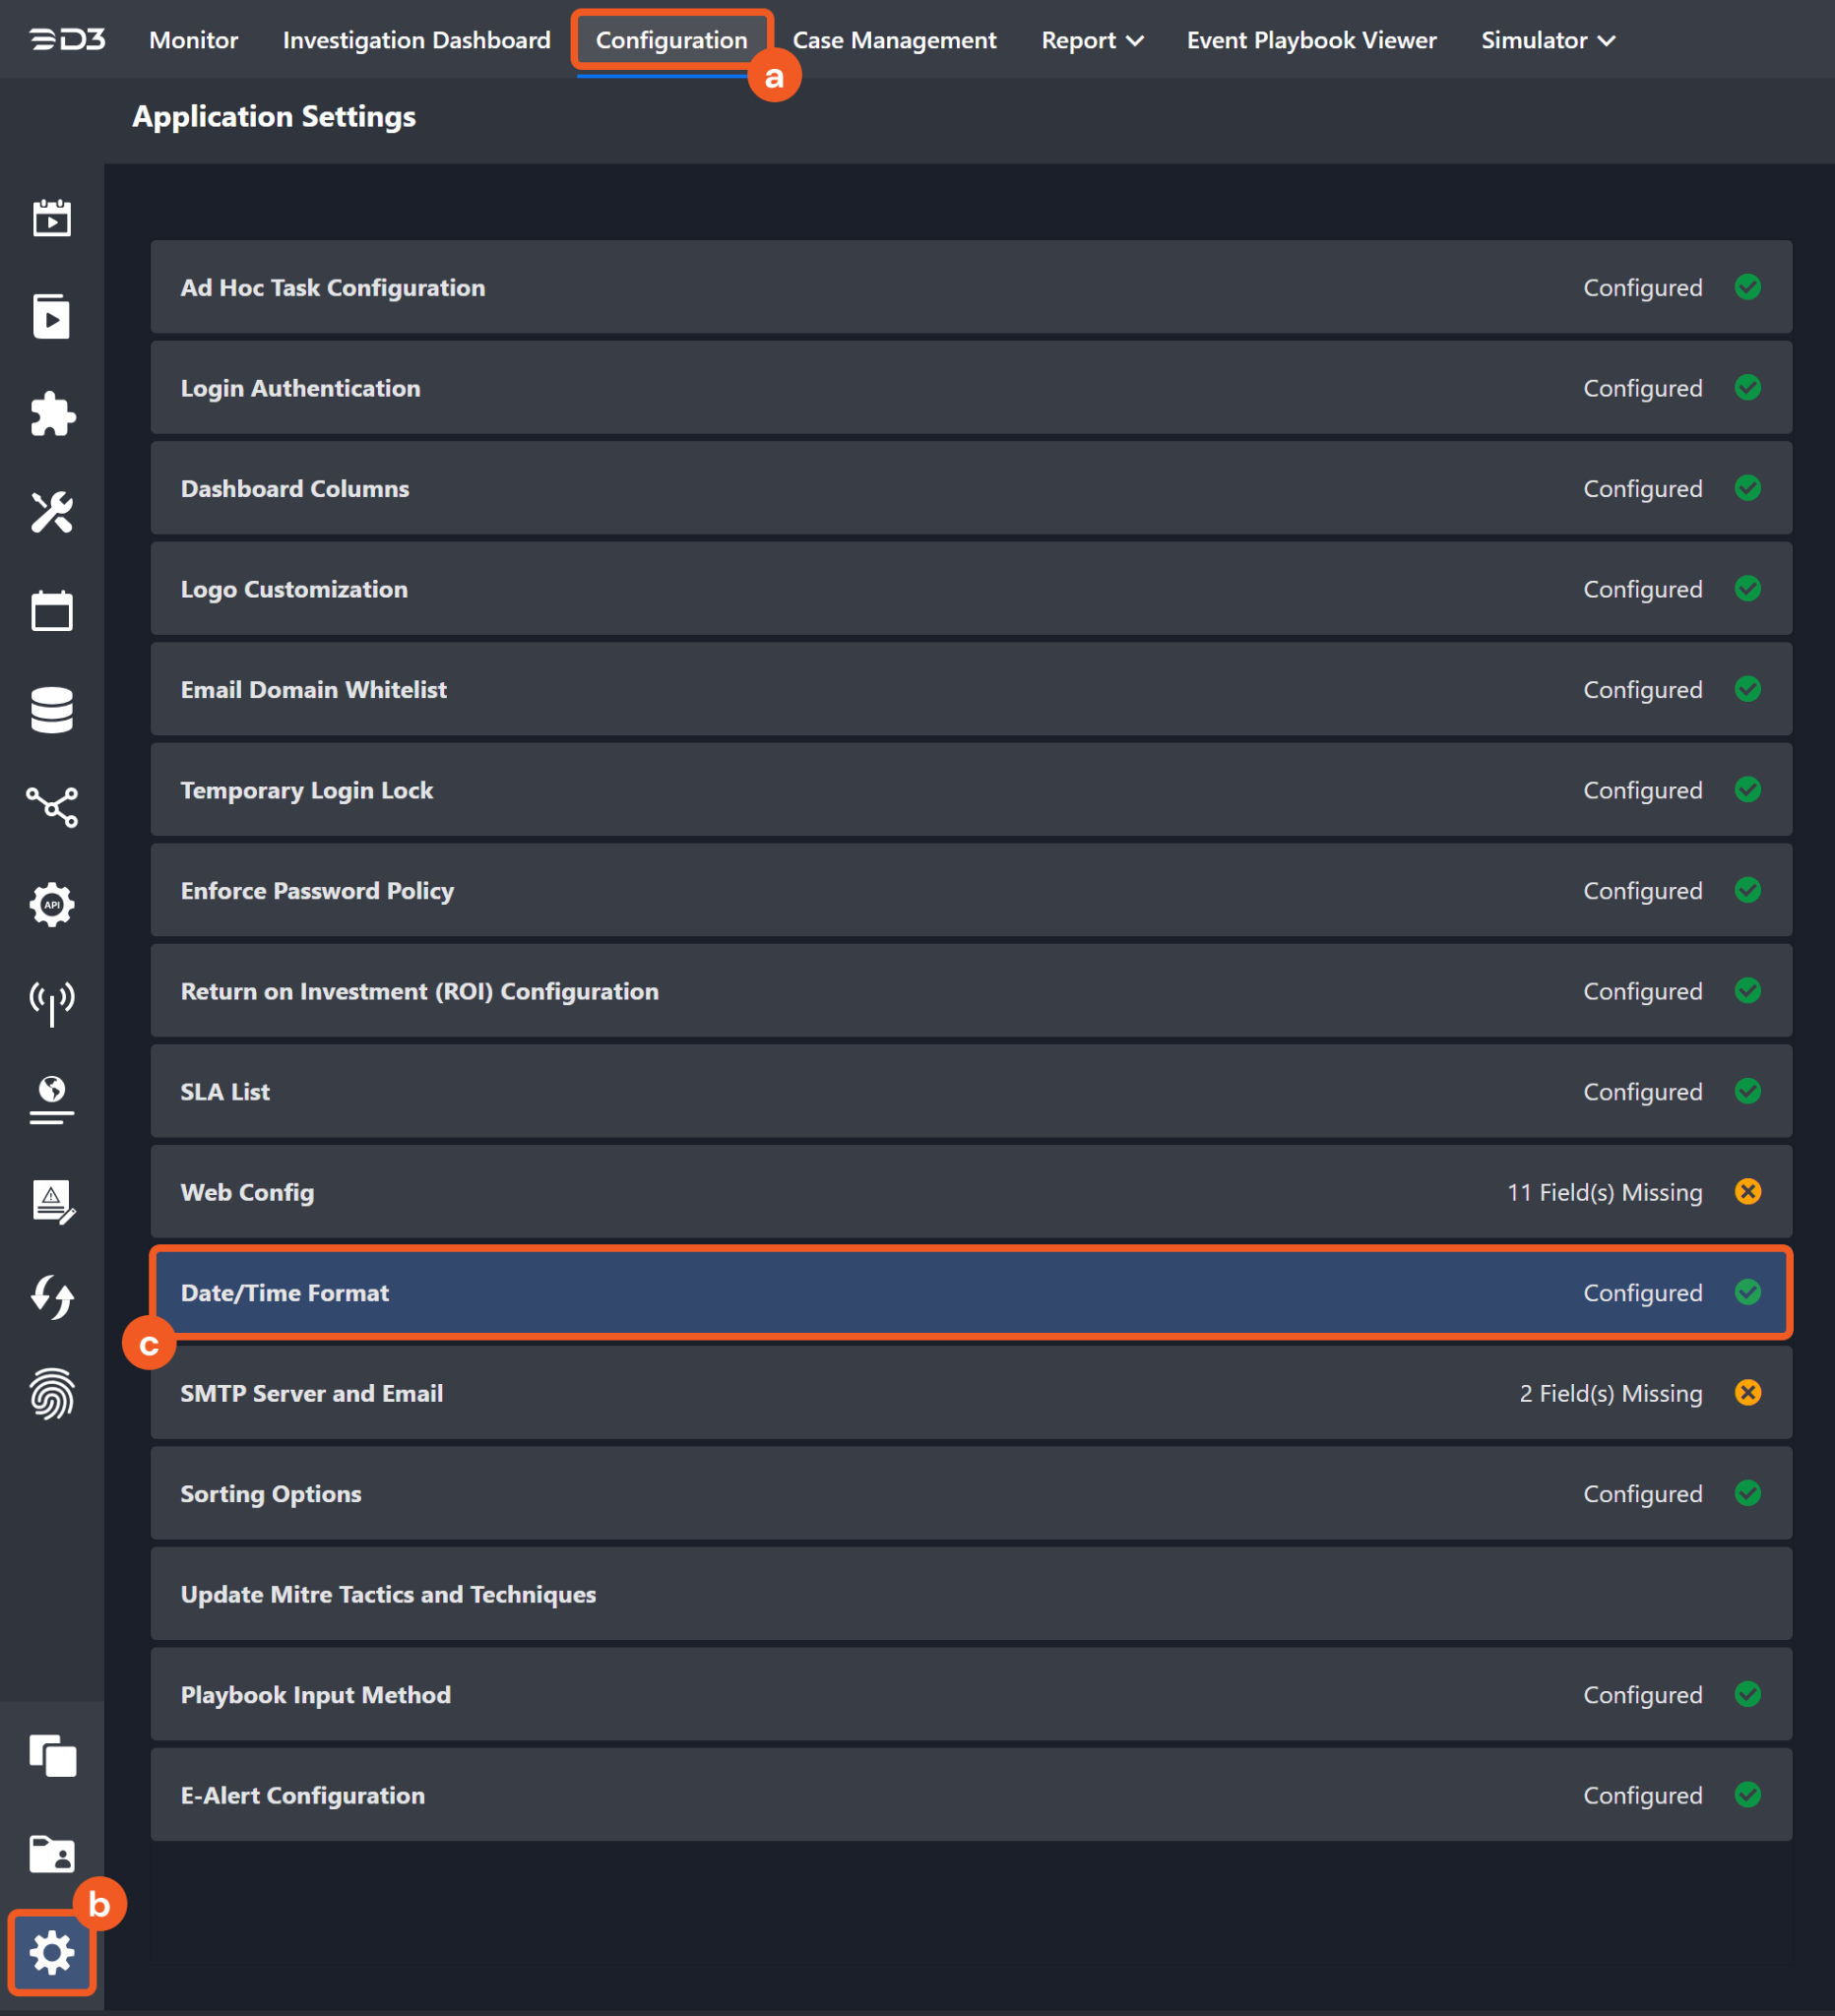
Choose the desired date and time format, then click on the Save button.
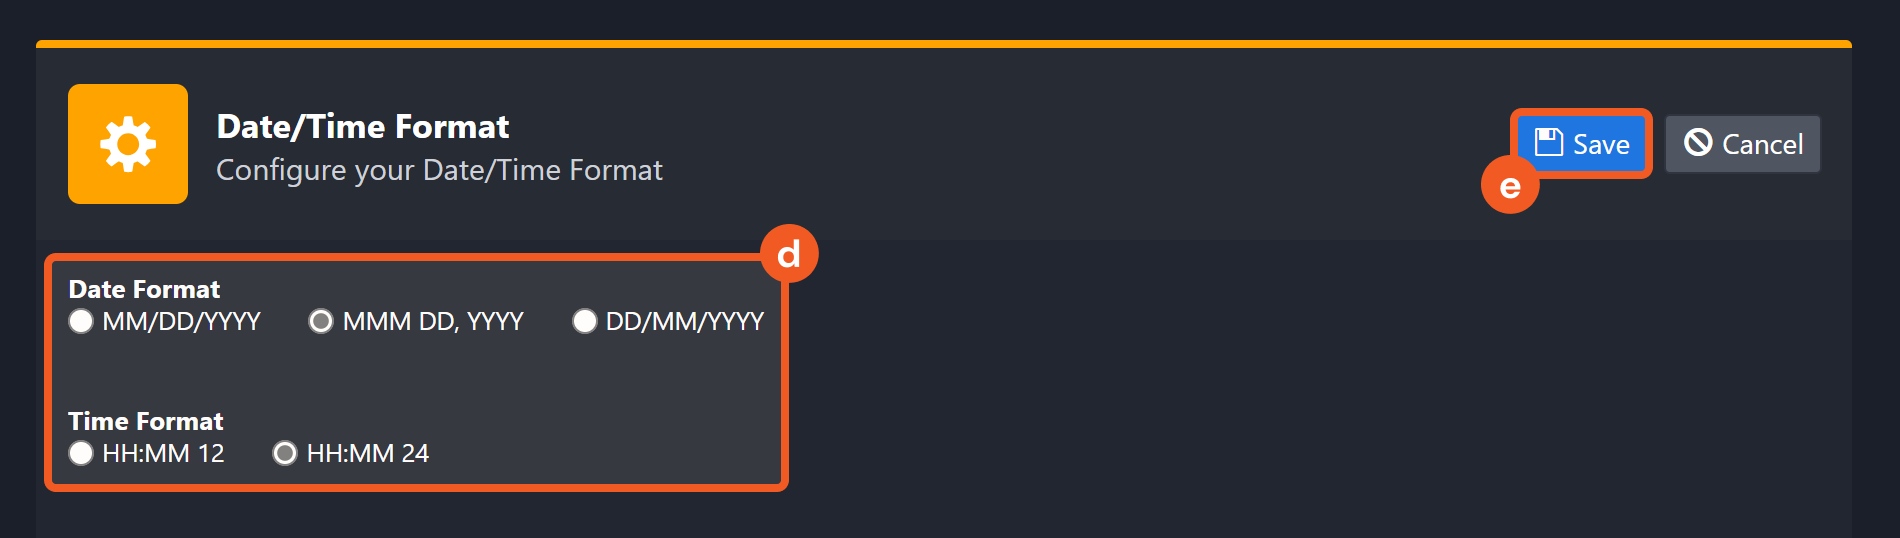
The selected time format will now be visible when configuring Date/Time command input parameters.
Add Issue Comments
Adds a comment to the specified Issues or Detections.
READER NOTE
Issue IDs is a required parameter to run this command.
Run the Fetch Event command to obtain the Issue IDs. Issue IDs can be found in the raw data at the path $.data.nodes[*].id.
Input
Input Parameter | Required/Optional | Description | Example |
Issue IDs | Required | The IDs of issues for which to add a comment. Issue IDs can be obtained using the Fetch Event command, with the Issues option selected for the Event Type parameter. |
JSON
|
Note Text | Required | The text to include as the issue comment. | Demo note |
Output
To view the sample output data for all commands, refer to this article.
Error Handling
If the Return Data displays Failed, an Error tab will appear in the Test Result window.
The error tab contains the details responded from D3 SOAR or third-party API calls, including Failure Indicator, Status Code, and Message. This can help locate the root cause of a command failure.
Parts in Error | Description | Example |
Failure Indicator | Indicates the command failure that happened at a specific input and/or API call. | Add Issue Comments failed. |
Status Code | The response code issued by the third-party API server or the D3 SOAR system that can be used to locate the corresponding error category. For example, if the returned status code is 401, the selected connection is unauthorized to run the command. The user or system support would need to check the permission setting in the Wiz portal. Refer to the HTTP Status Code Registry for details. | Status Code: 400. |
Message | The raw data or captured key error message from the integration API server about the API request failure. | Message: API endpoint URL is not valid in format. |
Error Sample Data Add Issue Comments failed. Status Code: 400. Message: API endpoint URL is not valid in format. |
Add Issue Comments (Deprecated)
Adds a comment to the specified issues.
READER NOTE
Issue IDs is a required parameter to run this command.
Run the Fetch Event command to obtain the Issue IDs. Issue IDs can be found in the raw data at the path $.data.nodes[*].id.
Input
Input Parameter | Required/Optional | Description | Example |
Issue IDs | Required | The IDs of issues for which to add a comment. Issue IDs can be obtained using the Fetch Event command, with the Issues option selected for the Event Type parameter. |
JSON
|
Note Text | Required | The text to include as the issue comment. | Demo note |
Output
To view the sample output data for all commands, refer to this article.
Error Handling
If the Return Data displays Failed, an Error tab will appear in the Test Result window.
The error tab contains the details responded from D3 SOAR or third-party API calls, including Failure Indicator, Status Code, and Message. This can help locate the root cause of a command failure.
Parts in Error | Description | Example |
Failure Indicator | Indicates the command failure that happened at a specific input and/or API call. | Add Issue Comments (Deprecated) failed. |
Status Code | The response code issued by the third-party API server or the D3 SOAR system that can be used to locate the corresponding error category. For example, if the returned status code is 401, the selected connection is unauthorized to run the command. The user or system support would need to check the permission setting in the Wiz portal. Refer to the HTTP Status Code Registry for details. | Status Code: 400. |
Message | The raw data or captured key error message from the integration API server about the API request failure. | Message: API endpoint URL is not valid in format. |
Error Sample Data Add Issue Comments (Deprecated) failed. Status Code: 400. Message: API endpoint URL is not valid in format. |
Fetch Event
Ingests Wiz issues, Cloud Configuration Findings or Vulnerability Findings into D3 vSOC as events based on search condition. The events are sorted in descending order based on a specific time field, which varies depending on the event type used.
READER NOTE
The Fetch Event scheduled job interval should be at least 12 hours.
It is recommended by Wiz to schedule the job interval to 24 hours.
Input
Input Parameter | Required/Optional | Description | Example |
Event Type | Optional | The event type to be ingested. The available event types are:
By default, the value is Issues. | Cloud Configuration Findings |
Start Time | Optional | The start time of the time range (in UTC) to ingest incremental events. For the Issues event type, issues modified after this time will be ingested. For the Cloud Configuration Findings event type, configuration findings first seen after this time will be ingested. For the Vulnerability Findings event type, vulnerability findings updated after this time will be ingested. By default, the Start Time is 24 hours before the End Time. | 2024-08-06 18:00:00 |
End Time | Optional | The end time of the time range (in UTC) to ingest incremental events. For the Issues event type, issues modified before this time will be ingested. For the Cloud Configuration Findings event type, configuration findings first seen before this time will be ingested. For the Vulnerability Findings event type, vulnerability findings updated before this time will be ingested. By default, the End Time is the current time. | 2024-08-06 19:00:00 |
Number of Event(s) Fetched | Optional | The maximum number of issues to return. The available range is from 1 to 500. By default, all events matching the filter criteria will be returned. | 10 |
Issue Statuses | Optional | Returns events with the specified status. By default, events in all statuses will be returned. For the Issues event type, the available statuses are:
For the Cloud Configuration Findings and Vulnerability Findings event types, the available statuses are:
|
JSON
|
Severity | Optional | Returns events with the specified severity. By default, events of all severity levels will be returned. | Critical and High |
Additional Filters | Optional | Allows for further refinement of queries by applying additional filters. For available filters related to the Issues event type, visit https://win.wiz.io/reference/issues-query. For filters related to the Cloud Configuration Findings event type, visit https://win.wiz.io/reference/configuration-finding. For filters related to the Vulnerability Findings event type, visit https://win.wiz.io/reference/vulnerability-finding. |
JSON
|
Output
To view the sample output data for all commands, refer to this article.
Fetch Event Field Mapping
Fetch Event commands require event field mapping. Field mapping plays a key role for data normalization within the event pipeline. Field mapping converts the original data fields from the different providers to standardized D3 fields as defined by the D3 Model. Refer to Event and Incident Intake Field Mapping for details.
To add a custom field, click on the + Add Field button. Users can also remove built-in field mappings by clicking x. Note that two underscore characters will automatically prefix the defined Field Name as the System Name for a custom field mapping. Additionally, if an input Field Name contains any spaces, they will automatically be replaced with underscores for the corresponding System Name.
Default Event Source
The D3 system configures the field mapping for the fields which are common for issues, cloud configuration findings and vulnerability findings. The default event source has a "Main Event JSON Path" (i.e., $.data.nodes) that is used to extract a batch of events from the response raw data. Click Edit Main JSON Path to view the "Main Event JSON Path."Main Event JSON Path: $.data.nodes
The Main Event JSON Path determines the root path where the system starts parsing raw response data into D3 event data. The JSON path begins with $, representing the root element. The path is formed by appending a sequence of child elements to $, each separated by a dot (.). Square brackets with nested quotation marks ([‘...’]) should be used to separate child elements in JSON arrays.
As a system integration, the Wiz integration has some pre-configured field mappings.
Event Source for Issues
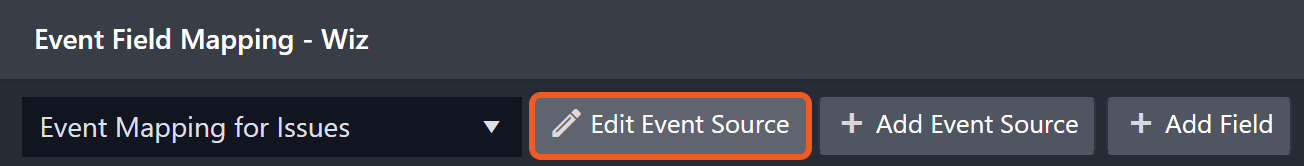
The D3 system configures the field mappings which are specific to the issue-related events (e.g., Document ID, and Event Type). If a source field in the field mapping is not found, the corresponding field mapping will be ignored. Because the __typename field in the raw data for issues consistently has the value Issue, these events can be identified by the Search String: {__typename}=Issue. Click Edit Event Source to view the Search String.
Event Source for Cloud Configuration Findings
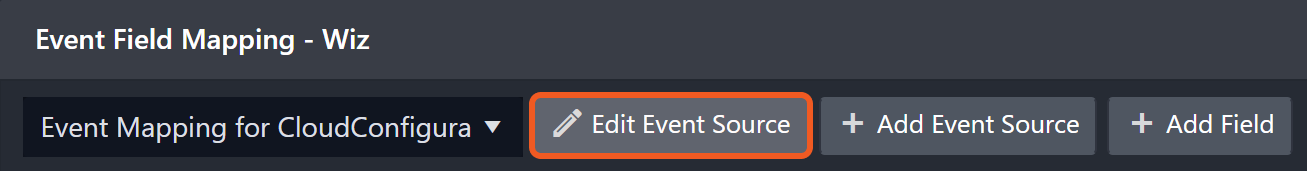
The D3 system configures the field mappings which are specific to the cloud configuration finding-related events (e.g., Action result, and Tag). If a source field in the field mapping is not found, the corresponding field mapping will be ignored. Because the __typename field in the raw data for cloud configuration findings consistently has the value ConfigurationFinding, these events can be identified by the Search String: {__typename} = ConfigurationFinding. Click Edit Event Source to view the Search String.
Event Source for Vulnerability Findings
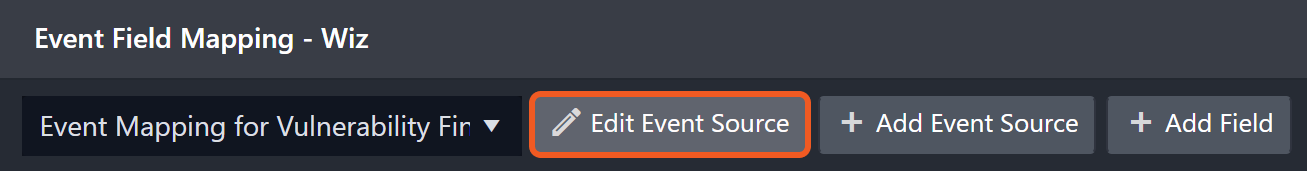
The D3 system configures the field mappings which are specific to the vulnerability findings-related events (eg. Status, and CVE). If a source field in the field mapping is not found, the corresponding field mapping will be ignored. Because the __typename field in the raw data for Vulnerability Findings consistently has the value VulnerabilityFinding, these events can be identified by the Search String: {__typename} = VulnerabilityFinding. Click Edit Event Source to view the Search String.
The pre-configured field mappings are detailed below:
Field Name | Source Field |
Event Mapping for Issues (Search String: {__typename} = Issue) | |
Document ID | .id |
Start Time | .createdAt |
Description | .sourceRule.controlDescription |
Status | .status |
Source type | .sourceRule.name |
Resolved Time | .resolvedAt |
Due Time | .dueAt |
Updated Time | .updatedAt |
Project Names | .projects[*].name |
Related Service Tickets | .serviceTickets |
Severity | .severity |
Notes | .notes[*].text |
Rule name | .sourceRule.name |
Entity Provider ID | .entitySnapshot.providerId |
Event Type | .EventType |
Issue Type | .type |
Entity ID | .entitySnapshot.id |
Entity Type | .entitySnapshot.type |
Entity Name | .entitySnapshot.name |
Source Rule Type Name | .sourceRule.__typename |
Source Rule ID | .sourceRule.id |
Risks | .sourceRule.risks |
Threats | .sourceRule.threats |
Entity Status | .entitySnapshot.status |
Entity Cloud Platform | .entitySnapshot.cloudPlatform |
Entity Native Type | .entitySnapshot.nativeType |
Entity Subscription Name | .entitySnapshot.subscriptionName |
Entity Cloud Provider URL | .entitySnapshot.cloudProviderURL |
Entity Cloud Provider Region | .entitySnapshot.region |
Event Mapping for Cloud Configuration Findings (Search String: {__typename} = ConfigurationFinding) | |
Unique Event Key | .id |
Start Time | .firstSeenAt |
Description | .rule.description |
Status | .status |
Severity | .severity |
Rule name | rule.name |
Tag | .tags |
Event Type | .EventType |
Action result | .result |
Remediation | .remediation |
Target External ID | .targetExternalId |
Resource Type | .resource.type |
Resource Name | .resource.name |
Resource ID | .resource.id |
Rule ID | .rule.id |
Subscription ID | .resource.subscription.id |
Cloud Provider | .resource.subscription.cloudProvider |
Security Sub Category Title | .securitySubCategories[*].title |
Security Sub Category ID | .securitySubCategories[*].id |
Event Mapping for Vulnerability Findings (Search String: {__typename} = VulnerabilityFinding) | |
Unique Event Key | .id |
Start Time | .firstDetectedAt |
Description | .description |
Status | .status |
Event name | .name |
Last Detected Time | .lastDetectedAt |
Score | .score |
CVE | .CVEDescription |
Project Names | .projects[*].name |
Exploitability Score | .exploitabilityScore |
Severity | .vendorSeverity |
Impact Score | .impactScore |
Remediation | .remediation |
object path | .locationPath |
Event Type | .EventType |
Issue Type | .type |
Version | .version |
Fixed Version | .fixedVersion |
EPSS Severity | .epssSeverity |
Vulnerable Asset Type | .vulnerableAsset.type |
Vulnerable Asset Name | .vulnerableAsset.name |
Vulnerable Asset ID | .vulnerableAsset.id |
Cloud Platform | .vulnerableAsset.cloudPlatform |
Vulnerable Asset Subscription | .vulnerableAsset.subscriptionName |
Vulnerable Asset Status | .vulnerableAsset.status |
Operating system | .vulnerableAsset.operatingSystem |
Vulnerable Asset IP Addresses | .vulnerableAsset.ipAddresses |
Image Name | .vulnerableAsset.imageName |
Vulnerable Asset Tags | .vulnerableAsset.tags |
Error Handling
If the Return Data displays Failed, an Error tab will appear in the Test Result window.
The error tab contains the details responded from D3 SOAR or third-party API calls, including Failure Indicator, Status Code, and Message. This can help locate the root cause of a command failure.
Parts in Error | Description | Example |
Failure Indicator | Indicates the command failure that happened at a specific input and/or API call. | Fetch Event failed. |
Status Code | The response code issued by the third-party API server or the D3 SOAR system that can be used to locate the corresponding error category. For example, if the returned status code is 401, the selected connection is unauthorized to run the command. The user or system support would need to check the permission setting in the Wiz portal. Refer to the HTTP Status Code Registry for details. | Status Code: 400. |
Message | The raw data or captured key error message from the integration API server about the API request failure. | Message: API endpoint URL is not valid in format. |
Error Sample Data Fetch Event failed. Status Code: 400. Message: API endpoint URL is not valid in format. |
List Projects
Returns a list of the Wiz projects in your respective tenant.
Input
Input Parameter | Required/Optional | Description | Example |
Project Name | Optional | Filters projects by their name. By default, all projects will be returned. | project-1 |
Impact | Optional | Filters projects by business impact. The following are the options available:
By default, projects from all business impact levels are returned. | High |
Output
To view the sample output data for all commands, refer to this article.
Error Handling
If the Return Data displays Failed, an Error tab will appear in the Test Result window.
The error tab contains the details responded from D3 SOAR or third-party API calls, including Failure Indicator, Status Code, and Message. This can help locate the root cause of a command failure.
Parts in Error | Description | Example |
Failure Indicator | Indicates the command failure that happened at a specific input and/or API call. | List Projects failed. |
Status Code | The response code issued by the third-party API server or the D3 SOAR system that can be used to locate the corresponding error category. For example, if the returned status code is 401, the selected connection is unauthorized to run the command. The user or system support would need to check the permission setting in the Wiz portal. Refer to the HTTP Status Code Registry for details. | Status Code: 400. |
Message | The raw data or captured key error message from the integration API server about the API request failure. | Message: API endpoint URL is not valid in format. |
Error Sample Data List Projects failed. Status Code: 400. Message: API endpoint URL is not valid in format. |
Update Issues
Updates the parameters Status, Due Time or Note of specified issues.
READER NOTE
Issue IDs is a required parameter to run this command.
Run the Fetch Event command to obtain the Issue IDs. Issue IDs can be found in the raw data at the path $.data.nodes[*].id.
Input
Input Parameter | Required/Optional | Description | Example |
Issue IDs | Required | The IDs corresponding to Issues that are to be updated. Issue IDs can be obtained using the Fetch Event command, with the Issues option selected for the Event Type parameter. |
JSON
|
Status | Optional | The new status of the issues. For Graph Control or Cloud Configuration Issues, available values are:
When Status is set to Rejected, a Reject Reason must be provided. Wiz sets these issues to Resolved automatically during the scan cycle; the status cannot be changed to Resolved manually. For Threat Detection Issues, available values are:
When Status is set to Resolved, a Resolve Reason must be provided. Wiz sets Threat Detection Issues to Resolved automatically if no new detections occur within 90 days. | Rejected |
Reject Reason | Optional | Updates the rejection reason for Graph Control or Cloud Configuration Issues. Available options are:
This parameter can only be used when the status of the Graph Control or Cloud Configuration Issue is set to Rejected. | False Positive |
ResolveReason | Optional | Updates the resolution reason for Threat Detection Issues. Available options are:
This parameter can only be used when the status of a Threat Detection Issue is set to Resolved. | Malicious Threat |
Due Time | Optional | Updates the estimated amount of time in resolving the Issues. | 2007-12-03T10:15:30Z |
Note | Optional | Updates the note referenced on the Issues when updating the status to Rejected. To update the note for all other situations, use the Add Issue Comments command. | This is a test note |
Resolution Note | Optional | Updates the resolution note of Threat Detection Issues. This parameter can only be used when Status is set to Resolved. | This is a test resolution note |
Output
To view the sample output data for all commands, refer to this article.
Error Handling
If the Return Data displays Partially Successful or Failed, an Error tab will appear in the Test Result window.
The error tab contains the details responded from D3 SOAR or third-party API calls, including Failure Indicator, Status Code, and Message. This can help locate the root cause of a command failure.
Parts in Error | Description | Example |
Failure Indicator | Indicates the command failure that happened at a specific input and/or API call. | Update Issues failed. |
Status Code | The response code issued by the third-party API server or the D3 SOAR system that can be used to locate the corresponding error category. For example, if the returned status code is 401, the selected connection is unauthorized to run the command. The user or system support would need to check the permission setting in the Wiz portal. Refer to the HTTP Status Code Registry for details. | Status Code: 400. |
Message | The raw data or captured key error message from the integration API server about the API request failure. | Message: API endpoint URL is not valid in format. |
Error Sample Data Update Issues failed. Status Code: 400. Message: API endpoint URL is not valid in format. |
Test Connection
Allows you to perform a health check on an integration connection. You can schedule a periodic health check by selecting Connection Health Check when editing an integration connection.
Input
N/A
Output
Output Type | Description | Return Data Type |
Return Data | Indicates one of the possible command execution states: Successful or Failed. The Failed state can be triggered by any of the following errors:
More details about an error can be viewed in the Error tab. | String |
Error Handling
If the Return Data displays Failed, an Error tab will appear in the Test Result window.
The error tab contains the details responded from D3 SOAR or third-party API calls, including Failure Indicator, Status Code, and Message. This can help locate the root cause of a command failure.
Parts in Error | Description | Example |
Failure Indicator | Indicates the command failure that happened at a specific input and/or API call. | Test Connection failed. |
Status Code | The response code issued by the third-party API server or the D3 SOAR system that can be used to locate the corresponding error category. For example, if the returned status code is 401, the selected connection is unauthorized to run the command. The user or system support would need to check the permission setting in the Wiz portal. Refer to the HTTP Status Code Registry for details. | Status Code: 400. |
Message | The raw data or captured key error message from the integration API server about the API request failure. | Message: API endpoint URL is not valid in format. |
Error Sample Data Test Connection failed. Failed to check the connector. Status Code: 400. Message: API endpoint URL is not valid in format. |