
Trend Vision One v3.0
LAST UPDATED: AUG 18, 2025
Overview
Trend Vision One is a purpose-built threat defense platform that extends beyond traditional XDR solutions, allowing users to gain deeper visibility and respond more quickly to threats. Integration with Trend Vision One supports major security operations commonly used by users, such as adding file hashes to a blocklist, quarantining or deleting email messages, isolating or restoring endpoints, terminating processes, fetching events, and updating alert statuses.
D3 SOAR is providing REST operations to function with Trend Vision One v3.0.
Trend Vision One v3.0 is available for use in:
Known Limitations
Trend Vision One v3.0 enforces rate limits on API endpoints to prevent performance issues. The rate limit measures API requests within 60 seconds. Exceeding the limit results in failed requests until the rate falls below the threshold.
API Rate Limit Exceeded: Returns HTTP 429 (Too many API requests).
Request Body Size: Maximum 1 MB; exceeding this returns HTTP 413.
Request Timeout: If an API takes longer than 60 seconds to respond, HTTP 504 is returned.
Refer to API Request Limits | Trend Vision One Automation Center for detailed information.
Connection
To connect to Trend Vision One v3.0 from D3 SOAR, follow this part to collect the required information below:
Parameter | Description | Example |
Server URL | The Trend Vision One URL. | https://api.xdr.trendmicro.com |
Authentication Token | The token used for authenticating the connection. | ***** |
Permission Requirements
Each endpoint in the Trend Vision One v3.0 API requires a certain permission scope. The following are the minimum required scopes for the commands in this integration:
Command | Minimum Required Scopes |
Collect Files | Workflow And Automation
|
Disable User Accounts | Workflow And Automation
|
Enable User Accounts | Workflow And Automation
|
Fetch Event | XDR Threat Investigation
|
Force Sign Out | Workflow And Automation
|
Get ES Endpoint Details | Endpoint Security
|
List Custom Scripts | Workflow And Automation
|
List Endpoint Inventory | Endpoint Security
|
List Response Tasks | Workflow And Automation
|
Reset Passwords | Workflow And Automation
|
Scan for Malware | Workflow And Automation
|
Submit Files to Sandbox | Threat Intelligence
|
Terminate Processes | Workflow And Automation
|
Upload Custom Scripts | Workflow And Automation
|
Test Connection | Workflow And Automation
|
As Trend Vision One v3.0 is using role-based access control (RBAC), the Authentication Token is generated based on a specific user account and the application. Therefore, the command permissions are inherited from the user account’s role. Users need to configure their user profile from the Trend Vision One v3.0 console for each command in this integration.
Configuring Trend Vision One v3.0 to Work with D3 SOAR
Log into Trend Vision One v3.0.
Hover over the
 icon, then select the User Roles option.
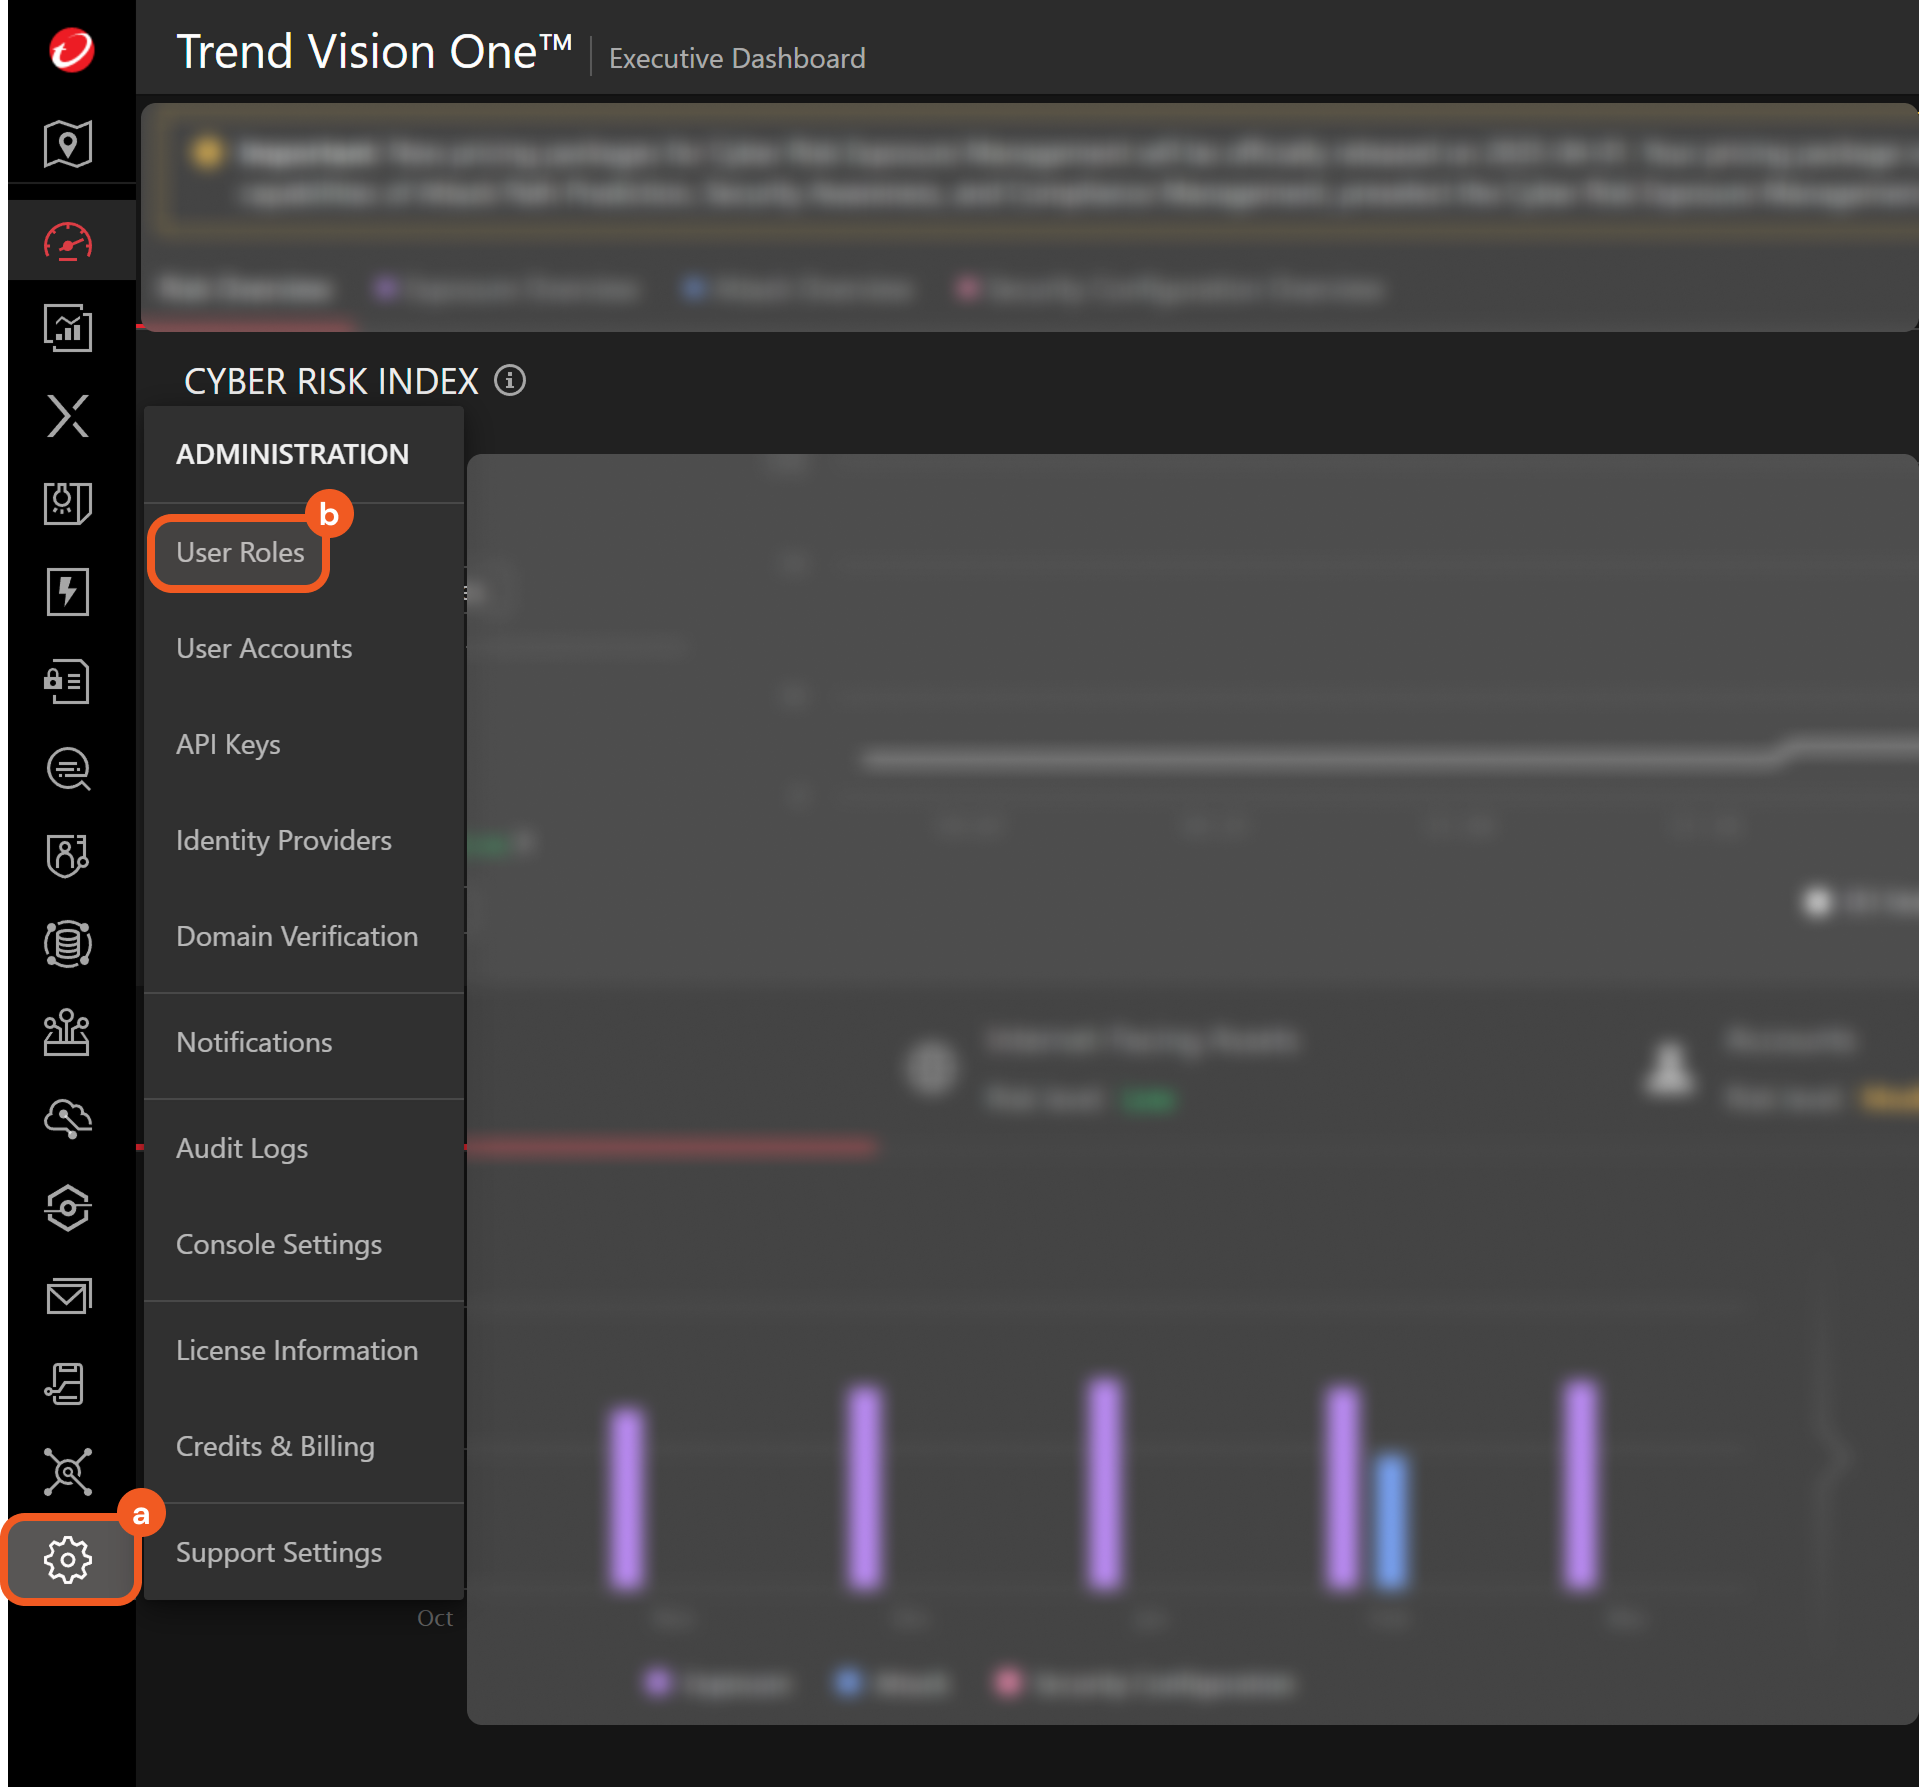
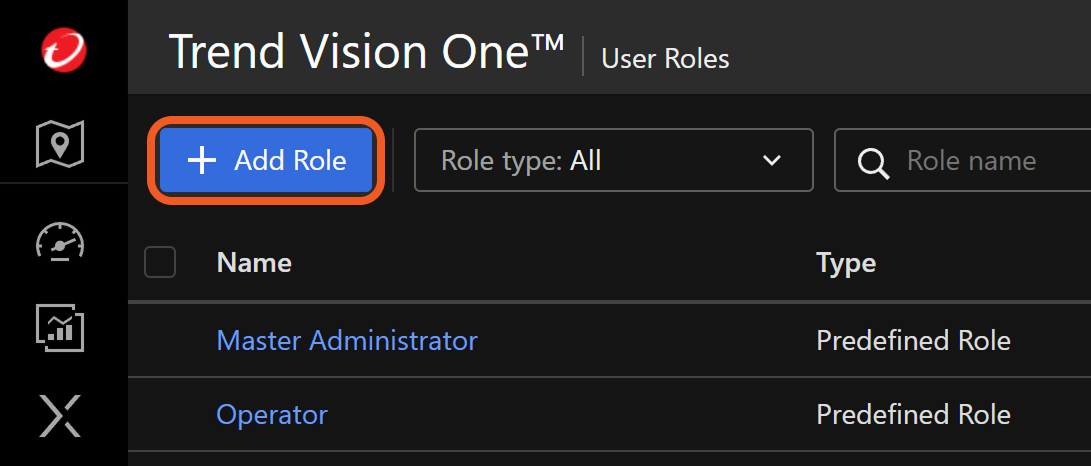
Click the Add Role button.
Name the role, then navigate to the Permissions tab.
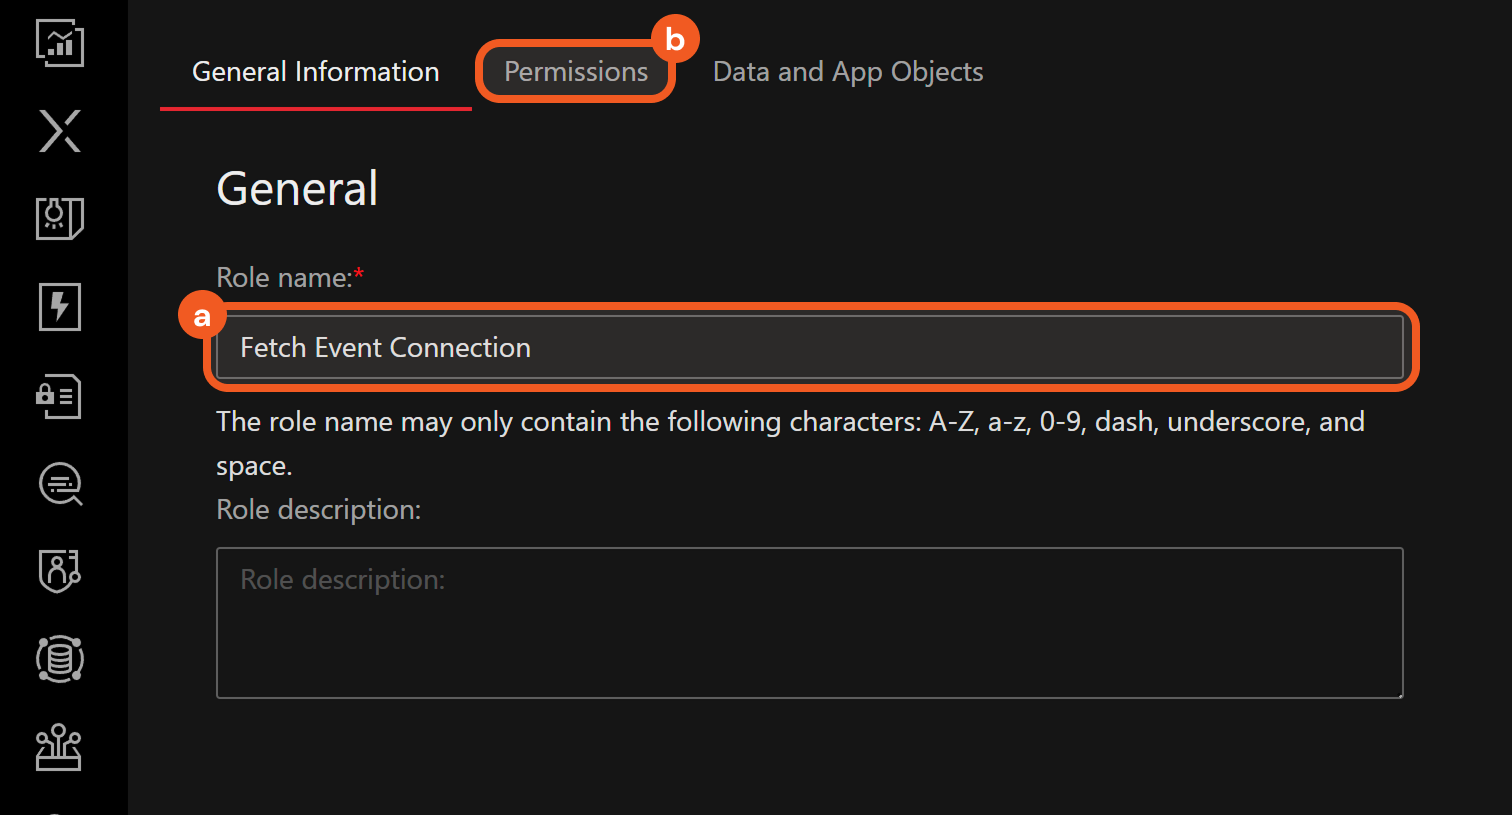
Configure the permission scopes. For example, a role with the minimum required scopes to use the Fetch Event command can be set as follows:
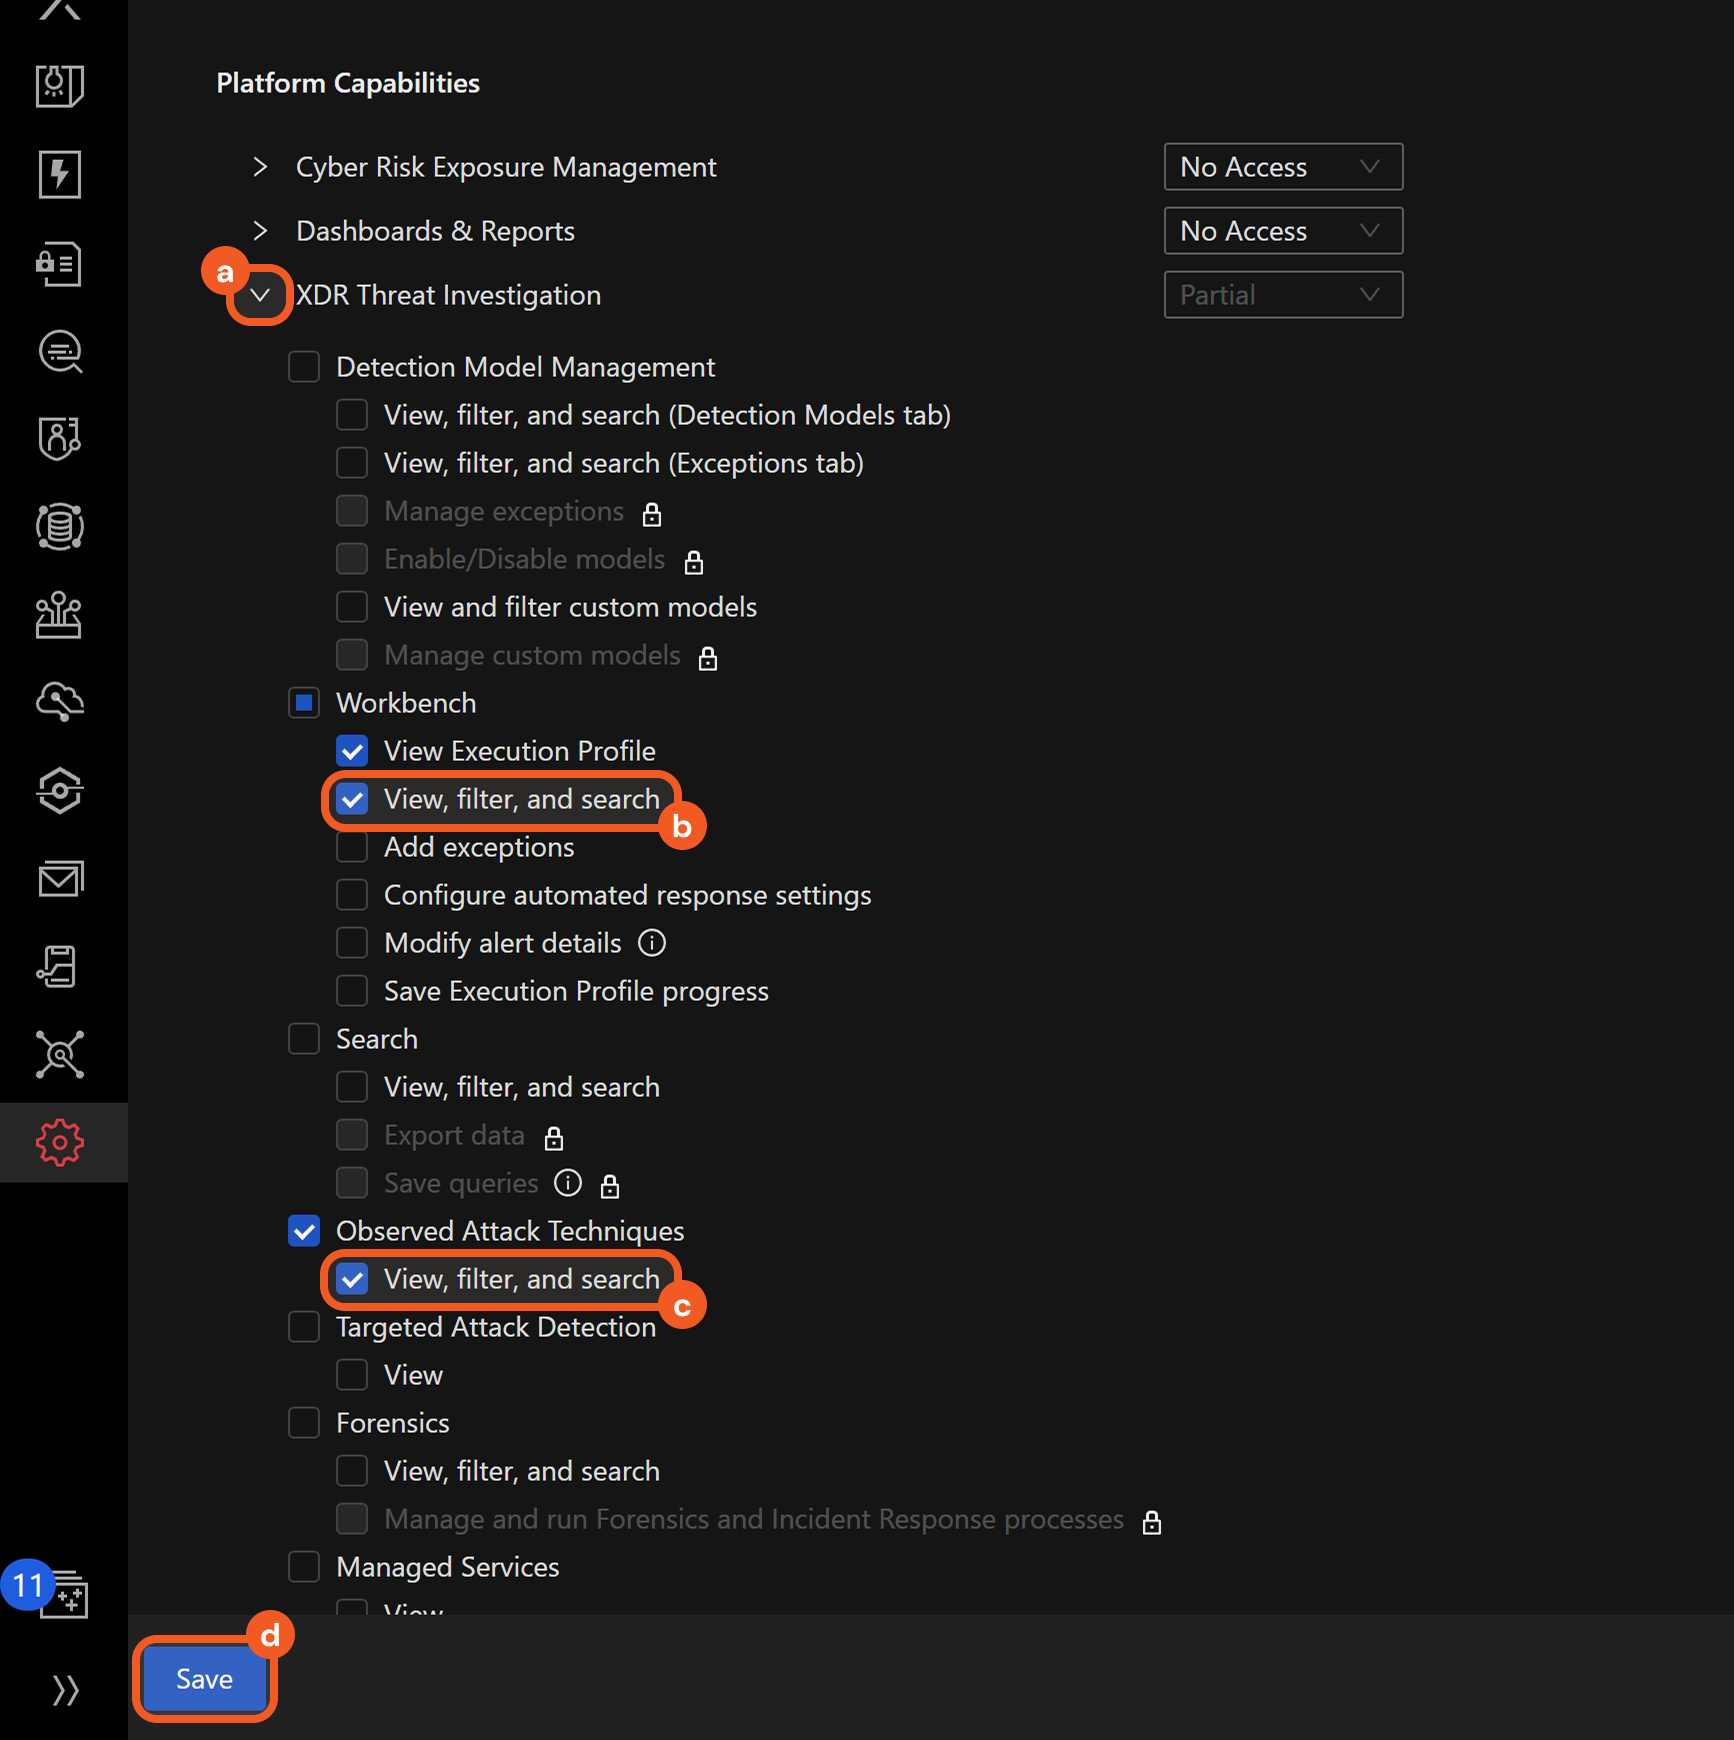
Open the XDR Threat Investigation accordion.
Select the View, filter, and search option under the Workbench section.
The View Execution Profile option is automatically checked upon selecting the View, filter, and search option.Select the View, filter, and search option under the Observed Attack Techniques section.
Click the Save button.
Hover over the
 icon, then select the API Keys option.
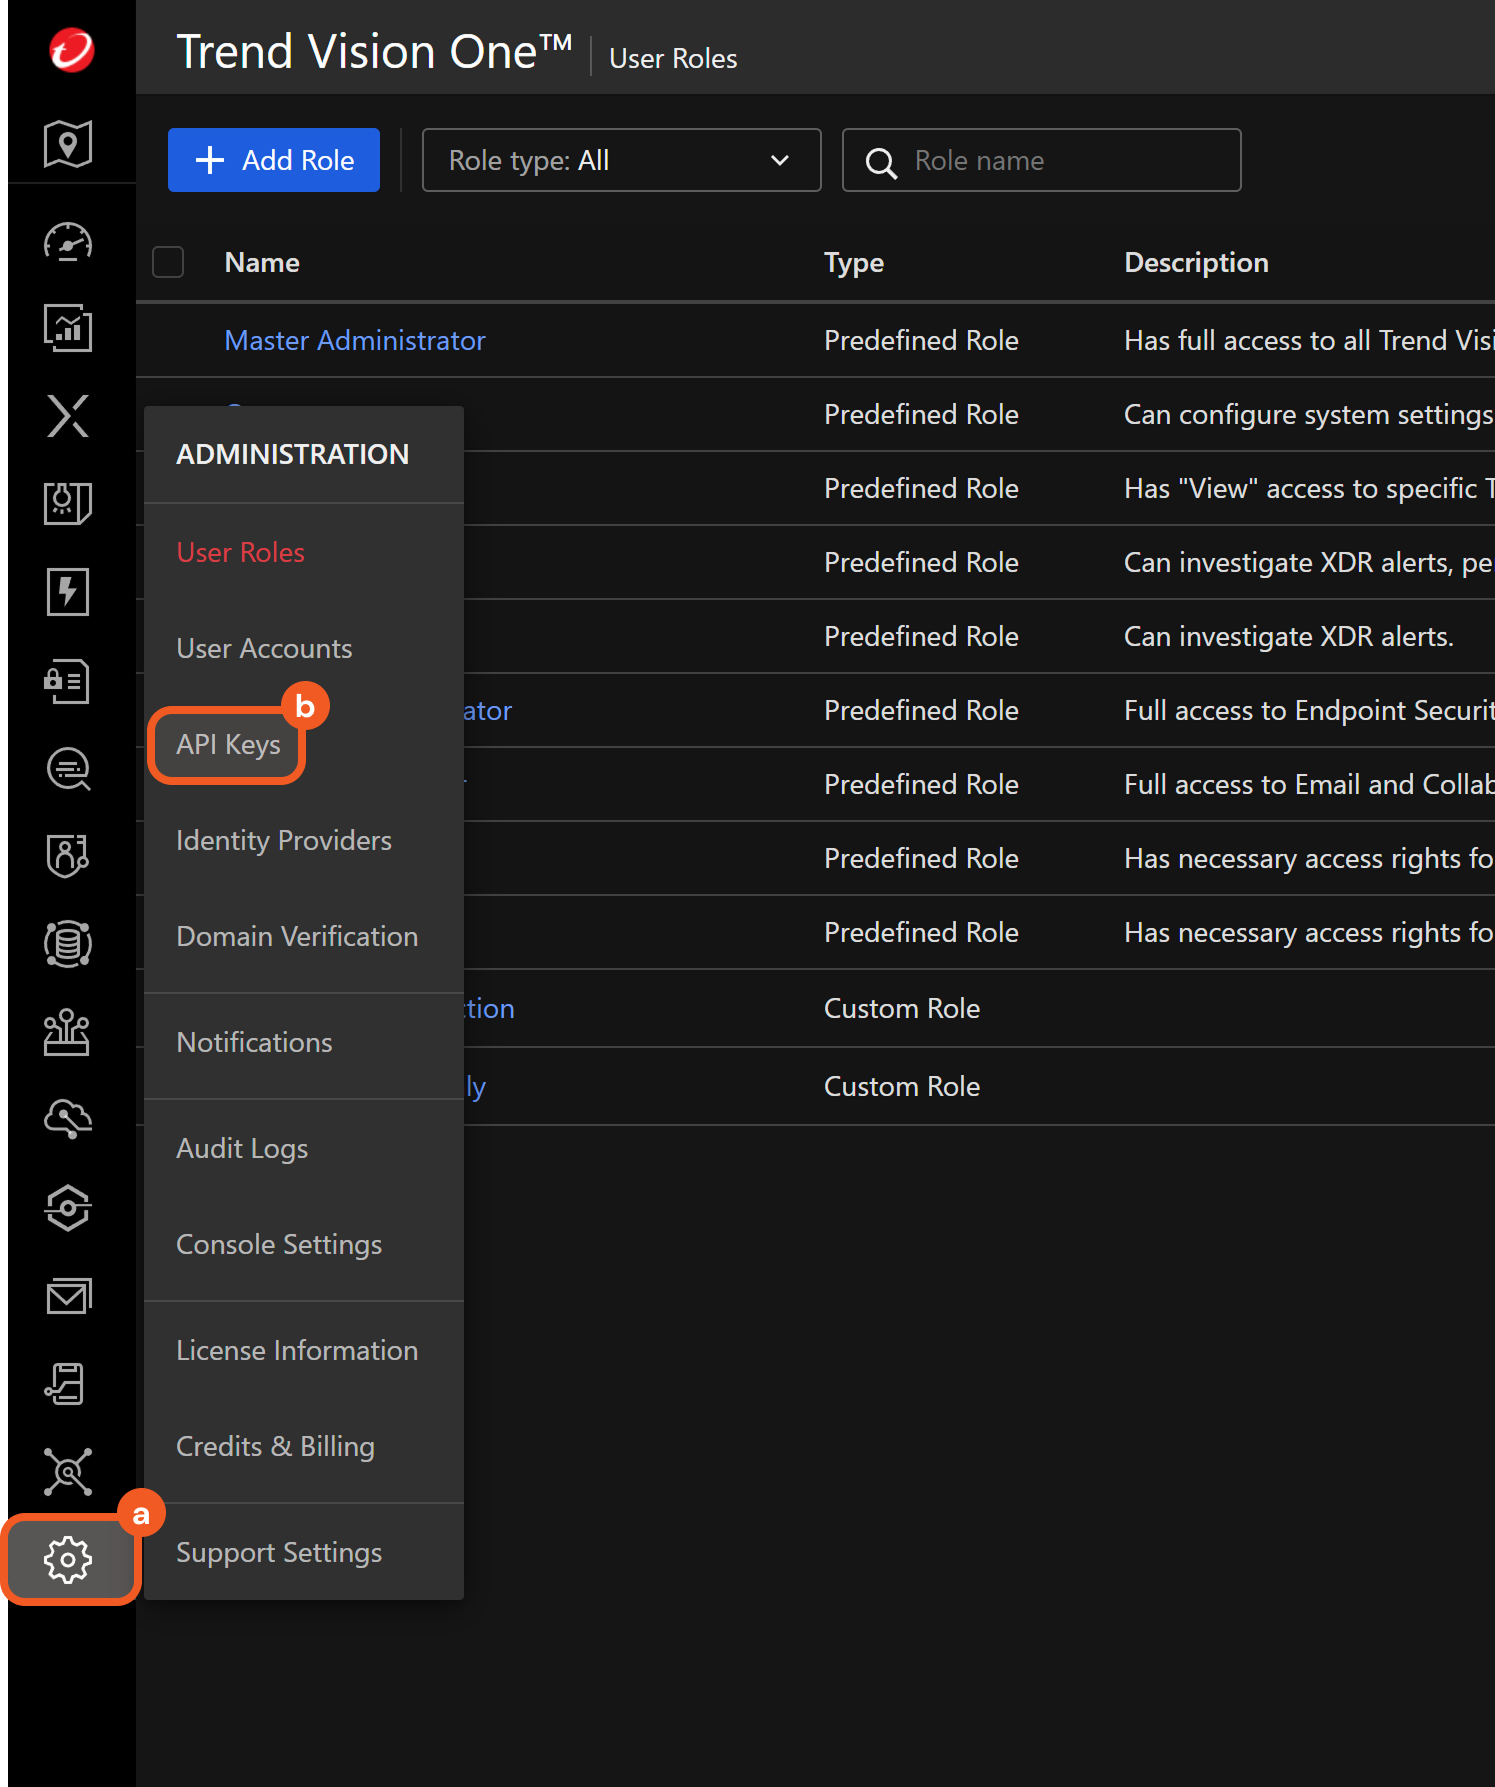
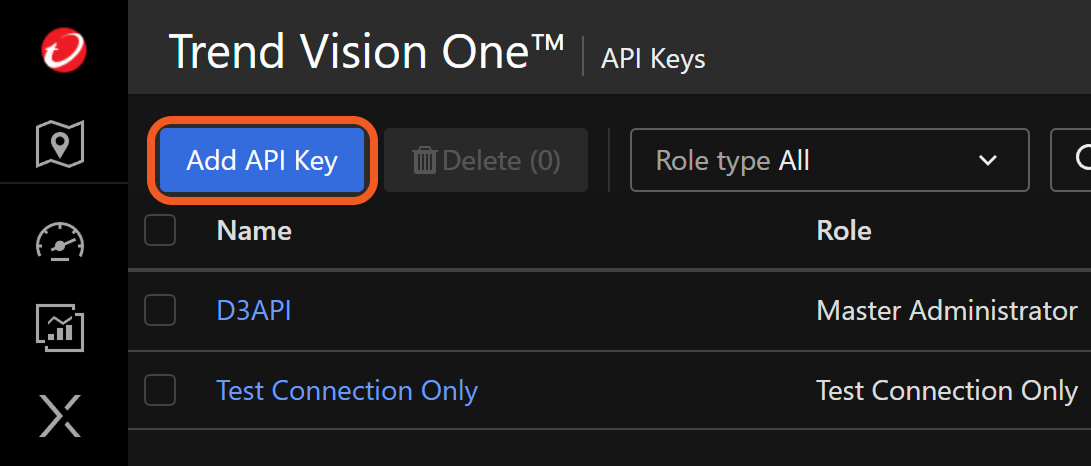
Click the Add API Key button
Fill the Add API Key form.
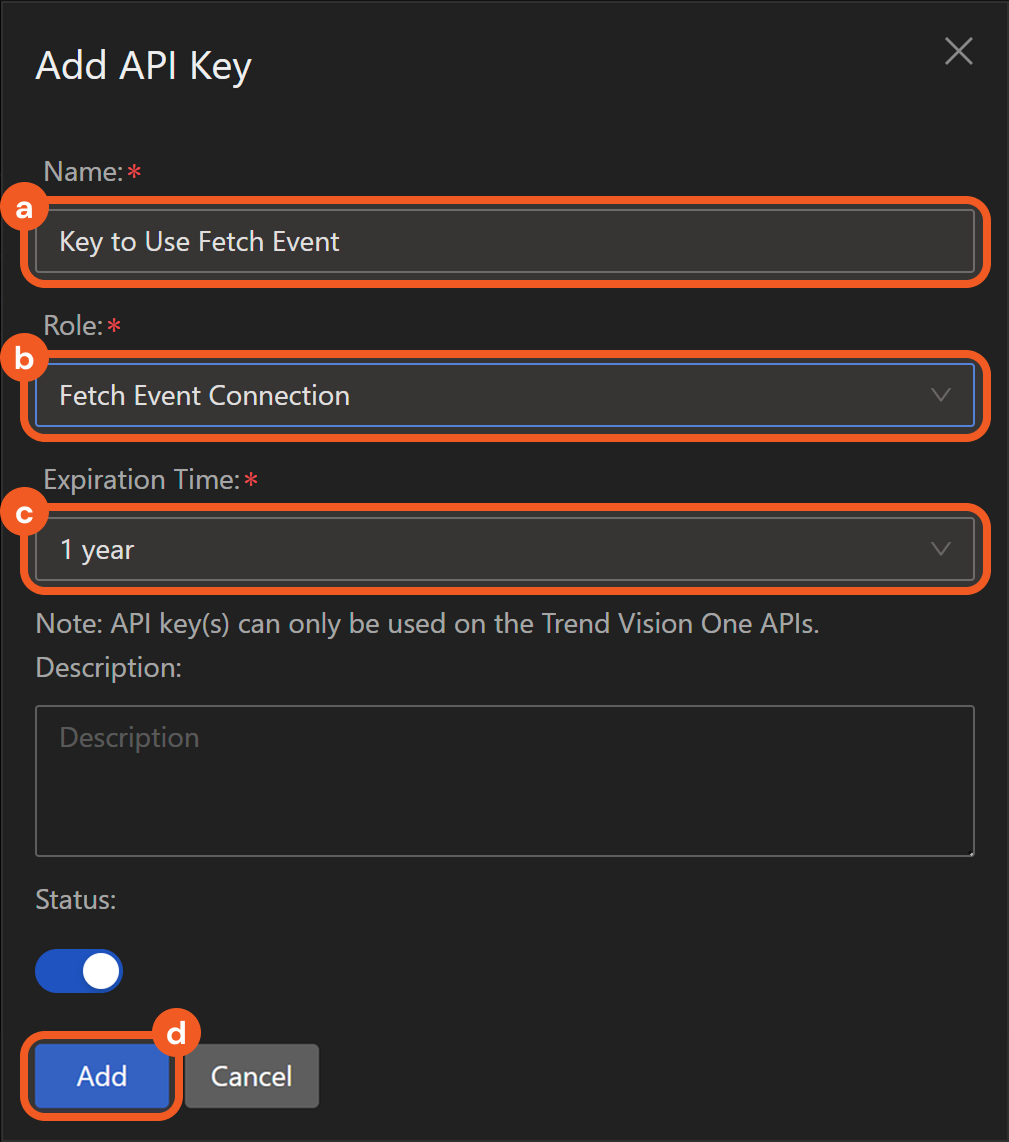
Name the key.
Select the configured role.
Set an expiration time.
Click the Add button.
Copy the API Key Value and save it in a secure location. Refer to step 3i sub-step 2 in Configuring D3 SOAR to Work with Trend Vision One v3.0.
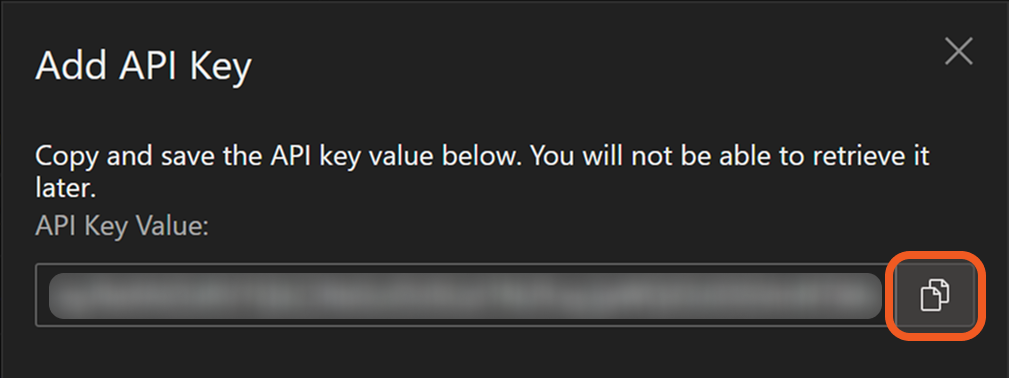
The API key value cannot be retrieved past this point.
Configuring D3 SOAR to Work with Trend Vision One v3.0
Log in to D3 SOAR.
Find the Trend Vision One v3.0 integration.
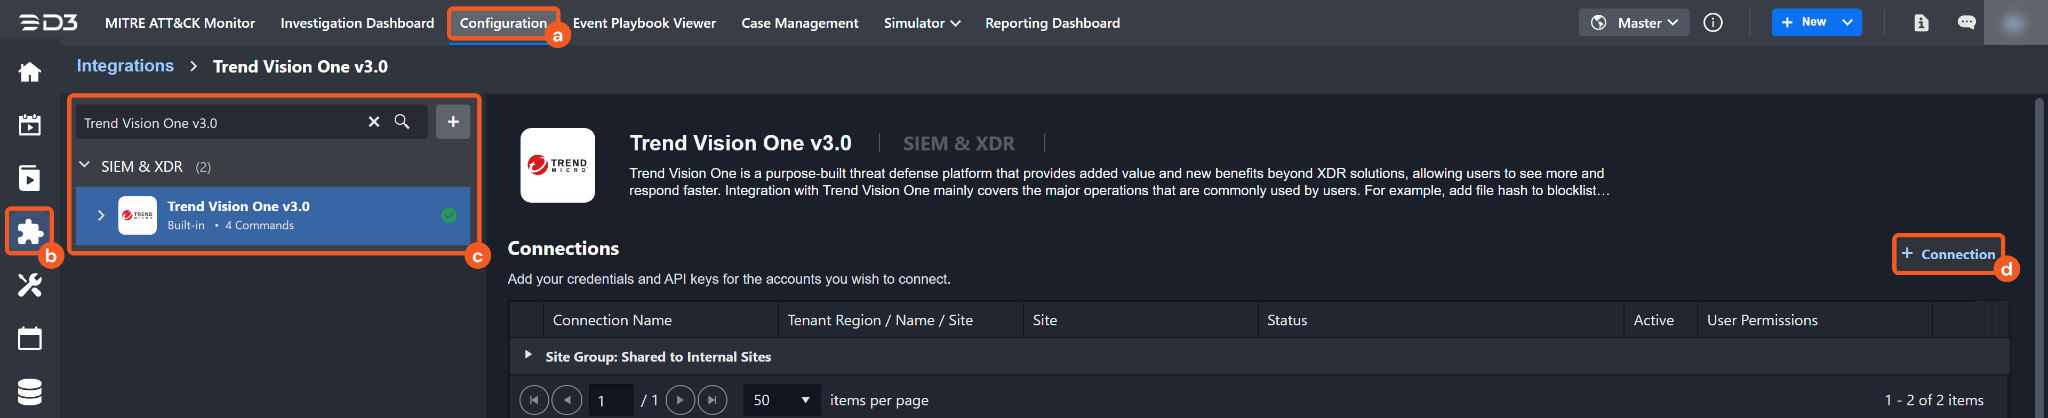
Navigate to Configuration on the top header menu.
Click on the Integration icon on the left sidebar.
Type Trend Vision One v3.0 in the search box to find the integration, then click it to select it.
Click on the + Connection button on the right side of the Connections section. A new connection window will appear.
Configure the following fields to create a connection to Trend Vision One v3.0.
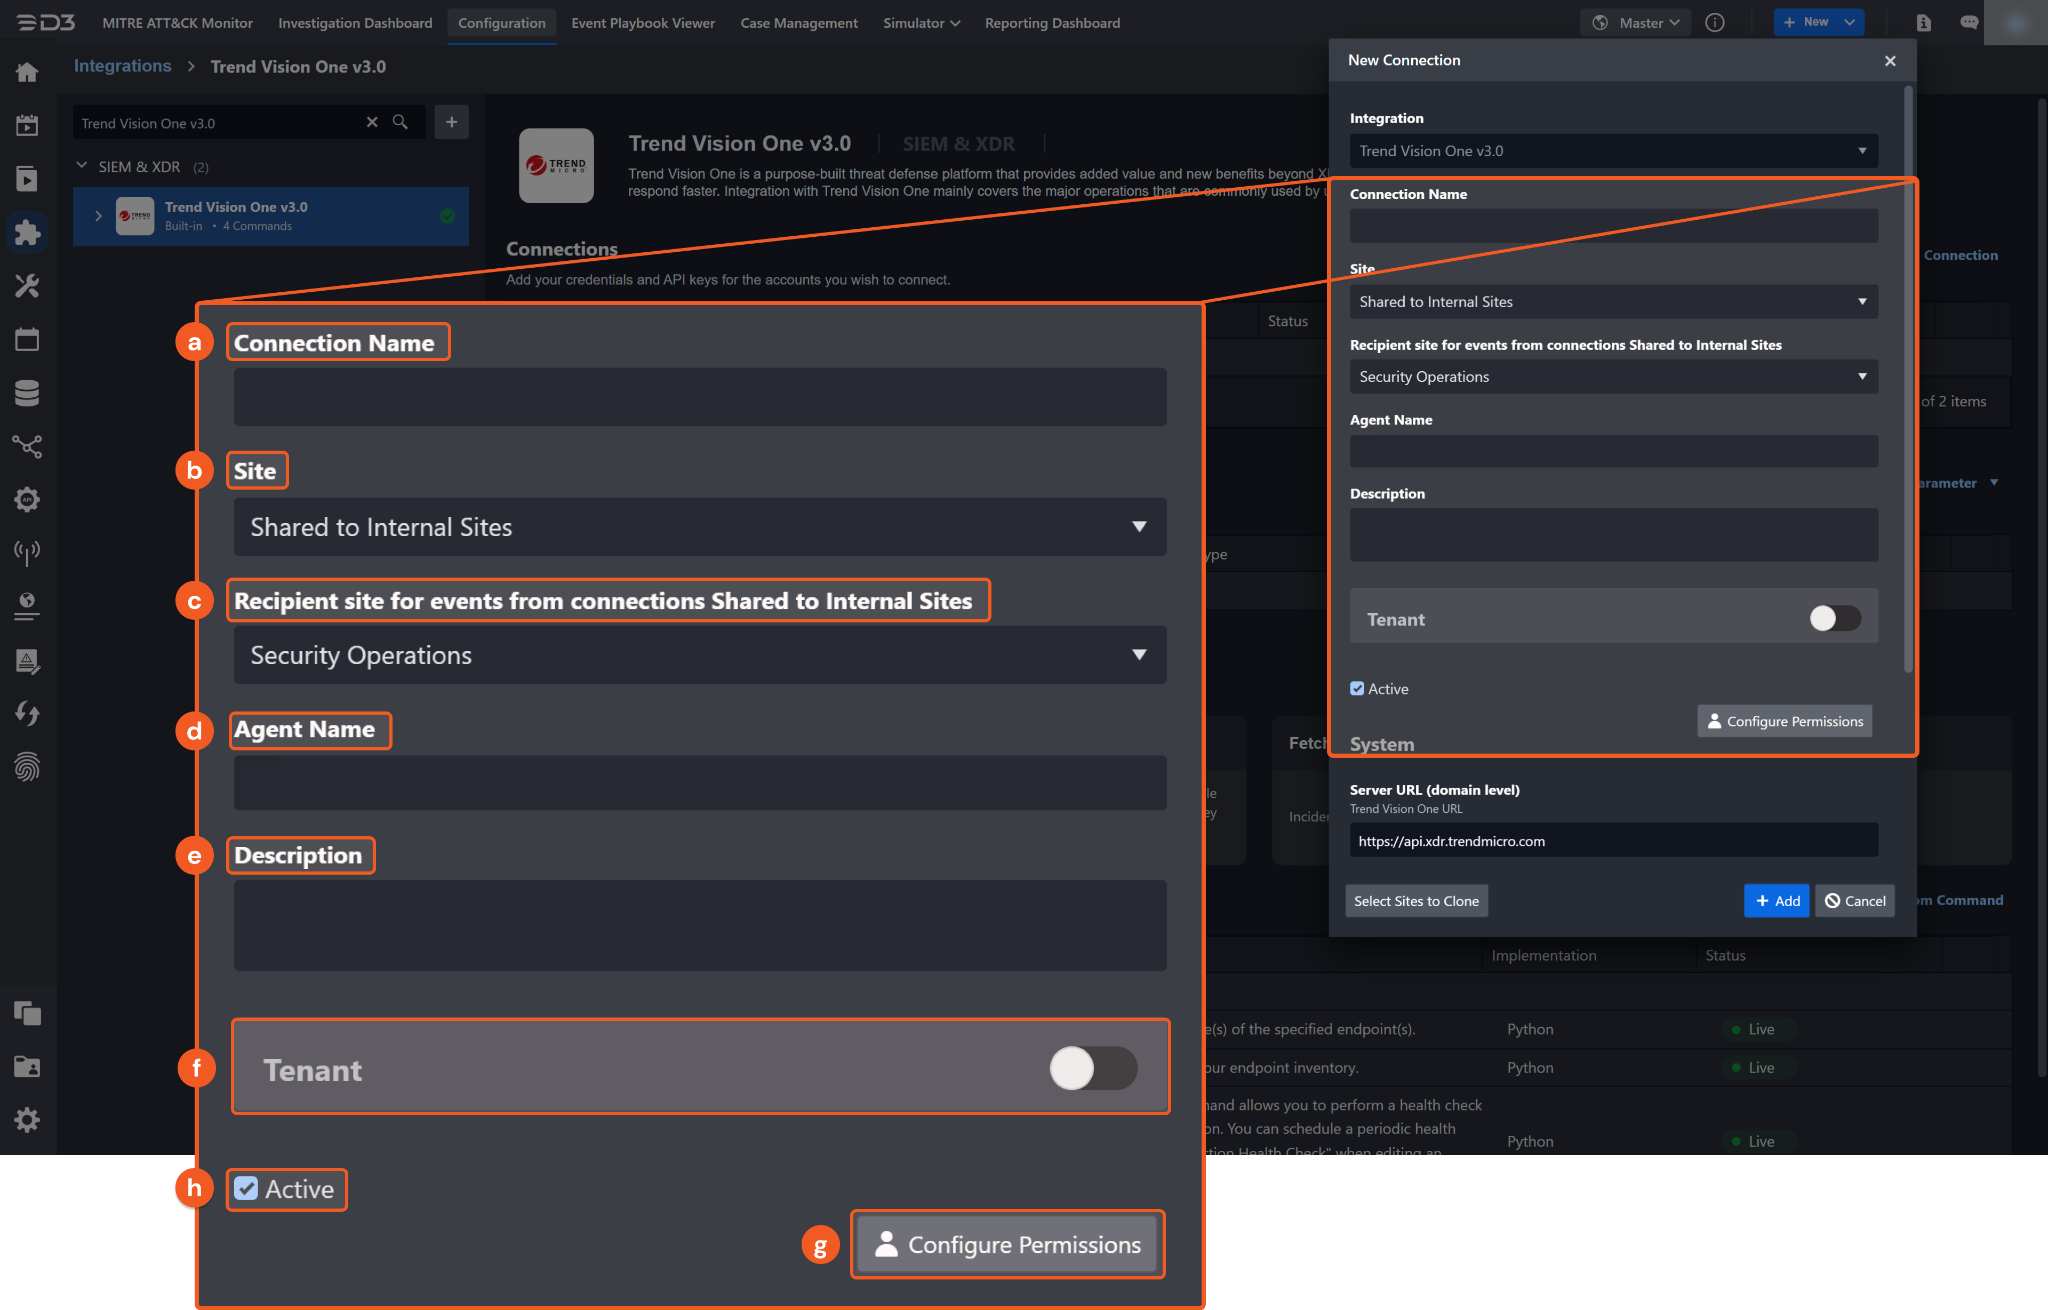
Connection Name: The desired name for the connection.
Site: Specifies the site to use the integration connection. Use the drop-down menu to select the site. The Share to Internal Sites option enables all sites defined as internal sites to use the connection. Selecting a specific site will only enable that site to use the connection.
Recipient site for events from connections Shared to Internal Sites: This field is displayed when Share to Internal Sites is selected for the Site field, allowing selection of the internal site for deploying the integration connection.
Agent Name (Optional): Specifies the proxy agent required to build the connection. Use the dropdown menu to select the proxy agent from a list of previously configured proxy agents.
Description (Optional): Add a description for the connection.
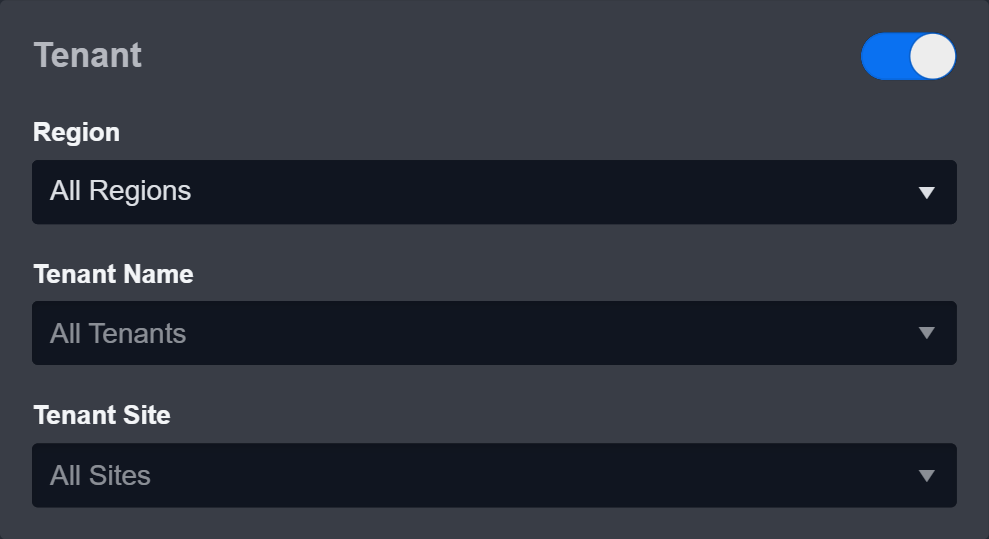
Tenant (Optional): When configuring the connection from a master tenant site, users have the option to choose the specific tenant sites to share the connection with. Once this setting is enabled, users can filter and select the desired tenant sites from the dropdowns to share the connection.
Active: Check the checkbox to ensure the connection is available for use.
Configure User Permissions: Defines which users have access to the connection.
System: This section contains the parameters defined specifically for the integration. These parameters must be configured to create the integration connection.
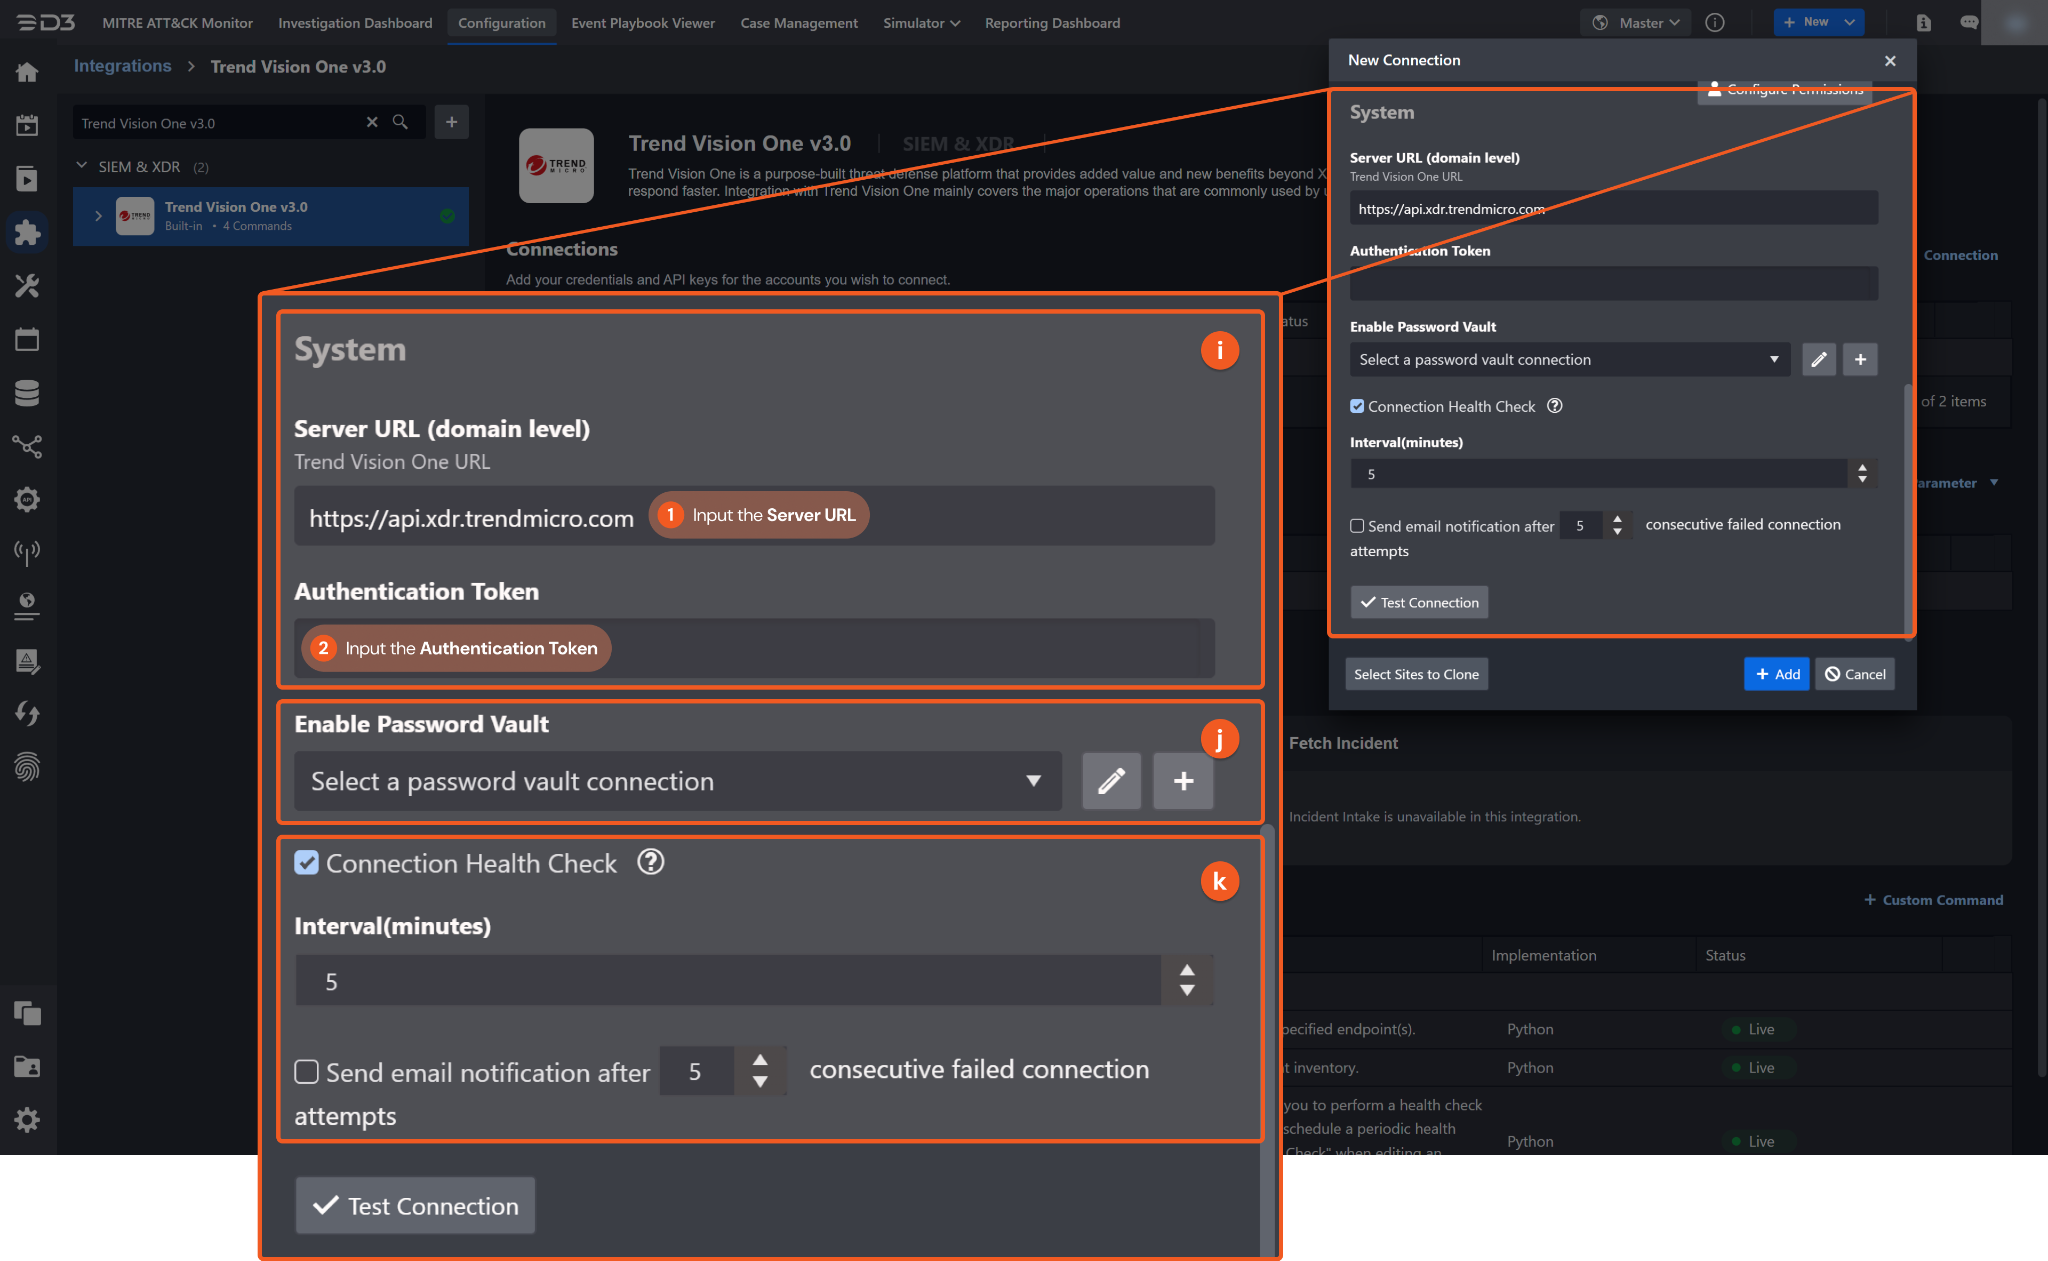
1. Input the Server URL. The default value is https://api.xdr.trendmicro.com.
2. Copy the Authentication Token from the Trend Vision One v3.0 platform. Refer to step 9 of Configuring Trend Vision One v3.0 to Work with D3 SOAR.
Connection Health Check: Periodically checks the connection status by scheduling the Test Connection command at the specified interval (in minutes). Available only for active connections, this feature also allows configuring email notifications for failed attempts.
Enable Password Vault: An optional feature that allows users to take the stored credentials from their own password vault. Refer to the password vault connection guide if needed.
Test the connection.
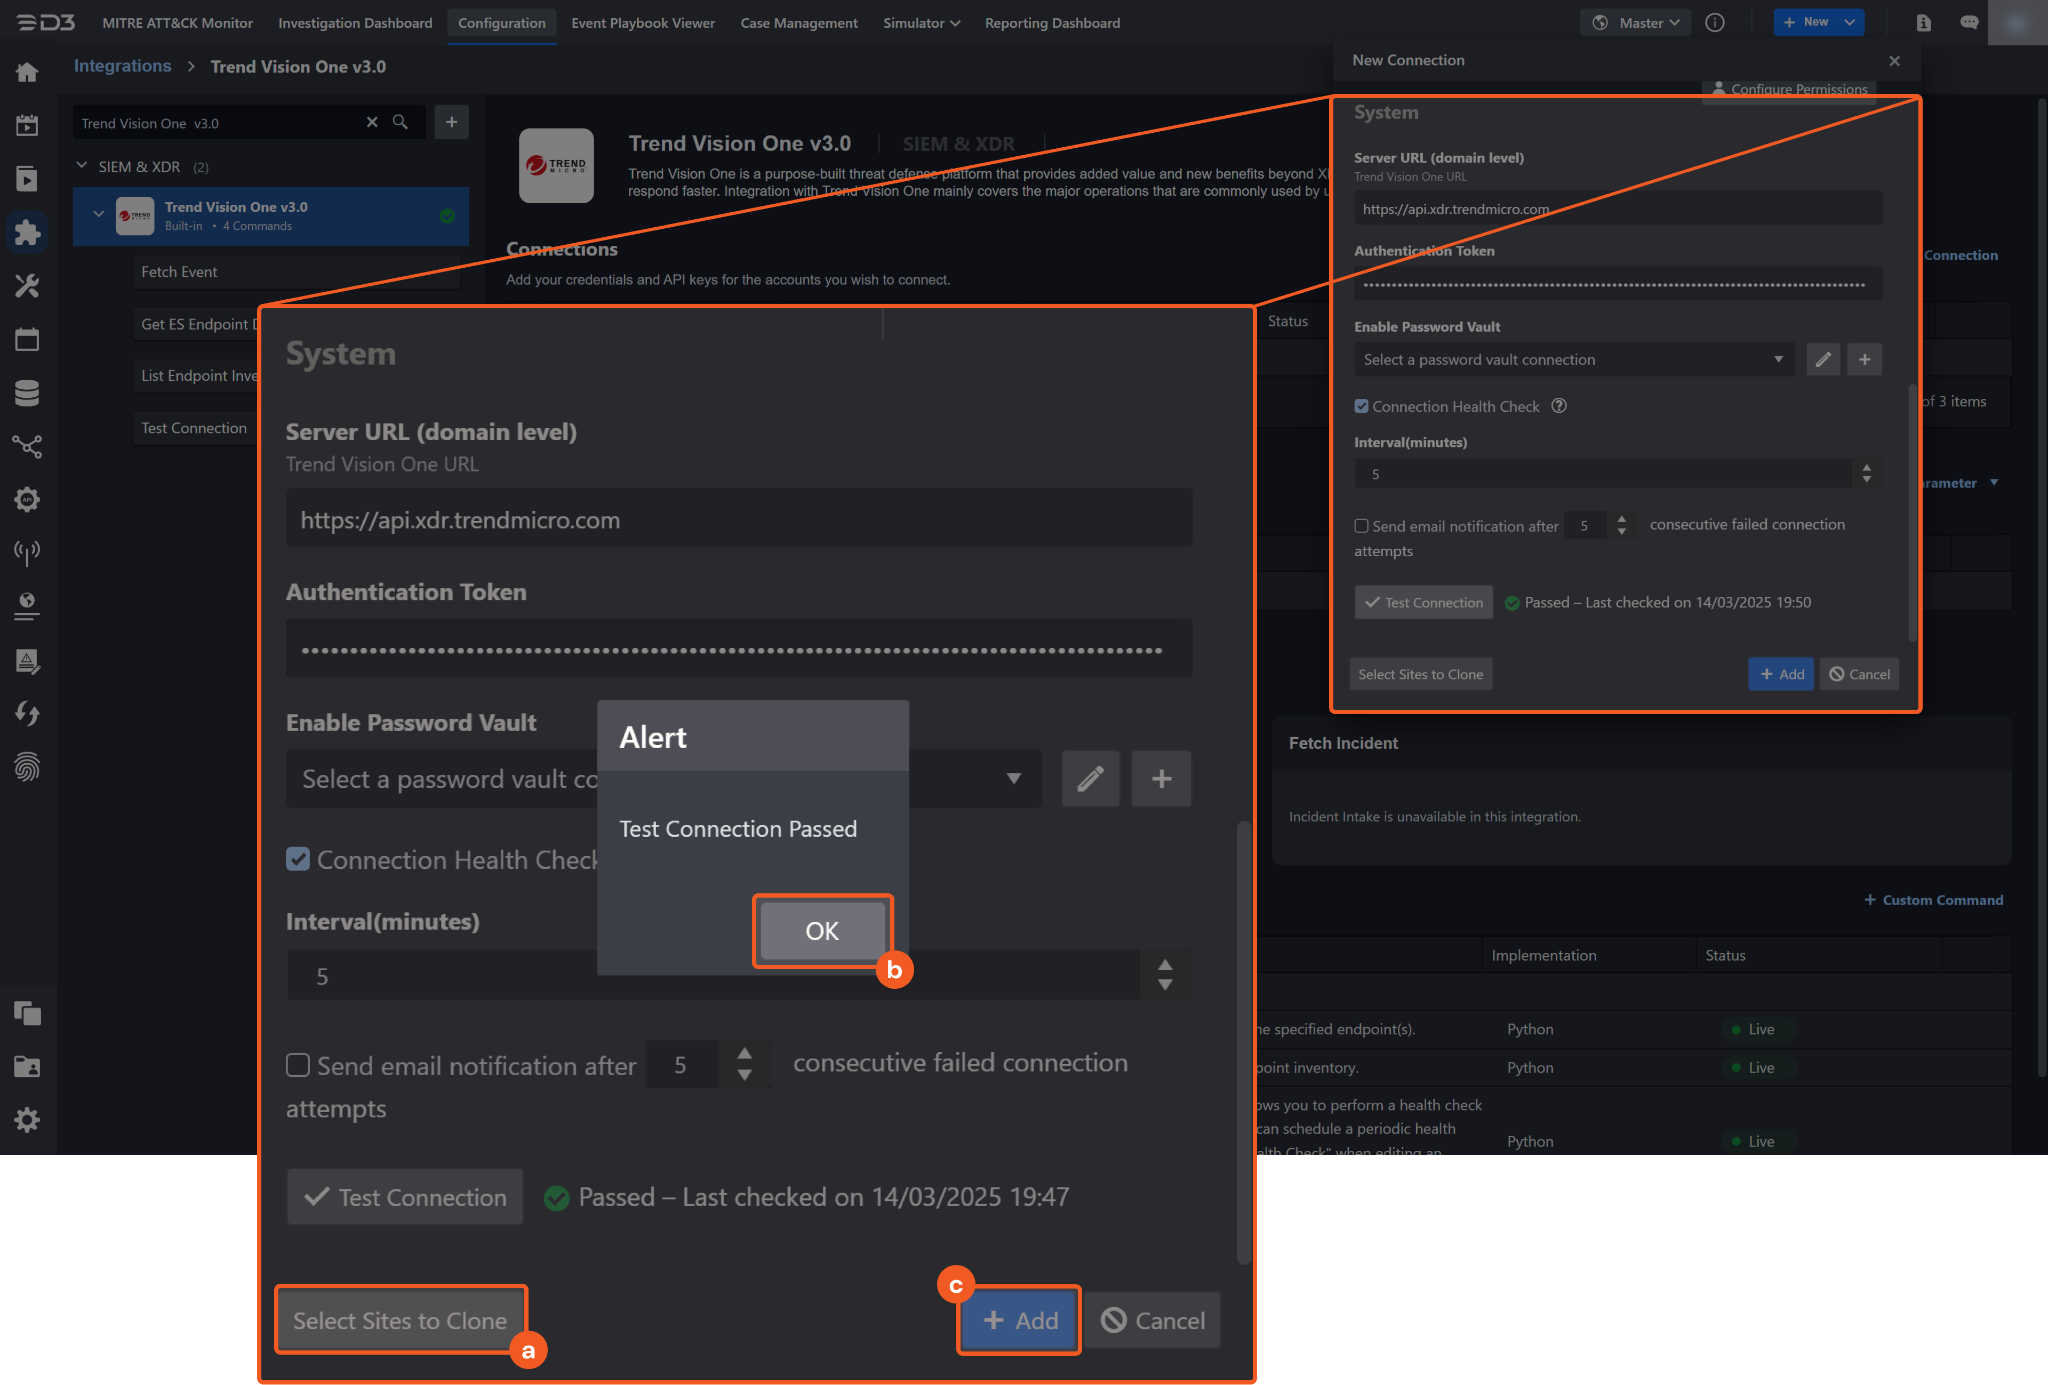
Click on the Test Connection button to verify credentials and connectivity. A success alert displays Passed with a green checkmark. If the connection fails, review the parameters and retry.
Click OK to close the alert window.
Click + Add to create and add the configured connection.
Commands
Trend Vision One v3.0 includes the following executable commands for users to set up schedules or create playbook workflows. With the Test Command function, users can execute these commands independently for playbook troubleshooting.
Integration API Note
For more information about the Trend Vision One v3.0 API, refer to the Trend Vision One v3.0 API reference.
READER NOTE
Certain permissions are required for each command. Refer to the Permission Requirements and Configuring Trend Vision One v3.0 to Work with D3 SOAR sections for details.
Note for Time-related parameters
The input format of time-related parameters may vary based on user account settings, which may cause the sample data in commands to differ from what is displayed. To adjust the time format, follow these steps:
Navigate to Configuration Application Settings. Select Date/Time Format.
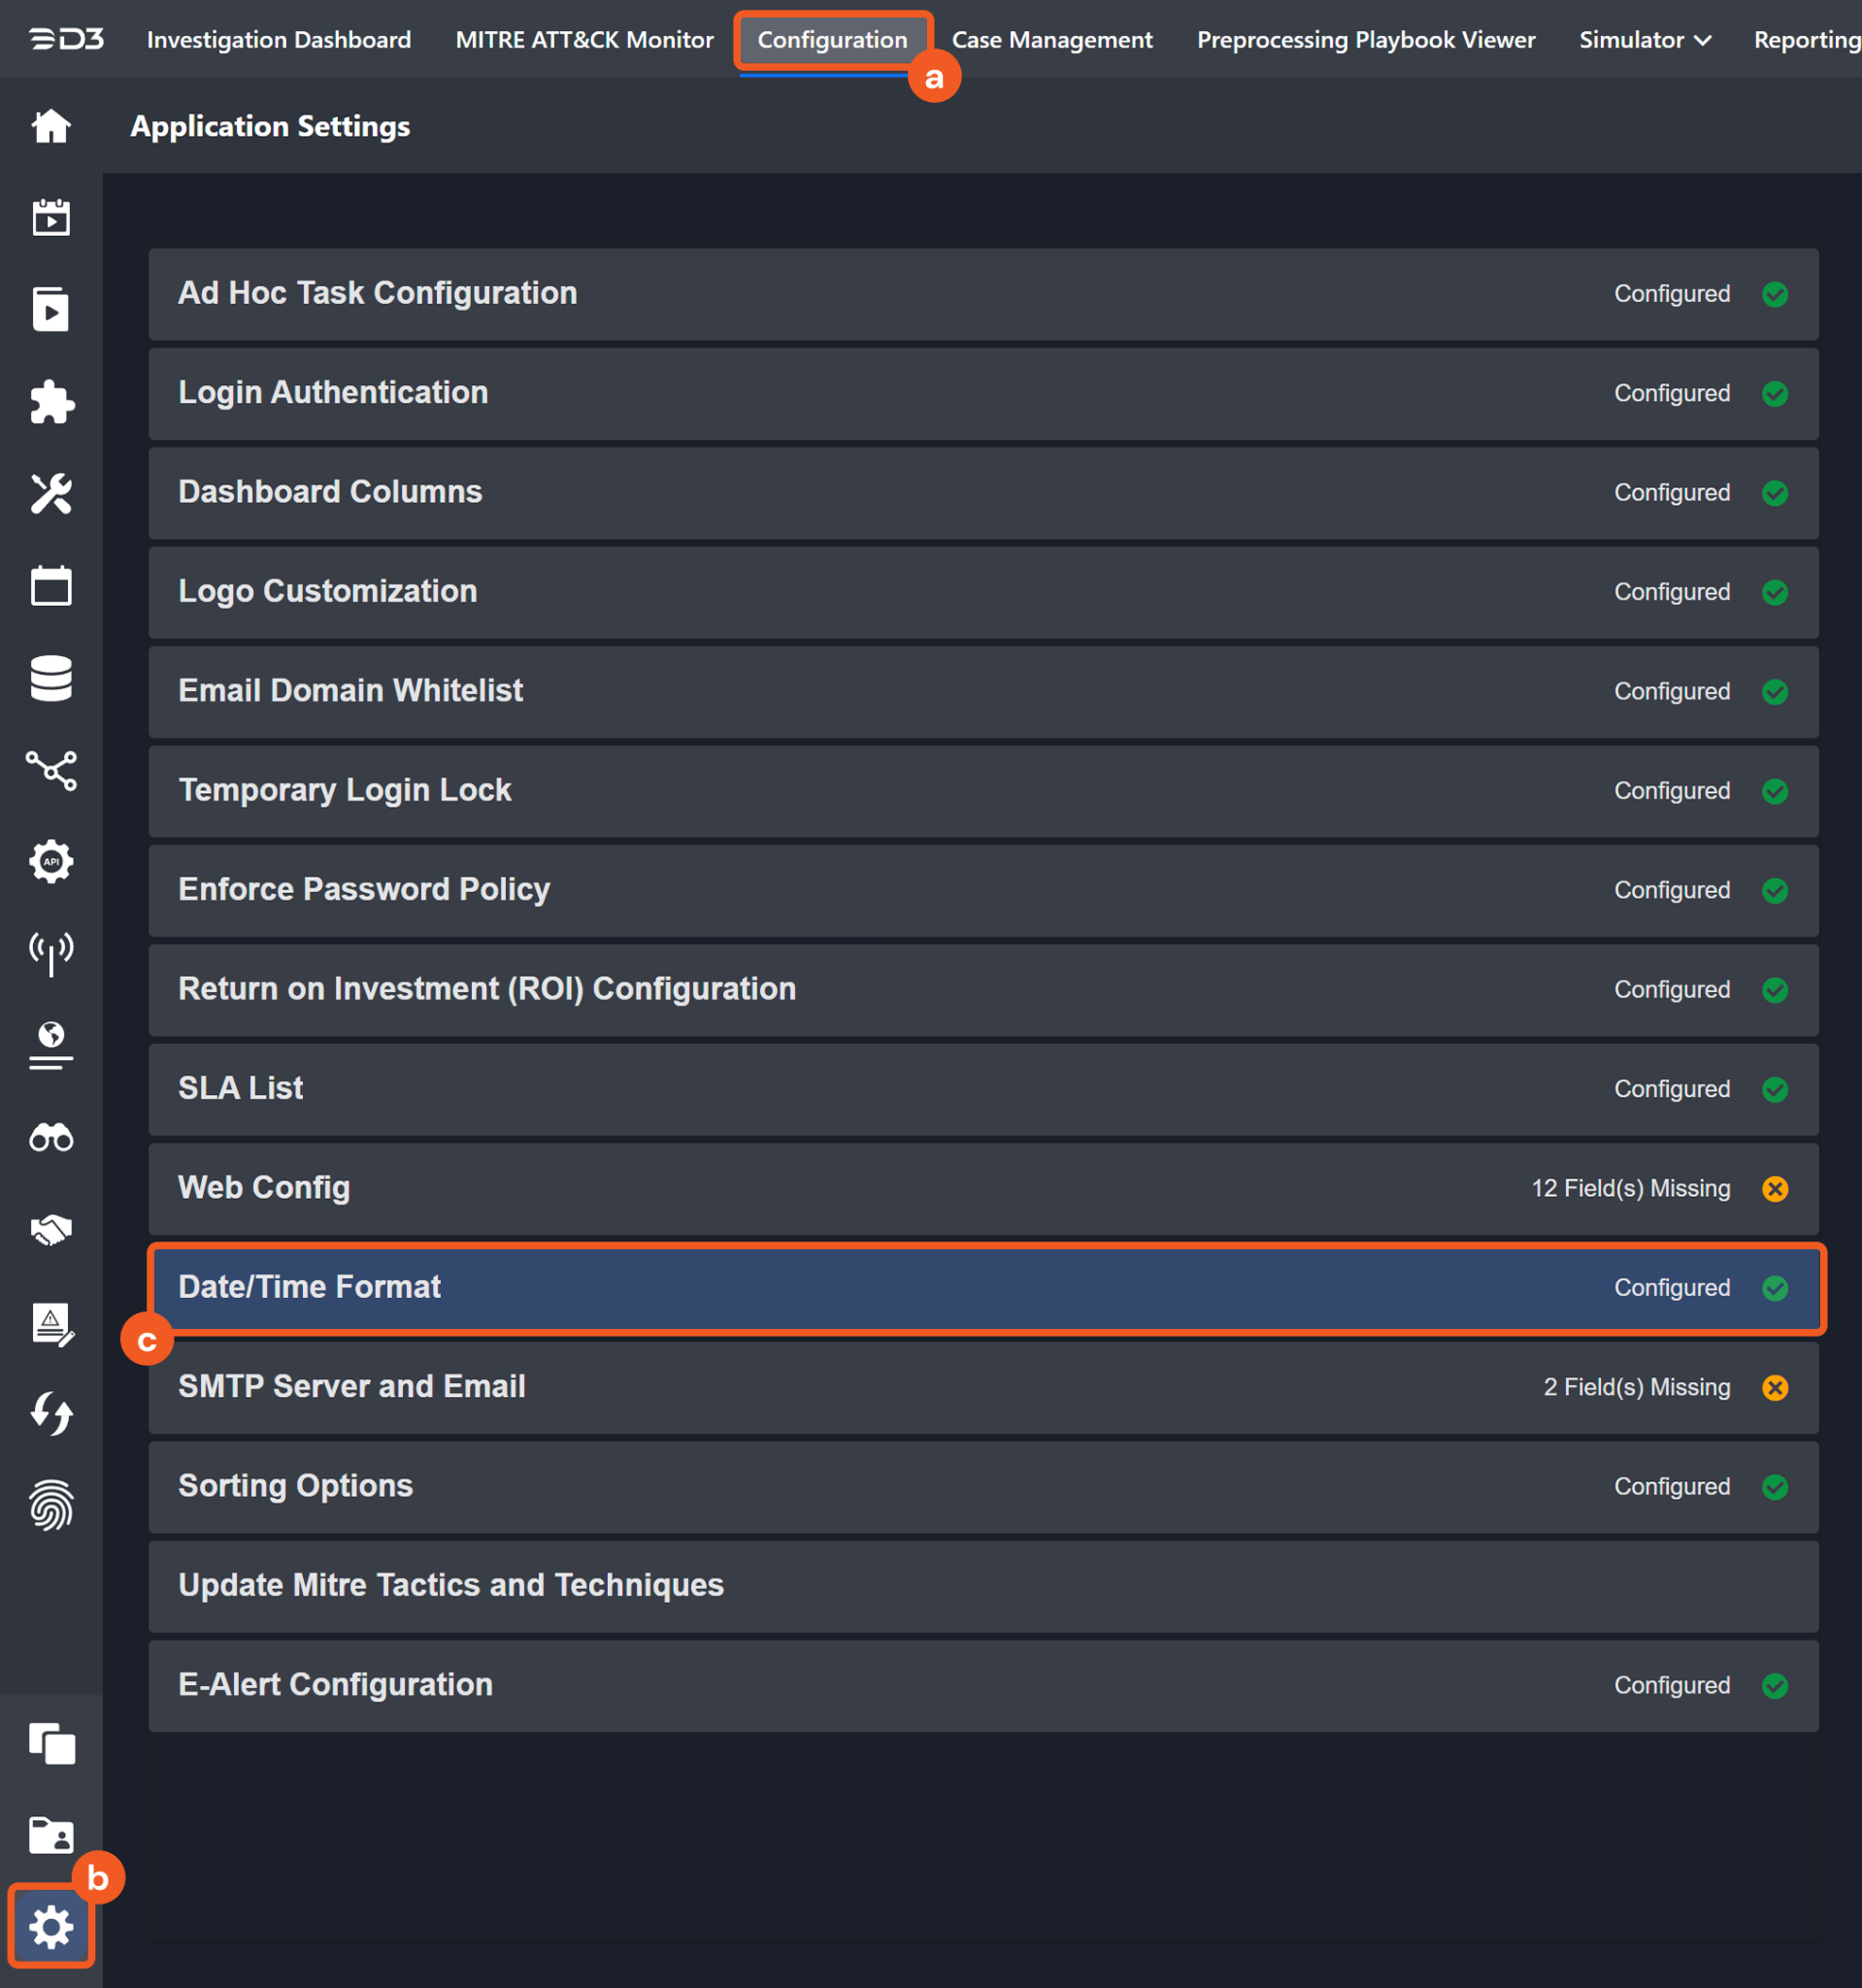
Choose the desired date and time format, then click on the Save button.
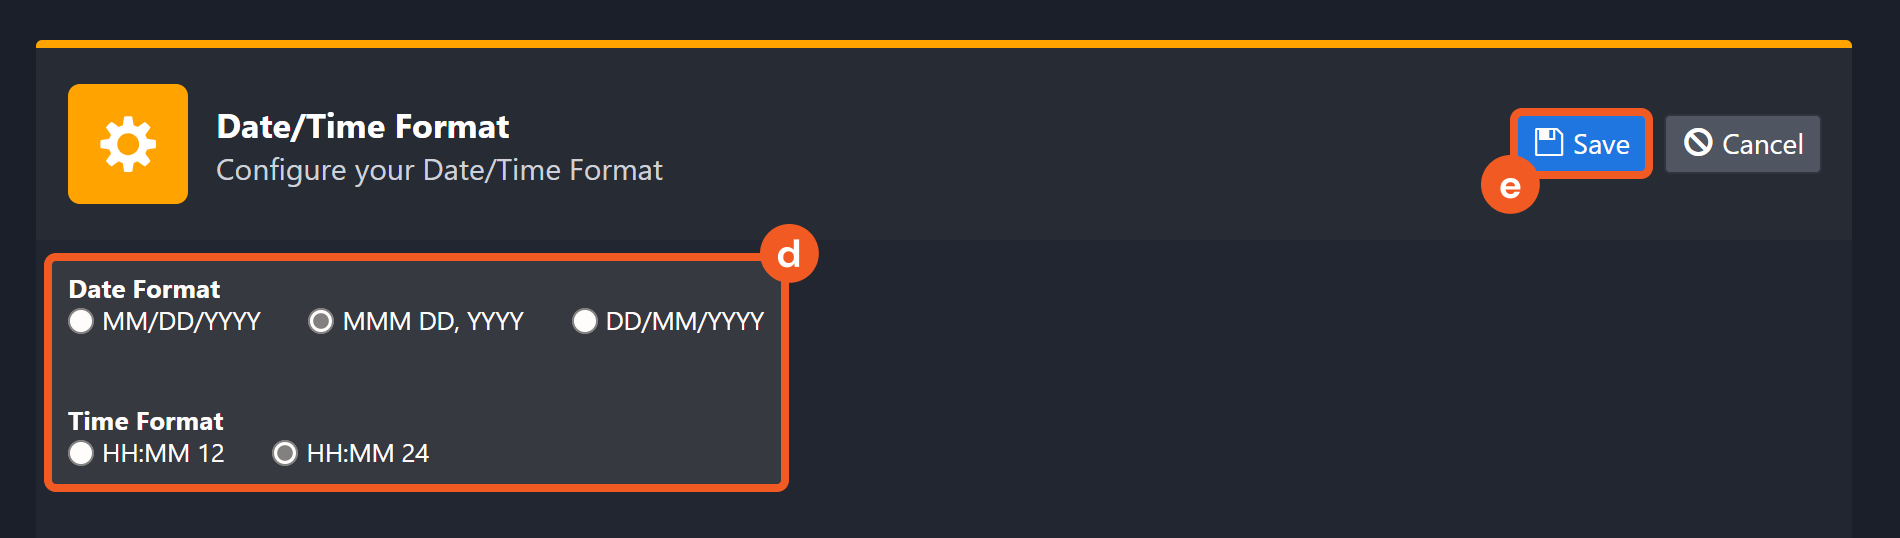
The selected time format will now be visible when configuring Date/Time command input parameters.
Collect Files
Collects files from one or more endpoints and transfers them to Trend Vision One in a password-protected archive. The command returns when the agent fails to complete the tasks within 2 minutes of task creation.
READER NOTE
Endpoint Agent GUIDs is a required parameter to run this command.
Run the List Endpoint Inventory command to obtain the Endpoint Agent GUIDs. Endpoint Agent GUIDs can be found in the raw data at $.items[*].agentGuid.
Input
Input Parameter | Required/Optional | Description | Example |
Endpoint Agent GUIDs | Required | The agent GUIDs of the endpoints from which to collect files. The Endpoint Agent GUIDs can be obtained from the List Endpoint Inventory command. |
JSON
|
File Paths | Required | The paths of the files on the specified endpoints to be collected. |
JSON
|
Description | Optional | The description of the file collection task. This description applies to all files specified in the task. | collectFile task description 20230510e |
Output
To view the sample output data for all commands, refer to this article.
Error Handling
If the Return Data displays Partially Successful or Failed, an Error tab will appear in the Test Result window.
The error tab contains the details responded from D3 SOAR or third-party API calls, including Failure Indicator, Status Code, and Message. This can help locate the root cause of a command failure.
Parts in Error | Description | Example |
Failure Indicator | Indicates the command failure that happened at a specific input and/or API call. | Collect Files failed. |
Status Code | The response code issued by the third-party API server or the D3 SOAR system that can be used to locate the corresponding error category. For example, if the returned status code is 401, the selected connection is unauthorized to run the command. The user or system support would need to check the permission setting in the Trend Vision One v3.0 portal. Refer to the HTTP Status Code Registry for details. | Status Code: 400. |
Message | The raw data or captured key error message from the integration API server about the API request failure. | Message: Invalid request. |
Error Sample Data Collect Files failed. Status Code: 400. Message: Invalid request. |
Disable User Accounts
Signs specified users out of all active application and browser sessions, and prevents the users from signing in to any new sessions. The currently supported IAM systems are Azure AD and Active Directory (on-premises).
Input
Input Parameter | Required/Optional | Description | Example |
User Account Names | Required | The account names of the users to be disabled. |
JSON
|
Description | Optional | The description for the account disabling task. The description applies to all user accounts. | DisableAccount task description 20230514c |
Output
To view the sample output data for all commands, refer to this article.
Error Handling
If the Return Data displays Partially Successful or Failed, an Error tab will appear in the Test Result window.
The error tab contains the details responded from D3 SOAR or third-party API calls, including Failure Indicator, Status Code, and Message. This can help locate the root cause of a command failure.
Parts in Error | Description | Example |
Failure Indicator | Indicates the command failure that happened at a specific input and/or API call. | Disable User Accounts failed. |
Status Code | The response code issued by the third-party API server or the D3 SOAR system that can be used to locate the corresponding error category. For example, if the returned status code is 401, the selected connection is unauthorized to run the command. The user or system support would need to check the permission setting in the Trend Vision One v3.0 portal. Refer to the HTTP Status Code Registry for details. | Status Code: 400. |
Message | The raw data or captured key error message from the integration API server about the API request failure. | Message: Invalid request. |
Error Sample Data Disable User Accounts failed. Status Code: 400. Message: Invalid request. |
Enable User Accounts
Allows the users to sign in to new application and browser sessions. The currently supported IAM systems are Azure AD and Active Directory (on-premises).
Input
Input Parameter | Required/Optional | Description | Example |
User Account Names | Required | The account names of the users to be enabled. |
JSON
|
Description | Optional | The description for the account enabling task. The description applies to all user accounts. | EnableAccount task description 20230514d |
Output
To view the sample output data for all commands, refer to this article.
Error Handling
If the Return Data displays Partially Successful or Failed, an Error tab will appear in the Test Result window.
The error tab contains the details responded from D3 SOAR or third-party API calls, including Failure Indicator, Status Code, and Message. This can help locate the root cause of a command failure.
Parts in Error | Description | Example |
Failure Indicator | Indicates the command failure that happened at a specific input and/or API call. | Enable User Accounts failed. |
Status Code | The response code issued by the third-party API server or the D3 SOAR system that can be used to locate the corresponding error category. For example, if the returned status code is 401, the selected connection is unauthorized to run the command. The user or system support would need to check the permission setting in the Trend Vision One v3.0 portal. Refer to the HTTP Status Code Registry for details. | Status Code: 400. |
Message | The raw data or captured key error message from the integration API server about the API request failure. | Message: Invalid request. |
Error Sample Data Enable User Accounts failed. Status Code: 400. Message: Invalid request. |
Fetch Event
Returns Workbench Alerts or Observed Attack Techniques Events from the Trend Vision One platform.
READER NOTE
Endpoint Host Names is an optional parameter to run this command.
Run the List Endpoint Inventory command to obtain the Endpoint Host Names. Endpoint Host Names can be found in the raw data at the path $.items[*].endpointName.
Instead of using tolerance scope, it is recommended to check the Initiate the buffer time of the Data Reacquire for [x] minutes after completing the event fetch checkbox when setting up a new Data Ingestion schedule.
Navigate to Configuration > Data Ingestion, then select the Event Intake tab.
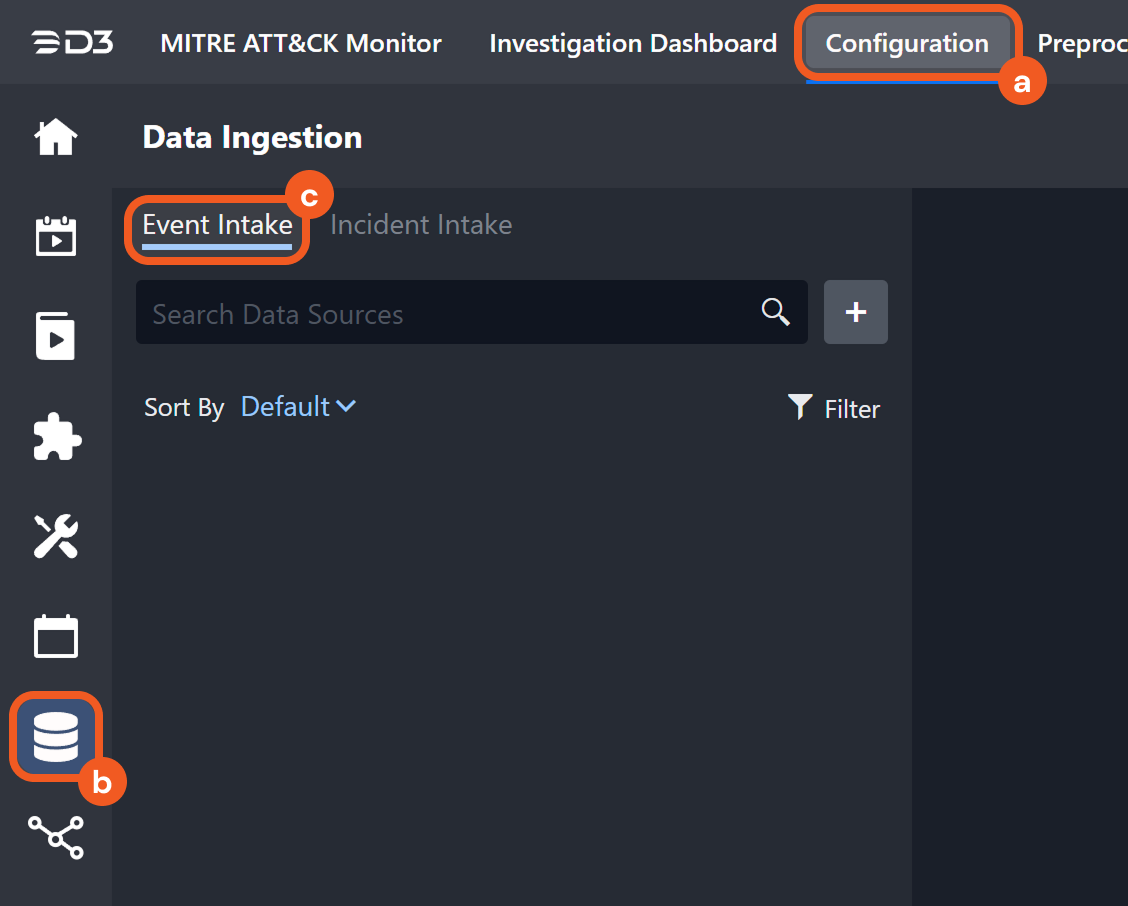
Add a New Schedule Data Source for the Trend Vision One 3.0 Integration and check the Initiate the buffer time of the Data Reacquire for [x] minutes after completing the event fetch checkbox. Optionally, adjust the buffer time as necessary.
.png?inst-v=a9107af0-b04c-4e31-bb5a-938372783868)
Input
Input Parameter | Required/Optional | Description | Example |
Event Type | Required | The type of events to return. Available options are:
| Observed Attack Techniques Event |
Start Time | Required | The start of the data retrieval range (in UTC). For Observed Attack Techniques events, the data retrieval time range cannot be greater than 365 days. | 2023-05-08 00:00:00 |
End Time | Optional | The end of the data retrieval range (in UTC). Ensure that End Time is not earlier than Start Time. By default, the value is the current time. | 2023-05-11 00:00:00 |
Query Time Type | Required | The field used to apply Start Time and End Time. Available options are:
For Workbench Alerts, choose Created Date Time or Updated Date Time. For Observed Attack Techniques events, choose Detected Date Time or Ingested Date Time. | Observed Attack Techniques Event-Detected Date Time |
Number of Event(s) Fetched | Optional | The maximum number of the most recent events to retrieve. Available options are:
By default, all events that match the filter criteria will be returned. | 50 |
Status | Optional | This parameter applies only to Workbench Alerts. Filters alerts by status. Available options are:
By default, all alerts regardless of their status will be returned. | Open |
Alert Provider | Optional | This parameter applies only to Workbench Alerts. Filters alerts by source. Available options are:
By default, all alerts regardless of their source will be returned. | SAE |
Severity | Optional | This parameter applies to both Workbench Alerts and Observed Attack Techniques Events. Filters by the severity assigned to a model that triggered the alert or the risk level assigned to a detection. Available options are:
By default, all events regardless of their severity or risk level will be returned. | High |
Endpoint Host Names | Optional | This parameter applies only to Observed Attack Techniques Events. Filters Observed Attack Techniques events by the host names of the endpoints. Host names can be obtained using the List Endpoint Inventory command. |
JSON
|
Mitre Tactic IDs | Optional | This parameter applies only to Observed Attack Techniques Events. Filters events by the IDs of associated MITRE ATT&CK tactics. Events will be returned if they match at least one of the specified IDs. If multiple IDs are provided, events associated with any ID not in the input list will be excluded. |
JSON
|
Mitre Technique IDs | Optional | This parameter applies only to Observed Attack Techniques events. Filters events by the IDs of associated MITRE ATT&CK techniques or sub-techniques. |
JSON
|
Search Condition | Optional | This parameter applies to both Workbench Alerts and Observed Attack Techniques Events. Filters events using a custom filter statement when the predefined filter parameters do not meet the user's requirements. For example:
| filterName eq 'System-Defined Event Logs Clearing via Wevtutil' |
Tolerance Scope | Optional | A time window (in minutes) that extends the time range for fetching events by subtracting from the specified start time. Tolerance scope helps prevent data loss by accounting for API response delays caused by temporary server-side data unavailability—arising from processing and synchronization—from the vendor. With the tolerance scope applied, events will be fetched within the range of (Start Time - Tolerance Scope) to End Time. By default, the tolerance scope is set to 0. | 0 |
Output
To view the sample output data for all commands, refer to this article.
Fetch Event Field Mapping
Fetch Event commands require event field mapping. Field mapping plays a key role for data normalization within the event pipeline. Field mapping converts the original data fields from the different providers to standardized D3 fields as defined by the D3 Model. Refer to Event and Incident Intake Field Mapping for details.
To add a custom field, click on the + Add Field button. Users can also remove built-in field mappings by clicking x. Note that two underscore characters will automatically prefix the defined Field Name as the System Name for a custom field mapping. Additionally, if an input Field Name contains any spaces, they will automatically be replaced with underscores for the corresponding System Name.
As a system integration, the Trend Vision One v3.0 integration has some pre-configured field mappings for default field mapping.
Default Event Source
The Default Event Source is the default set of field mappings that are applied when this fetch event command is executed. For out-of-the-box integrations, users will find a set of field mappings provided by the system. Default event source provides field mappings for common fields from the fetched data. The default event source has a "Main Event JSON Path" (i.e. $.items) that is used to extract a batch of events from the response raw data. View the "Main Event JSON Path" by clicking on the Edit Event Source button.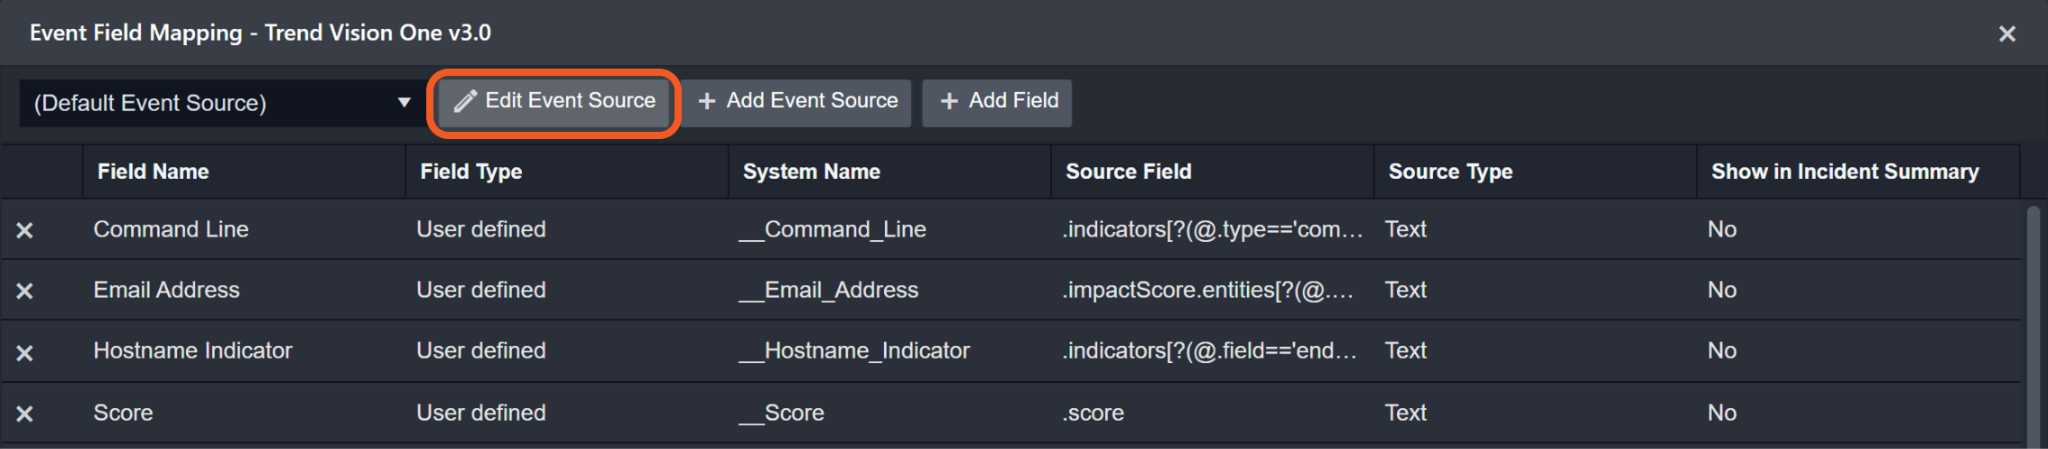
Main Event JSON Path: $.items
The Main Event JSON Path determines the root path where the system starts parsing raw response data into D3 event data. The JSON path begins with $, representing the root element. The path is formed by appending a sequence of child elements to $, each separated by a dot (.). Square brackets with nested quotation marks ([‘...’]) should be used to separate child elements in JSON arrays.
For example, the root node of a JSON Path is items. The child node denoting the Event Type field would be model. Putting it together, the JSON Path expression to extract the Event Type is $.items.model.
The pre-configured field mappings are detailed below:
Field Name | Source Field |
Default | |
Email Address | .impactScore.entities[?(@.entityType=='emailAddress')].entityValue |
Command Line | .indicators[?(@.type=='command_line' && @.field=='objectCmd')].value |
Hostname Indicator | .indicators[?(@.field=='endpointHostName')].value |
Score | .score |
Document ID | .id |
Device IP address | .impactScore.entities[?(@.entityType=='host')].entityValue.ips |
Event Type | .model |
File Hash SHA256 | .indicators[?(@.type=='file_sha256'].value |
Filepath | .indicators[?(@.type=='fullpath' && @.field=='objectFilePath')].value |
File Hash SHA1 | .indicators[?(@.type=='file_sha1'].value |
Hostname | .impactScore.entities[?(@.entityType=='host')].entityValue.name |
Description | .description |
Process command line | .indicators[?(@.type=='command_line' && @.field=='processCmd')].value |
Process file path | .indicators[?(@.type=='fullpath' && @.field=='processFilePath')].value |
Start Time | .createdDateTime |
Parent process commandline | .indicators[?(@.type=='command_line' && @.field=='parentCmd')].value |
Source | .alertProvider |
Status | .status |
Sub Event | .matchedRules[*].matchedFilters[*].matchedEvents[*].uuid |
Severity | .severity |
Techniques | .matchedRules[*].matchedFilters[*].mitreTechniqueIds |
Username | .impactScore.entities[?(@.entityType=='account')].entityValue |
Observed Attack Techniques Event (Search String: {$.eventType}=oatEvent) | |
Agent GUID | .endpoint.agentGuid |
toRecipients | .detail.mailToAddresses |
Username | .filters[*].highlightedObjects[?(@.field=='logonUser' && @.type=='user_account')].value |
Source IP address | .filters[*].highlightedObjects[?(@.field=='src' && @.type=='ip')].value |
Source port | .filters[*].highlightedObjects[?(@.field=='spt' && @.type=='port')].value |
Email subject | .filters[*].highlightedObjects[?(@.type=='email_subject' && @.field=='mailMsgSubject')].value |
Tactics | .filters[*].mitreTacticIds |
Techniques | .filters[*].mitreTechniqueIds |
Parent process image path | .filters[*].highlightedObjects[?(@.field=='parentFilePath'].value |
Process command line | .filters[*].highlightedObjects[?(@.field=='processCmd'].value |
Start Time | .detectedDateTime |
Description | .filters[].description |
Process file path | .filters[*].highlightedObjects[?(@.field=='processFilePath'].value |
Process ID | .filters[*].highlightedObjects[?(@.field=='processPid')].value |
Raw event data | .filters[*].highlightedObjects[?(@.field=='objectRawDataStr')].value |
Registry key name | .filters[*].highlightedObjects[?(@.field=='objectRegistryKeyHandle'].value |
Registry value data | .filters[*].highlightedObjects[?(@.field=='objectRegistryData'].value |
Registry value name | .filters[*].highlightedObjects[?(@.field=='objectRegistryValue'].value |
Sender | .detail.mailFromAddresses |
Severity | .detail.filterRiskLevel |
Message ID | .filters[*].highlightedObjects[?(@.type=='email_message_id' && @.field=='mailMsgId')].value |
Action taken | .filters[*].highlightedObjects[?(@.field=='act')].value |
Parent process commandline | .filters[*].highlightedObjects[?(@.type=='command_line' && @.field=='parentCmd')].value |
Internal message ID | .filters[*].highlightedObjects[?(@.type=='email_message_unique_id' && @.field=='msgUuid')].value |
File Hash SHA1 | .filters[*].highlightedObjects[?(@.field=='processFileHashSha1'].value |
Filepath | .filters[*].highlightedObjects[?(@.field=='objectFilePath'].value |
Hostname | .endpoint.endpointName |
Event Type | .source |
Unique Event Key | .uuid |
Document ID | .id |
Device | .filters[*].highlightedObjects[?(@.field=='endpointHostName')].value |
Device IP address | .endpoint.ips |
Sender IP | .detail.mailSenderIp |
Content | .filters[*].highlightedObjects[?(@.field=='objectContentName')].value |
Destination IP address | .filters[*].highlightedObjects[?(@.field=='dst' && @.type=='ip')].value |
Destination port | .filters[*].highlightedObjects[?(@.field=='dpt' && @.type=='port')].value |
Policy ID | .filters[*].highlightedObjects[?(@.field=='policyId')].value |
Command Line | .filters[*].highlightedObjects[?(@.type=='command_line' && @.field=='objectCmd')].value |
Detection Filter | .filters[*].name |
Engine Operation | .filters[*].highlightedObjects[?(@.field=='engineOperation')].value |
Entity Name | .entityName |
Entity Type | .entityType |
Error Handling
If the Return Data displays Failed, an Error tab will appear in the Test Result window.
The error tab contains the details responded from D3 SOAR or third-party API calls, including Failure Indicator, Status Code, and Message. This can help locate the root cause of a command failure.
Parts in Error | Description | Example |
Failure Indicator | Indicates the command failure that happened at a specific input and/or API call. | Fetch Event failed. |
Status Code | The response code issued by the third-party API server or the D3 SOAR system that can be used to locate the corresponding error category. For example, if the returned status code is 401, the selected connection is unauthorized to run the command. The user or system support would need to check the permission setting in the Trend Vision One v3.0 portal. Refer to the HTTP Status Code Registry for details. | Status Code: 400. |
Message | The raw data or captured key error message from the integration API server about the API request failure. | Message: The Query Time Type doesn't match the Event Type. |
Error Sample Data Fetch Event failed. Status Code: 400. Message: The Query Time Type doesn't match the Event Type. |
Force Sign Out
Signs specified users out of all active application and browser sessions. The currently supported IAM system is Azure AD.
Input
Input Parameter | Required/Optional | Description | Example |
User Account Names | Required | The account names of the users to be forced to sign out. For Azure AD, use User Principal Names (Microsoft Entra UserPrincipalName population). |
JSON
|
Description | Optional | The description for the force sign-out task. The description applies to all user accounts. | ForceSignOut task description 20230514a |
Output
To view the sample output data for all commands, refer to this article.
Error Handling
If the Return Data displays Partially Successful or Failed, an Error tab will appear in the Test Result window.
The error tab contains the details responded from D3 SOAR or third-party API calls, including Failure Indicator, Status Code, and Message. This can help locate the root cause of a command failure.
Parts in Error | Description | Example |
Failure Indicator | Indicates the command failure that happened at a specific input and/or API call. | Force Sign Out failed. |
Status Code | The response code issued by the third-party API server or the D3 SOAR system that can be used to locate the corresponding error category. For example, if the returned status code is 401, the selected connection is unauthorized to run the command. The user or system support would need to check the permission setting in the Trend Vision One v3.0 portal. Refer to the HTTP Status Code Registry for details. | Status Code: 400. |
Message | The raw data or captured key error message from the integration API server about the API request failure. | Message: Invalid request. |
Error Sample Data Force Sign Out failed. Status Code: 400. Message: Invalid request. |
Get ES Endpoint Details
Displays the detailed profiles of the specified endpoints.
READER NOTE
Endpoint IDs is a required parameter to run this command.
Run the List Endpoint Inventory command to obtain the Endpoint IDs. Endpoint IDs can be found in the raw data at the path $.items[*].agentGuid.
Input
Input Parameter | Required/Optional | Description | Example |
Endpoint IDs | Required | The agent GUIDs of the endpoints for which to retrieve profile details. Endpoint IDs can be obtained using the List Endpoint Inventory command. |
JSON
|
Output
To view the sample output data for all commands, refer to this article.
Error Handling
If the Return Data displays Failed, an Error tab will appear in the Test Result window.
The error tab contains the details responded from D3 SOAR or third-party API calls, including Failure Indicator, Status Code, and Message. This can help locate the root cause of a command failure.
Parts in Error | Description | Example |
Failure Indicator | Indicates the command failure that happened at a specific input and/or API call. | Get ES Endpoint Details failed. |
Status Code | The response code issued by the third-party API server or the D3 SOAR system that can be used to locate the corresponding error category. For example, if the returned status code is 401, the selected connection is unauthorized to run the command. The user or system support would need to check the permission setting in the Trend Vision One v3.0 portal. Refer to the HTTP Status Code Registry for details. | Status Code: 404. |
Message | The raw data or captured key error message from the integration API server about the API request failure. | Message: Endpoint not found. Verify the user ID and try again. |
Error Sample Data Get ES Endpoint Details failed. Status Code: 404. Message: Endpoint not found. Verify the user ID and try again. |
List Custom Scripts
Retrieves information about the available custom scripts.
Input
Input Parameter | Required/Optional | Description | Example |
File Names | Optional | The names of the custom script files to retrieve. |
JSON
|
File Type | Optional | The file type of the custom scripts to retrieve. Available options are:
By default, all custom scripts regardless of their file type will be returned. | Powershell |
Output
To view the sample output data for all commands, refer to this article.
Error Handling
If the Return Data displays Failed, an Error tab will appear in the Test Result window.
The error tab contains the details responded from D3 SOAR or third-party API calls, including Failure Indicator, Status Code, and Message. This can help locate the root cause of a command failure.
Parts in Error | Description | Example |
Failure Indicator | Indicates the command failure that happened at a specific input and/or API call. | List Custom Scripts failed. |
Status Code | The response code issued by the third-party API server or the D3 SOAR system that can be used to locate the corresponding error category. For example, if the returned status code is 401, the selected connection is unauthorized to run the command. The user or system support would need to check the permission setting in the Trend Vision One v3.0 portal. Refer to the HTTP Status Code Registry for details. | Status Code: 403. |
Message | The raw data or captured key error message from the integration API server about the API request failure. | Message: Insufficient permissions. |
Error Sample Data List Custom Scripts failed. Status Code: 403. Message: Insufficient permissions. |
List Endpoint Inventory
Displays a detailed list of the endpoint inventory.
READER NOTE
Endpoint Names is an optional parameter to run this command.
Run this command without filling in the Endpoint Names parameter to obtain the Endpoint Names. Endpoint Names can be found in the raw data at the path $.items[*].endpointName.
Input
Input Parameter | Required/Optional | Description | Example |
Endpoint Names | Optional | The host names of the endpoints for which to retrieve information. Endpoint names can be obtained by running the command without filling in this input parameter. |
JSON
|
OS Names | Optional | The operating system names of the endpoints for which to retrieve information. |
JSON
|
Isolation Status | Optional | Filters endpoints by isolation status. Available options are:
| Off |
Output
To view the sample output data for all commands, refer to this article.
Error Handling
If the Return Data displays Failed, an Error tab will appear in the Test Result window.
The error tab contains the details responded from D3 SOAR or third-party API calls, including Failure Indicator, Status Code, and Message. This can help locate the root cause of a command failure.
Parts in Error | Description | Example |
Failure Indicator | Indicates the command failure that happened at a specific input and/or API call. | List Endpoint Inventory failed. |
Status Code | The response code issued by the third-party API server or the D3 SOAR system that can be used to locate the corresponding error category. For example, if the returned status code is 401, the selected connection is unauthorized to run the command. The user or system support would need to check the permission setting in the Trend Vision One v3.0 portal. Refer to the HTTP Status Code Registry for details. | Status Code: 403. |
Message | The raw data or captured key error message from the integration API server about the API request failure. | Message: Access denied. |
Error Sample Data List Endpoint Inventory failed. Status Code: 403. Message: Access denied. |
List Response Tasks
Retrieves a list of response tasks.
Input
Input Parameter | Required/Optional | Description | Example |
Start Time | Optional | The beginning of the data retrieval range (in UTC). Tasks created up to 180 days ago can be retrieved. By default, the value is 24 hours before the End Time. | 2023-05-09 19:00:00 |
End Time | Optional | The end of the data retrieval range (in UTC). By default, the value is the time the request is made. | 2023-05-09 22:00:00 |
Query Time Type | Optional | The time field used to apply Start Time and End Time. Available options are:
By default, the value is set to Created Date Time. | Last Action Date Time |
Status | Optional | Filters tasks by status. Available options are:
By default, all response tasks regardless of their status will be returned. | Succeeded |
Action | Optional | Filters tasks by the action performed on a target. Available options are:
By default, all tasks regardless of their action are returned. | Block |
Task IDs | Optional | Filters tasks by their task IDs. |
JSON
|
Accounts | Optional | Filters tasks by the user accounts that created them. By default, tasks created by any user will be returned. |
JSON
|
Output
To view the sample output data for all commands, refer to this article.
Error Handling
If the Return Data displays Failed, an Error tab will appear in the Test Result window.
The error tab contains the details responded from D3 SOAR or third-party API calls, including Failure Indicator, Status Code, and Message. This can help locate the root cause of a command failure.
Parts in Error | Description | Example |
Failure Indicator | Indicates the command failure that happened at a specific input and/or API call. | List Response Tasks failed. |
Status Code | The response code issued by the third-party API server or the D3 SOAR system that can be used to locate the corresponding error category. For example, if the returned status code is 401, the selected connection is unauthorized to run the command. The user or system support would need to check the permission setting in the Trend Vision One v3.0 portal. Refer to the HTTP Status Code Registry for details. | Status Code: 403. |
Message | The raw data or captured key error message from the integration API server about the API request failure. | Message: You must have a valid Support account to call this API. |
Error Sample Data List Response Tasks failed. Status Code: 403. Message: You must have a valid Support account to call this API. |
Reset Passwords
Signs specified users out of all active application and browser sessions, then forces them to create new passwords during the next sign-in attempt. The currently supported IAM systems are Azure AD and Active Directory (on-premises).
Input
Input Parameter | Required/Optional | Description | Example |
User Account Names | Required | The account names of the users whose passwords will be reset. |
JSON
|
Description | Optional | The description for the password-reset task. The description applies to all user accounts. | resetPassword task description 20230514b |
Output
To view the sample output data for all commands, refer to this article.
Error Handling
If the Return Data displays Partially Successful or Failed, an Error tab will appear in the Test Result window.
The error tab contains the details responded from D3 SOAR or third-party API calls, including Failure Indicator, Status Code, and Message. This can help locate the root cause of a command failure.
Parts in Error | Description | Example |
Failure Indicator | Indicates the command failure that happened at a specific input and/or API call. | Reset Passwords failed. |
Status Code | The response code issued by the third-party API server or the D3 SOAR system that can be used to locate the corresponding error category. For example, if the returned status code is 401, the selected connection is unauthorized to run the command. The user or system support would need to check the permission setting in the Trend Vision One v3.0 portal. Refer to the HTTP Status Code Registry for details. | Status Code: 400. |
Message | The raw data or captured key error message from the integration API server about the API request failure. | Message: Invalid request. |
Error Sample Data Reset Passwords failed. Status Code: 400. Message: Invalid request. |
Scan for Malware
Initiates a one-time malware scan on one or more endpoints. Agent installation on all endpoints is required to execute this command.
IMPORTANT
Agents on target endpoints must be connected and upgraded to the latest version.
If the agent on a target endpoint is disconnected, the task is queued until the agent reconnects. Queued tasks time out after 24 hours.
Depending on the number of files, size of files, and storage device speed on target endpoints, the task may take several hours to complete.
READER NOTE
Endpoint Agent GUIDs is a required parameter to run this command.
Run the List Endpoint Inventory command to obtain the Endpoint Agent GUIDs. Endpoint Agent GUIDs can be found in the raw data at $.items[*].agentGuid.
Input
Input Parameter | Required/Optional | Description | Example |
Endpoint Agent GUIDs | Required | The GUIDs of the endpoint agents on which to initiate the malware scan. Endpoint Agent GUIDs can be obtained using the List Endpoint Inventory command. A single malware scan task can include up to 200 endpoints. The command will fail for agents that are disconnected or already processing a Scan for Malware task. |
JSON
|
Description | Optional | The description of the malware scan task. | Scan for malware 20250506 |
Output
To view the sample output data for all commands, refer to this article.
Error Handling
If the Return Data displays Partially Successful or Failed, an Error tab will appear in the Test Result window.
The error tab contains the details responded from D3 SOAR or third-party API calls, including Failure Indicator, Status Code, and Message. This can help locate the root cause of a command failure.
Parts in Error | Description | Example |
Failure Indicator | Indicates the command failure that happened at a specific input and/or API call. | Scan for Malware failed. |
Status Code | The response code issued by the third-party API server or the D3 SOAR system that can be used to locate the corresponding error category. For example, if the returned status code is 401, the selected connection is unauthorized to run the command. The user or system support would need to check the permission setting in the Trend Vision One v3.0 portal. Refer to the HTTP Status Code Registry for details. | Status Code: 400. |
Message | The raw data or captured key error message from the integration API server about the API request failure. | Message: Target not found. |
Error Sample Data Scan for Malware failed. Status Code: 400. Message: Target not found. |
Submit Files to Sandbox
Submits files to the sandbox for analysis.
File IDs and File Source
It is not recommended to use the Test Command feature with the Submit Files to Sandbox command as it is designed for dynamic input files in Playbooks, Incident Attachments, and Artifact Attachments. There is a simple workaround to test the command:
Navigate to Configuration on the top bar menu.
Click on Utility Commands on the left sidebar menu.
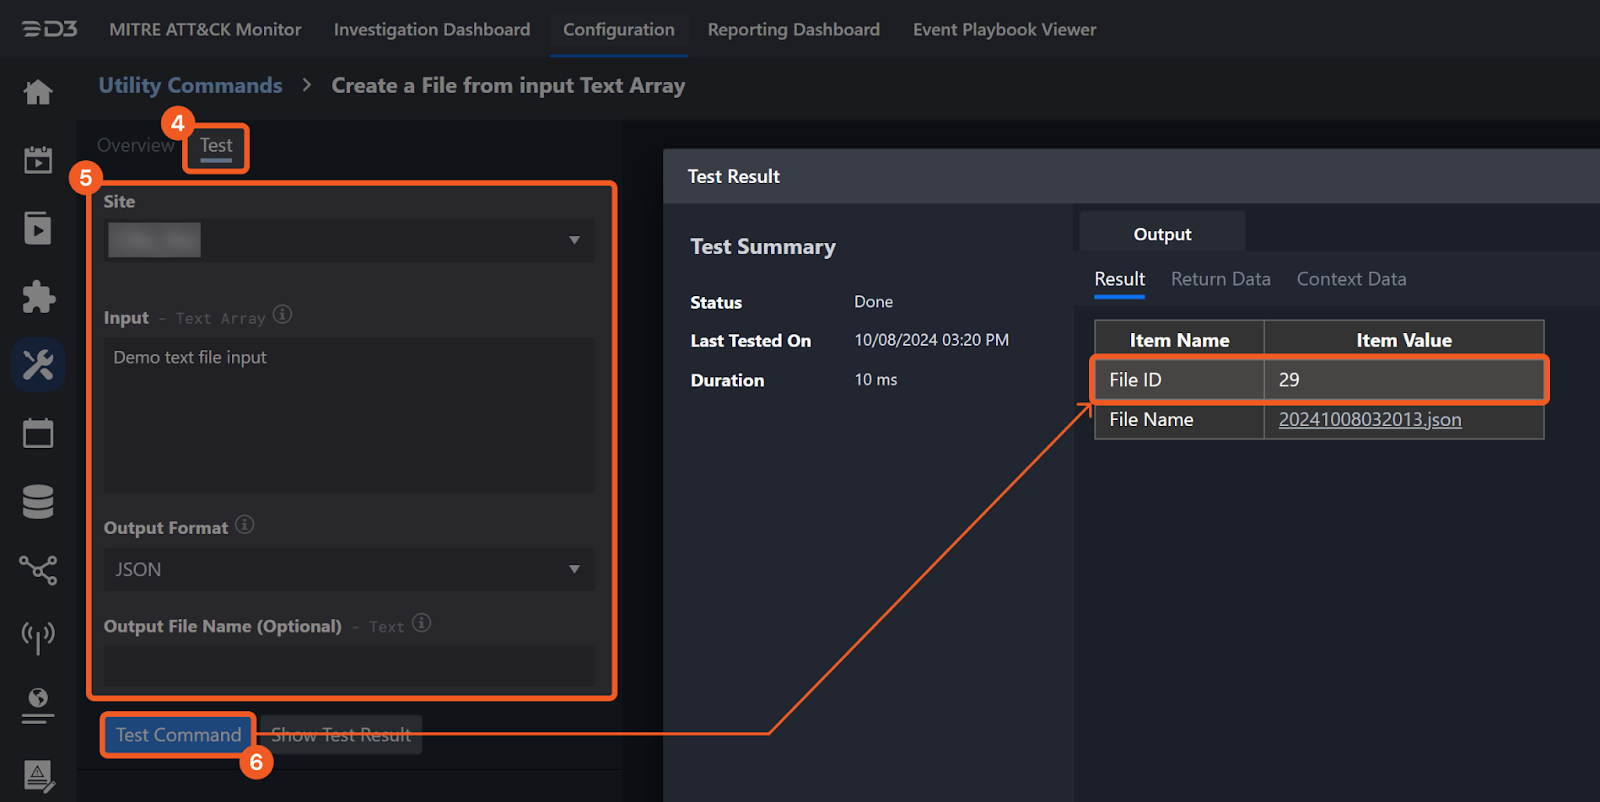
Use the search box to find and select the Create a File from input Text Array command.
Click on the Test tab.
Input the required information for the parameters.
Click on the Test Command button. A D3 File ID will appear in the output data after the file has been successfully created. The D3 File Source of the created file will be Playbook File.
Input
Input Parameter | Required/Optional | Description | Example |
File IDs | Required | The file IDs of the file source. |
JSON
|
File Type | Required | The file source of the files to submit. Available options are:
| Powershell |
Document Password | Optional | The password used to decrypt the submitted file sample. The maximum length is 128 bytes. This applies to all submitted files. | "*****" |
Archive Password | Optional | The password used to decrypt the submitted archive. The maximum length is 128 bytes. This applies to all submitted files. | "*****" |
Arguments | Optional | This parameter only applies to Portable Executable (PE) files and script files. The command line arguments to run the submitted files. The maximum length is 1024 bytes. This applies to all submitted files. | "ARGUMENTS" |
Output
To view the sample output data for all commands, refer to this article.
Error Handling
If the Return Data displays Failed, an Error tab will appear in the Test Result window.
The error tab contains the details responded from D3 SOAR or third-party API calls, including Failure Indicator, Status Code, and Message. This can help locate the root cause of a command failure.
Parts in Error | Description | Example |
Failure Indicator | Indicates the command failure that happened at a specific input and/or API call. | Submit Files to Sandbox failed. |
Status Code | The response code issued by the third-party API server or the D3 SOAR system that can be used to locate the corresponding error category. For example, if the returned status code is 401, the selected connection is unauthorized to run the command. The user or system support would need to check the permission setting in the Trend Vision One v3.0 portal. Refer to the HTTP Status Code Registry for details. | Status Code: 403. |
Message | The raw data or captured key error message from the integration API server about the API request failure. | Message: Insufficient permissions. |
Error Sample Data Submit Files to Sandbox failed. Status Code: 403. Message: Insufficient permissions. |
Terminate Processes
Terminates specified processes running on one or more endpoints. Upload the required terminate process custom script using the Upload Custom Scripts command before execution; contact D3 to obtain it. A successful task status does not confirm process termination. The outcome depends on the script's ability to identify and terminate processes by name or ID. Confirm the results by downloading and extracting the password-protected 7-Zip task report from the resourceLocation link before expiration.
PRE-REQUISITES
Users should ensure they have obtained the custom process-termination script from D3 before executing this command.
READER NOTE
Endpoint Agent GUIDs and Terminate Process Custom Script Name are required parameters to run this command.
Run the List Endpoint Inventory command to obtain the Endpoint Agent GUIDs. Endpoint Agent GUIDs can be found in the raw data at $.items[*].agentGuid.
Upload the custom script using the Upload Custom Scripts command, then run the List Custom Scripts command to obtain the Terminate Process Custom Script Name. Terminate Process Custom Script Names can be found in the raw data at $.items[*].fileName.
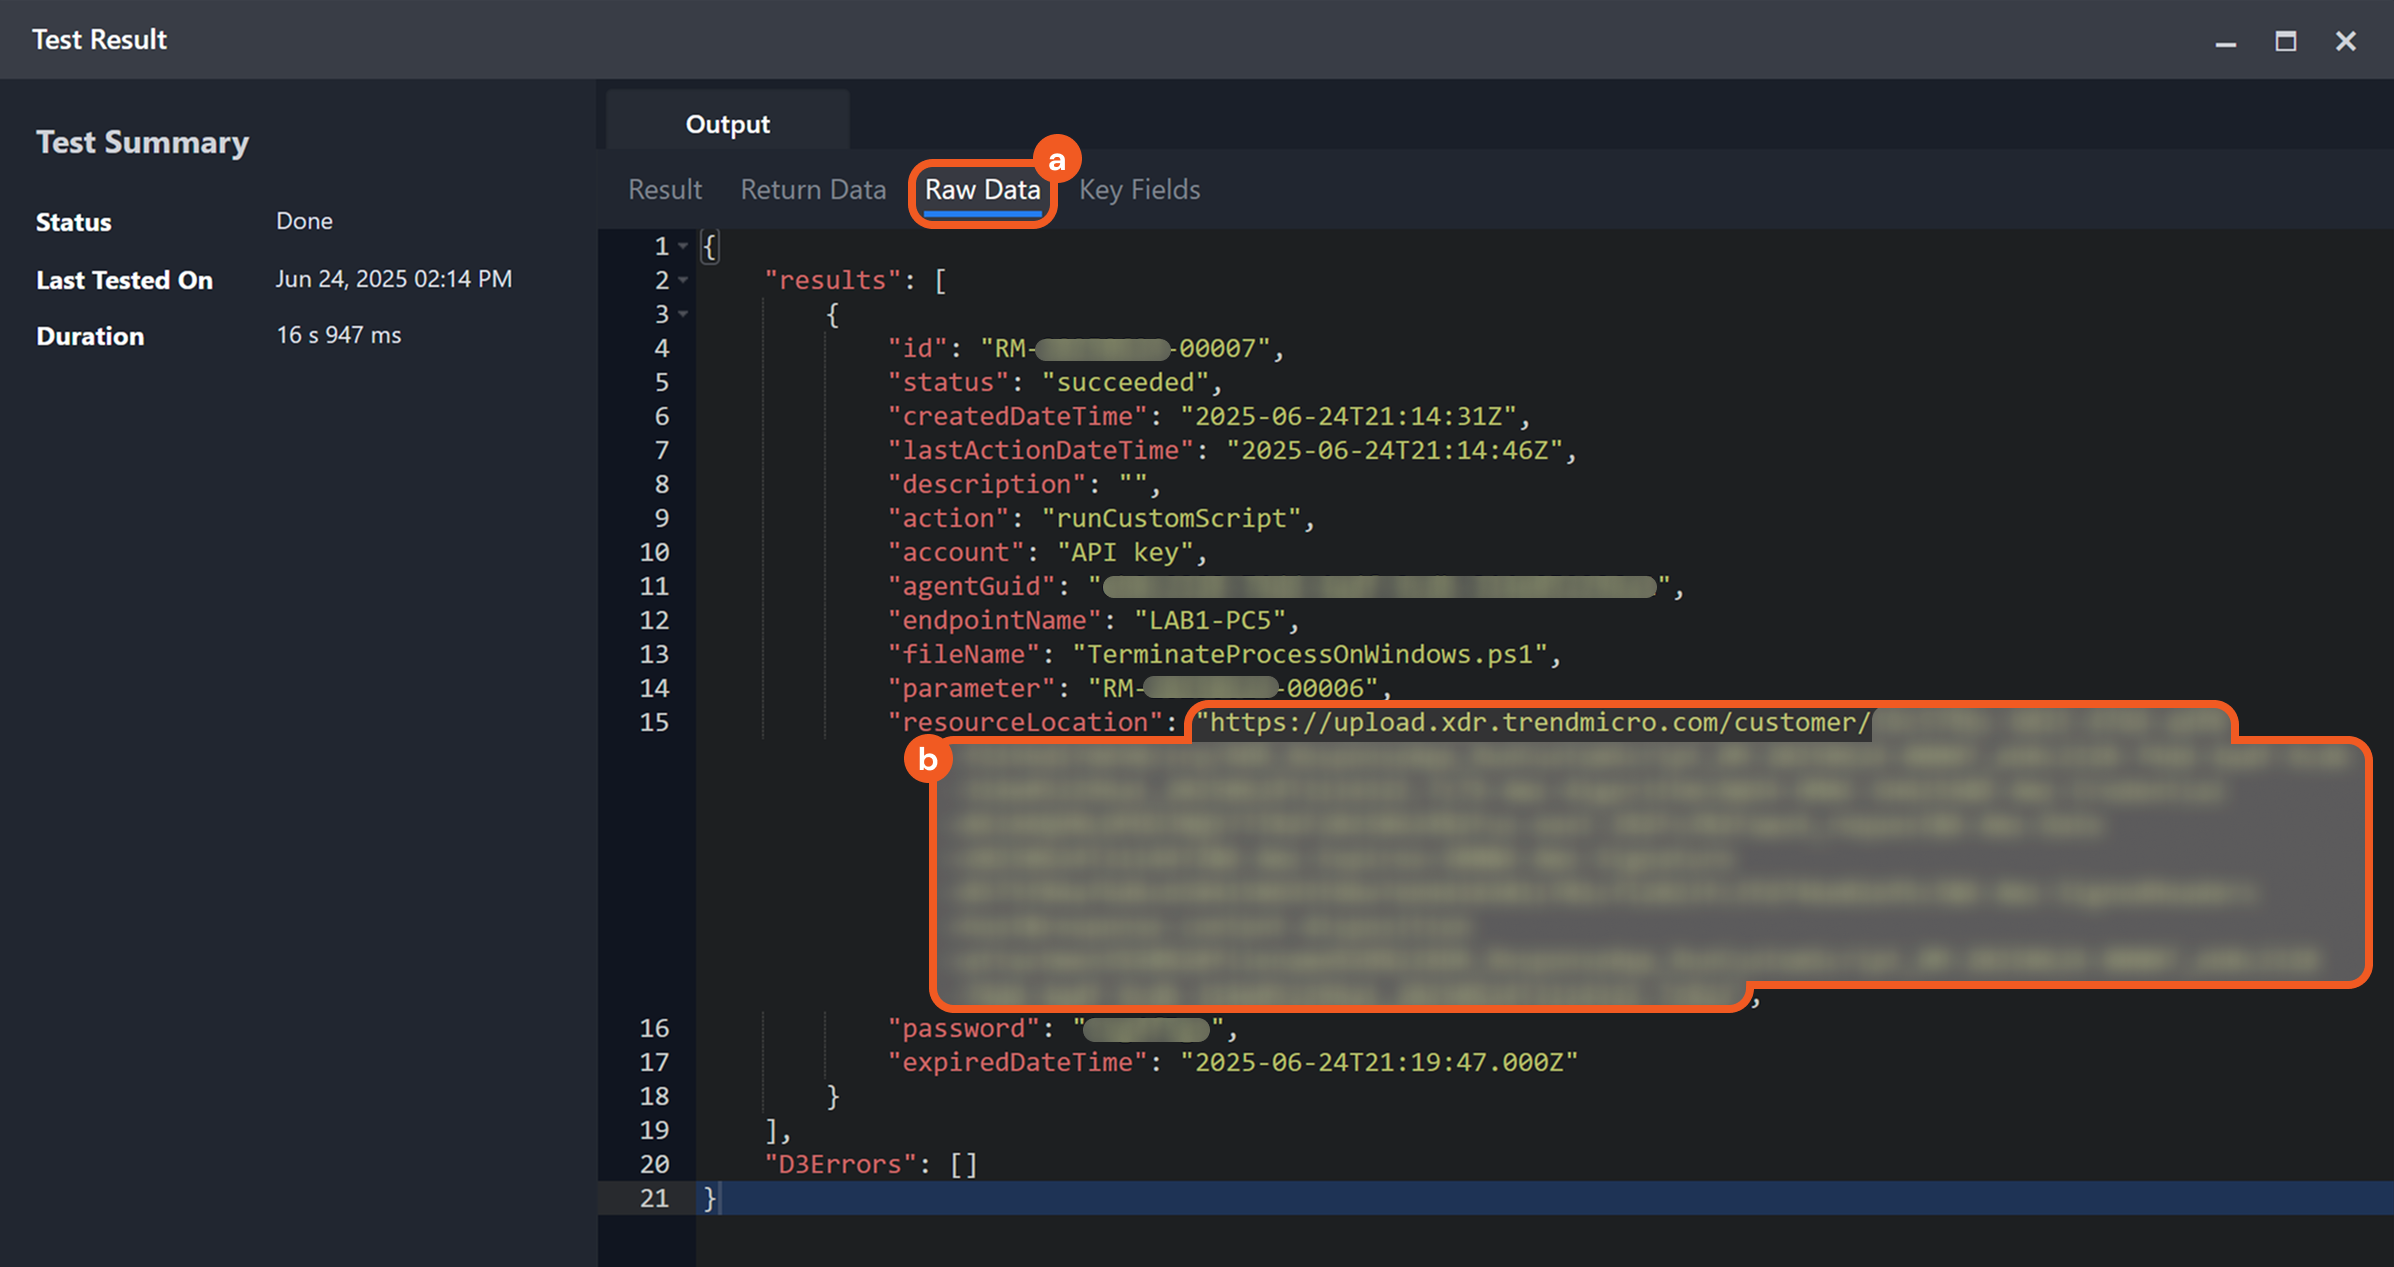
Downloading and Extracting the Task Report
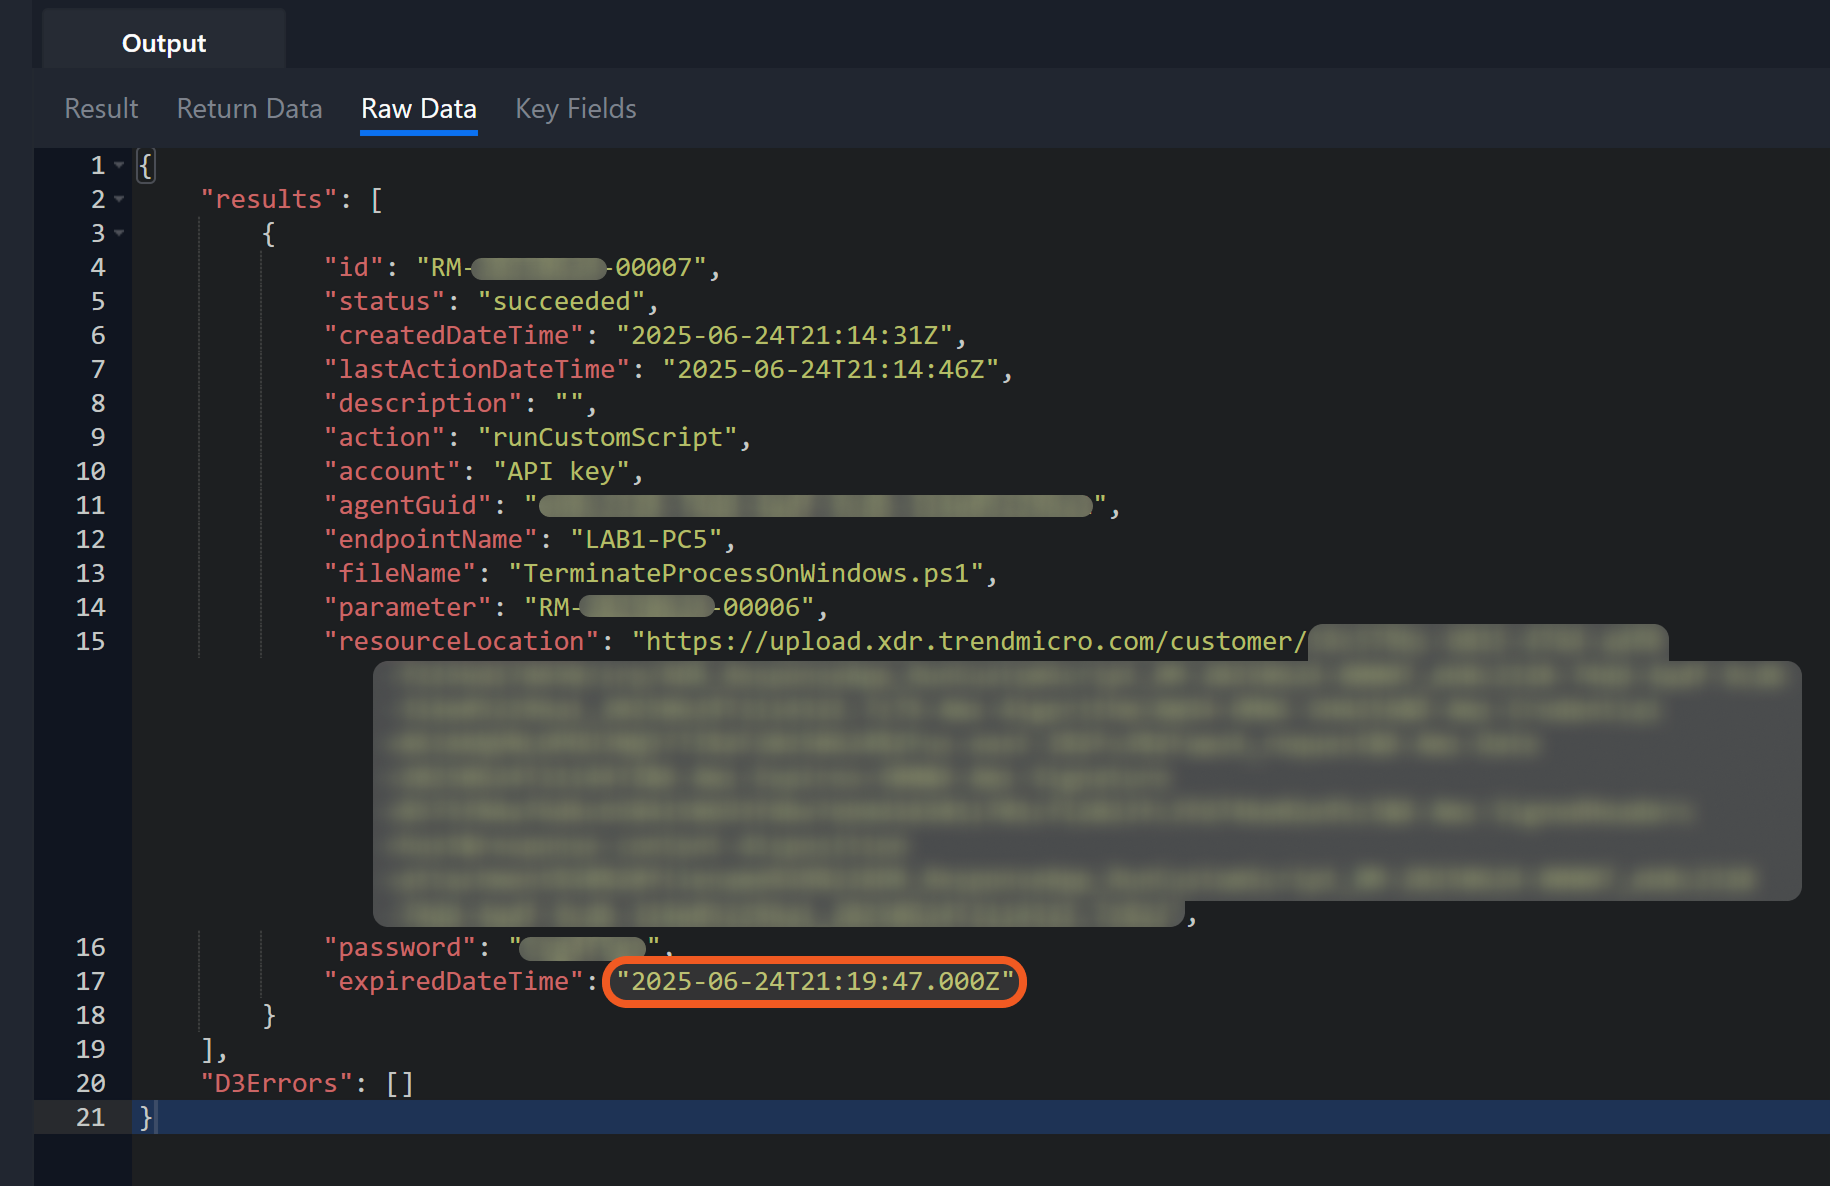
Select the Raw Data tab, then copy the value of the resourceLocation field and paste it into the browser’s address bar to automatically download the 7-Zip archive.
Extract the downloaded archive using 7-Zip or equivalent software.
.png?inst-v=a9107af0-b04c-4e31-bb5a-938372783868)
Enter the password from the password field in the Raw Data tab when prompted by the extraction tool to extract the archive.
.png?inst-v=a9107af0-b04c-4e31-bb5a-938372783868)
Ensure to verify the termination results before the download link expires, as indicated by the expiredDateTime field.
Input
Input Parameter | Required/Optional | Description | Example |
Endpoint Agent GUIDs | Required | The GUIDs of the agents on the endpoints where the processes will be terminated. Endpoint Agent GUIDs can be obtained using the List Endpoint Inventory command. All specified agents must run on the same operating system. Only Windows and Linux/macOS endpoints are supported. |
JSON
|
Process Names or IDs | Required | The names or IDs of the processes on the target endpoints to be terminated. Process IDs and names correspond to tasks actively running on an endpoint. How they are retrieved depends on the operating system (e.g., Windows, macOS, Linux), but in general, they can be viewed using built-in system tools such as Task Manager, Activity Monitor, or terminal commands. |
JSON
|
Terminate Process Custom Script Name | Required | The name of the custom script file used to terminate processes. Upload the script using the Upload Custom Scripts command. Use a PowerShell script for Windows and a bash script for Linux and macOS. Terminate Process Custom Script Name can be obtained using the List Custom Scripts command. | TerminateProcessOnWindows.ps1 |
Description | Optional | The description of the task to terminate processes. This description applies to all specified processes. | terminateProcesstask description 20230510c |
Output
To view the sample output data for all commands, refer to this article.
Error Handling
If the Return Data displays Partially Successful or Failed, an Error tab will appear in the Test Result window.
The error tab contains the details responded from D3 SOAR or third-party API calls, including Failure Indicator, Status Code, and Message. This can help locate the root cause of a command failure.
Parts in Error | Description | Example |
Failure Indicator | Indicates the command failure that happened at a specific input and/or API call. | Terminate Processes failed. |
Status Code | The response code issued by the third-party API server or the D3 SOAR system that can be used to locate the corresponding error category. For example, if the returned status code is 401, the selected connection is unauthorized to run the command. The user or system support would need to check the permission setting in the Trend Vision One v3.0 portal. Refer to the HTTP Status Code Registry for details. | Status Code: 400. |
Message | The raw data or captured key error message from the integration API server about the API request failure. | Message: Action not supported. Install or upgrade the agent program on the target endpoint. |
Error Sample Data Terminate Processes failed. Status Code: 400. Message: Action not supported. Install or upgrade the agent program on the target endpoint. |
Upload Custom Scripts
Uploads custom scripts. Supported file extensions are PowerShell (.ps1) and Bash (.sh). All uploaded scripts must be of the same file type.
File IDs and File Source
It is not recommended to use the Test Command feature with the Upload Custom Scripts command as it is designed for dynamic input files in Playbooks, Incident Attachments, and Artifact Attachments. There is a simple workaround to test the command:
Navigate to Configuration on the top bar menu.
Click on Utility Commands on the left sidebar menu.
Use the search box to find and select the Create a File from input Text Array command.
Click on the Test tab.
Input the required information for the parameters.
Click on the Test Command button. A D3 File ID will appear in the output data after the file has been successfully created. The D3 File Source of the created file will be Playbook File.
Input
Input Parameter | Required/Optional | Description | Example |
File Type | Required | The file type of the custom scripts to upload. Available options are:
| Powershell |
File IDs | Optional | The IDs of the custom script files to upload. |
JSON
|
File Source | Optional | The file source of the files to be uploaded. The options for file sources are:
| IR Attachment |
Output
To view the sample output data for all commands, refer to this article.
Error Handling
If the Return Data displays Partially Successful or Failed, an Error tab will appear in the Test Result window.
The error tab contains the details responded from D3 SOAR or third-party API calls, including Failure Indicator, Status Code, and Message. This can help locate the root cause of a command failure.
Parts in Error | Description | Example |
Failure Indicator | Indicates the command failure that happened at a specific input and/or API call. | Upload Custom Scripts failed. |
Status Code | The response code issued by the third-party API server or the D3 SOAR system that can be used to locate the corresponding error category. For example, if the returned status code is 401, the selected connection is unauthorized to run the command. The user or system support would need to check the permission setting in the Trend Vision One v3.0 portal. Refer to the HTTP Status Code Registry for details. | Status Code: 403. |
Message | The raw data or captured key error message from the integration API server about the API request failure. | Message: Insufficient permissions. |
Error Sample Data Upload Custom Scripts failed. Status Code: 403. Message: Insufficient permissions. |
Test Connection
Allows users to perform a health check on an integration connection. Users can schedule a periodic health check by selecting Connection Health Check when editing an integration connection.
Input
N/A
Output
Output Type | Description | Return Data Type |
Return Data | Indicates one of the possible command execution states: Successful or Failed. The Failed state can be triggered by any of the following errors:
More details about an error can be viewed in the Error tab. | String |
Error Handling
If the Return Data displays Failed, an Error tab will appear in the Test Result window.
The error tab contains the details responded from D3 SOAR or third-party API calls, including Failure Indicator, Status Code, and Message. This can help locate the root cause of a command failure.
Parts in Error | Description | Example |
Failure Indicator | Indicates the command failure that happened at a specific input and/or API call. | Test Connection failed. Failed to check the connector. |
Status Code | The response code issued by the third-party API server or the D3 SOAR system that can be used to locate the corresponding error category. For example, if the returned status code is 401, the selected connection is unauthorized to run the command. The user or system support would need to check the permission setting in the Trend Vision One v3.0 portal. Refer to the HTTP Status Code Registry for details. | Status Code: 403. |
Message | The raw data or captured key error message from the integration API server about the API request failure. | Message: Access denied. |
Error Sample Data Test Connection failed. Failed to check the connector. Status Code: 403. Message: Access denied. |