
Stamus Clear NDR
LAST UPDATED: AUG 21, 2025
Overview
Stamus Clear NDR is a Network Detection and Response (NDR) platform developed by Stamus Networks. It provides advanced threat detection, network visibility, and response capabilities using deep packet inspection (DPI), threat intelligence, and behavioral analysis.
D3 SOAR is providing REST operations to function with Stamus Clear NDR.
Stamus Clear NDR is available for use in:
D3 SOAR | V17.1+ |
Category | SIEM & XDR |
Deployment Options |
Connection
To connect to Stamus Clear NDR from D3 SOAR, follow this part to collect the required information below:
Parameter | Description | Example |
Stamus Central Server (SCS) URL | The IP address on which the Stamus Central Server is deployed, prefixed with the HTTPS URL schema. | https://***.***.***.*** |
Token | The API Token obtained from the SCS account settings. | ***** |
Tenant ID | The tenant ID if multi-tenancy is enabled for the SCS instance. | ***** |
Configuring Stamus Clear NDR to Work with D3 SOAR
Log into Stamus Clear NDR.
Navigate to the token list.
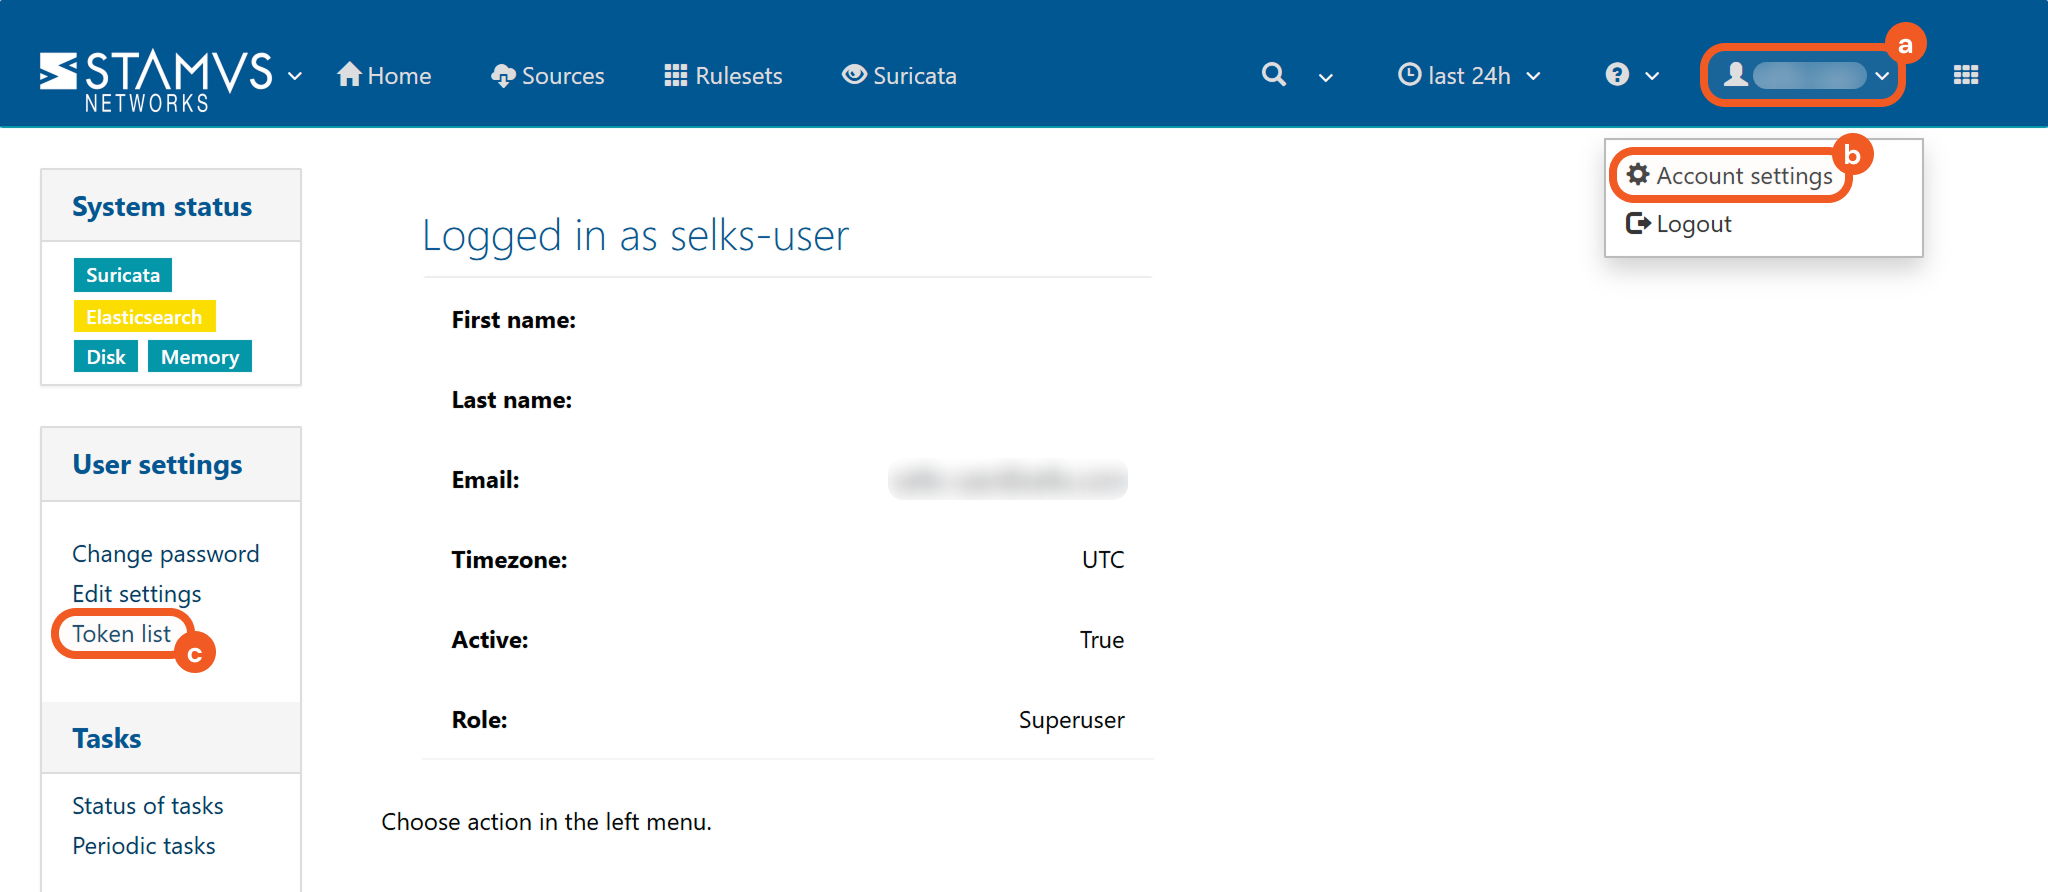
Click the user icon.
Select the Account settings option.
Click the Token list link.
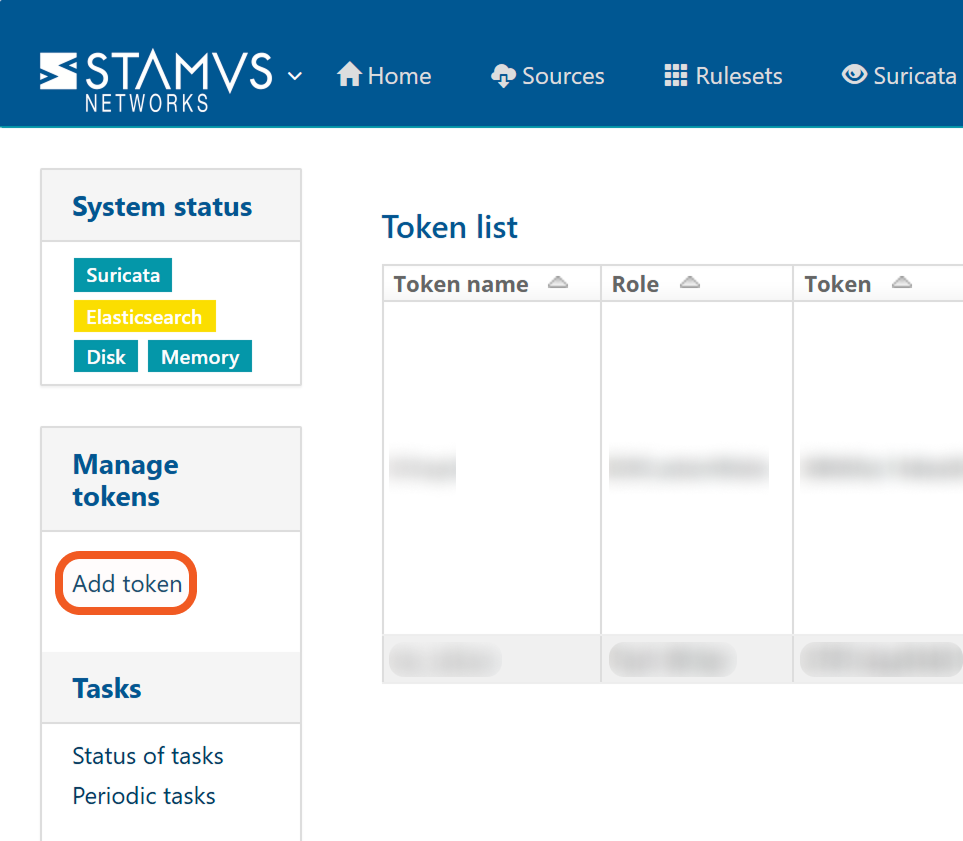
Click the Add token link.
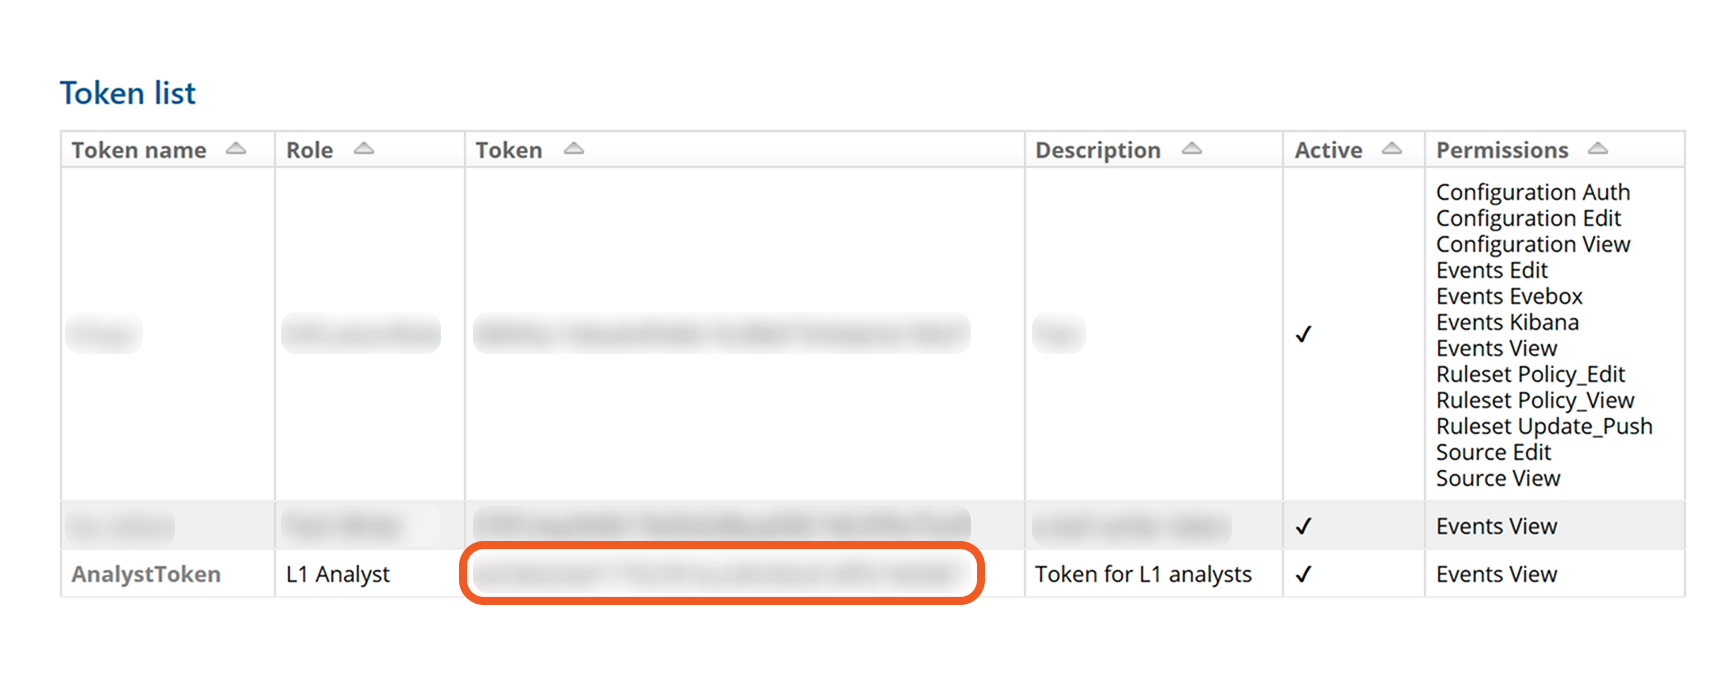
Create the token.
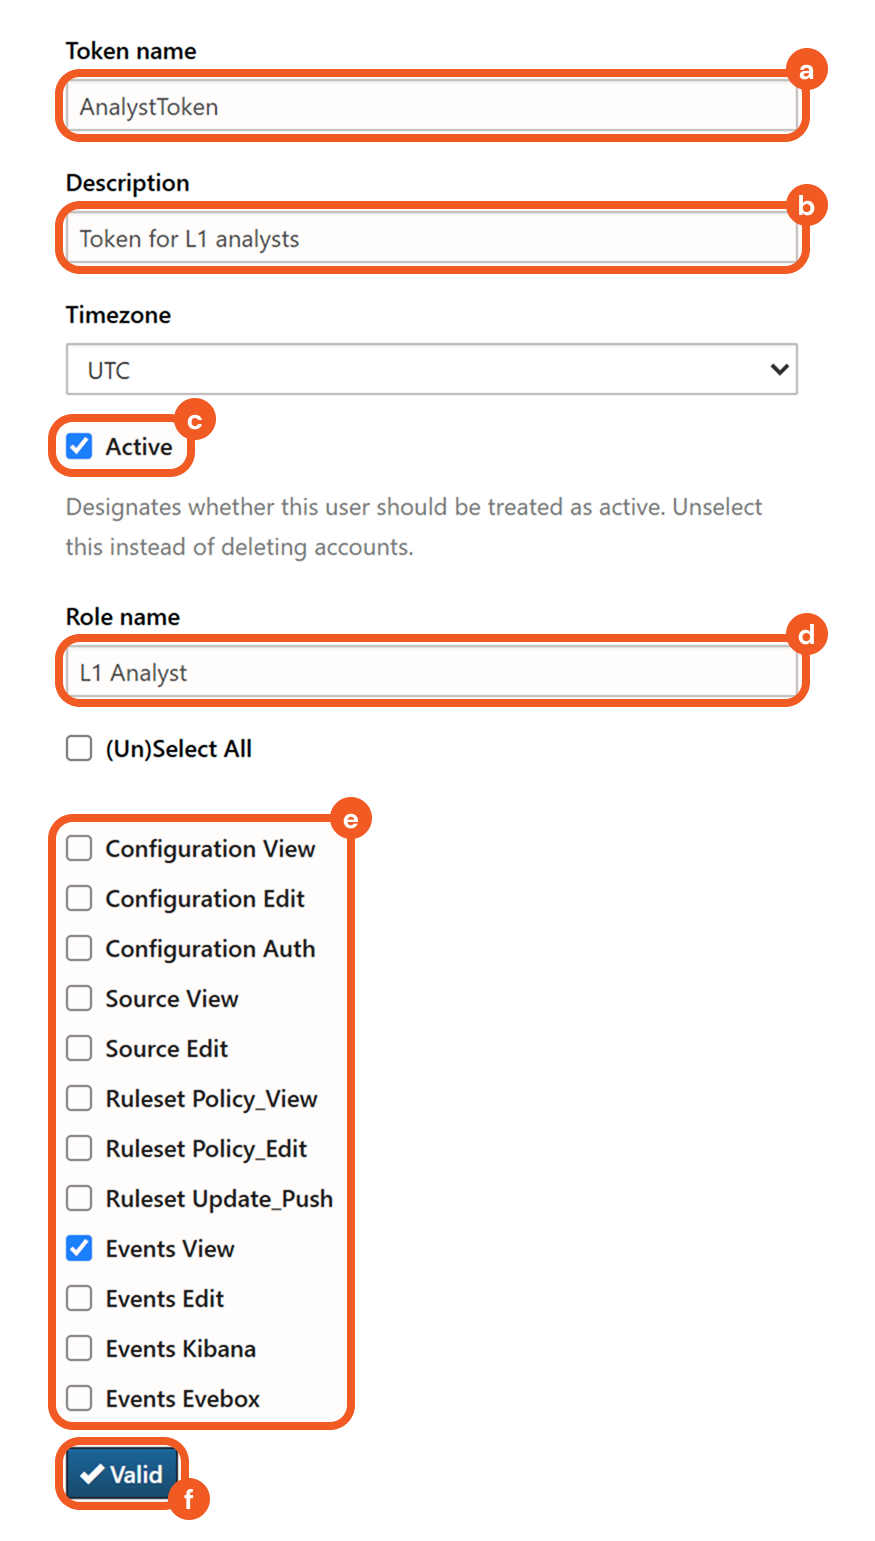
Name the token.
Enter a description.
Ensure that the Active checkbox is selected.
Enter a role name.
Select the permission scopes as necessary to define the token’s access level.
Refer to the Reader Note for further information.Click the Valid button to create the token.
Copy the token. Refer to step 3i sub-step 2 in Configuring D3 SOAR to Work with Stamus Clear NDR.
READER NOTE
Only users assigned the Superuser role can view the complete set of permission scopes.
Configuring D3 SOAR to Work with Stamus Clear NDR
Log in to D3 SOAR.
Find the Stamus Clear NDR integration.
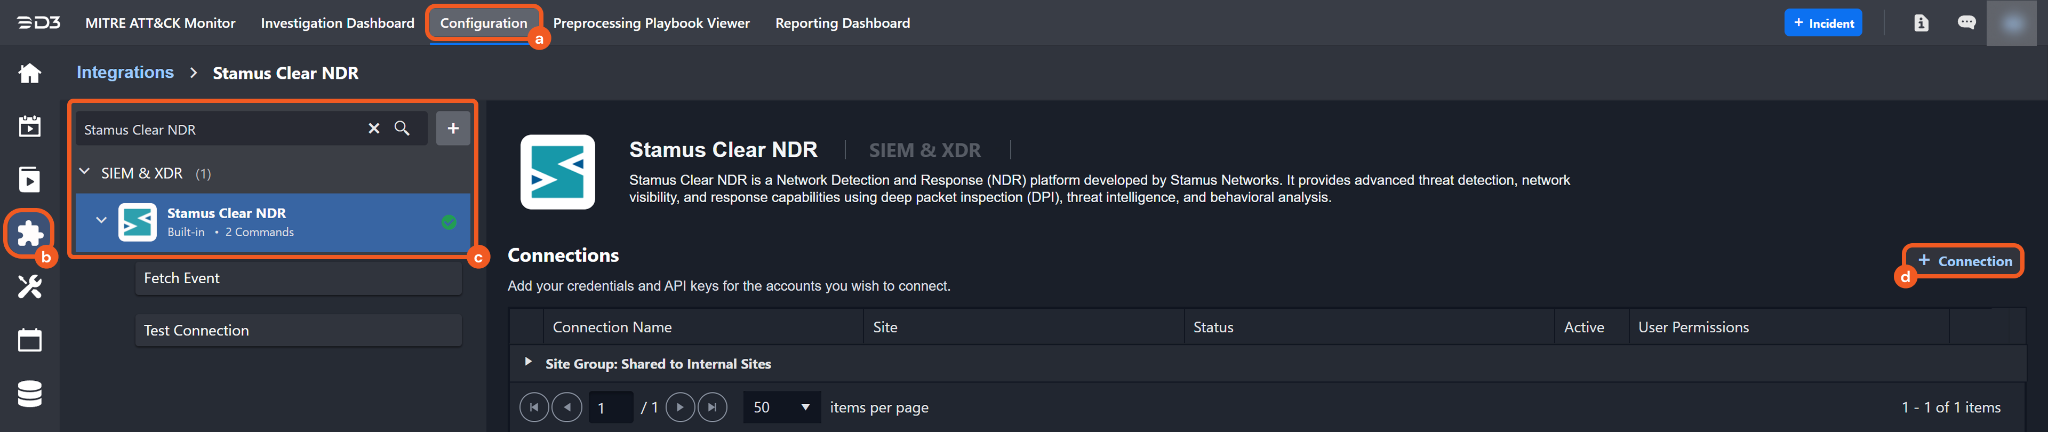
Navigate to Configuration on the top header menu.
Click on the Integration icon on the left sidebar.
Type Stamus Clear NDR in the search box to find the integration, then click it to select it.
Click on the + Connection button on the right side of the Connections section. A new connection window will appear.
Configure the following fields to create a connection to Stamus Clear NDR.
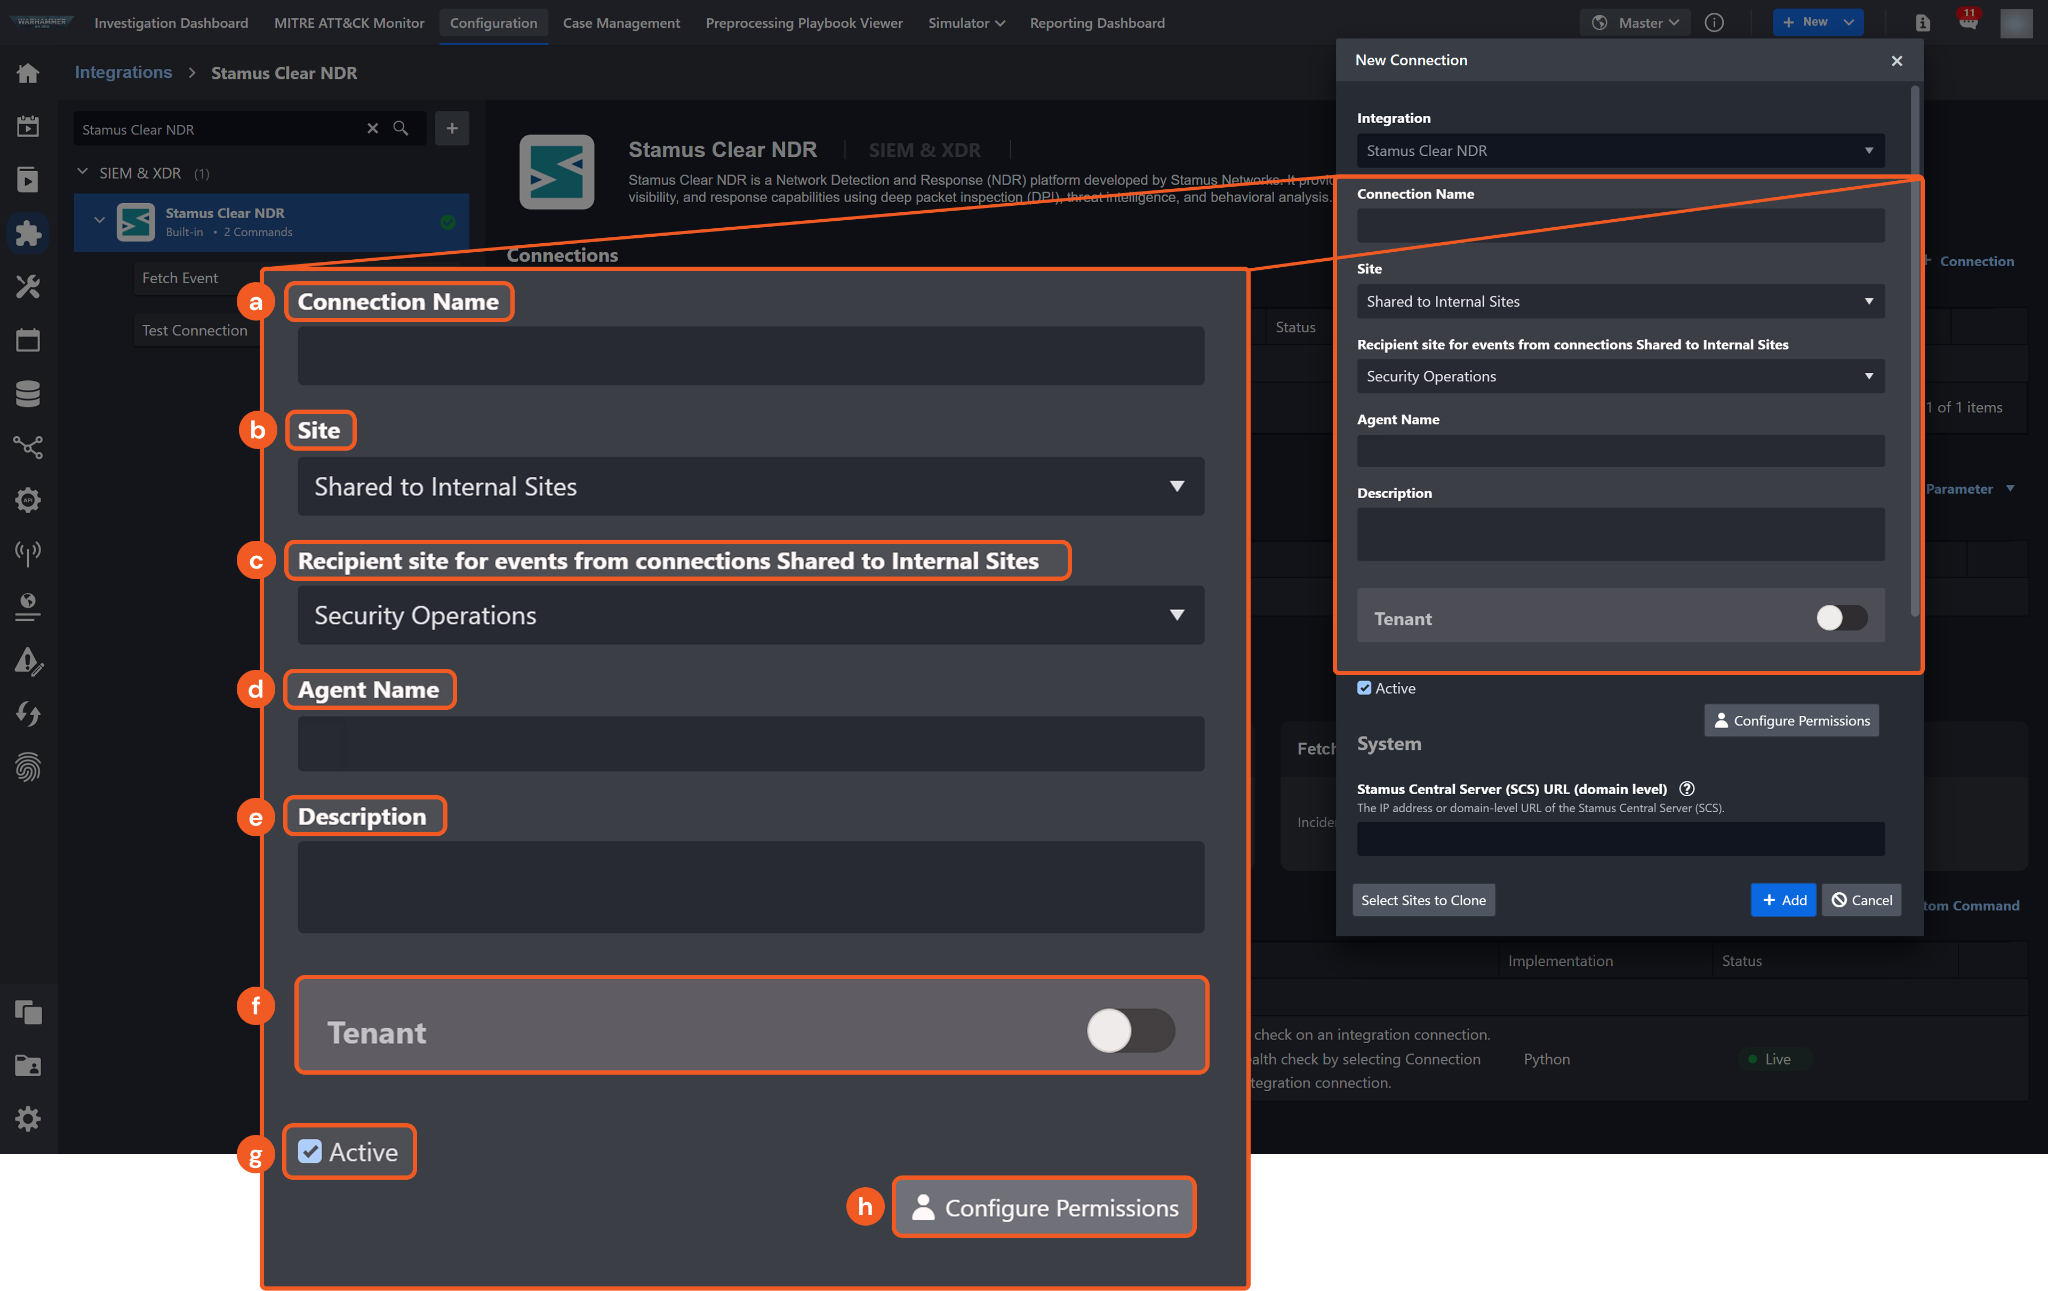
Connection Name: The desired name for the connection.
Site: The site on which to use the integration connection. Use the drop-down menu to select the site. The Share to Internal Sites option enables all internal sites to use the connection. Selecting a specific site will only enable that site to use the connection.
Recipient site for events from connections Shared to Internal Sites: This field is displayed when Share to Internal Sites is selected for the Site field, allowing selection of the internal site for deploying the integration connection.
Agent Name (Optional): The proxy agent required to build the connection. Use the dropdown menu to select the proxy agent from a list of previously configured proxy agents.
Description (Optional): The description for the connection.
Tenant (Optional): When configuring the connection from a master tenant site, users can choose the specific tenant sites with which to share the connection. Once this setting is enabled, users can filter and select the desired tenant sites from the dropdowns to share the connection.
Active: The checkbox that enables the connection to be used when selected.
Configure User Permissions: Defines which users have access to the connection.
System: This section contains the parameters defined specifically for the integration. These parameters must be configured to create the integration connection.
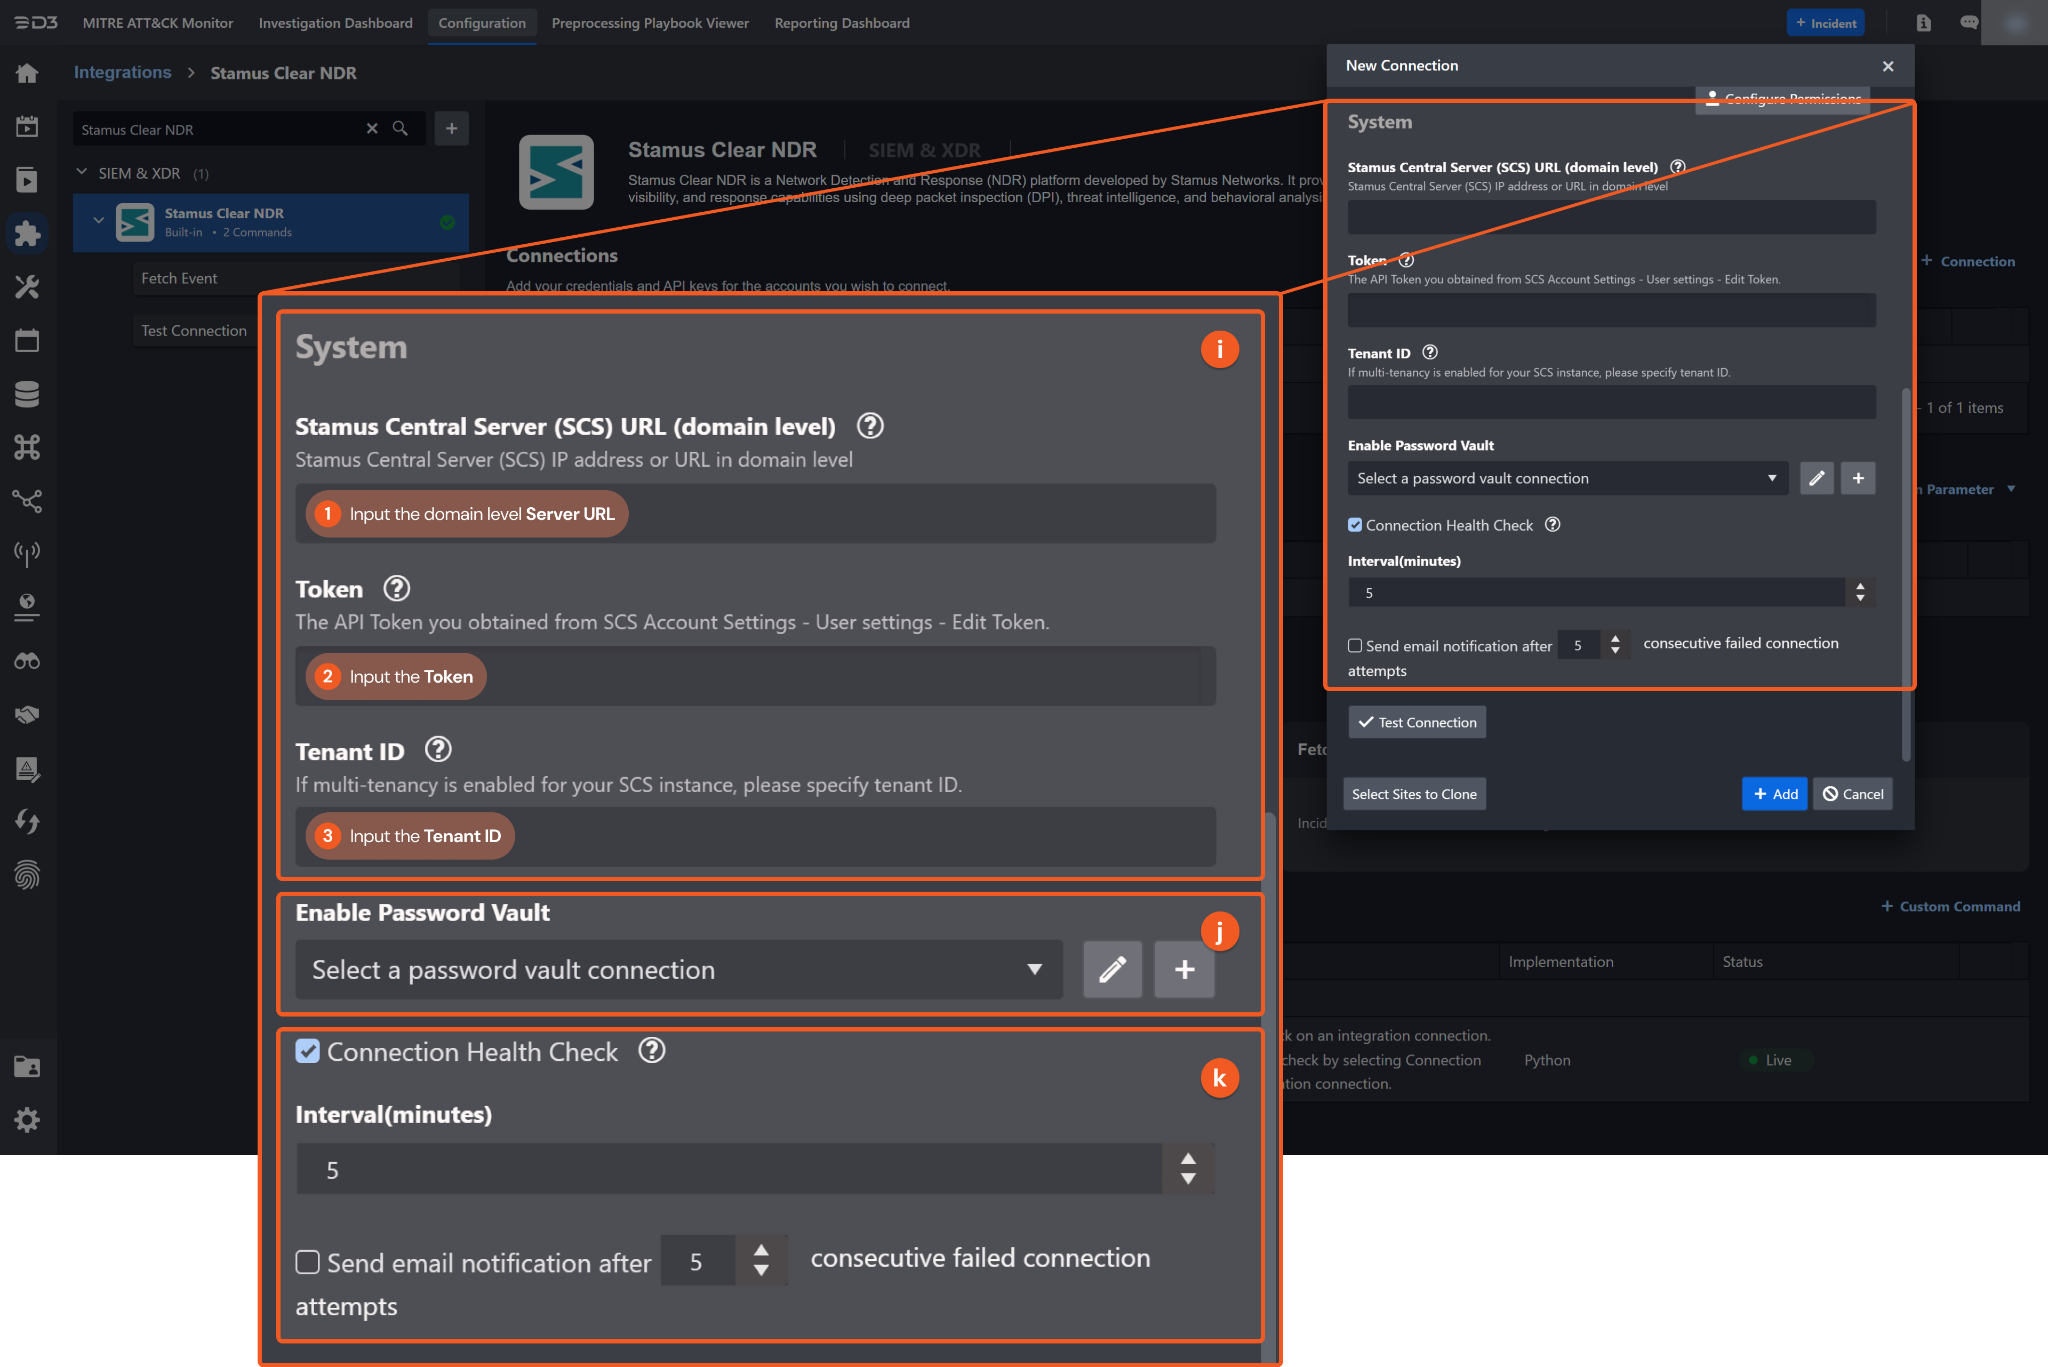
1. Input the Server URL.
2. Copy the Token from the Stamus Clear NDR platform. Refer to step 5 of Configuring Stamus Clear NDR to Work with D3 SOAR.
3. Input the Tenant ID if multi-tenancy is enabled.
Enable Password Vault: An optional feature that allows users to take the stored credentials from their own password vault. Refer to the password vault connection guide if needed.
Connection Health Check: Periodically checks the connection status by scheduling the Test Connection command at the specified interval (in minutes). Available only for active connections, this feature also allows configuring email notifications for failed attempts.
Test the connection.
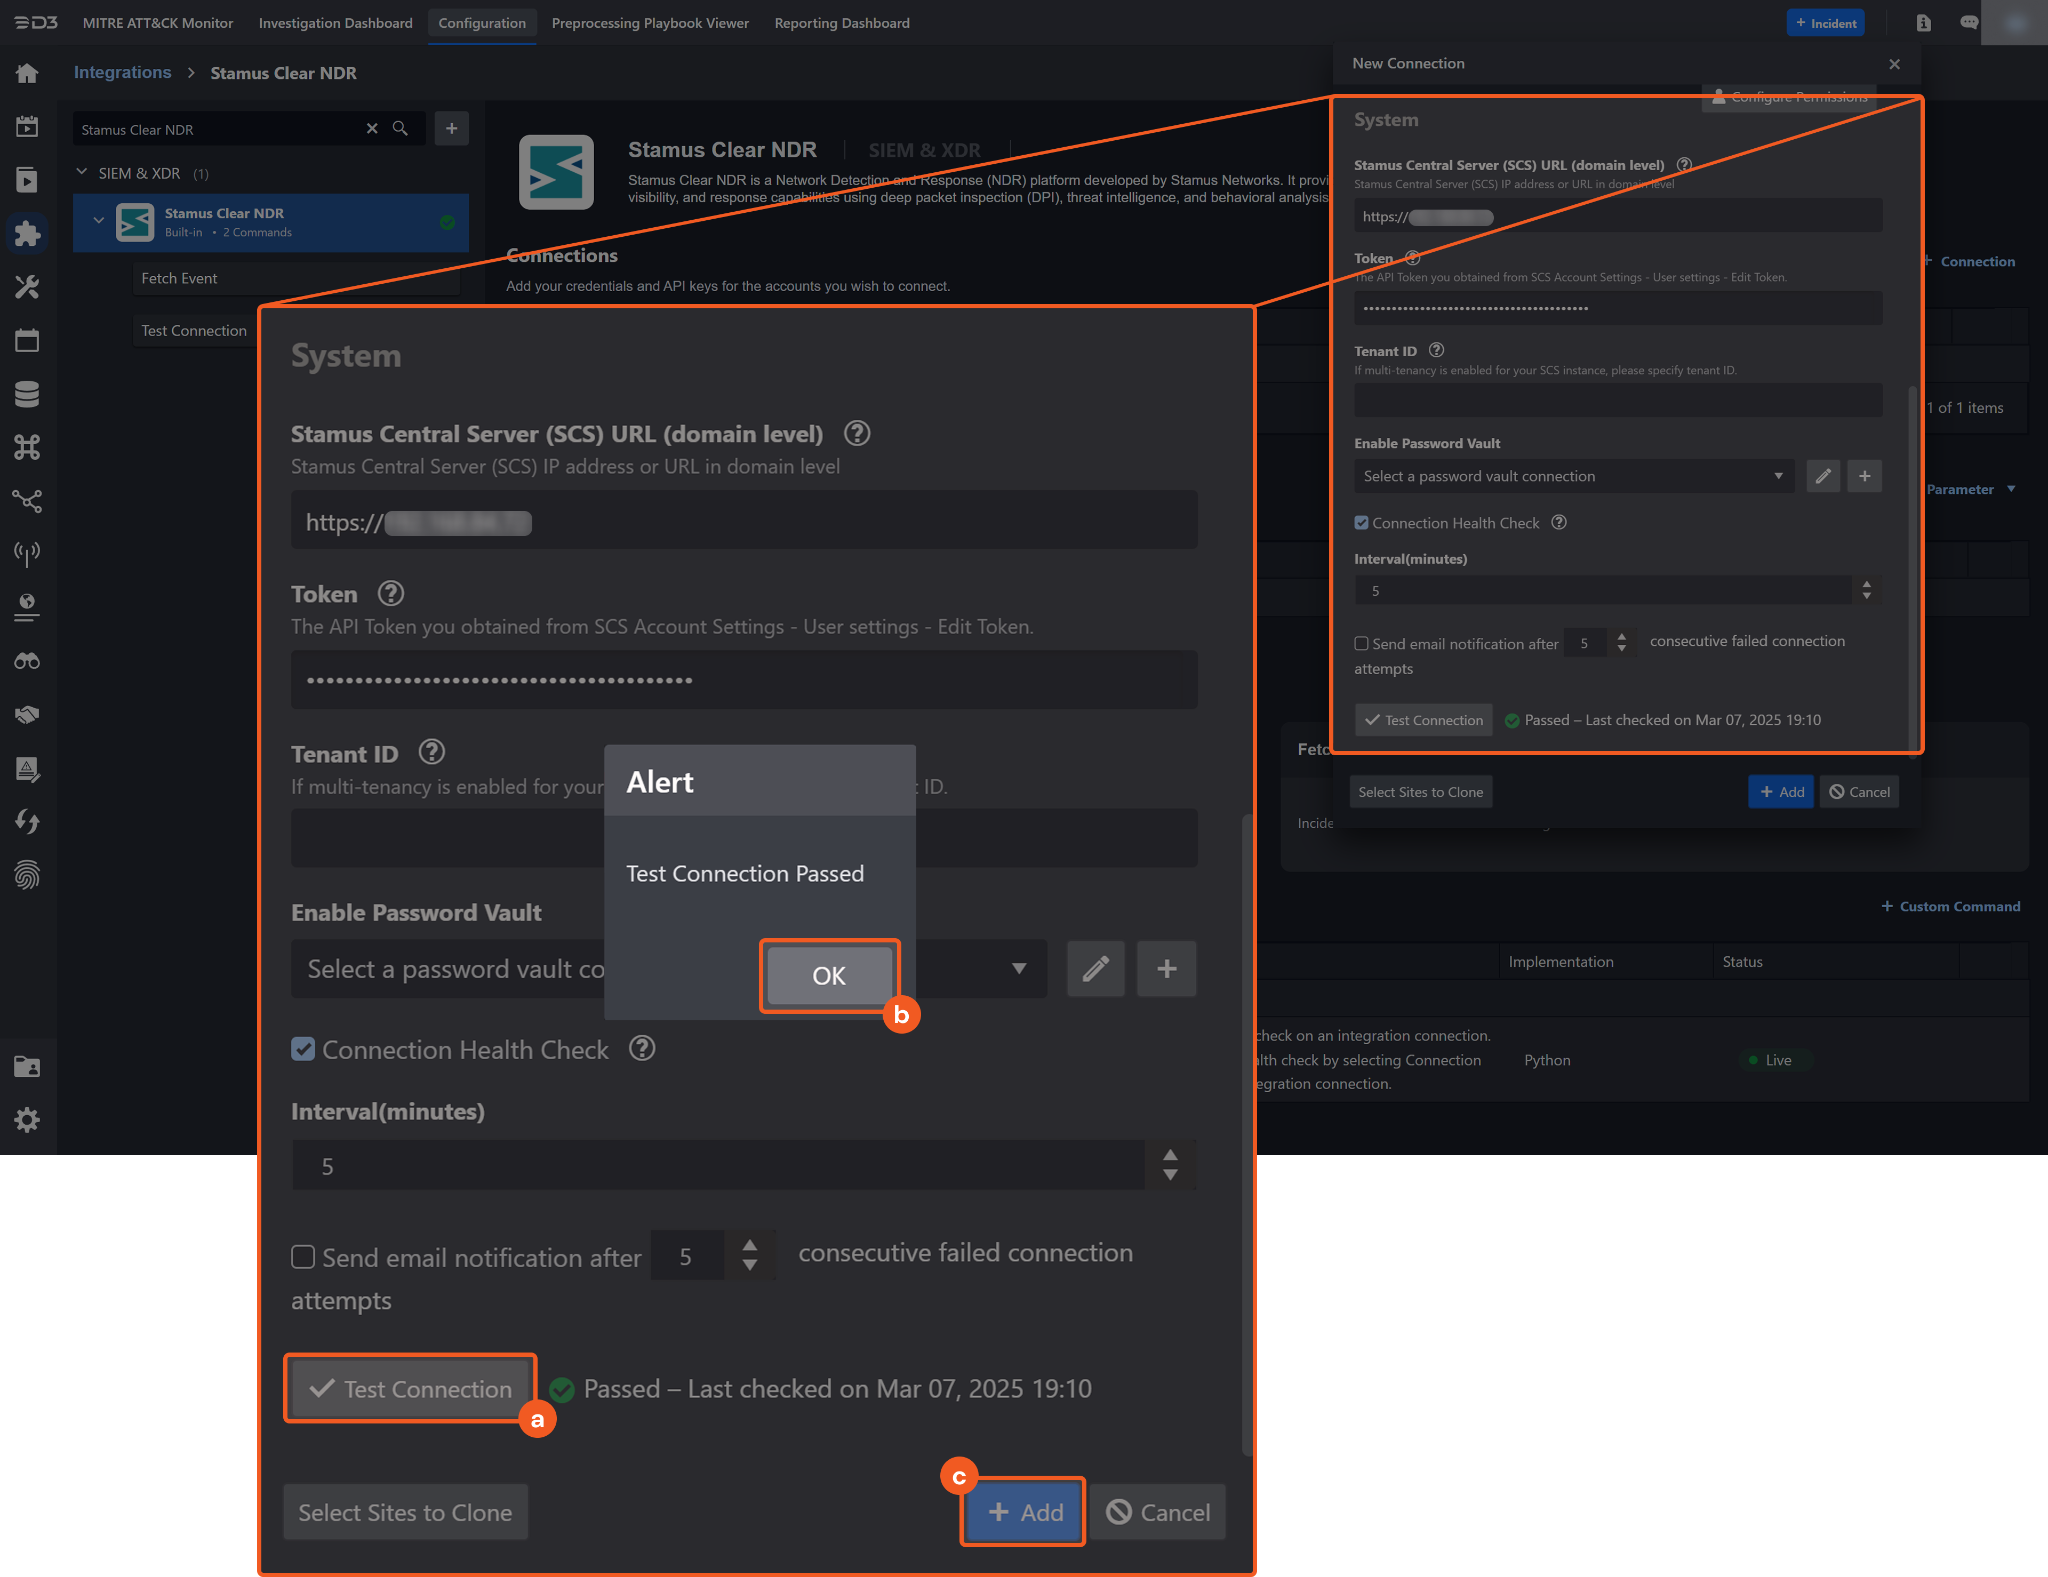
Click on the Test Connection button to verify credentials and connectivity. A success alert displays Passed with a green checkmark. If the connection fails, review the parameters and retry.
Click OK to close the alert window.
Click + Add to create and add the configured connection.
Commands
Stamus Clear NDR includes the following executable commands for users to set up schedules or create playbook workflows. With the Test Command function, users can execute these commands independently for playbook troubleshooting.
Integration API Note
For more information about the Stamus Clear NDR API, refer to the Stamus Clear NDR API reference.
Note for Time-related parameters
The input format of time-related parameters may vary based on user account settings, which may cause the sample data in commands to differ from what is displayed. To adjust the time format, follow these steps:
Navigate to Configuration > Application Settings. Select Date/Time Format.
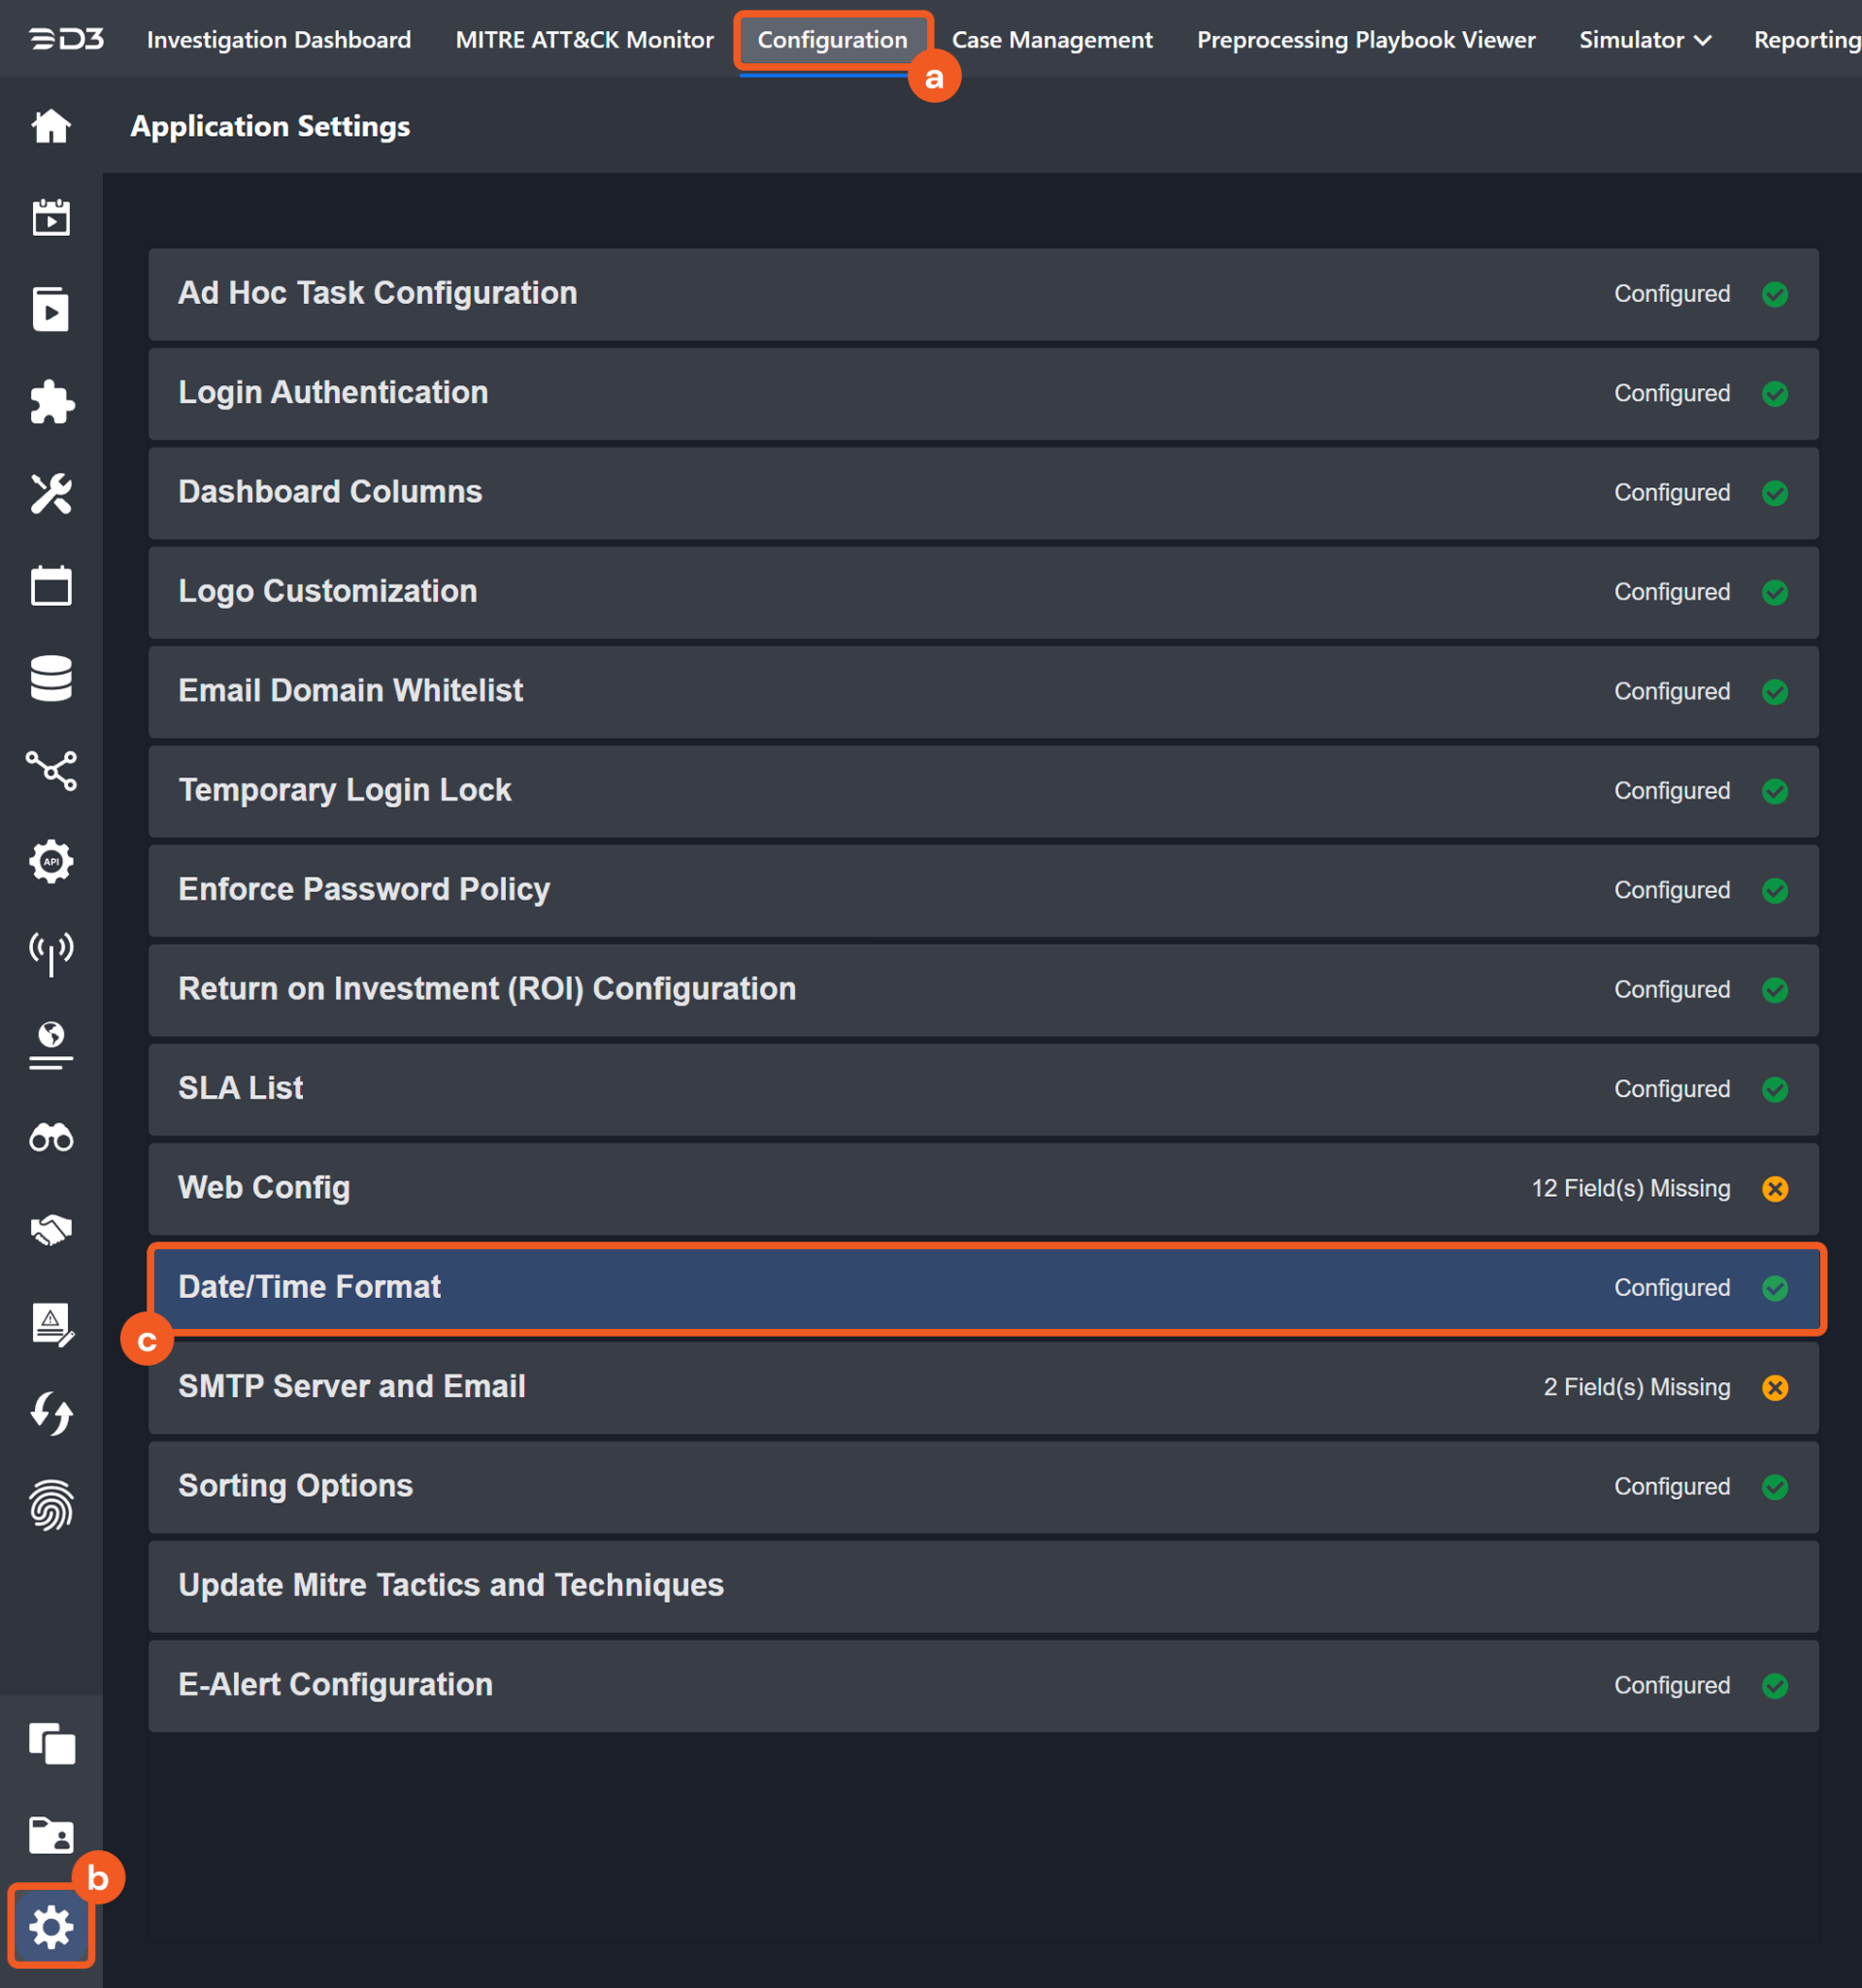
Choose the desired date and time format, then click on the Save button.
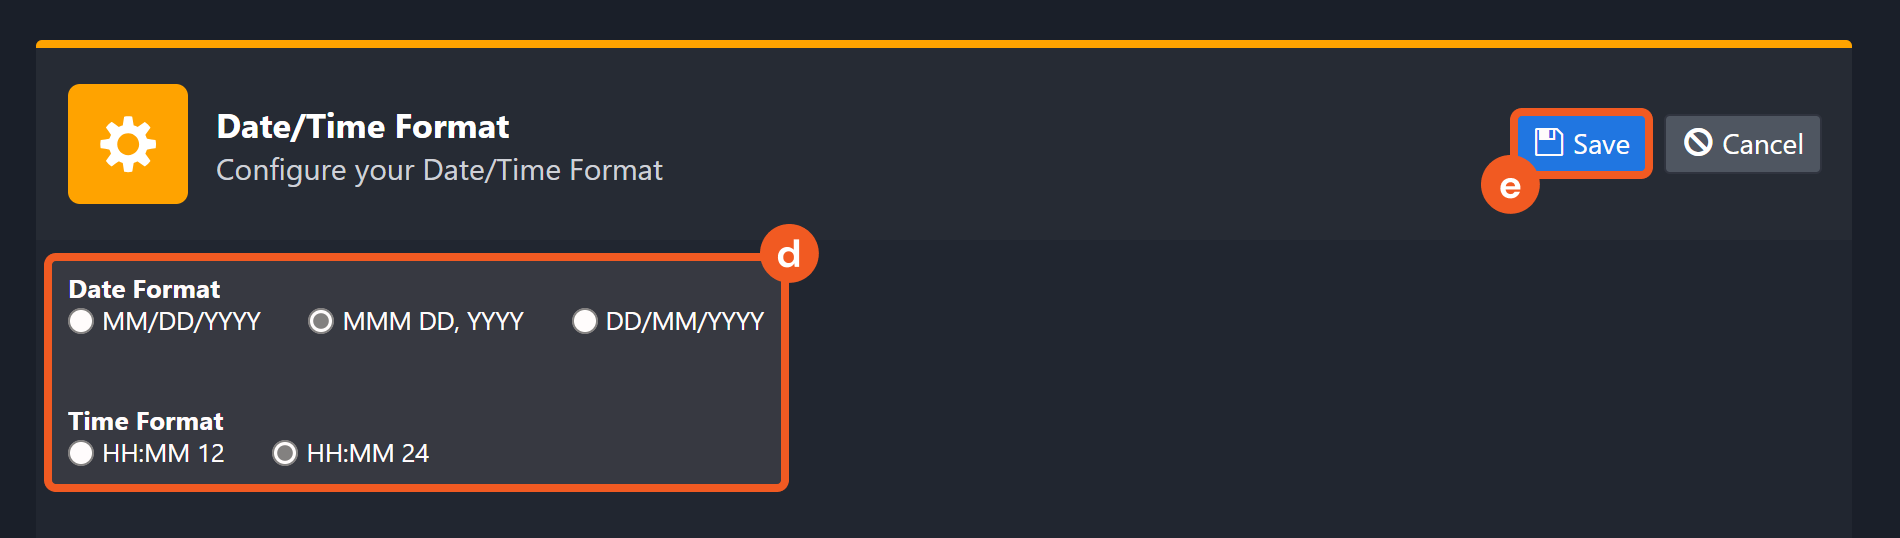
The selected time format will now be visible when configuring Date/Time command input parameters.
Fetch Event
Ingests Hunting Events or NTA/NSM Events. For multi-tenant SCS instances, only Hunting Events or NTA/NSM events from the tenant ID specified in the connection parameter will be ingested.
Input
Input Parameter | Required/Optional | Description | Example |
Event Type | Required | The type of events to be ingested.
| HuntingEvent |
Start Time | Optional | The start of the time range for fetching events (in UTC). By default, the Start Time is 24 hours before the End Time. | 12/20/2024 10:30 AM |
End Time | Optional | The end of the time range for fetching events (in UTC). By default, the End Time is the current time. | 12/23/2024 07:23 PM |
Number of Event(s) Fetched | Optional | The maximum number of events to return for each project. By default, all events matching the search criteria will be returned. Valid values are integers from 1 to 100. | 10 |
Query Filter | Optional | Filters Hunting Events and NTA/NSM Events using a query. | host:suricata AND event_type:stats |
Output
To view the sample output data for all commands, refer to this article.
Fetch Event Field Mapping
Fetch Event commands require event field mapping. Field mapping plays a key role for data normalization within the event pipeline. Field mapping converts the original data fields from the different providers to standardized D3 fields as defined by the D3 Model. Refer to Event and Incident Intake Field Mapping for details.
To add a custom field, click on the + Add Field button. Users can also remove built-in field mappings by clicking x. Note that two underscore characters will automatically prefix the defined Field Name as the System Name for a custom field mapping. Additionally, if an input Field Name contains any spaces, they will automatically be replaced with underscores for the corresponding System Name.
Default Event Source
For this integration, no default field mapping is provided. The D3 system configures field mappings only for fields common for Hunting Events and NTA/NSE Events. The default event source has a "Main Event JSON Path" (i.e., $.results) that is used to extract a batch of events from the response raw data. Click Edit Event Source to view the "Main Event JSON Path."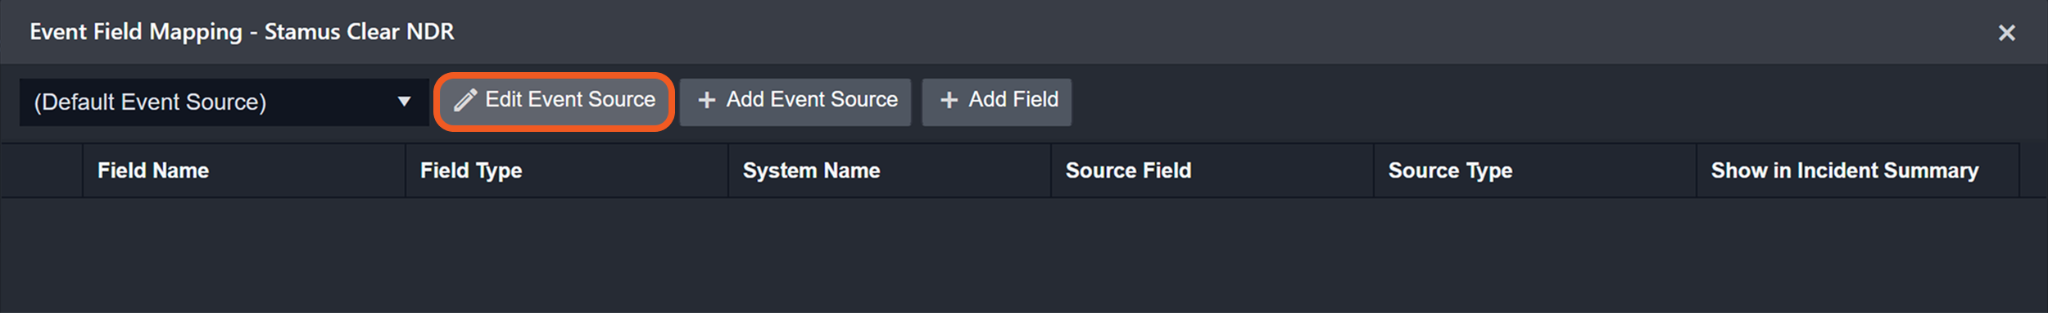
Main Event JSON Path: $.results
The Main Event JSON Path determines the root path where the system starts parsing raw response data into D3 event data. The JSON path begins with $, representing the root element. The path is formed by appending a sequence of child elements to $, each separated by a dot (.). Square brackets with nested quotation marks ([‘...’]) should be used to separate child elements in JSON arrays.
NTANSMEvent Event Source
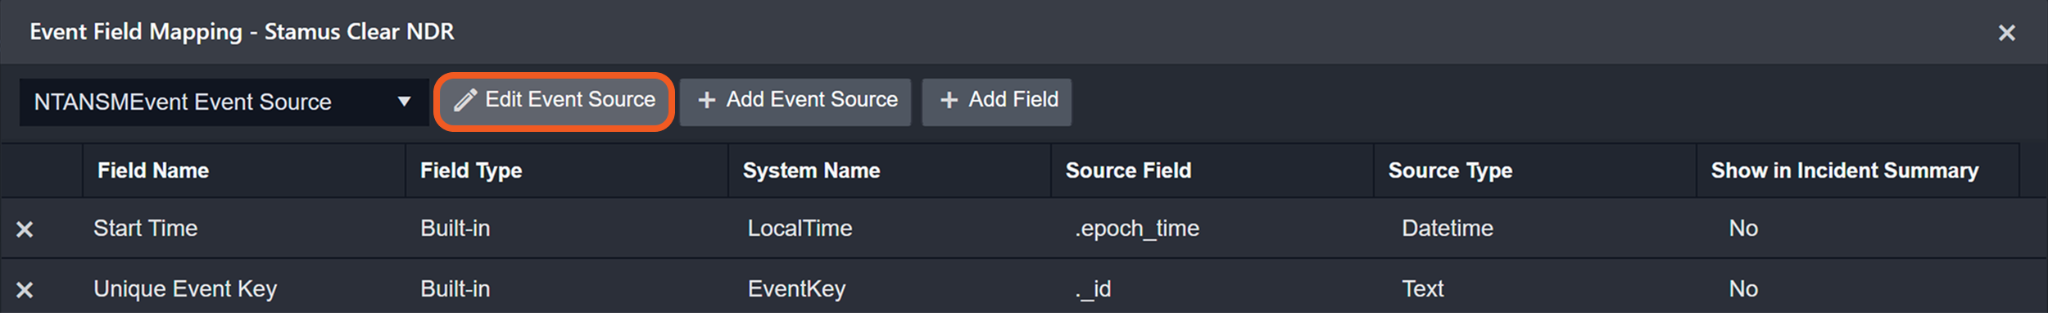
The D3 system configures the field mappings which are specific to the NTA/NTSM Event-related events (eg. Tag and Hostname). If a source field in the field mapping is not found, the corresponding field mapping will be ignored. Because the EventSource field in the raw data for NTA/NTSM Events consistently has the value NTANSMEvent, these events can be identified by the Search String: {$.EventSource}=NTANSMEvent. Click Edit Event Source to view the Search String.
The pre-configured field mappings are detailed below:
Field Name | Source Field |
NTANSMEvent Event Source (Search String: {$.EventSource}= NTANSMEvent) | |
Start Time | .epoch_time |
Unique Event Key | ._id |
Event Type | .event_type |
Tag | .tag |
Hostname | .host |
Hunting Event Source (Search String: {$.EventSource}= HuntingEvent) | |
Start Time | .epoch_time |
Source IP address | .src_ip |
Destination IP address | .dest_ip |
Tag | .alert.tag |
Unique Event Key | ._id |
Event Type | .event_type |
Method | .method |
Error Handling
If the Return Data displays Failed, an Error tab will appear in the Test Result window.
The error tab contains the details responded from D3 SOAR or third-party API calls, including Failure Indicator, Status Code, and Message. This can help locate the root cause of a command failure.
Parts in Error | Description | Example |
Failure Indicator | Indicates the command failure that happened at a specific input and/or API call. | Fetch Event failed. |
Status Code | The response code issued by the third-party API server or the D3 SOAR system that can be used to locate the corresponding error category. For example, if the returned status code is 401, the selected connection is unauthorized to run the command. The user or system support would need to check the permission setting in the Stamus Clear NDR portal. Refer to the HTTP Status Code Registry for details. | Status Code: 500. |
Message | The raw data or captured key error message from the integration API server about the API request failure. | Message: ES failure: ES transport error: 400 search_phase_execution_exception. |
Error Sample Data Fetch Event failed. Status Code: 500. Message: ES failure: ES transport error: 400 search_phase_execution_exception. |
Fetch Incident
Ingests threat incidents from Stamus.
Input
Input Parameter | Required/Optional | Description | Example |
Start Time | Optional | The start of the time range for fetching incidents (in UTC). By default, the Start Time is 24 hours before the End Time. | 12/20/2024 10:30 AM |
End Time | Optional | The end of the time range for fetching events (in UTC). By default, the End Time is the current time. | 12/23/2024 07:23 PM |
Number of Incident(s) Fetched | Optional | The maximum number of incidents to return. By default, all incidents matching the search criteria will be returned. Valid values are integers from 1 to 100. | 10 |
Incident Field Mapping
For this integration, the default incident fields in D3 SOAR contain built-in source fields.
Event and Incident Intake Field Mapping
Incident and event intake commands require both Event Field and Incident Field Mapping. These field mappings are the default event/incident field mappings for D3 system integrations. Users can edit the provided mappings or create custom mappings as needed. Refer to Event and Incident Intake Field Mapping for details.
Incident Main JSON Path: $.results
The pre-configured field mappings are detailed below:
Field Name | Source Field |
Title | User-defined |
Description | User-defined |
Severity | User-defined. |
Incident Category | User-defined. |
Incident Type * | User-defined |
Incident Creator | User-defined |
Incident Owner | User-defined |
Investigation Playbook | User-defined |
Due In Date | User-defined |
Origin ID | User-defined |
Unique Key | User-defined |
Tactics | User-defined |
Techniques | User-defined |
Event Field Mappings
Incident Event JSON Path:
$.events
The pre-configured event field mappings are detailed below:
Field Name | Source Field |
Hunting Event Source (Search String: {$.EventSource}= ThreatEvent) | |
Document ID | ._id |
Severity | .alert.severity |
Start Time | .epoch_time |
Event name | .threat_name |
Description | .stamus.family_name |
Hostname | .host |
Agent ID | .agent.id |
Protocol info | .proto |
Source MAC address | .ether.src_mac |
Destination MAC | .ether.dest_mac |
Source Port | .src_port |
Destination Port | .dest_port |
Source IP address | .src_ip |
Destination IP Address | .dest_ip |
Techniques | .alert.metadata.mitre_technique_id |
Tactics | .alert.metadata.mitre_tactic_id |
Event Type | .event_type |
Output
To view the sample output data for all commands, refer to this article.
Error Handling
If the Return Data displays Failed, an Error tab will appear in the Test Result window.
The error tab contains the details responded from D3 SOAR or third-party API calls, including Failure Indicator, Status Code, and Message. This can help locate the root cause of a command failure.
Parts in Error | Description | Example |
Failure Indicator | Indicates the command failure that happened at a specific input and/or API call. | Fetch Incident failed. |
Status Code | The response code issued by the third-party API server or the D3 SOAR system that can be used to locate the corresponding error category. For example, if the returned status code is 401, the selected connection is unauthorized to run the command. The user or system support would need to check the permission setting in the Stamus Clear NDR portal. Refer to the HTTP Status Code Registry for details. | Status Code: 403. |
Message | The raw data or captured key error message from the integration API server about the API request failure. | Message: Forbidden. |
Error Sample Data Fetch Incident failed. Status Code: 403. Message: Forbidden. |
Test Connection
Allows users to perform a health check on an integration connection. Users can schedule a periodic health check by selecting Connection Health Check when editing an integration connection.
Input
N/A
Output
Output Type | Description | Return Data Type |
Return Data | Indicates one of the possible command execution states: Successful or Failed. The Failed state can be triggered by any of the following errors:
More details about an error can be viewed in the Error tab. | String |
Error Handling
If the Return Data displays Failed, an Error tab will appear in the Test Result window.
The error tab contains the details responded from D3 SOAR or third-party API calls, including Failure Indicator, Status Code, and Message. This can help locate the root cause of a command failure.
Parts in Error | Description | Example |
Failure Indicator | Indicates the command failure that happened at a specific input and/or API call. | Test Connection failed. Failed to check the connector. |
Status Code | The response code issued by the third-party API server or the D3 SOAR system that can be used to locate the corresponding error category. For example, if the returned status code is 401, the selected connection is unauthorized to run the command. The user or system support would need to check the permission setting in the Stamus Clear NDR portal. Refer to the HTTP Status Code Registry for details. | Status Code: 403. |
Message | The raw data or captured key error message from the integration API server about the API request failure. | Message: Forbidden. |
Error Sample Data Test Connection failed. Failed to check the connector. Status Code: 403. Message: Forbidden. |