Splunk v2
LAST UPDATED: AUG 5, 2025
Overview
Splunk is a software platform to search, analyze and visualize the machine-generated data gathered from the websites, applications, sensors, devices etc. which make up IT infrastructure and business. The integration with Splunk can cover major actions such as fetch events, manage notable events and threat intelligence.
D3 SOAR is providing REST operations to function with Splunk v2.
Splunk v2 is available for use in:
D3 SOAR | V16.0.0+ |
Category | SIEM XDR |
Deployment Options |
Connection
To connect to Splunk v2 from D3 SOAR, please follow this part to collect the required information below:
Parameter | Description | Example |
Default | ||
Server URL | The domain-level URL of the Splunk server. | https://1.1.1.1:8089 |
Authentication Type | The authentication method to use for the connection. | Basic Authentication |
API Version | The API version to use for the connection. This parameter is only applicable for connections with Splunk Enterprise version 9.0 and newer. If your version of Splunk Enterprise is older than 9.0, leave this parameter empty. | v2 |
Basic Authentication | ||
Username | The username to authenticate the connection. | Admin |
Password | The password to authenticate the connection. | AdminPassword |
Bearer Token | ||
Token | The bearer token to authenticate the connection. | eyJra****MzE0N****4LgylIr****5b26A |
Permission Requirements
Each endpoint in the Splunk v2 API requires a certain permission scope. The following are required scopes for the commands in this integration:
Command | Required Permission |
Add Threat Intel Collection Row | admin_all_objects, edit_threat_intel_collections, (list_all_objects if exist) |
Create Event | edit_log_alert_event |
Delete Threat Intel Collection Row | admin_all_objects, edit_threat_intel_collections,list_all_objects |
Fetch Event | search |
Get Application List | None |
Get Lookup Table Content | None |
Get Recent Notable Events | search |
Get Status List | list_all_objects is enough unless it is not existing, use admin_all_objects instead |
List Indexes | None |
List Lookup Table Files | None |
List Threat Intel Collection Rows | edit_threat_intel_collections |
Search | search |
Submit Event | None |
Update Notable Events | edit_notable_events, admin_all_objects or list_all_objects |
Upload Files | edit_tcp |
Upload Lookup Tables | admin_all_objects, upload_lookup_files |
Test Connection | None |
As Splunk v2 is using role-based access control (RBAC), the API access token is generated based on a specific user account and the application. Therefore, the command permissions are inherited from the user account’s role. Users need to configure their user profile from the Splunk v2 console for each command in this integration.
READER NOTE
Splunk’s default user roles (sorted from the most permissions to the least) are as follows:
admin
can_delete
power
splunk-system-role
user
You can also create customized roles based on our provided capability, which will help you grant more specific permissions. Please refer to Access Control List and Splunk Platform Capabilities for details on configuring user profiles, Create and manage roles with Splunk Web for how to create customized roles.
Configuring Splunk v2 to Work with D3 SOAR
Log in to the Splunk Portal using your credentials.
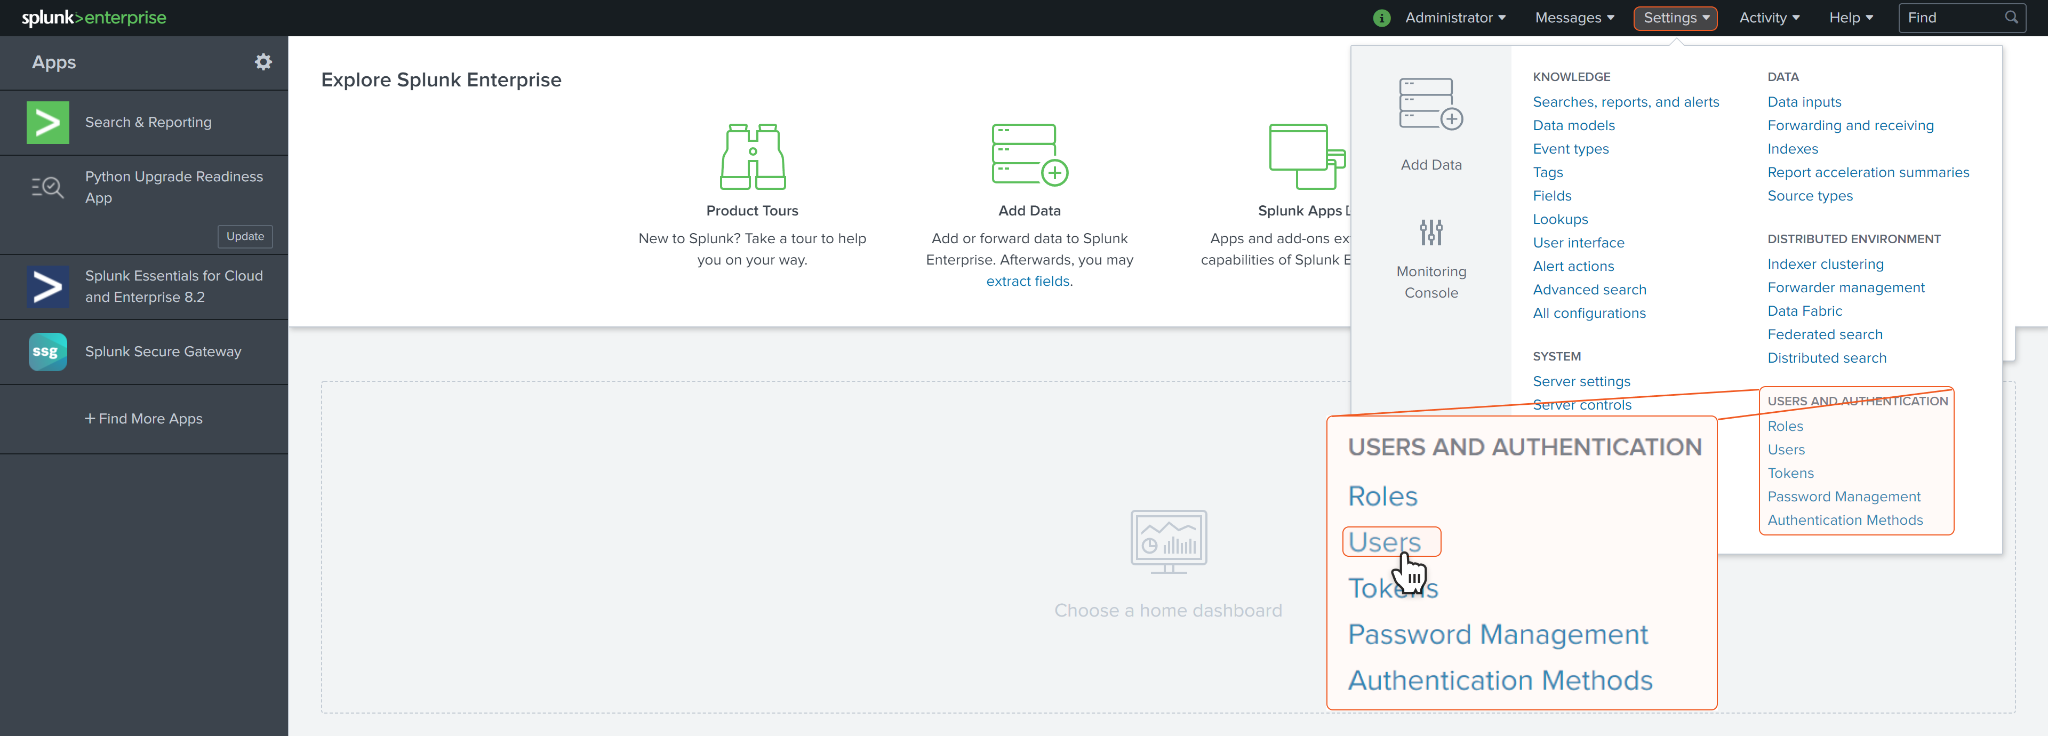
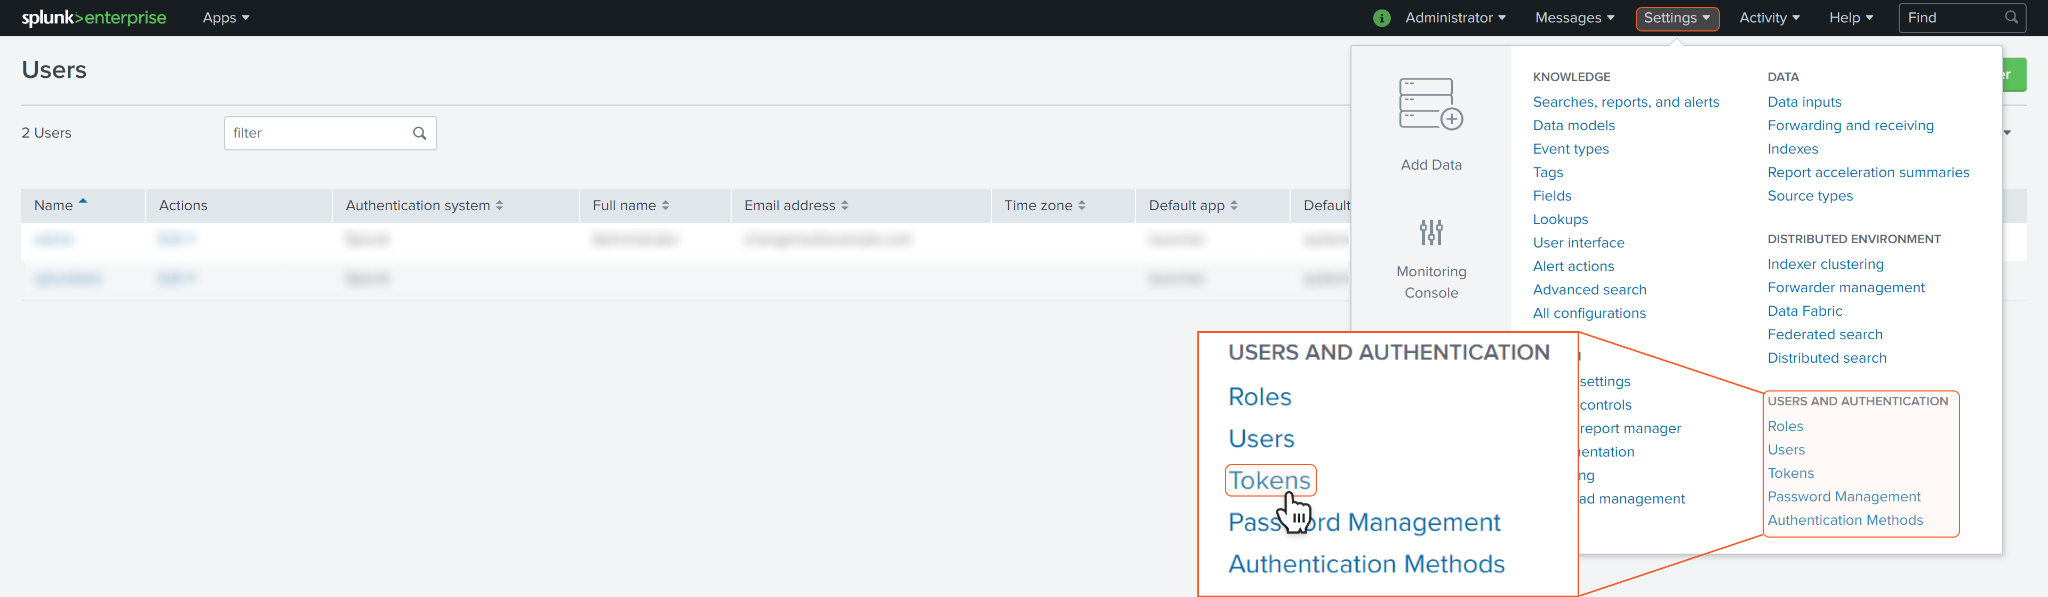
On the top bar menu, click on Settings, then select Users.
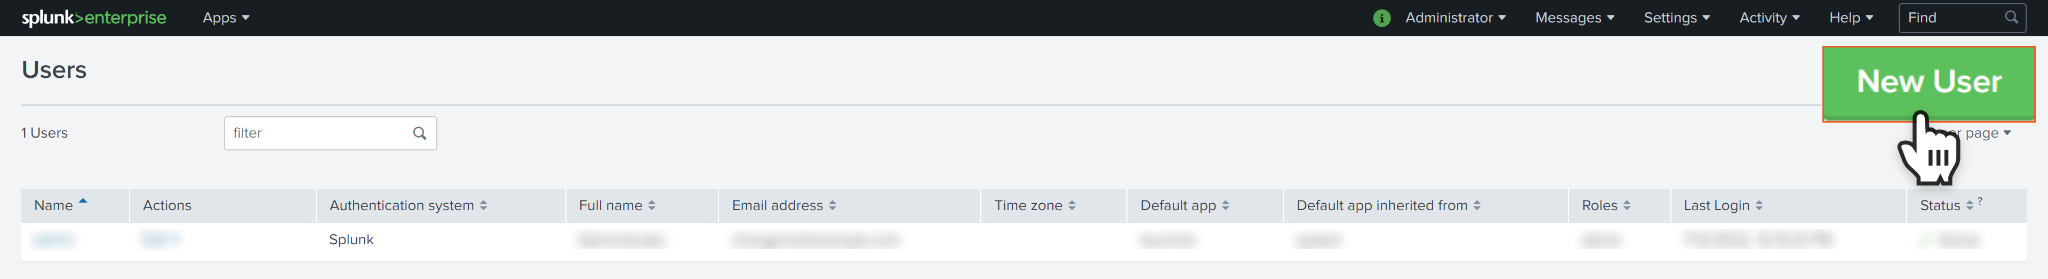
Click on New User.
Input the desired Username and Password for the user. Assign appropriate Roles to the user based outlined in Permission Requirements. Click Save to create the user. Your newly created user is now ready to be used.
READER NOTE
Once you have created a user, ensure that you log in to Splunk with the configured credentials to activate the account. Unactivated users cannot be used for connections. For more details, refer to Question 1 in the FAQ section.
For guidance on configuring capabilities for a role, refer to Create and manage roles with Splunk Web from Splunk's documentation.
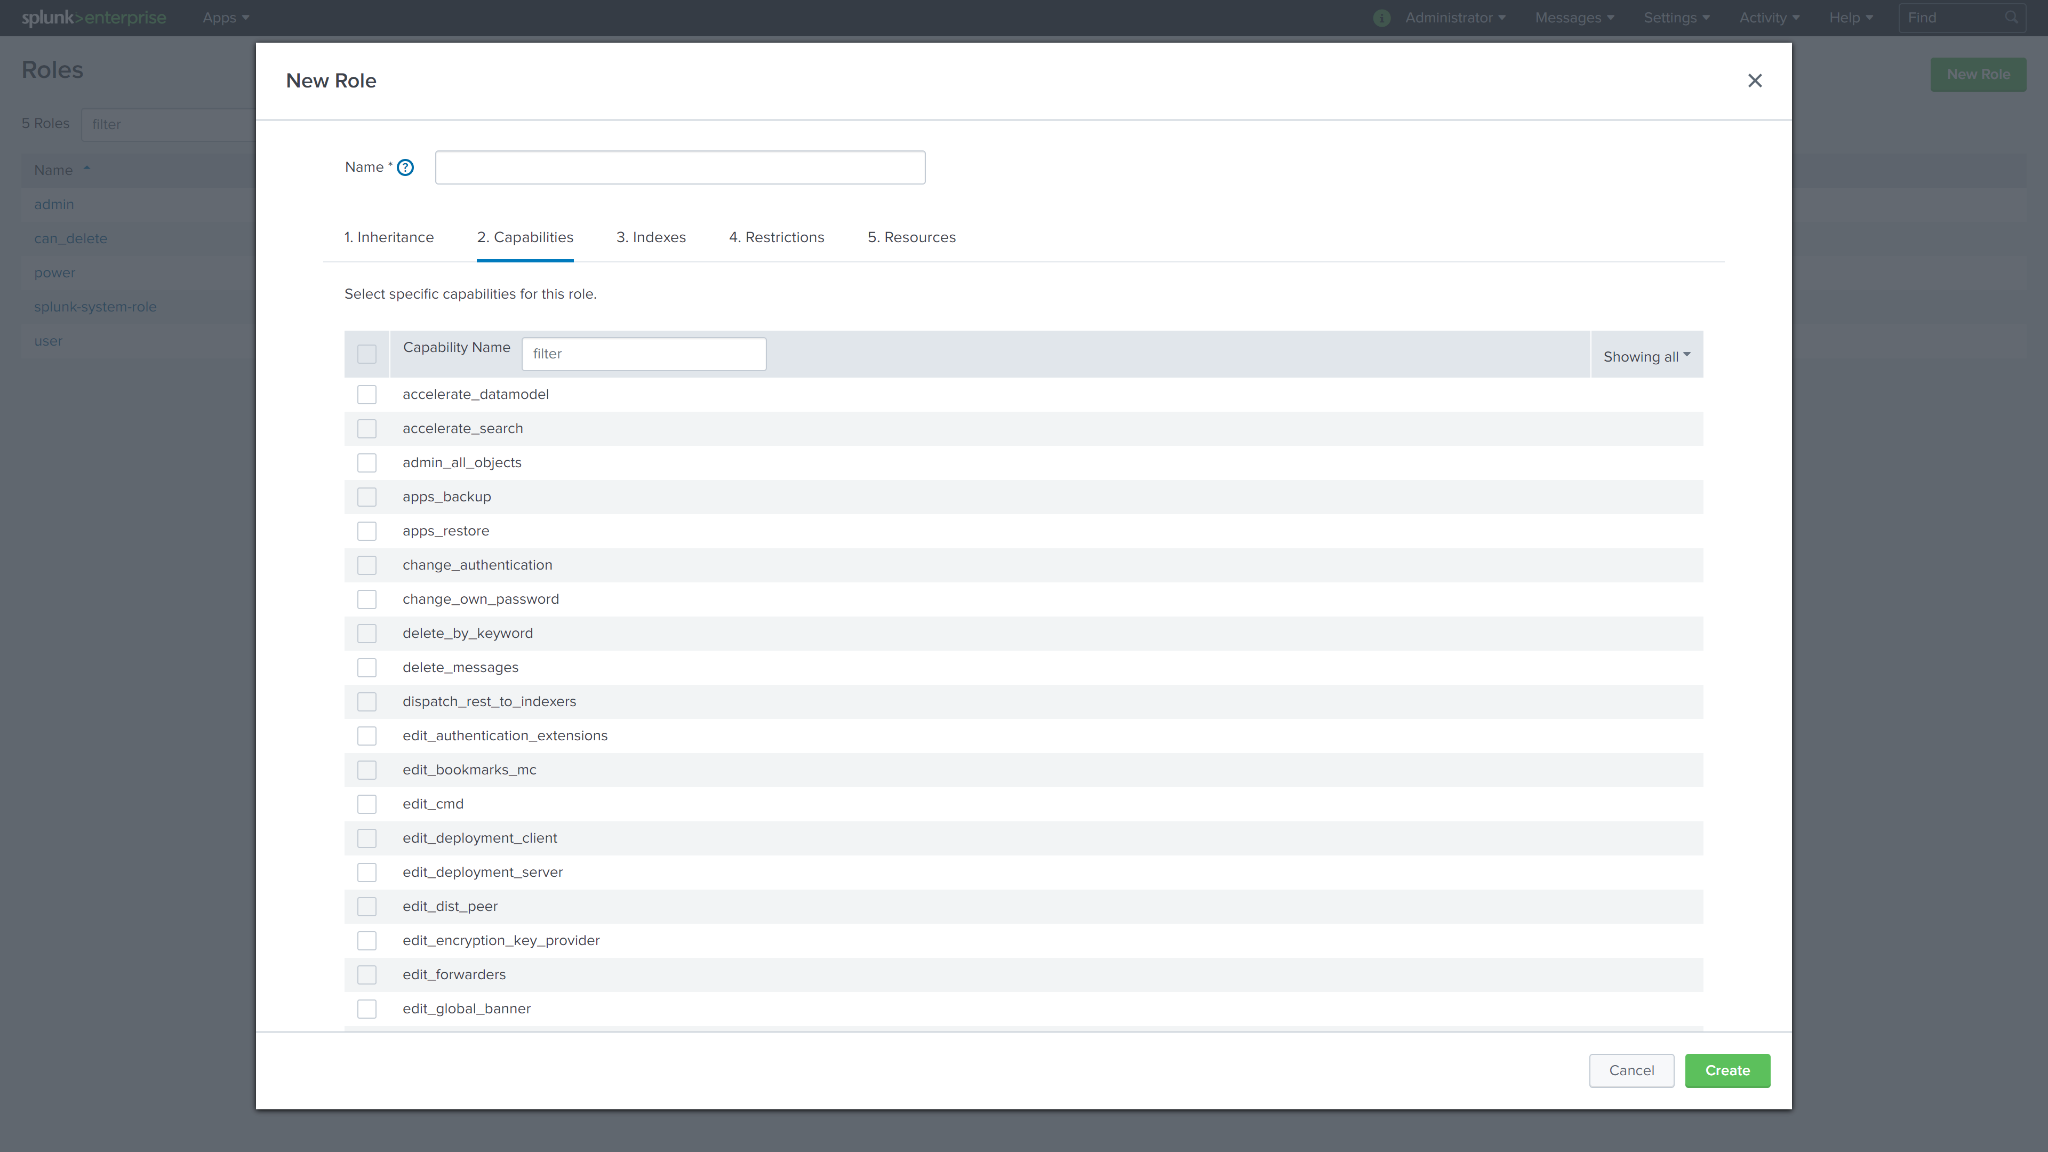
Customized roles can help you grant more specific permissions based on the Permission Requirements.
For Splunk to work with D3 SOAR, you may need to obtain Tokens. Click on Settings and select Tokens.
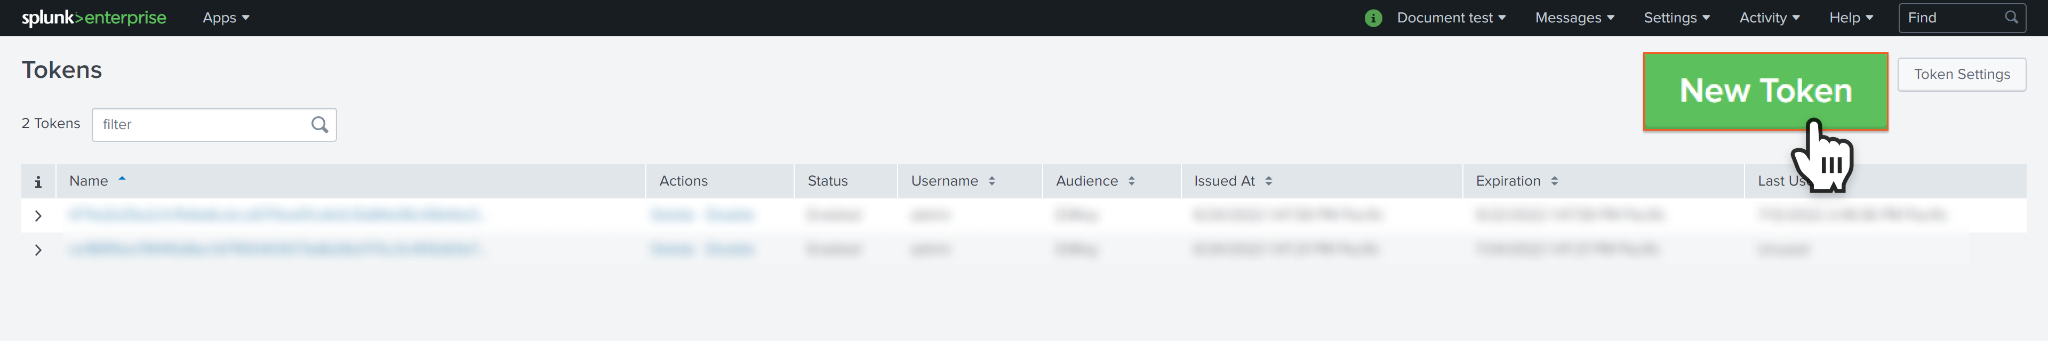
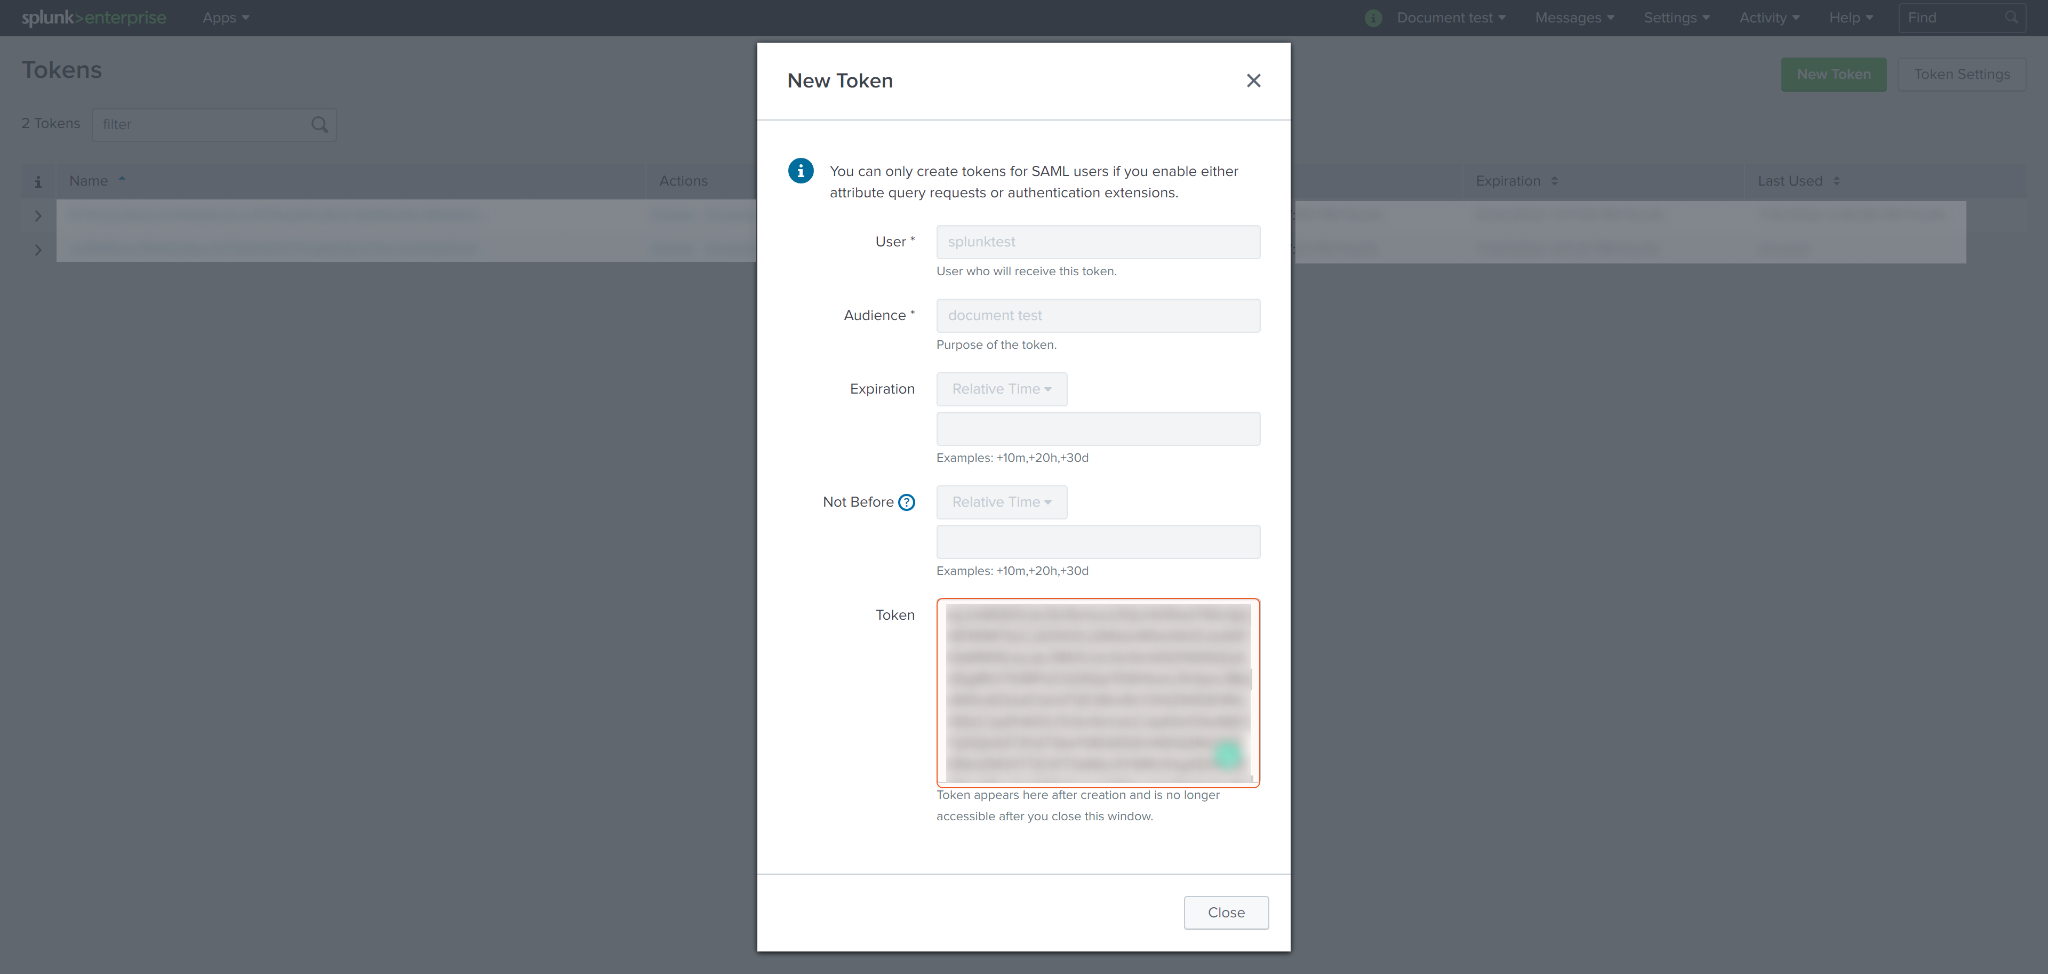
Click on New Token.
Specifies the User who will receive this token. Select the user carefully, as the generated token will inherit their permissions. Fill in the Audience field and any other optional fields if desired. Click Create to confirm and generate the token.
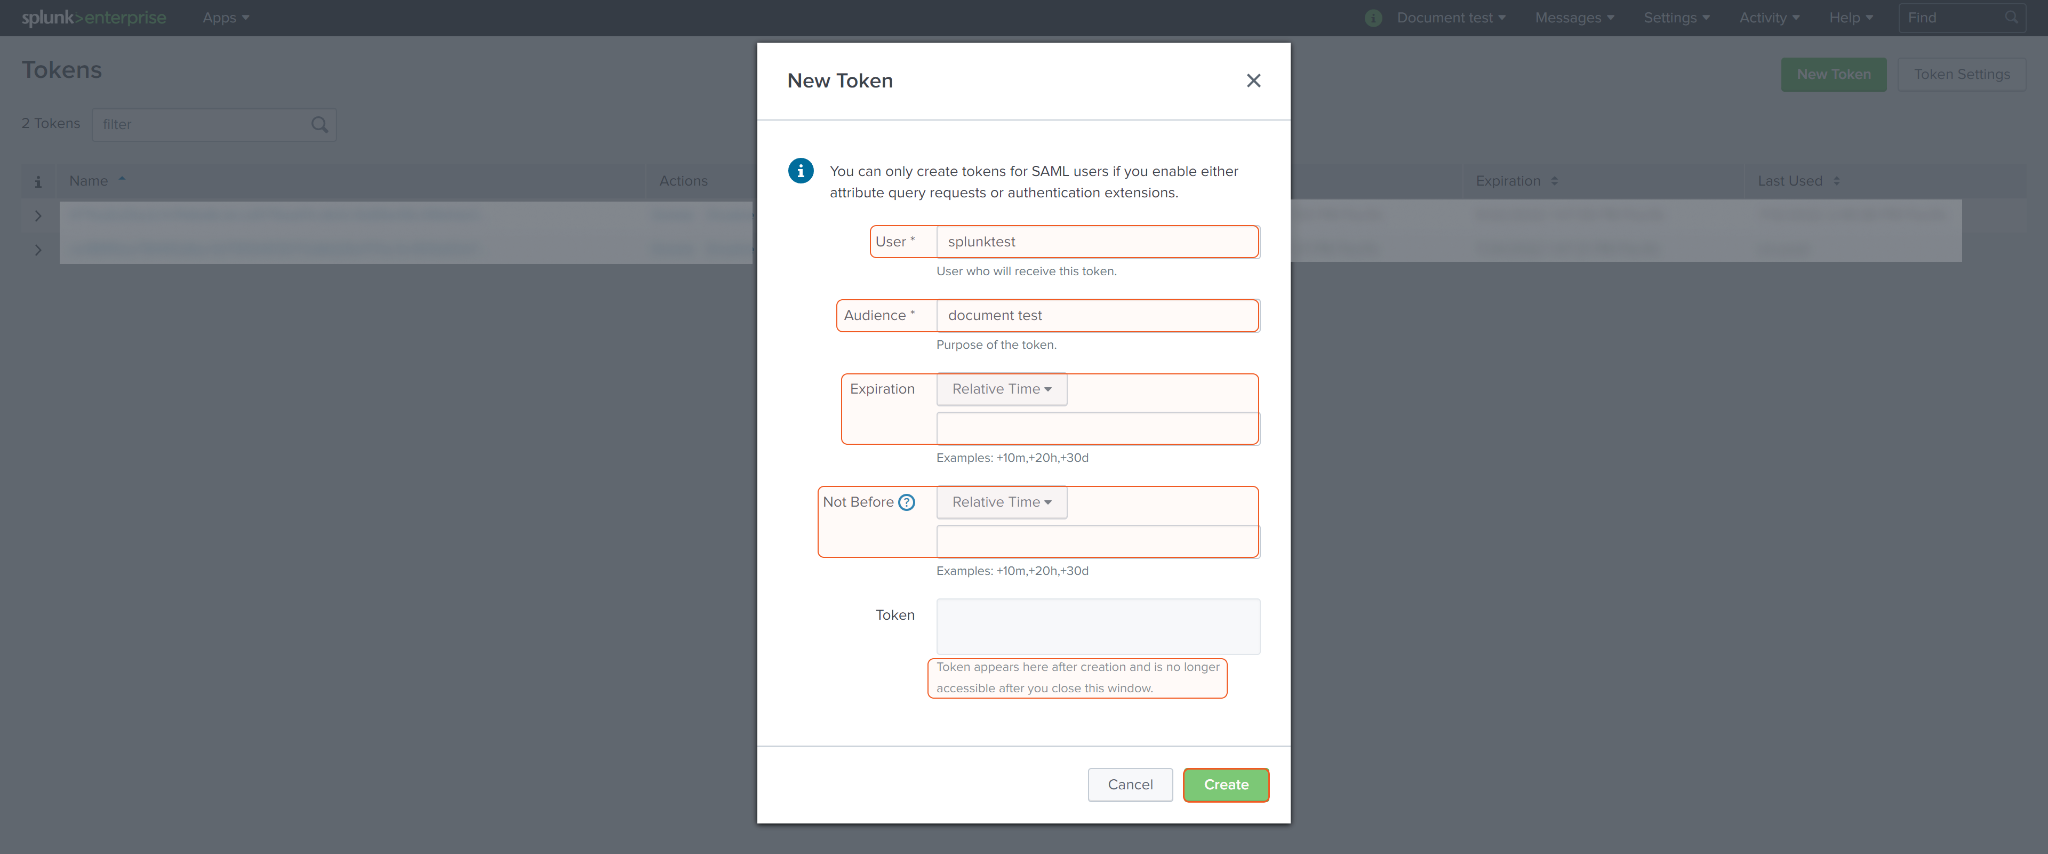
Once the token is generated, be aware that it will only appear once after the initial creation and will no longer be accessible after you close the window. Store the token in a secure location for future use.
Configuring D3 SOAR to Work with Splunk v2
Log in to D3 SOAR.
Find the Splunk v2 integration.
-20241023-165855.png?inst-v=9d16beaf-952a-4ae4-8fe8-e35f7a3745da)
Navigate to Configuration on the top header menu.
Click on the Integration icon on the left sidebar.
Type Splunk v2 in the search box to find the integration, then click it to select it.
Click + New Connection, on the right side of the Connections section. A new connection window will appear.
Configure the following fields to create a connection to Splunk v2.
-20241023-170013.png?inst-v=9d16beaf-952a-4ae4-8fe8-e35f7a3745da)
Connection Name: The desired name for the connection.
Site: The site on which to use the integration connection. Use the drop-down menu to select the site. The Share to Internal Sites option enables all internal sites to use the connection. Selecting a specific site will only enable that site to use the connection.
Recipient site for events from connections Shared to Internal Sites: This field is displayed when Share to Internal Sites is selected for the Site field, allowing selection of the internal site for deploying the integration connection.
Agent Name (Optional): The proxy agent required to build the connection. Use the dropdown menu to select the proxy agent from a list of previously configured proxy agents.
Description (Optional): The description for the connection.
Tenant (Optional): When configuring the connection from a master tenant site, users can choose the specific tenant sites with which to share the connection. Once this setting is enabled, users can filter and select the desired tenant sites from the dropdowns to share the connection.
Configure User Permissions: Defines which users have access to the connection.
Active: The checkbox that enables the connection to be used when selected.
System: This section contains the parameters defined specifically for the integration. These parameters must be configured to create the integration connection.
Authenticating with Basic Authentication
-20241023-170056.png?inst-v=9d16beaf-952a-4ae4-8fe8-e35f7a3745da)
1. Input your Server URL.
2. Select Basic Authentication for Authentication Type.
3. Input your Username. See step 4 of Configuring Splunk v2 to work with D3 SOAR.
4. Input your Password. See step 4 of Configuring Splunk v2 to work with D3 SOAR.
5. Input your API Version. Default is v2.
Authenticating with Bearer Token-20241023-170130.png?inst-v=9d16beaf-952a-4ae4-8fe8-e35f7a3745da)
1. Input your Server URL.
2. Select Bearer Token for Authentication Type.
3. Input your Token. See step 5-8 of Configuring Splunk v2 to work with D3 SOAR.
4. Input your API Version. Default is v2.Connection Health Check: Periodically checks the connection status by scheduling the Test Connection command at the specified interval (in minutes). Available only for active connections, this feature also allows configuring email notifications for failed attempts.
Enable Password Vault: An optional feature that allows users to take the stored credentials from their own password vault. Refer to the password vault connection guide if needed.
Test the connection.
-20241023-170327.png?inst-v=9d16beaf-952a-4ae4-8fe8-e35f7a3745da)
Click on the Test Connection button to verify credentials and connectivity. A success alert displays Passed with a green checkmark. If the connection fails, review the parameters and retry.
Click OK to close the alert window.
Click +Add to create and add the configured connection.
Commands
Splunk v2 includes the following executable commands for users to set up schedules or create playbook workflows. With the Test Command, users can execute these commands independently for playbook troubleshooting.
Integration API Note
For more information about the Splunk v2 API, refer to Enterprise Security and Splunk Enterprise for more information.
READER NOTE
Certain permissions are required for each command. Refer to the Permission Requirements and Configuring Splunk v2 to Work with D3 SOAR for details.
Note for Time-related parameters
The input format of time-related parameters may vary based on user account settings, which may cause the sample data in commands to differ from what is displayed. To adjust the time format, follow these steps:
Navigate to Configuration > Application Settings. Select Date/Time Format.
-20241023-170402.png?inst-v=9d16beaf-952a-4ae4-8fe8-e35f7a3745da)
Choose the desired date and time format, then click on the Save button.
-20241023-170420.png?inst-v=9d16beaf-952a-4ae4-8fe8-e35f7a3745da)
The selected time format will now be visible when configuring Date/Time command input parameters.
Add Threat Intel Collection Row
Adds a row to a threat intel collection.
READER NOTE
Ensure the input collection name corresponds to the item being added. For example, if you select "IP Intel" as the collection name, the item must contain either "ip=xxx" or "domain=xxx" or both. See the description for the Item input parameter for a comprehensive list of collection names and corresponding important fields.
Input
Input Parameter | Required/Optional | Description | Example |
Collection Name | Required | The name of the collection to add a row. Select a collection name from the dropdown list. | ip_intel |
Item | Required | The item to add to the threat intel collection row. An item to be added is defined by the following syntax: <FieldName1>=<FieldValue1> <FieldName2>=<FieldValue2>... For example, to define an item with an IP address of 10.10.10.11 and a domain of google1.com, you would use the syntax: ip=10.10.10.11 domain=google1.com. The FieldName in the syntax must contain at least one of the important fields associated with the modification of the threat intelligence collection. The threat intelligence collections and their respective fields (in brackets) are as follows: user_intel(user) file_intel(file_name,file_hash) ip_intel(ip,domain) http_intel(http_user_agent,ip,http_referrer,url,domain) email_intel(embedded_domain, src_user, subject, file_hash, file_name, embedded_ip) service_intel(service_file_hash, service_dll_file_hash, service_dll_file_name, service_file_name, service) process_intel(dest, src, process_file_name, process) registry_intel(registry_path, registry_value_name, registry_value_text, user) certificate_intel(certificate_issuer_common_name, certificate_subject_common_name, certificate_common_name, certificate_issuer_organization, certificate_subject_organization, certificate_serial, certificate_issuer, certificate_subject, certificate_issuer_unit) | ip=10.10.10.11 domain=google1.com |
Autofill Time Field | Optional | The option to auto-fill the time field when set to True. The default setting is True. | True |
Output
To view the sample output data for all commands, refer to this article.
Error Handling
If the Return Data is Failed, an Error tab will appear in the Test Result window.
The error tab contains the details responded from D3 SOAR or third-party API calls, including Failure Indicator, Status Code, and Message. This can help you locate the root cause of a command failure.
Parts in Error | Description | Example |
Failure Indicator | Indicates the command failure that happened at a specific input and/or API call. | Add Threat Intel Collection Row failed. |
Status Code | The response code issued by the third-party API server or the D3 SOAR system that can be used to locate the corresponding error category. For example, if the returned status code is 401, the selected connection is unauthorized to run the command. The user or system support would need to check the permission setting in the Splunk v2 portal. Refer to the HTTP Status Code Registry for details. | Status Code: 400. |
Message | The raw data or captured key error message from the integration API server about the API request failure. | Message: not enough values to unpack. |
Error Sample Data Add Threat Intel Collection Row failed. Status Code: 400. Message: not enough values to unpack. |
Create Event
Creates events from the contents contained in the HTTP body.
READER NOTE
Index is an optional parameter to run this command.
Run the List Indexes command to obtain Index. Index can be found in the returned raw data at the path $.entry[*].name.
Input
Input Parameter | Required/Optional | Description | Example |
Event | Required | The raw text of the event. This is the entirety of the HTTP request body. | Thursday, August 11, 2022 11:11:11 AM Create event with REST API on POSTMAN. |
Index | Optional | The name of the destination index where events are sent. If this parameter is not defined, the default value is default. Index names can be obtained using the List Indexes command. | main |
Host | Optional | The host name to populate in the host field for events from this data input. | win-10-*** |
Source | Optional | The source value to populate the metadata for the events associated with this input. | postmand3lab |
Source Type | Optional | The source type to apply to events from this input. | REST |
Output
To view the sample output data for all commands, refer to this article.
Error Handling
If the Return Data is Failed, an Error tab will appear in the Test Result window.
The error tab contains the details responded from D3 SOAR or third-party API calls, including Failure Indicator, Status Code, and Message. This can help you locate the root cause of a command failure.
Parts in Error | Description | Example |
Failure Indicator | Indicates the command failure that happened at a specific input and/or API call. | Create Event failed. |
Status Code | The response code issued by the third-party API server or the D3 SOAR system that can be used to locate the corresponding error category. For example, if the returned status code is 401, the selected connection is unauthorized to run the command. The user or system support would need to check the permission setting in the Splunk v2 portal. Refer to the HTTP Status Code Registry for details. | Status Code: 400. |
Message | The raw data or captured key error message from the integration API server about the API request failure. | Message: A connection attempt failed because the connected party did not properly respond after a period of time, or established connection failed because connected host has failed to respond. |
Error Sample Data Create Event failed. Status Code: 400. Message: A connection attempt failed because the connected party did not properly respond after a period of time, or established connection failed because connected host has failed to respond. |
Delete Threat Intel Collection Row
Deletes a row from a collection. Note: The delete operation does not delete the row from the KV Store. Instead, the entry is disabled from participating in threat intelligence matching.
READER NOTE
Ensure that the input Collection Name corresponds to the input Item Key. It is recommended to run the List Threat Intel Collection Rows command with the desired Collection Name. From the resulting raw data, select the desired key located at the path $.message[*]._key. Using the retrieved pair of values to run this command will ensure that the input values are aligned.
Input
Input Parameter | Required/Optional | Description | Example |
Collection Name | Required | The name of the collection to delete a row. | IP Intel |
Item Key | Required | The key of the item to delete. Item keys can be obtained using the List Threat Intel Collection Rows command. | C7*****0fe |
Output
To view the sample output data for all commands, refer to this article.
Error Handling
If the Return Data is Failed, an Error tab will appear in the Test Result window.
The error tab contains the details responded from D3 SOAR or third-party API calls, including Failure Indicator, Status Code, and Message. This can help you locate the root cause of a command failure.
Parts in Error | Description | Example |
Failure Indicator | Indicates the command failure that happened at a specific input and/or API call. | Delete Threat Intel Collection Row failed. |
Status Code | The response code issued by the third-party API server or the D3 SOAR system that can be used to locate the corresponding error category. For example, if the returned status code is 401, the selected connection is unauthorized to run the command. The user or system support would need to check the permission setting in the Splunk v2 portal. Refer to the HTTP Status Code Registry for details. | Status Code: 400. |
Message | The raw data or captured key error message from the integration API server about the API request failure. | Message: No matching entries found in kvstore. |
Error Sample Data Delete Threat Intel Collection Row failed. Status Code: 400. Message: No matching entries found in kvstore. |
Fetch Event
Returns event(s) from Splunk based on specified search criteria. You can ingest Events or Notable Events with this command. Refer to Search Command Examples from Splunk's documentation for search examples.
READER NOTE
If you encounter the error message "The raw data has reached the maximum size (100 MB)", it indicates that the size of the returned data is too large to be displayed. This occurs due to the imposed limit of 100 MB for all D3 query results. It is recommended to refer to the Use Case section and use other commands to obtain your desired results.
While it is still possible to retrieve notable events by specifying the Event Type as "Generic Event" and defining your own search condition, D3 SOAR's preconfigured event field mapping for notable events cannot be accessed in this scenario. As such, certain data may not be returned. It is recommended to set the Event Type parameter to "Notable Event" to retrieve notable events with D3's hardcoded filters.
When neither the start time nor the end time is specified, the default behavior is to set the end time as the current time and the start time as 24 hours prior to the current end time.
If you define a start time without end time, the search will be conducted from your defined start time up to the current time. On the other hand, if you define an end time without a start time, the search will span over the time period starting 24 hours before your specified end time and ending at the defined end time.
Input
Input Parameter | Required/Optional | Description | Example |
Start Time | Optional | The start time for fetching events in UTC time. If this parameter is not defined, the default start time will be set 24 hours ahead of the end time. | 2023-04-24 00:00 |
End Time | Optional | The end time for fetching events in UTC time. If this parameter is not defined, the default end time will be the current time. | 2023-04-25 00:00 |
Query Time Type | Required | The time field to use for the fetch event. The available time fields are Event Creation Time and Index Time. | Index Time |
Event Type | Optional | The type of events (i.e., Generic Event or Notable Event) to fetch. When fetching notable events, all events related to notable events will also be ingested. If this parameter is not defined, the default value is Generic Event. | Notable Event |
Number of Event(s) Fetched | Optional | The number of results to return. If the limit is not specified or set to 0, all results will be returned. | 10 |
Search Condition | Optional | The query statement to filter generic event results. For more information about the query syntax, see Search from Splunk's documentation. When fetching notable events, this parameter will be omitted. To customize notable event ingestion, please select the generic event type for the Event Type parameter. Note: If a time modifier is used in the search condition, it will override the time range specified in the Start Time/End Time input parameters, following the SPL syntax. | source=crowdstrike* | head 10 |
Tolerance Scope | Optional | The tolerance scope (the default value is 0) in minutes of the query to get events between start and end time to avoid the loss of events. The event will be fetched between {Start Time - Tolerance Scope, End Time - Tolerance Scope}. | 0 |
Output
To view the sample output data for all commands, refer to this article.
Fetch Event Field Mapping
Please note that Fetch Event commands require event field mapping. Field mapping plays a key role in the data normalization process part of the event pipeline. Field mapping converts the original data fields from the different providers to the D3 fields which are standardized by the D3 Model. Please refer to Event and Incident Intake Field Mapping for details.
If you require a custom field mapping, click + Add Field to add a custom field mapping. You may also remove built-in field mappings by clicking x. Please note that two underscore characters will automatically prefix the defined Field Name as the System Name for a custom field mapping. Additionally, if an input Field Name contains any spaces, they will automatically be replaced with underscores for the corresponding System Name.
The Splunk v2 integration in D3 SOAR has some pre-configured field mappings for the Notable Event and WinEventLog, which correspond to the Event Mapping for notableEvent and Event Mapping for WinEventLog mappings. For all other Generic Events that are not notable events or WinEventLog, they will be mapped to the default mapping:
Default Event SourceConfigures the field mapping for generic events that do not meet the specified search strings ({index}=notable or {sourcetype}=WinEventLog:*). The default event source has a “Main Event JSON Path” (i.e., $.results) that is used to extract a batch of events from the response raw data. Click Edit Event Source to view the “Main Event JSON Path”. Click Edit Event Source to view the “Main Event JSON Path”.
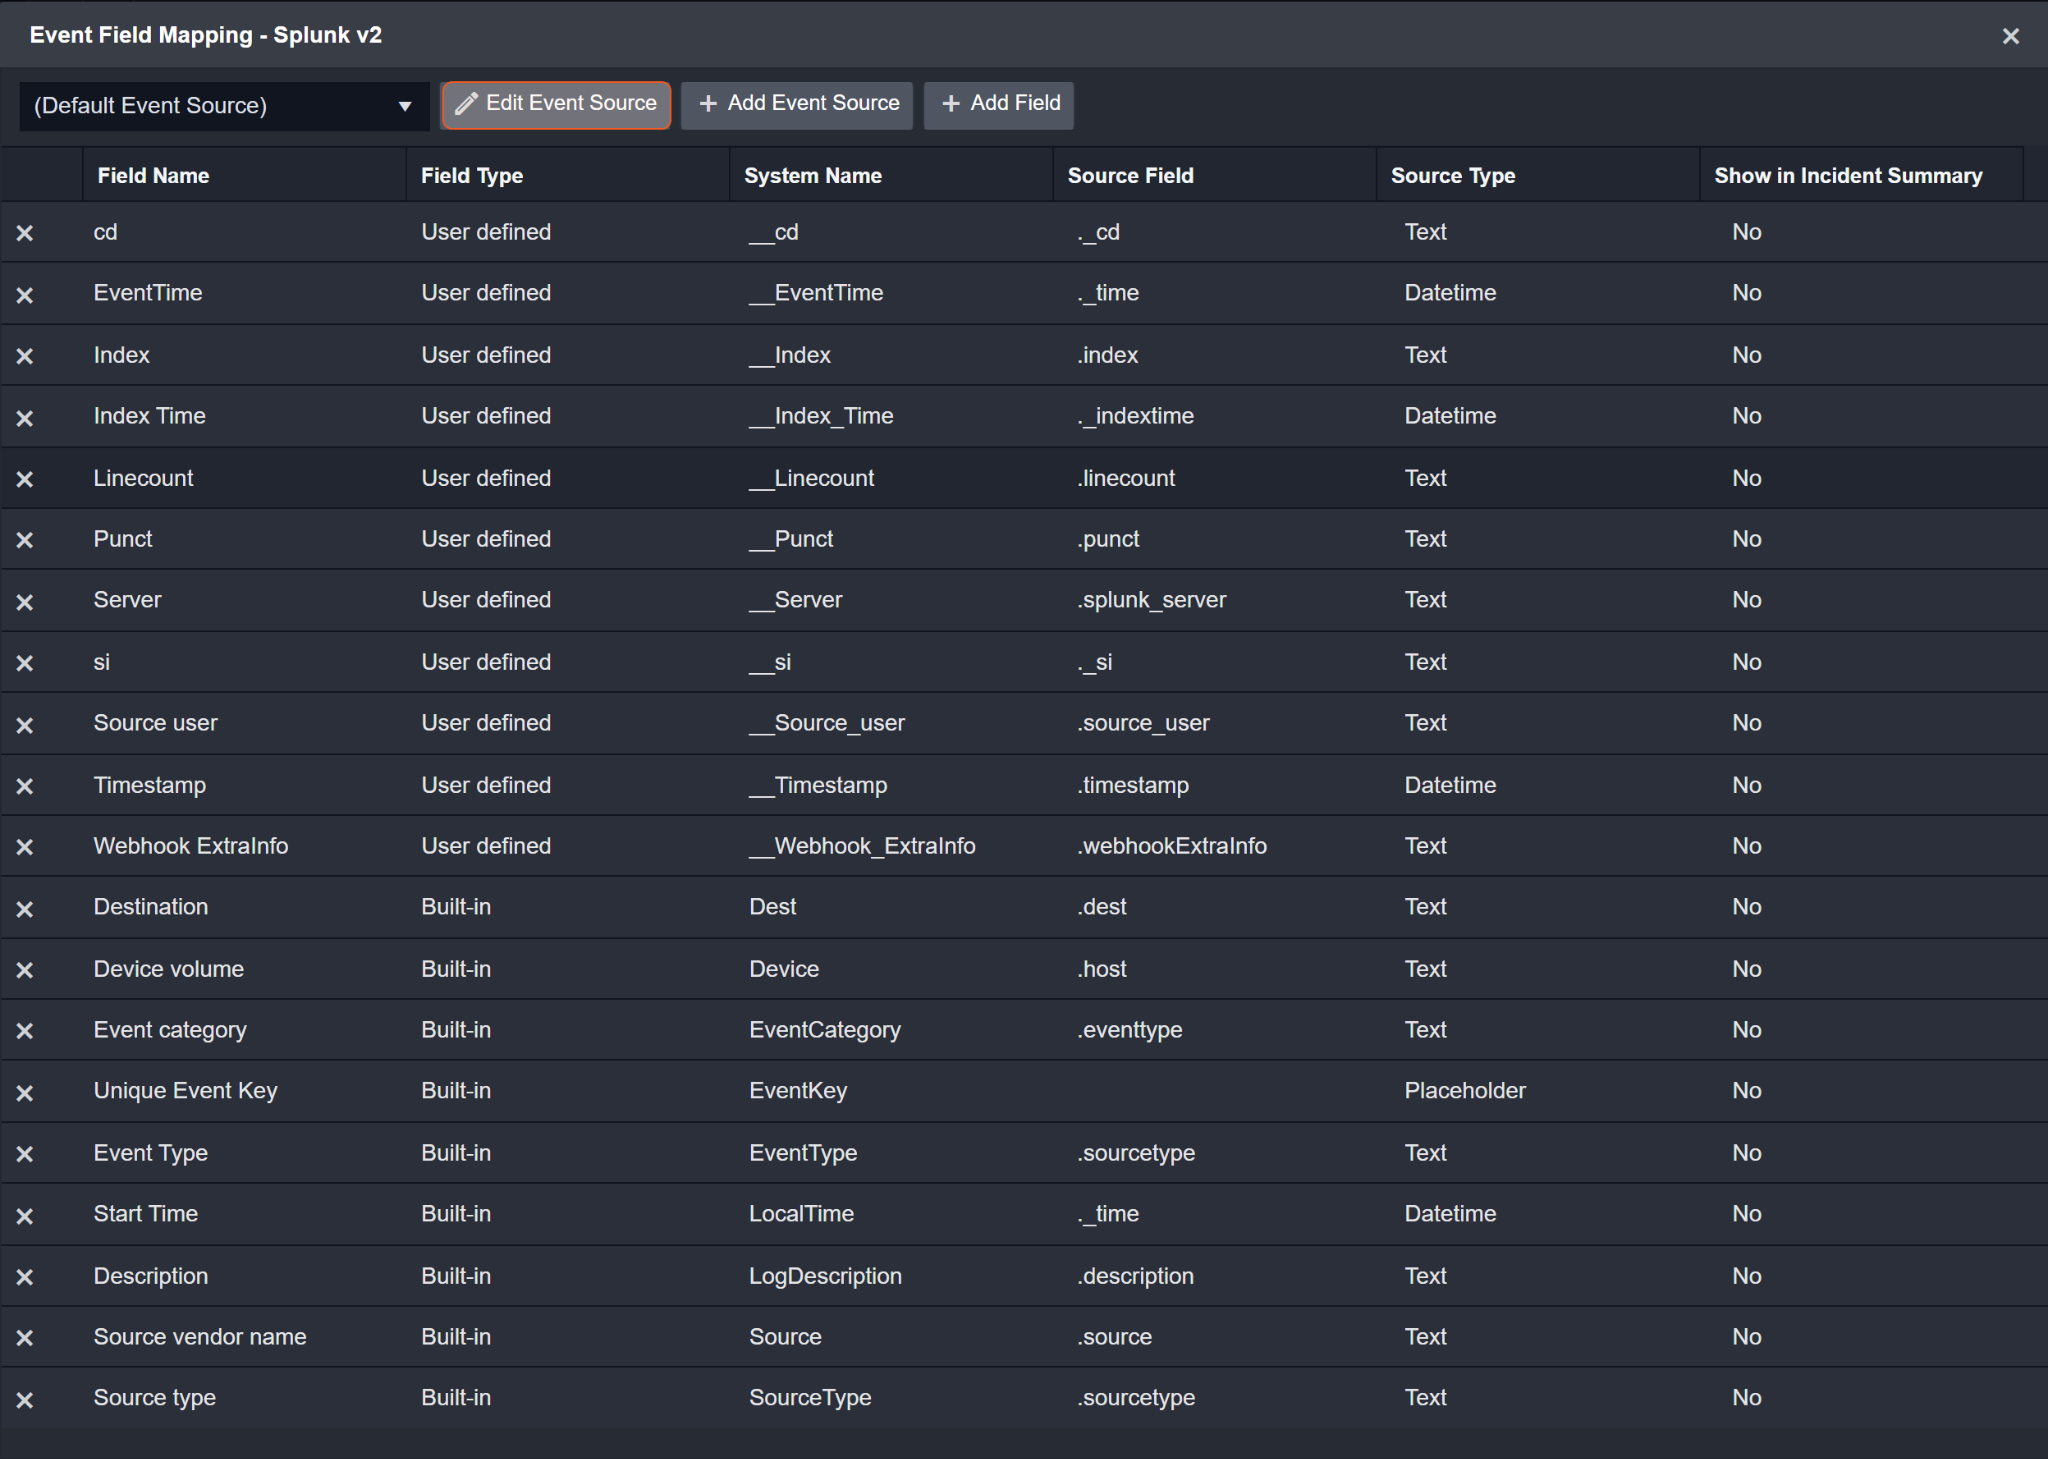
Main Event JSON Path: $.result
The Main Event JSON Path determines the root path where the system starts parsing raw response data into D3 event data. The JSON path begins with $, representing the root element. The path is formed by appending a sequence of child elements to $, each separated by a dot (.). Square brackets with nested quotation marks ([‘...’]) should be used to separate child elements in JSON arrays.
For example, the root node of a JSON Path is result. The child node denoting the Server field would be splunk_server. Putting it together, the JSON Path expression to extract the Server is $.result.splunk_server.
Event Source for Notable Event
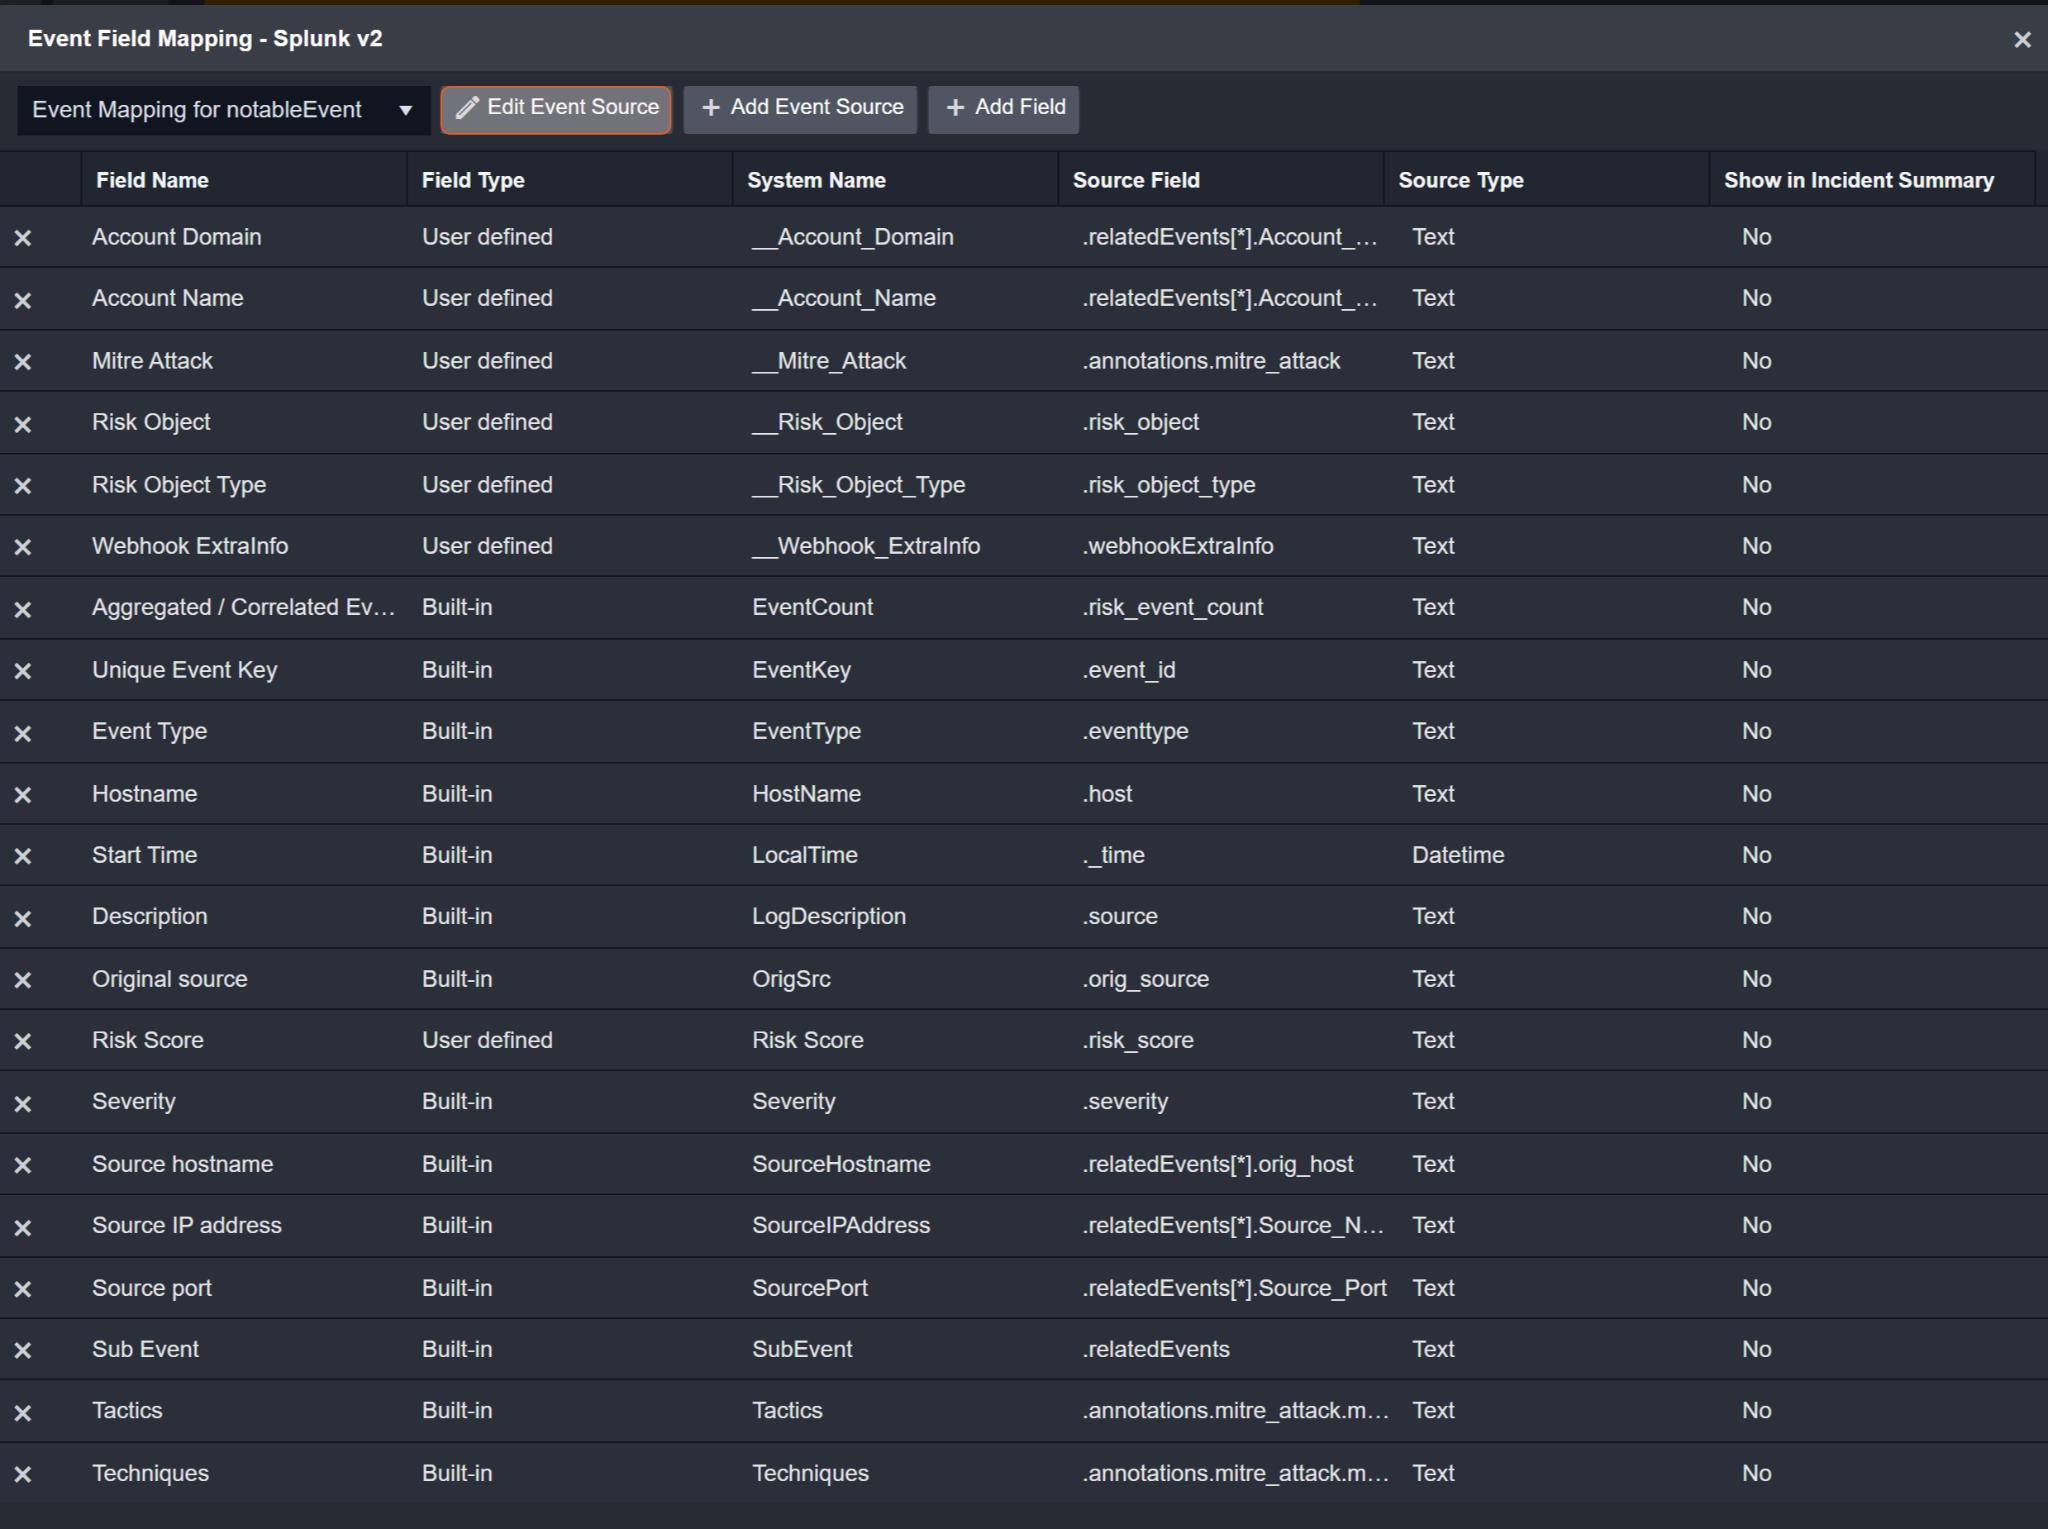
Configures the field mapping which are specific to the Notable Events. If a source field in the field mapping is not found, the corresponding field mapping will be ignored. As the data of the Notable Events events have a character that the value of the index field is notable, the Notable Events can be defined by the Search String: {index}=notable. Click Edit Event Source to view the Search String.
Event Source for WinEventLog
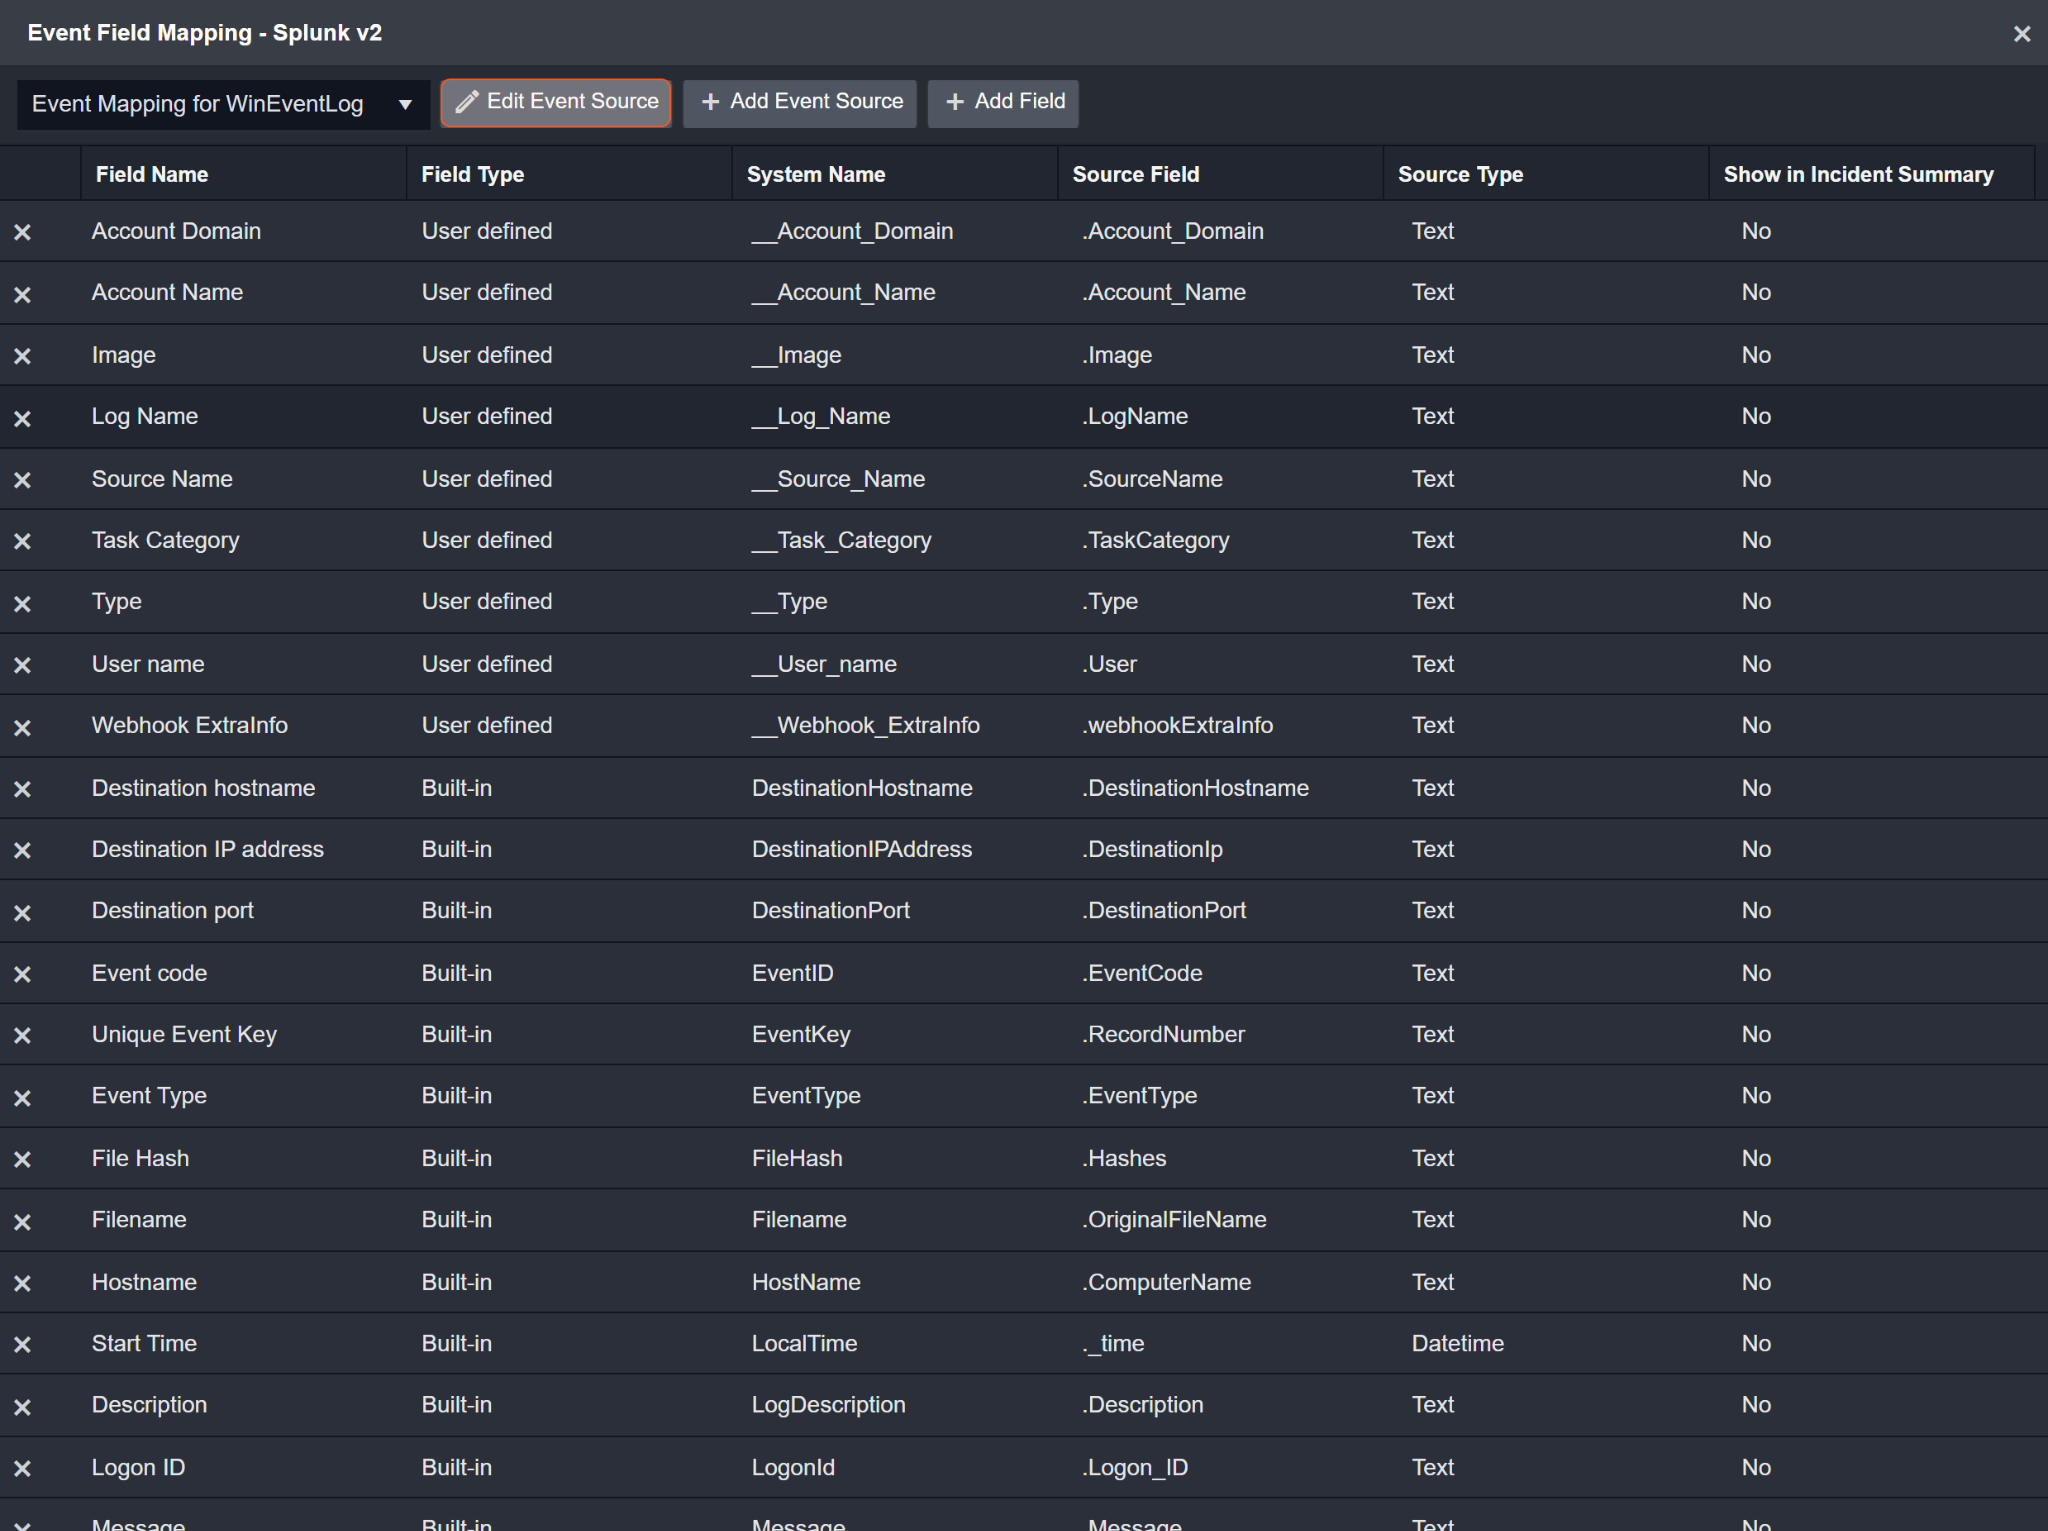
Configures the field mapping which are specific to the WinEventLog. If a source field in the field mapping is not found, the corresponding field mapping will be ignored. As the data of the WinEventLog have a character that the value of the sourcetype field is WinEventLog, the WinEventLog can be defined by the Search String: {sourcetype}=WinEventLog:*. Click Edit Event Source to view the Search String.
The pre-configured field mappings are detailed below:
Field Name | Source Field |
Default Event Source (Main Event JSON Path: $.result) | |
Server | .splunk_server |
si | ._si |
cd | ._cd |
Device volume | .host |
Index | .index |
Linecount | .linecount |
Punct | .punct |
Source vendor name | .source |
Source type | .sourcetype |
Source user | .source_user |
Webhook ExtraInfo | .webhookExtraInfo |
EventTime | ._time |
Timestamp | .timestamp |
Unique Event Key | *{__server}-{__cd}-{__index} |
Index Time | ._indextime |
Start Time | ._time |
Event Type | .sourcetype |
Event category | .eventtype |
Destination | .dest |
Description | .description |
Event Source for Notable Event(Search String: {index}=notable) The search string format is {jsonpath}=value. If the value of the index key is notable in the event object under raw data, then the Notable Events will use the field mapping below. | |
Unique Event Key | .event_id |
Hostname | .host |
Event Type | .eventtype |
Description | .source |
Original source | .orig_source |
Risk Object Type | .risk_object_type |
Risk Object | .risk_object |
Risk Score | .risk_score |
Aggregated / Correlated Event count | .risk_event_count |
Tactics | .annotations.mitre_attack.mitre_tactic_id |
Techniques | .annotations.mitre_attack.mitre_technique_id |
Mitre Attack | .annotations.mitre_attack |
Severity | .severity |
Sub Event | .relatedEvents |
Source IP address | .relatedEvents[*].Source_Network_Address |
Source port | .relatedEvents[*].Source_Port |
Source hostname | .relatedEvents[*].orig_host |
Account Domain | .relatedEvents[*].Account_Domain |
Account Name | .relatedEvents[*].Account_Name |
Webhook ExtraInfo | .webhookExtraInfo |
Start Time | ._time |
Event Source for WinEventLog (Search String: {sourcetype}=WinEventLog:*) The search string format is {jsonpath}=value. If the value of the sourcetype key is WinEventLog in the event object under raw data, then the WinEventLog will use the field mapping below. | |
Unique Event Key | .RecordNumber |
Start Time | ._time |
Hostname | .ComputerName |
Event Type | .EventType |
Description | .Description |
Account Domain | .Account_Domain |
Account Name | .Account_Name |
Event code | .EventCode |
Logon ID | .Logon_ID |
Action taken | .Read_Operation |
Task Category | .TaskCategory |
Type | .Type |
Source Name | .SourceName |
Destination IP address | .DestinationIp |
Destination port | .DestinationPort |
Source IP address | .SourceIp |
Source port | .SourcePort |
Destination hostname | .DestinationHostname |
User name | .User |
Message | .Message |
File Hash | .Hashes |
Image | .Image |
Process ID | .ProcessId |
Process GUID | .ProcessGuid |
Filename | .OriginalFileName |
Tag | .tag |
Log Name | .LogName |
Webhook ExtraInfo | .webhookExtraInfo |
READER NOTE
Unique Event Key: *{__server}-{__cd}-{__index}
In D3 SOAR, the events from Splunk v2 will follow a predefined structure where the Default Event Source's Unique Event Key will be represented as *{__server}-{__cd}-{__index}.
Please note that the source type assigned to this Unique Event Key is defined as Placeholder. The value *{__server}-{__cd}-{__index} is a default mapping provided by D3.
The composition of *{__server}-{__cd}-{__index} involves combining values from other fields. Specifically, {__server} refers to the Server and is derived from the source field .splunk_server; {__cd} refers to cd and is derived from the source field ._cd; {__index} refers to Index and is derived from the source field .index. When these values are combined, they yield the Unique Event Key value.
See Event and Incident Intake Field Mapping for more details on event field mapping field types.
Error Handling
If the Return Data is Failed, an Error tab will appear in the Test Result window.
The error tab contains the details responded from D3 SOAR or third-party API calls, including Failure Indicator, Status Code, and Message. This can help you locate the root cause of a command failure.
Parts in Error | Description | Example |
Failure Indicator | Indicates the command failure that happened at a specific input and/or API call. | Fetch Event failed. |
Status Code | The response code issued by the third-party API server or the D3 SOAR system that can be used to locate the corresponding error category. For example, if the returned status code is 401, the selected connection is unauthorized to run the command. The user or system support would need to check the permission setting in the Splunk v2 portal. Refer to the HTTP Status Code Registry for details. | Status Code: 400. |
Message | The raw data or captured key error message from the integration API server about the API request failure. | Message: The raw data has reached the maximum size (100 MB). |
Error Sample Data Fetch Event failed. Status Code: 400. Message: The raw data has reached the maximum size (100 MB). |
Get Application List
Lists installed applications and their related properties.
Input
Input Parameter | Required/Optional | Description | Example |
Search | Optional | The search text to filter the returned applications. For example, entering "alert_webhook" will match any field containing the string "alert_webhook" in the name, while "name=alert_webhook" limits the match to the "name" field only. If this parameter is not specified, all applications will be returned. | alert_webhook |
Output
To view the sample output data for all commands, refer to this article.
Error Handling
If the Return Data is Failed, an Error tab will appear in the Test Result window.
The error tab contains the details responded from D3 SOAR or third-party API calls, including Failure Indicator, Status Code, and Message. This can help you locate the root cause of a command failure.
Parts in Error | Description | Example |
Failure Indicator | Indicates the command failure that happened at a specific input and/or API call. | Get Application List failed. |
Status Code | The response code issued by the third-party API server or the D3 SOAR system that can be used to locate the corresponding error category. For example, if the returned status code is 401, the selected connection is unauthorized to run the command. The user or system support would need to check the permission setting in the Splunk v2 portal. Refer to the HTTP Status Code Registry for details. | Status Code: 400. |
Message | The raw data or captured key error message from the integration API server about the API request failure. | Message: A connection attempt failed because the connected party did not properly respond after a period of time, or established connection failed because connected host has failed to respond. |
Error Sample Data Get Application List failed. Status Code: 400. Message: A connection attempt failed because the connected party did not properly respond after a period of time, or established connection failed because connected host has failed to respond. |
Get Lookup Table Content
Retrieves the content of the specified lookup table file. Note: Installing the Splunk App for Lookup File Editing is required to use this command (available at https://splunkbase.splunk.com/app/1724).
READER NOTE
Lookup File Name is a required parameter to run this command.
Run the List Lookup Table Files command to obtain Lookup File Name. Lookup File Name can be found from the returned raw data at the path $.entry[*].name.
Input
Input Parameter | Required/Optional | Description | Example |
Lookup File Name | Required | The name of the lookup file name to retrieve contents. Lookup file names can be obtained using the List Lookup Table Files command. | lookupFile***.csv |
Output
To view the sample output data for all commands, refer to this article.
Error Handling
If the Return Data is Failed, an Error tab will appear in the Test Result window.
The error tab contains the details responded from D3 SOAR or third-party API calls, including Failure Indicator, Status Code, and Message. This can help you locate the root cause of a command failure.
Parts in Error | Description | Example |
Failure Indicator | Indicates the command failure that happened at a specific input and/or API call. | Get Lookup Table Content failed. |
Status Code | The response code issued by the third-party API server or the D3 SOAR system that can be used to locate the corresponding error category. For example, if the returned status code is 401, the selected connection is unauthorized to run the command. The user or system support would need to check the permission setting in the Splunk v2 portal. Refer to the HTTP Status Code Registry for details. | Status Code: 500. |
Message | The raw data or captured key error message from the integration API server about the API request failure. | Message: Lookup file could not be loaded. |
Error Sample Data Get Lookup Table Content failed. Status Code: 500. Message: Lookup file could not be loaded. |
Get Recent Notable Events
Retrieves recent notable events. If a more specific search is required, such as querying by host, IP, source, etc., use the Search command instead.
Input
Input Parameter | Required/Optional | Description | Example |
Days Before | Required | The number of days before the current date to filter the returned notable events. | 1 |
Limit | Optional | The maximum number of notable events to return. | 20 |
Output
To view the sample output data for all commands, refer to this article.
Error Handling
If the Return Data is Failed, an Error tab will appear in the Test Result window.
The error tab contains the details responded from D3 SOAR or third-party API calls, including Failure Indicator, Status Code, and Message. This can help you locate the root cause of a command failure.
Parts in Error | Description | Example |
Failure Indicator | Indicates the command failure that happened at a specific input and/or API call. | Get Recent Notable Events failed. |
Status Code | The response code issued by the third-party API server or the D3 SOAR system that can be used to locate the corresponding error category. For example, if the returned status code is 401, the selected connection is unauthorized to run the command. The user or system support would need to check the permission setting in the Splunk v2 portal. Refer to the HTTP Status Code Registry for details. | Status Code: 400. |
Message | The raw data or captured key error message from the integration API server about the API request failure. | Message: The value for parameter (Days Before) is invalid. |
Error Sample Data Get Recent Notable Events failed. Status Code: 400. Message: The value for parameter (Days Before) is invalid. |
Get Search Result
Retrieves search results of the given Search ID.
READER NOTE
Search ID is a required parameter to run this command.
Run the Start Search command to obtain the Search ID. Search ID can be found in the returned raw data at the path $.sid.
It is required to run the Get Search Status command before running this command to verify the search status using the same Search ID. If the "SearchState" returned by the Get Search Status command (found in the raw data at path $.entry[0].content.dispatchState) is "RUNNING," the error "[{"D3Message": "Get Search Result fail to load Json", "ErrorMessage": "","StatusCode": 204}]" will be returned by running this command.
In such cases, you should wait and re-run the Get Search Status command until the value of the "SearchState" field changes to "DONE." Otherwise, the error will continue to occur.When running this command, please note that the maximum size of the raw data is 100 MB. This limit applies to all returned results from D3 SOAR. As such, it is recommended to use the Results Count and Offset parameters to obtain the remaining results.
If you encounter the error message "The raw data has reached the maximum size (100 MB).", you can start by setting the Results Count parameter to a specific value, such as 50, to retrieve the first 50 events. Then, by setting the Results Count to 50 and the Offset to 50, you can retrieve events 51-100. Repeat these steps until you have obtained the complete list of events. Adjust the number according to your environment as needed.Please refer to the Use Case section for guidance on using this command.
Input
Input Parameter | Required/Optional | Description | Example |
Search ID | Required | The ID of the search to retrieve search results. Search ID can be obtained using the Start Search command. | 16***.1000 |
Results Count | Optional | The number of results to return. If the limit is not specified or set to 0, all results will be returned. | 10 |
Offset | Optional | The starting position of the data to be returned. This parameter allows the use of negative numbers, which will retrieve data in descending order from the end. If the parameter is not specified or set to 0, the data retrieval will start from the first entry. | 0 |
Output
To view the sample output data for all commands, refer to this article.
Error Handling
If the Return Data is Failed, an Error tab will appear in the Test Result window.
The error tab contains the details responded from D3 SOAR or third-party API calls, including Failure Indicator, Status Code, and Message. This can help you locate the root cause of a command failure.
Parts in Error | Description | Example |
Failure Indicator | Indicates the command failure that happened at a specific input and/or API call. | Get Search Result failed. |
Status Code | The response code issued by the third-party API server or the D3 SOAR system that can be used to locate the corresponding error category. For example, if the returned status code is 401, the selected connection is unauthorized to run the command. The user or system support would need to check the permission setting in the Splunk v2 portal. Refer to the HTTP Status Code Registry for details. | Status Code: 404. |
Message | The raw data or captured key error message from the integration API server about the API request failure. | Message: Unknown sid. |
Error Sample Data Get Search Result failed. Status Code: 404. Message: Unknown sid. |
Get Search Status
Retrieves search job status by Search ID.
READER NOTE
Search ID is a required parameter to run this command.
Run the Start Search command to obtain the Search ID. Search ID can be found in the returned raw data at the path $.sid.
It is recommended to run this command to verify the search status using the same Search ID before running the Get Search Result command. If the "SearchState" returned by the command (found in the raw data at path $.entry[0].content.dispatchState) is "RUNNING," the error "[{"D3Message": "Get Search Result fail to load Json", "ErrorMessage": "","StatusCode": 204}]" will be returned when running the Get Search Result command.
In such cases, you should wait and re-run this command until the value of the "SearchState" field changes to "DONE." Otherwise, the error will continue to occur.Please refer to the Use Case section for guidance using this command.
Input
Input Parameter | Required/Optional | Description | Example |
Search ID | Required | The ID of the search job to check status. Search ID can be obtained using the Start Search command. | 16*****6.6*****9 |
Output
To view the sample output data for all commands, refer to this article.
Error Handling
If the Return Data is Failed, an Error tab will appear in the Test Result window.
The error tab contains the details responded from D3 SOAR or third-party API calls, including Failure Indicator, Status Code, and Message. This can help you locate the root cause of a command failure.
Parts in Error | Description | Example |
Failure Indicator | Indicates the command failure that happened at a specific input and/or API call. | Get Search Status failed. |
Status Code | The response code issued by the third-party API server or the D3 SOAR system that can be used to locate the corresponding error category. For example, if the returned status code is 401, the selected connection is unauthorized to run the command. The user or system support would need to check the permission setting in the Splunk v2 portal. Refer to the HTTP Status Code Registry for details. | Status Code: 404. |
Message | The raw data or captured key error message from the integration API server about the API request failure. | Message: Unknown sid. |
Error Sample Data Get Search Status failed. Status Code: 404. Message: Unknown sid. |
Get Status List
Retrieves a list of system status.
Input
N/A
Output
To view the sample output data for all commands, refer to this article.
Error Handling
If the Return Data is Failed, an Error tab will appear in the Test Result window.
The error tab contains the details responded from D3 SOAR or third-party API calls, including Failure Indicator, Status Code, and Message. This can help you locate the root cause of a command failure.
Parts in Error | Description | Example |
Failure Indicator | Indicates the command failure that happened at a specific input and/or API call. | Get Status List failed. |
Status Code | The response code issued by the third-party API server or the D3 SOAR system that can be used to locate the corresponding error category. For example, if the returned status code is 401, the selected connection is unauthorized to run the command. The user or system support would need to check the permission setting in the Splunk v2 portal. Refer to the HTTP Status Code Registry for details. | Status Code: 400. |
Message | The raw data or captured key error message from the integration API server about the API request failure. | Message: A connection attempt failed because the connected party did not properly respond after a period of time, or established connection failed because connected host has failed to respond. |
Error Sample Data Get Status List failed. Status Code: 400. Message: A connection attempt failed because the connected party did not properly respond after a period of time, or established connection failed because connected host has failed to respond. |
List Indexes
Lists the recognized indexes on the server.
READER NOTE
If the input search condition cannot be found, the command will run successfully with no returned results.
Input
Input Parameter | Required/Optional | Description | Example |
Search | Optional | The search text to filter the returned indexes. For example, entering "main" will match any field containing the string "main" in the name, while "name=main" limits the match to the "name" field only. If this parameter is not specified, all indexes will be returned. | name=main |
Output
To view the sample output data for all commands, refer to this article.
Error Handling
If the Return Data is Failed, an Error tab will appear in the Test Result window.
The error tab contains the details responded from D3 SOAR or third-party API calls, including Failure Indicator, Status Code, and Message. This can help you locate the root cause of a command failure.
Parts in Error | Description | Example |
Failure Indicator | Indicates the command failure that happened at a specific input and/or API call. | List Indexes failed. |
Status Code | The response code issued by the third-party API server or the D3 SOAR system that can be used to locate the corresponding error category. For example, if the returned status code is 401, the selected connection is unauthorized to run the command. The user or system support would need to check the permission setting in the Splunk v2 portal. Refer to the HTTP Status Code Registry for details. | Status Code: 400. |
Message | The raw data or captured key error message from the integration API server about the API request failure. | Message: A connection attempt failed because the connected party did not properly respond after a period of time, or established connection failed because connected host has failed to respond. |
Error Sample Data List Indexes failed. Status Code: 400. Message: A connection attempt failed because the connected party did not properly respond after a period of time, or established connection failed because connected host has failed to respond. |
List Lookup Table Files
Lists lookup table files.
READER NOTE
If the input search condition cannot be found, the command will run successfully with no returned results.
Input
Input Parameter | Required/Optional | Description | Example |
Search | Optional | The search text to filter the returned lookup table files. You can input either the complete or partial name of the lookup table file. If this parameter is not defined, all lookup table files will be returned. | use_cases.csv |
Output
To view the sample output data for all commands, refer to this article.
Error Handling
If the Return Data is Failed, an Error tab will appear in the Test Result window.
The error tab contains the details responded from D3 SOAR or third-party API calls, including Failure Indicator, Status Code, and Message. This can help you locate the root cause of a command failure.
Parts in Error | Description | Example |
Failure Indicator | Indicates the command failure that happened at a specific input and/or API call. | List Lookup Table Files failed. |
Status Code | The response code issued by the third-party API server or the D3 SOAR system that can be used to locate the corresponding error category. For example, if the returned status code is 401, the selected connection is unauthorized to run the command. The user or system support would need to check the permission setting in the Splunk v2 portal. Refer to the HTTP Status Code Registry for details. | Status Code: 400. |
Message | The raw data or captured key error message from the integration API server about the API request failure. | Message: A connection attempt failed because the connected party did not properly respond after a period of time, or established connection failed because connected host has failed to respond. |
Error Sample Data List Lookup Table Files failed. Status Code: 400. Message: A connection attempt failed because the connected party did not properly respond after a period of time, or established connection failed because connected host has failed to respond. |
List Threat Intel Collection Rows
Lists all rows in a threat intel collection.
Input
Input Parameter | Required/Optional | Description | Example |
Collection Name | Required | The name of the collection to add a row. Select a collection name from the dropdown list. | IP Intel |
Output
To view the sample output data for all commands, refer to this article.
Error Handling
If the Return Data is Failed, an Error tab will appear in the Test Result window.
The error tab contains the details responded from D3 SOAR or third-party API calls, including Failure Indicator, Status Code, and Message. This can help you locate the root cause of a command failure.
Parts in Error | Description | Example |
Failure Indicator | Indicates the command failure that happened at a specific input and/or API call. | List Threat Intel Collection Rows failed. |
Status Code | The response code issued by the third-party API server or the D3 SOAR system that can be used to locate the corresponding error category. For example, if the returned status code is 401, the selected connection is unauthorized to run the command. The user or system support would need to check the permission setting in the Splunk v2 portal. Refer to the HTTP Status Code Registry for details. | Status Code: 400. |
Message | The raw data or captured key error message from the integration API server about the API request failure. | Message: A connection attempt failed because the connected party did not properly respond after a period of time, or established connection failed because connected host has failed to respond. |
Error Sample Data List Threat Intel Collection Rows failed. Status Code: 400. Message: A connection attempt failed because the connected party did not properly respond after a period of time, or established connection failed because connected host has failed to respond. |
Search
Executes a search operation in Splunk. Refer to Search Command Examples from Splunk's documentation for search examples.
READER NOTE
This command is used to search for content within the Splunk platform such as querying by host, IP, source, etc. The Fetch Event command is exclusively used to search for events or notable events.
When neither the start time nor the end time is specified, the default behavior is to set the end time as the current time and the start time as 24 hours prior to the current end time.
If you define a start time without end time, the search will be conducted from your defined start time up to the current time. On the other hand, if you define an end time without start time, the search will span over the time period starting 24 hours before your specified end time and ending at the defined end time.
Input
Input Parameter | Required/Optional | Description | Example |
Start Time | Optional | The start time for the search operation in UTC time. If this parameter is not defined, the default start time will be set 24 hours ahead of the end time. | 2023-04-25 00:00 |
End Time | Optional | The end time for the search operation in UTC time. If this parameter is not defined, the default end time will be the current time. | 2023-04-26 00:00 |
Query Time Type | Optional | The time field to use for the search. The available time fields are Event Creation Time and Index Time. If this parameter is not defined, the default query time type is Event Creation Time. | Index Time |
Results Count | Optional | The number of results to return. If the limit is not specified or set to 0, all results will be returned. | 10 |
Search | Required | The query statement to filter results. For more information about the query syntax, see Search from Splunk's documentation. Note: If a time modifier is used in the Search, it will override the time range specified in the Start Time/End Time input parameters, following the SPL syntax. | search index="main" | where host="desktop-*****" |
Output
To view the sample output data for all commands, refer to this article.
Error Handling
If the Return Data is Failed, an Error tab will appear in the Test Result window.
The error tab contains the details responded from D3 SOAR or third-party API calls, including Failure Indicator, Status Code, and Message. This can help you locate the root cause of a command failure.
Parts in Error | Description | Example |
Failure Indicator | Indicates the command failure that happened at a specific input and/or API call. | Search failed. |
Status Code | The response code issued by the third-party API server or the D3 SOAR system that can be used to locate the corresponding error category. For example, if the returned status code is 401, the selected connection is unauthorized to run the command. The user or system support would need to check the permission setting in the Splunk v2 portal. Refer to the HTTP Status Code Registry for details. | Status Code: 401. |
Message | The raw data or captured key error message from the integration API server about the API request failure. | Message: Invalid Search. |
Error Sample Data Search failed. Status Code: 401. Message: Invalid Search. |
Start Search
Initiates a search operation in Splunk. Refer to Search Command Examples from Splunk's documentation for search examples.
READER NOTE
The command is used to start a search operation that will provide a search ID instead of retrieving the entire dataset. This approach helps to prevent command timeout. For more detailed information, please refer to the Use Case section.
When neither the start time nor the end time is specified, the default behavior is to set the end time as the current time and the start time as 24 hours prior to the current end time.
If you define a start time without end time, the search will be conducted from your defined start time up to the current time. On the other hand, if you define an end time without start time, the search will span over the time period starting 24 hours before your specified end time and ending at the defined end time.
Input
Input Parameter | Required/Optional | Description | Example |
Start Time | Optional | The start time for the search operation in UTC time. If this parameter is not defined, the default start time will be set 24 hours ahead of the end time. | 2023-04-25 00:00 |
End Time | Optional | The end time for the search operation in UTC time. If this parameter is not defined, the default end time will be the current time. | 2023-04-26 00:00 |
Query Time Type | Optional | The time field to use for the search. The available time fields are Event Creation Time and Index Time. If this parameter is not defined, the default query time type is Event Creation Time. | Index Time |
Search | Required | The query statement to filter results. For more information about the query syntax, see Search from Splunk's documentation. Note: If a time modifier is used in the Search, it will override the time range specified in the Start Time/End Time input parameters, following the SPL syntax. | search index="main" | where host="desktop-*****" |
Max Count | Optional | The maximum number of events accessible within each status bucket. This value also determines the maximum number of results to store when in transforming mode. If this parameter is not defined, the default value is 10000. | 10 |
Output
To view the sample output data for all commands, refer to this article.
Error Handling
If the Return Data is Failed, an Error tab will appear in the Test Result window.
The error tab contains the details responded from D3 SOAR or third-party API calls, including Failure Indicator, Status Code, and Message. This can help you locate the root cause of a command failure.
Parts in Error | Description | Example |
Failure Indicator | Indicates the command failure that happened at a specific input and/or API call. | Start Search failed. |
Status Code | The response code issued by the third-party API server or the D3 SOAR system that can be used to locate the corresponding error category. For example, if the returned status code is 401, the selected connection is unauthorized to run the command. The user or system support would need to check the permission setting in the Splunk v2 portal. Refer to the HTTP Status Code Registry for details. | Status Code: 401. |
Message | The raw data or captured key error message from the integration API server about the API request failure. | Message: Invalid Search. |
Error Sample Data Start Search failed. Status Code: 401. Message: Invalid Search. |
Submit Event
Sends an event to the HTTP Event Collector. Note: An HTTP Event Collector token must be created to send events to the HTTP Event Collector.
Creating an Event Collector Token
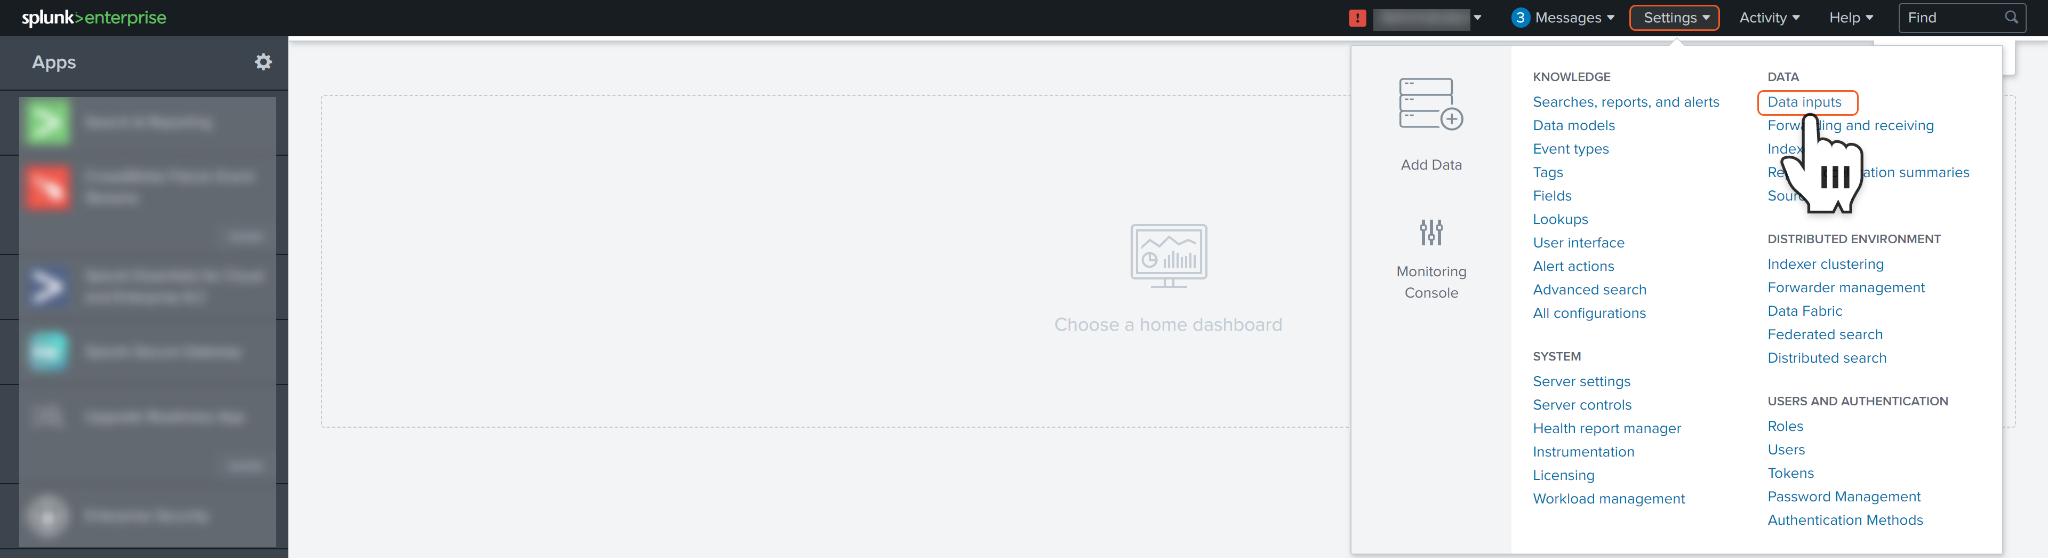
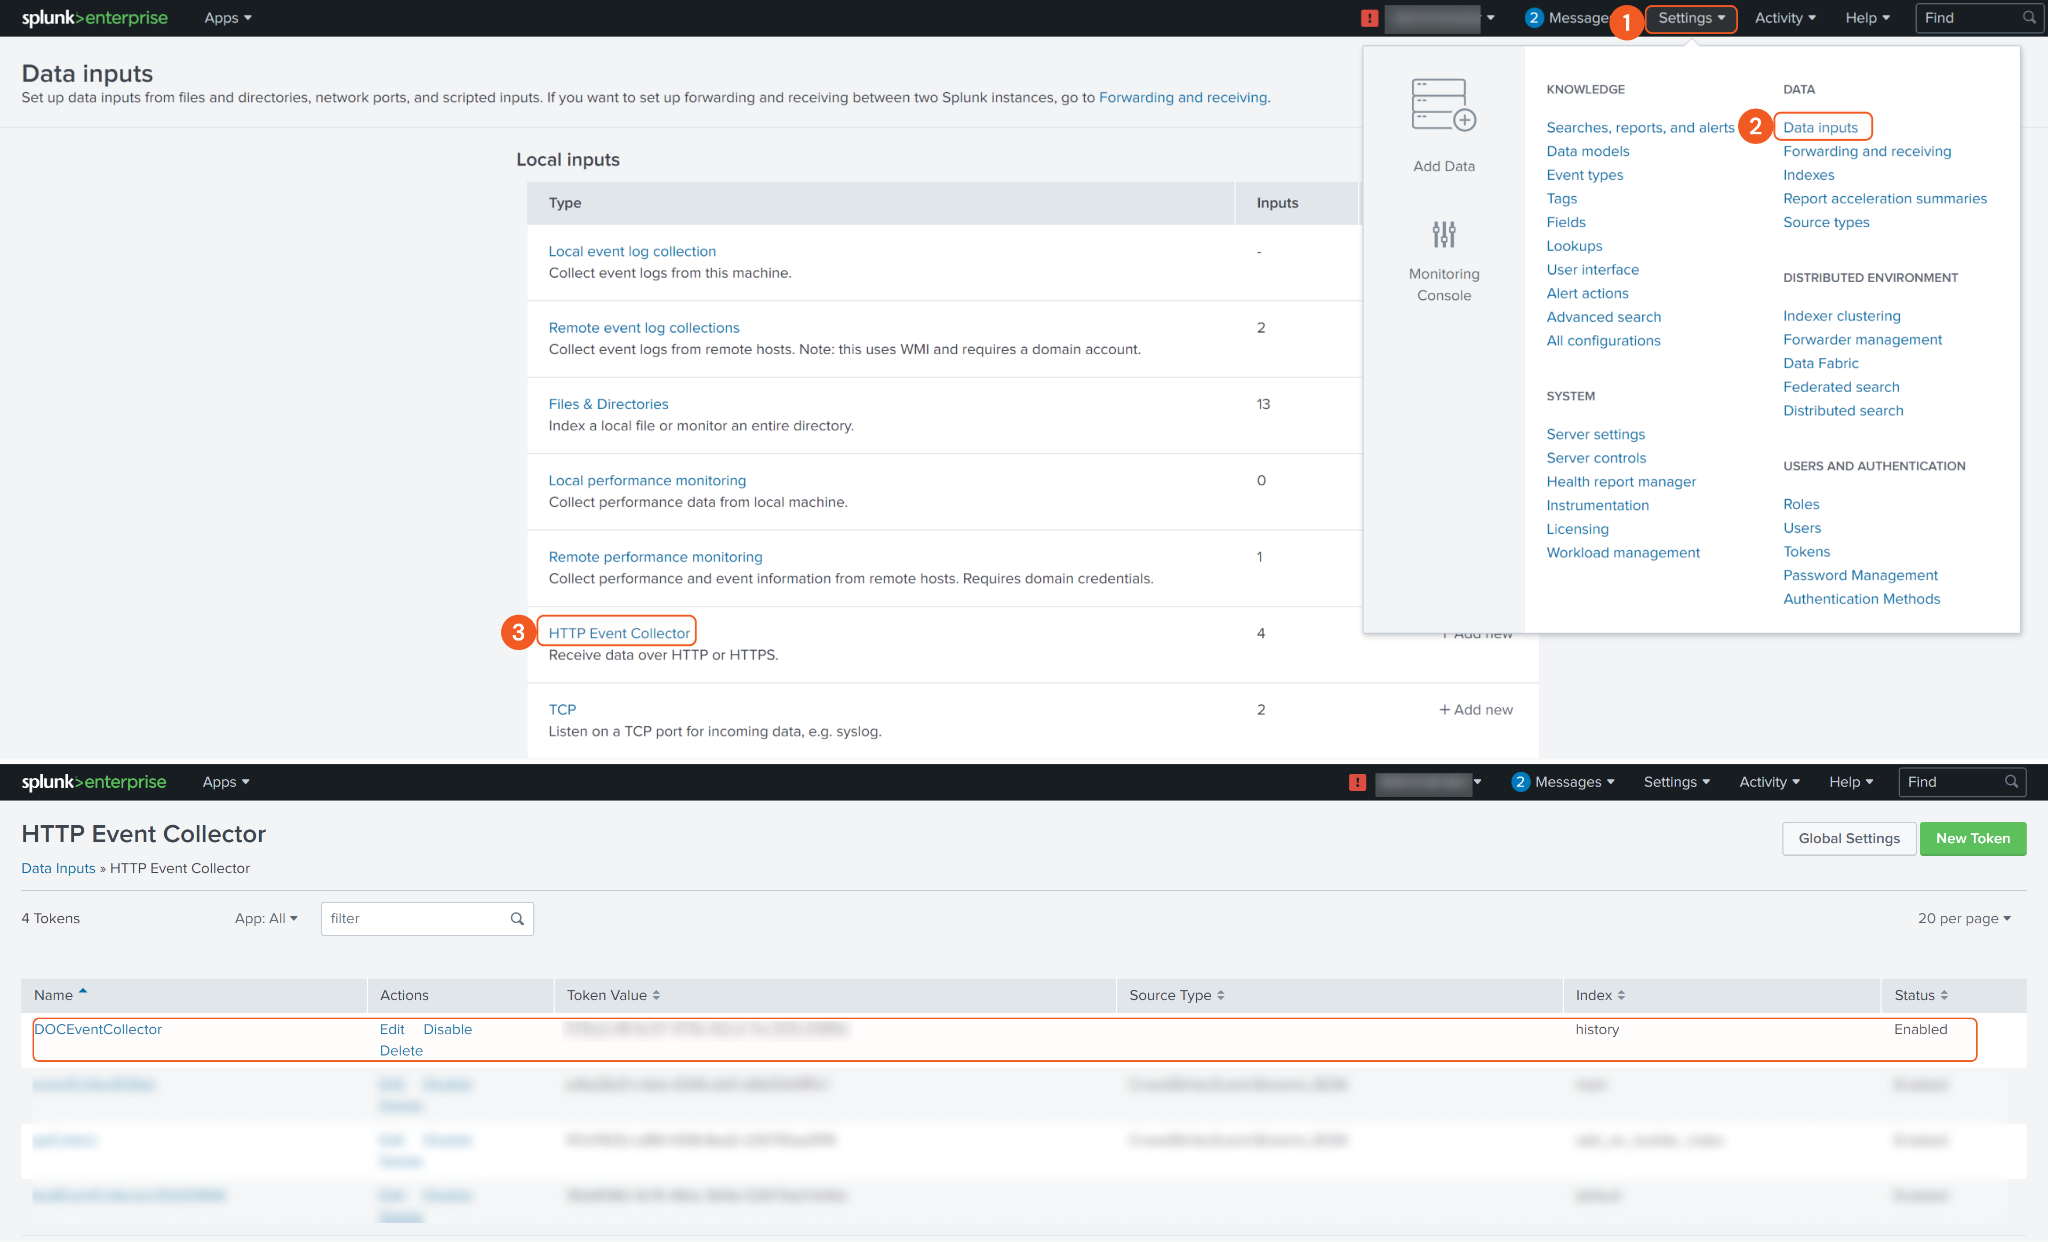
Log in to your Splunk instance with your credentials. Navigate to the top bar and click on Settings. Under the DATA section, locate and select Data inputs.
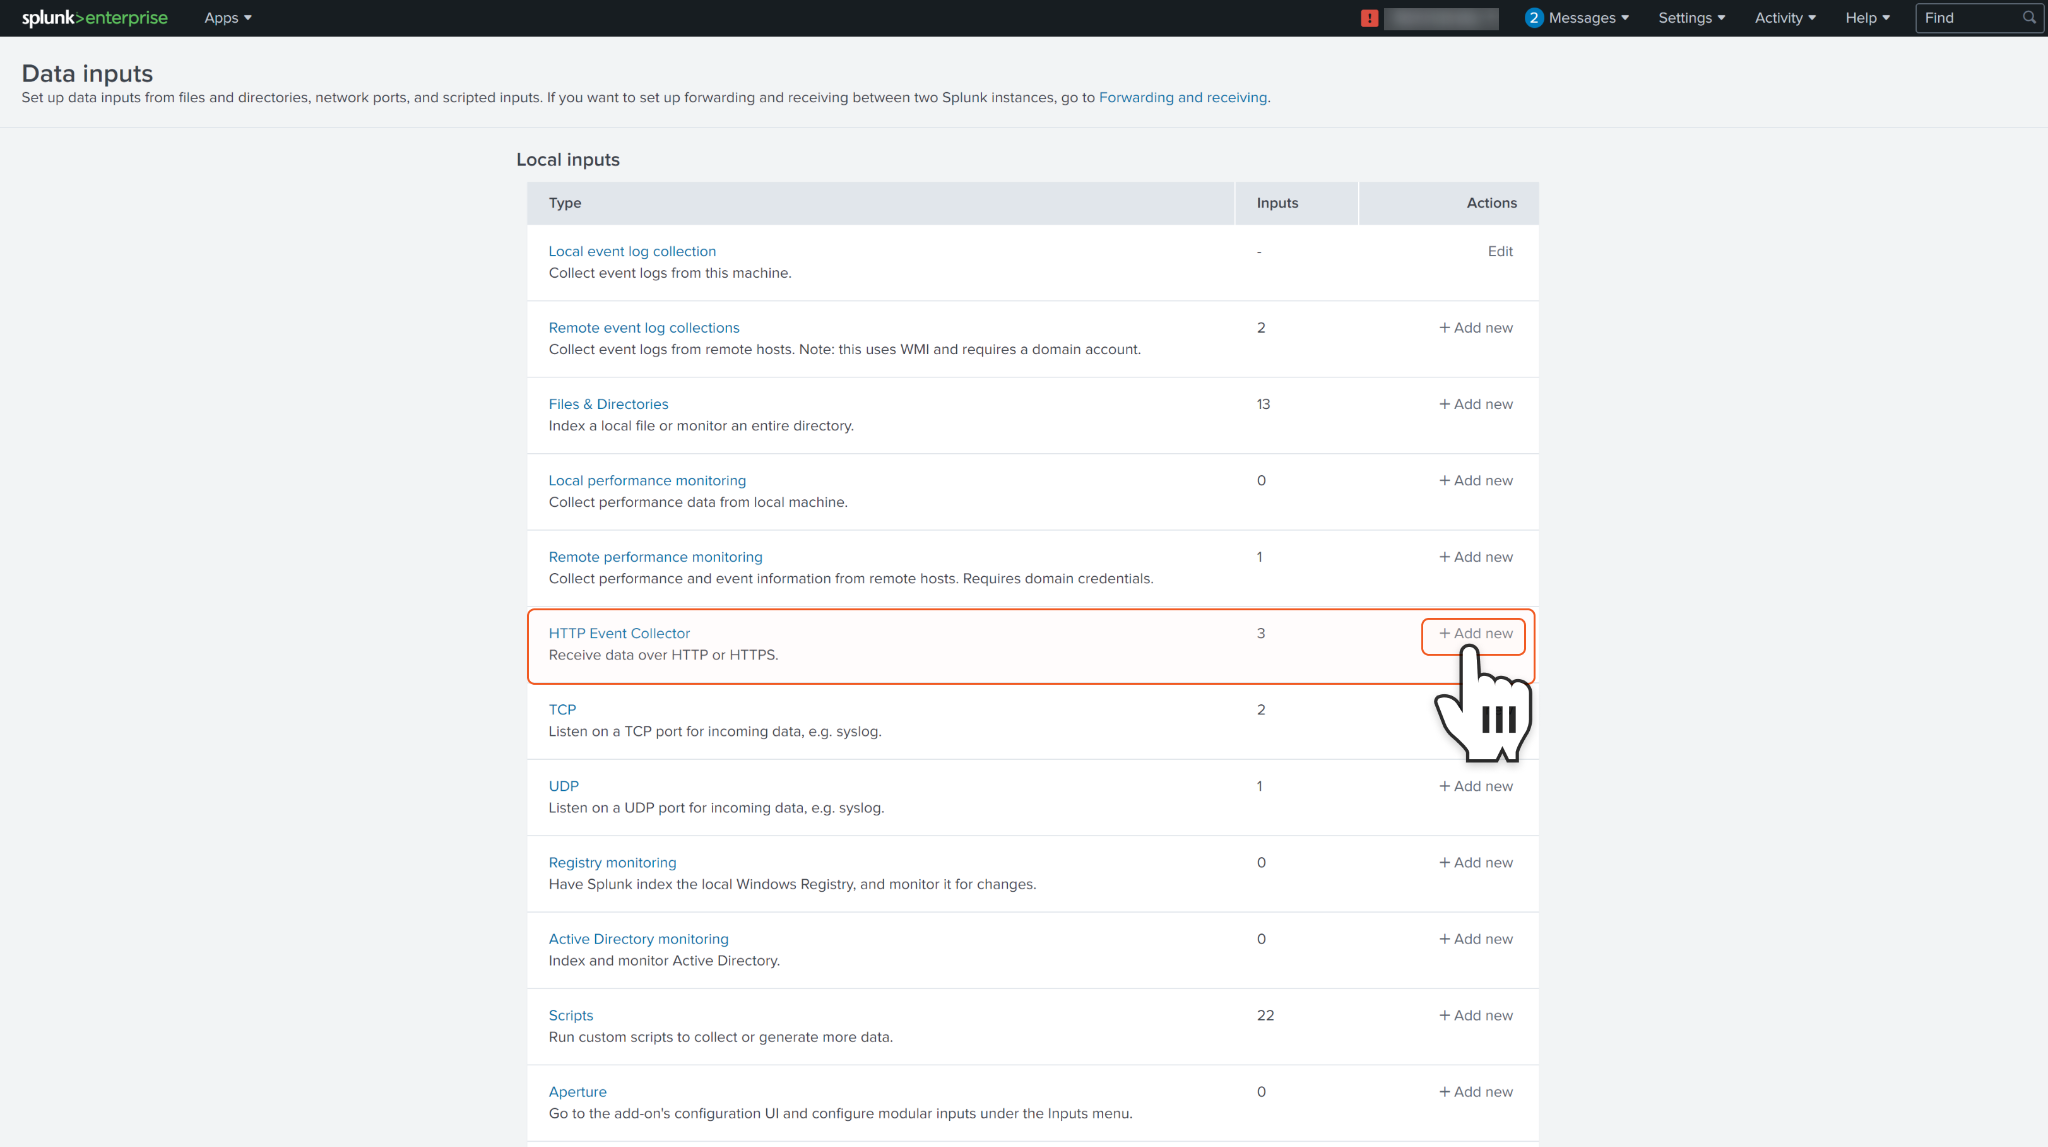
Under the Local inputs section, locate HTTP Event Collector and click + Add new.
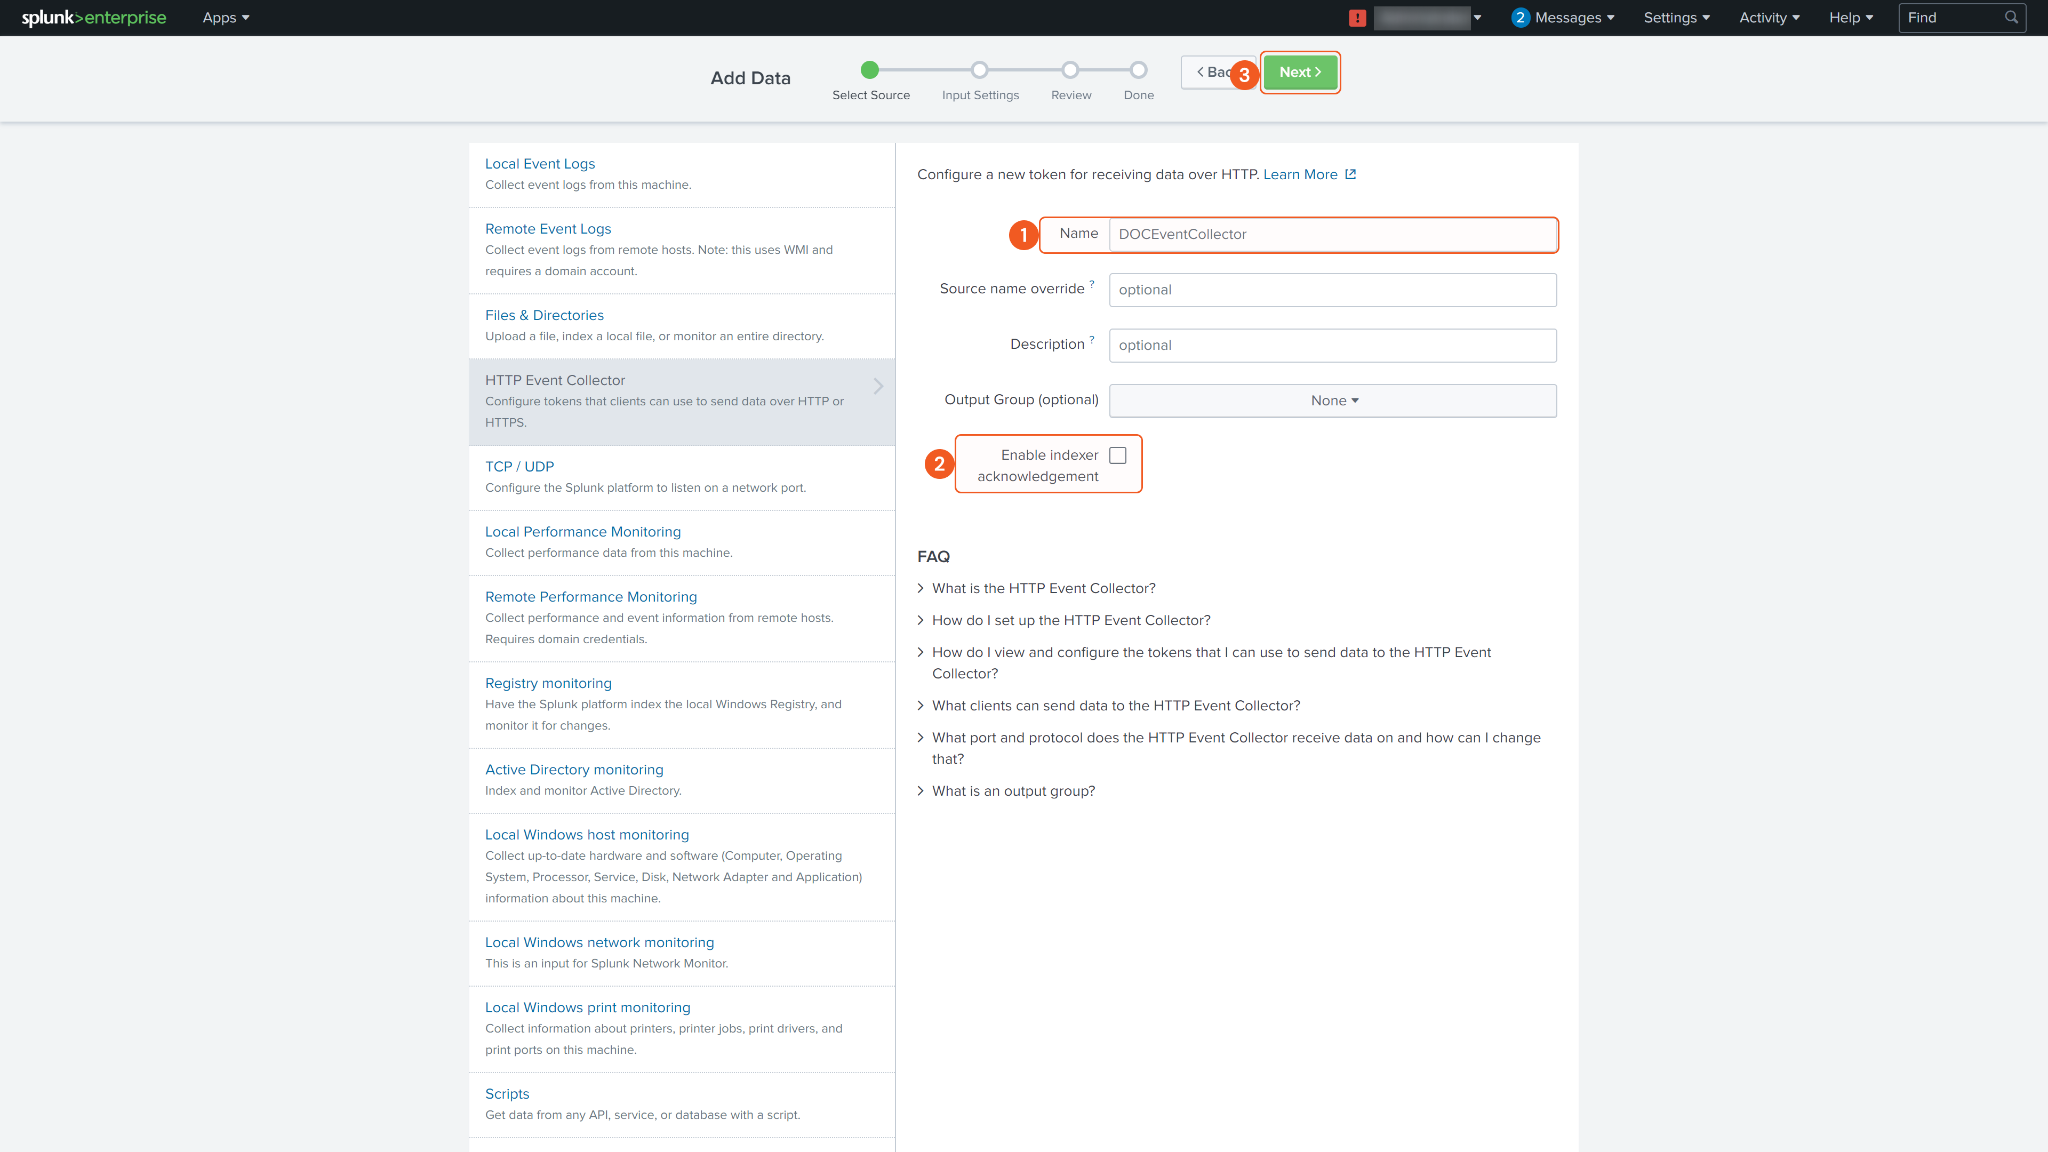
Enter a name for your Event Collector (which will be used as an input parameter) and provide any other optional parameters as needed. Make sure to uncheck the Enable indexer acknowledgement option. Once done, click Next.
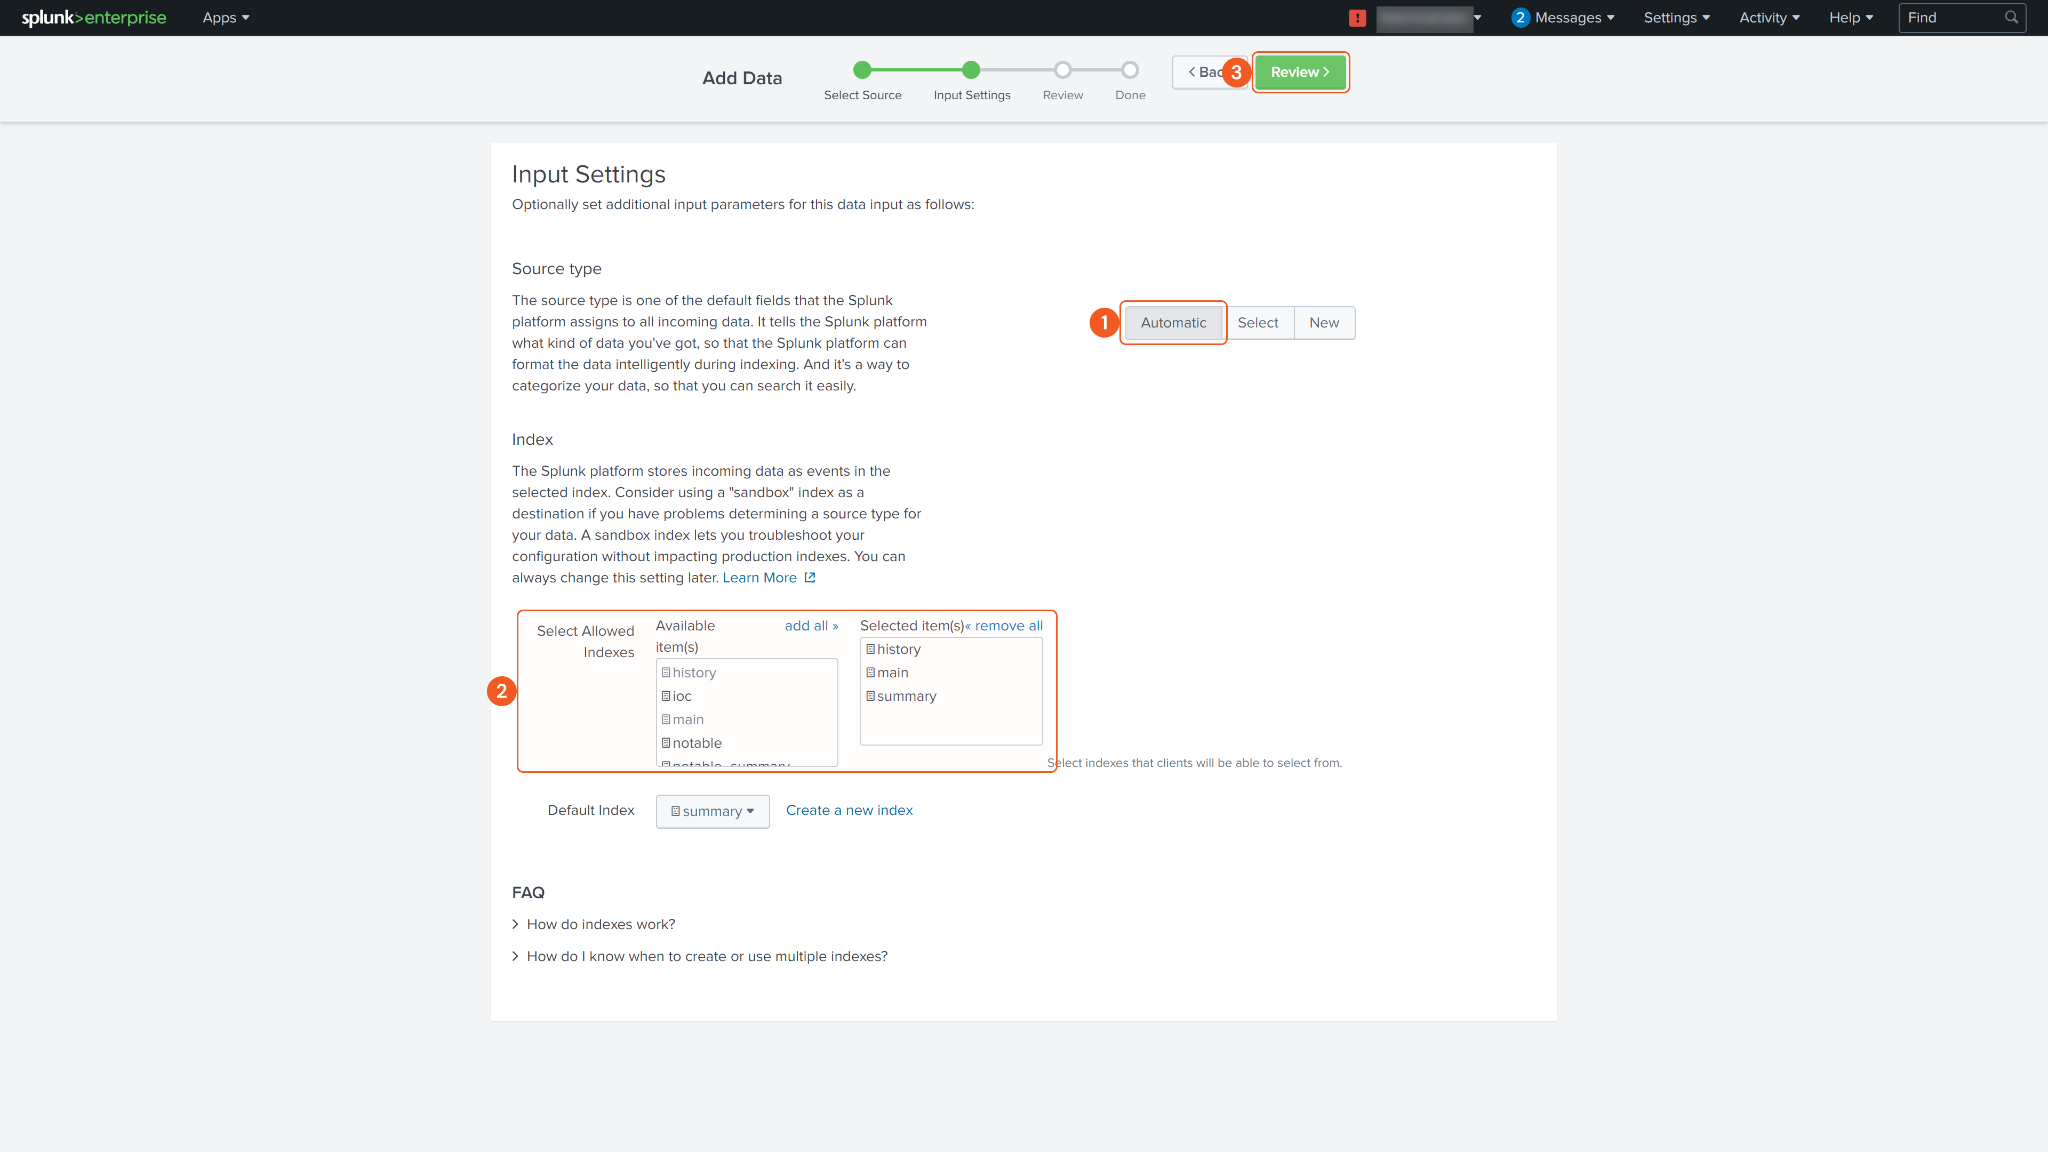
Select the appropriate Source type and specify the Allowed Indexes for your event collector. Proceed by clicking Review.
Review your configuration and click Submit to create your Event Collector Token.
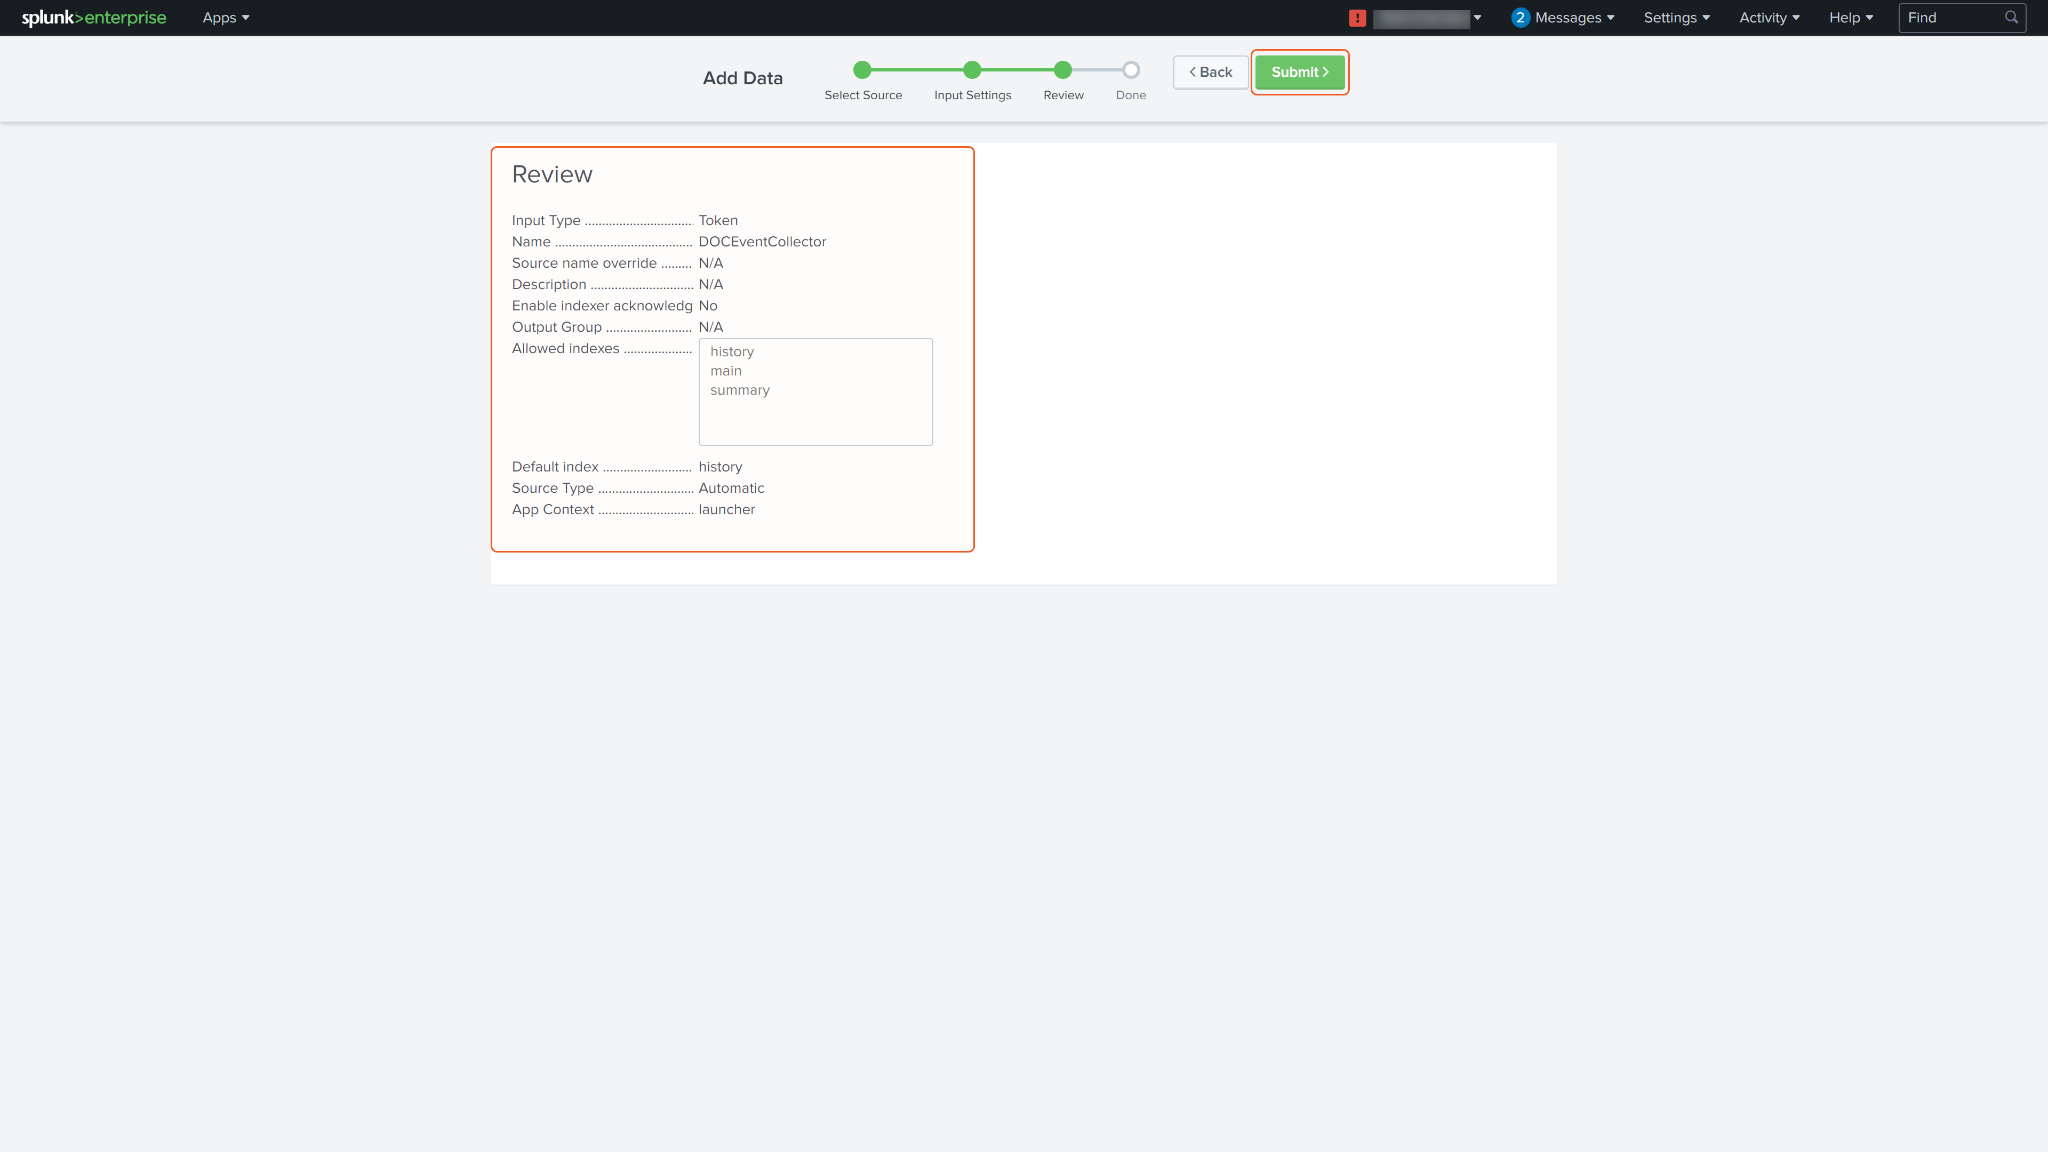
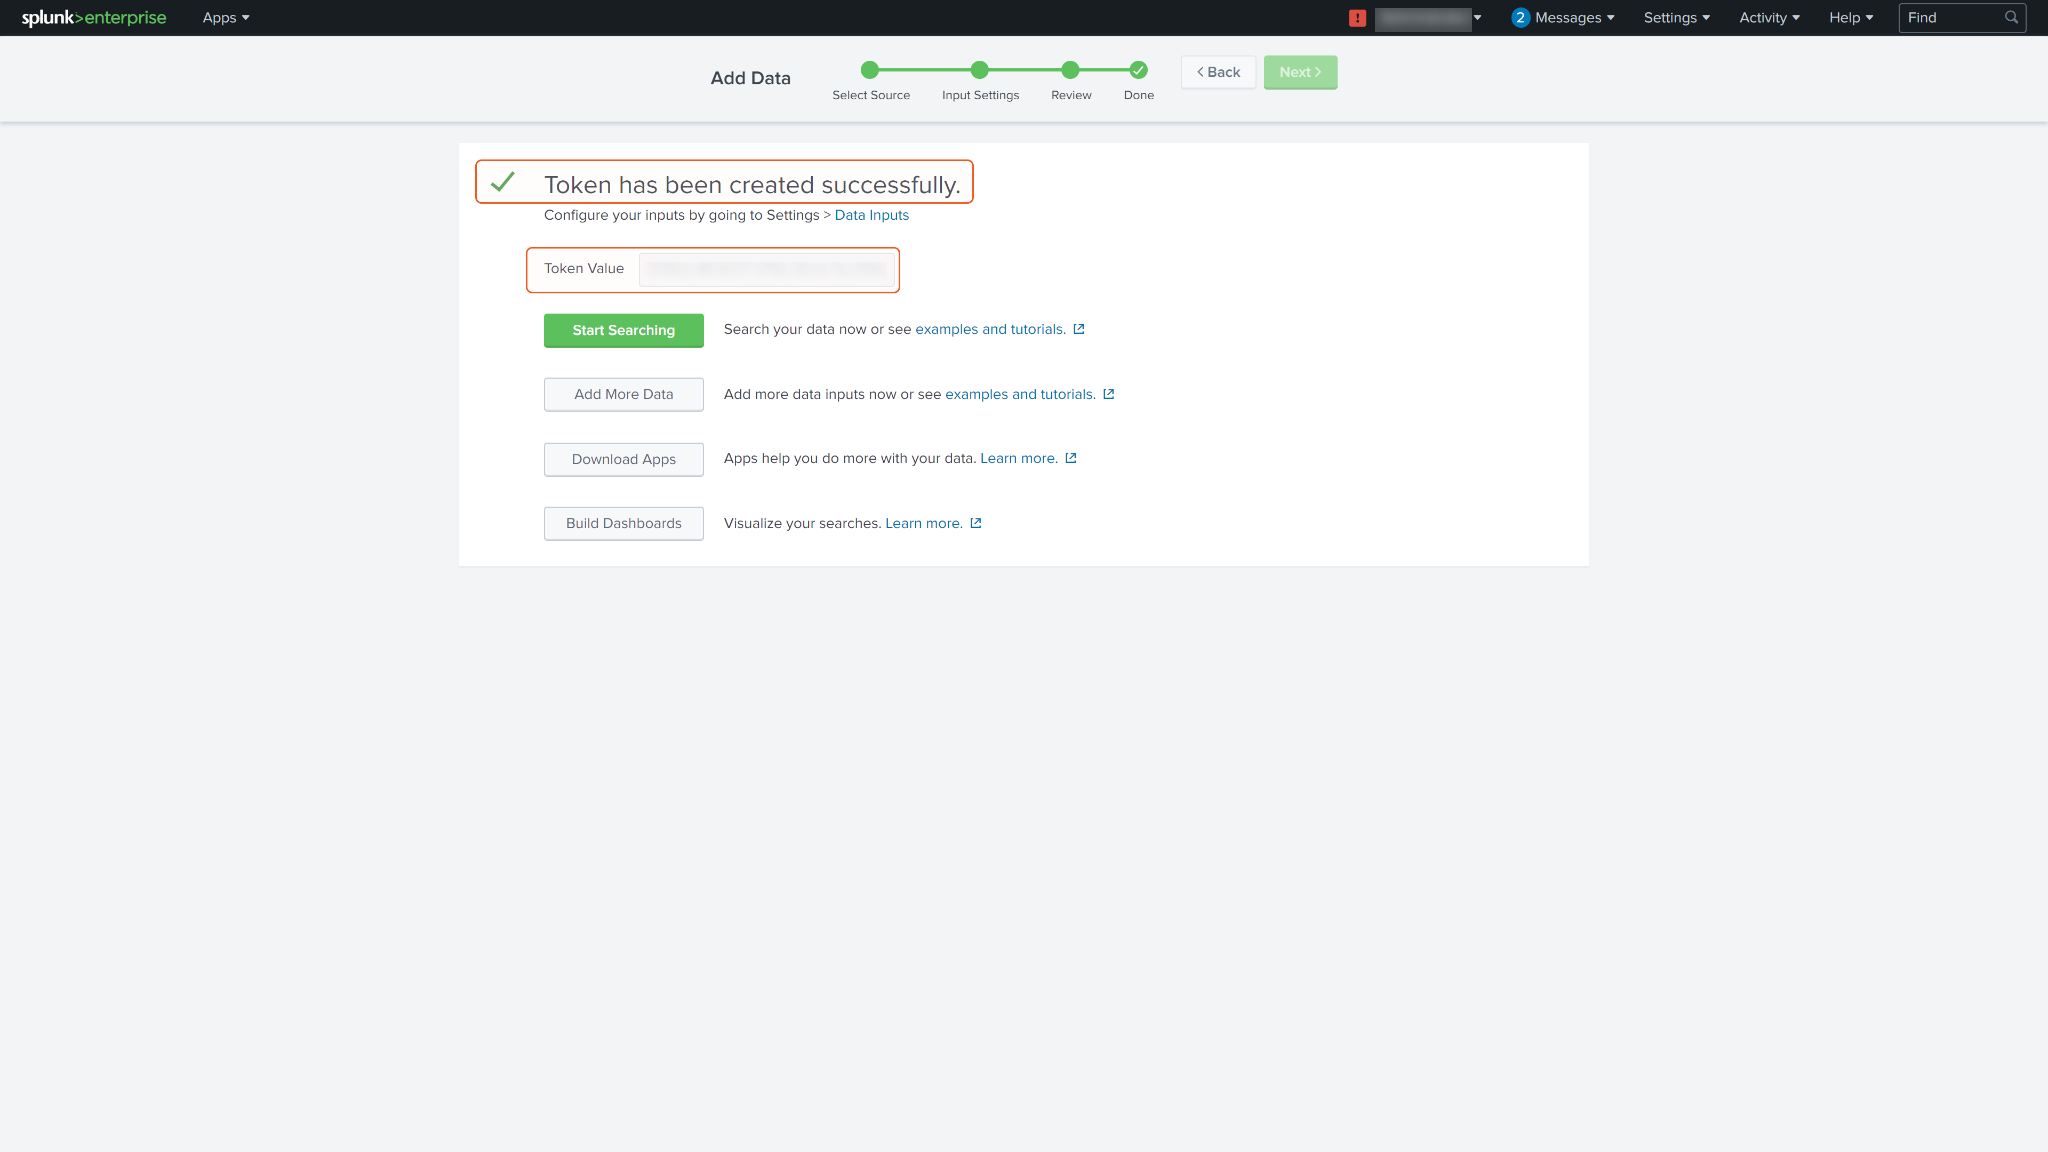
Your Event Collector Token should be created successfully.
To find the Event Collector you just created, go back to Settings, then navigate to Data inputs and select "HTTP Event Collector." You will see the newly created event collector there. Copy its name for future reference, particularly for the Submit Event command.
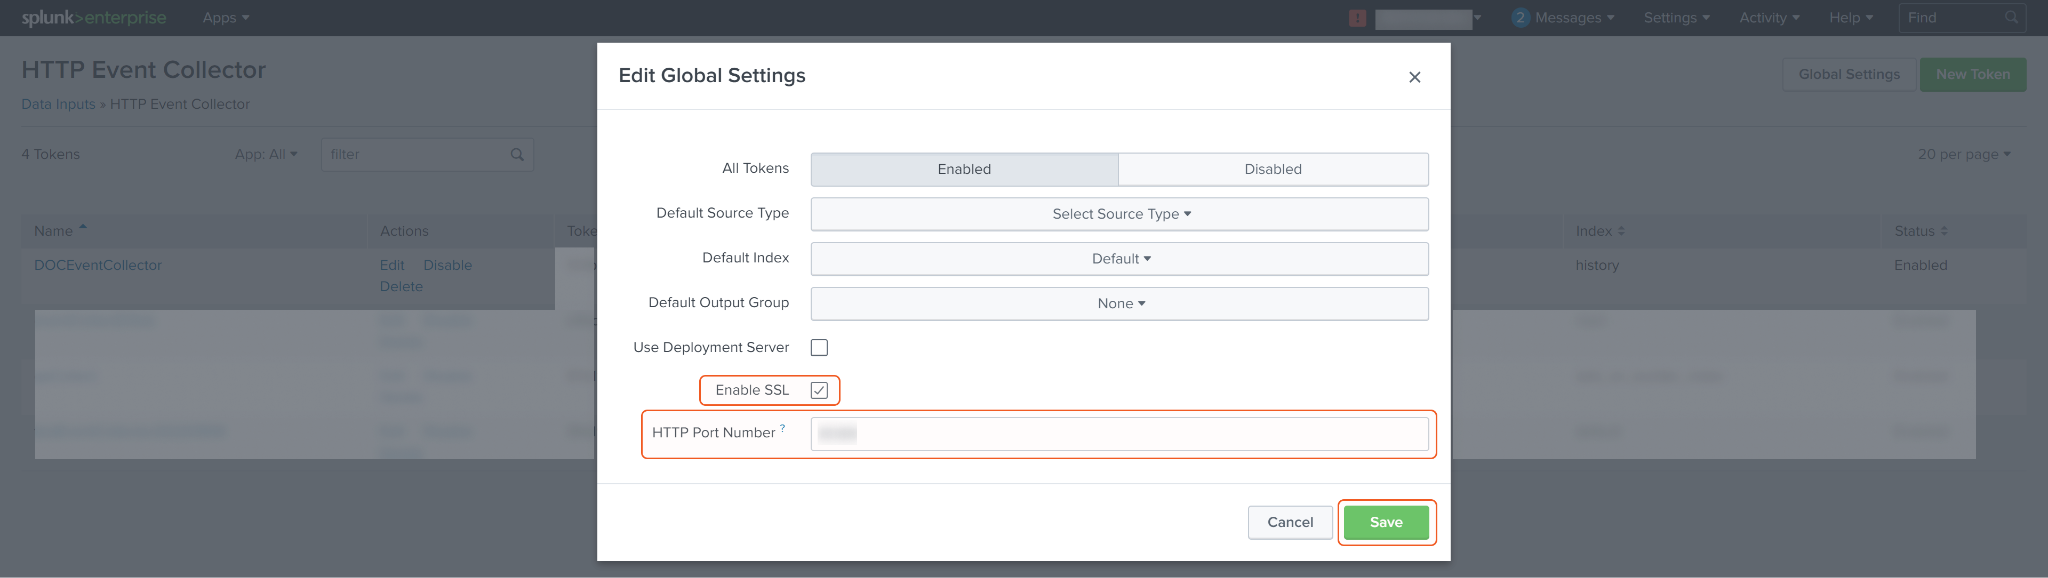
To modify the HTTP Event Collector port number, click on Global Settings located at the top right corner.
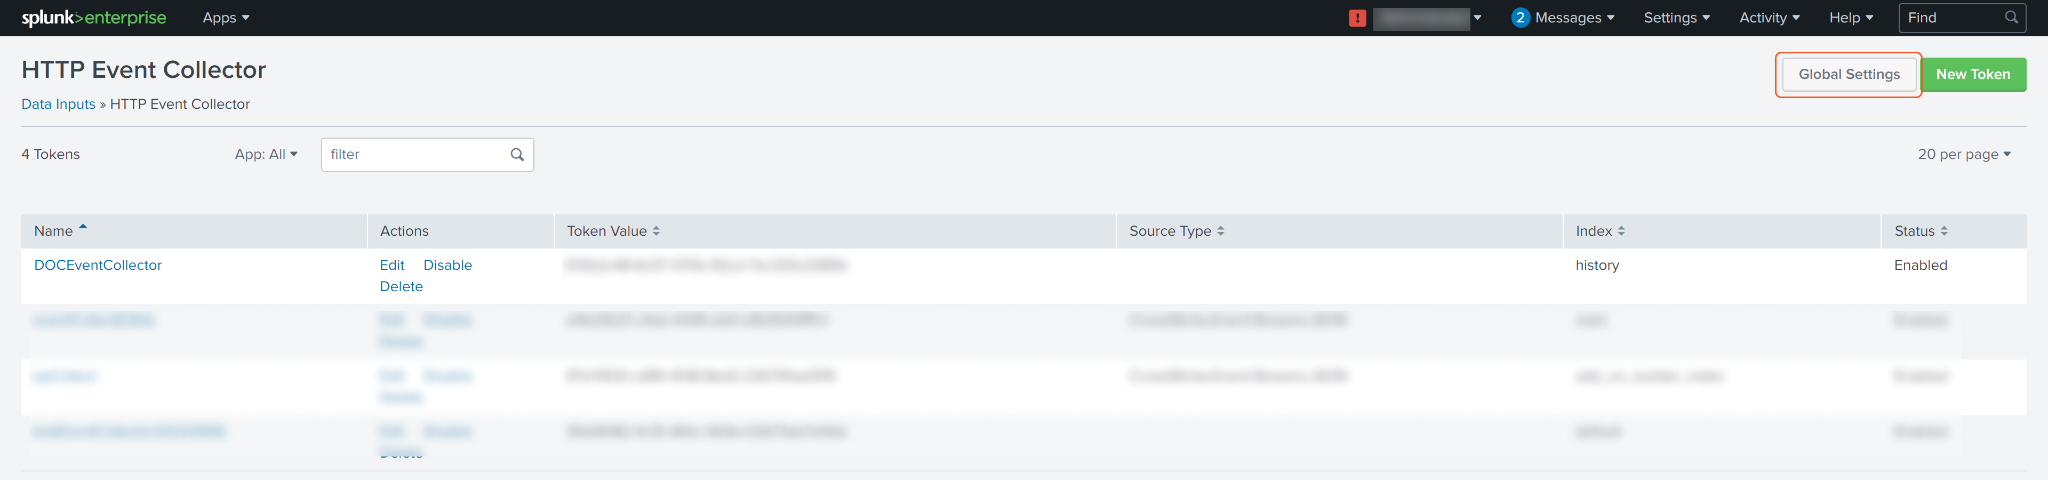
Make the desired changes to the HTTP port number or any other desired global settings, and click Save.
Input
Input Parameter | Required/Optional | Description | Example |
Event Collector Token Name | Required | The name of the HTTP Event Collector token created from the Splunk user interface. Avoid using duplicate names for Event Tokens. For instructions on creating an HTTP Event Collector token, see Creating an Event Collector Token. | eventCollectD3lab |
Event Collector Port | Optional | The Submit Event command operates on port 8088 by default and uses HTTPS for transport. This parameter enables you to configure the port and HTTP protocol settings independently from the settings of other servers in your deployment. | 8088 |
Event | Required | The event payload key-value pair. You can input either a string or a JSON object. Here are examples of both: JSON example: {"message":"Access log test message"} String example: "Access log test message" | {"message":"Access log test message20220906b"} |
Fields | Optional | The additional fields for indexing that do not occur in the event payload. This parameter can be used to exclude specific fields from the event data, while still requiring additional metadata for indexing and searching purposes. | { "severity": "WARNING", "category": [ "foo", "bar" ] } |
Index | Optional | The index name associated with the event. By setting a default index name, all events in the request will use this index unless overridden. Index names can be obtained using the List Indexes command. | accesslog |
Host | Optional | The host name associated with the event. By setting a default host name, all events in the request will use this index unless overridden. | desktop-***** |
Source | Optional | The user-defined event source. By setting a default source, all events in the request will use this source unless overridden. | /var/log/access.log |
Source Type | Optional | The user-defined source type. By setting a default source type, all events in the request will use this source type unless overridden. | access |
Event Time | Optional | The user-defined event time. By setting a default event time, all events in the request will use this event time unless overridden. If this parameter is not defined, the event time will be the event submission time. | 2023-04-26 00:00 |
Output
To view the sample output data for all commands, refer to this article.
Error Handling
If the Return Data is Failed, an Error tab will appear in the Test Result window.
The error tab contains the details responded from D3 SOAR or third-party API calls, including Failure Indicator, Status Code, and Message. This can help you locate the root cause of a command failure.
Parts in Error | Description | Example |
Failure Indicator | Indicates the command failure that happened at a specific input and/or API call. | Submit Event failed. |
Status Code | The response code issued by the third-party API server or the D3 SOAR system that can be used to locate the corresponding error category. For example, if the returned status code is 401, the selected connection is unauthorized to run the command. The user or system support would need to check the permission setting in the Splunk v2 portal. Refer to the HTTP Status Code Registry for details. | Status Code: 404. |
Message | The raw data or captured key error message from the integration API server about the API request failure. | Message: Event Collector Token Name Not Found. |
Error Sample Data Submit Event failed. Status Code: 404. Message: Event Collector Token Name Not Found. |
Update Notable Events
Updates the specified notable events. At least one of the optional parameters must be defined.
READER NOTE
The input parameter Event IDs is required to run this command.
Run Fetch Event command to obtain the Event IDs. Make sure to select the Event Type as "Notable Events" when using the Fetch Event command. From the returned the raw data, you can locate the Event IDs at the path $.results[*].event_id.
Alternatively, you can obtain Event IDs by running the Get Recent Notable Events command. The Event IDs can be found in the raw data at the path $.results[*].event_id.
Input
Input Parameter | Required/Optional | Description | Example |
Comment | Optional | A description of the change or information about the updated notable events. | Adding a comment. |
Status | Optional | The updated status of the notable events. | Unassigned |
Urgency | Optional | The updated urgency level of the notable events. | Critical |
New Owner | Optional | The new owner of the notable events. | Admin |
Event IDs | Required | The IDs of the notable events to update. Event IDs can be obtained using the Get Recent Notable Events or Fetch Event commands. | [ "D***-***-***-***-***@@notable@@***", "***-***-***-***-***@@notable@@***" ] |
Output
To view the sample output data for all commands, refer to this article.
Error Handling
If the Return Data is Failed, an Error tab will appear in the Test Result window.
The error tab contains the details responded from D3 SOAR or third-party API calls, including Failure Indicator, Status Code, and Message. This can help you locate the root cause of a command failure.
Parts in Error | Description | Example |
Failure Indicator | Indicates the command failure that happened at a specific input and/or API call. | Update Notable Events failed. |
Status Code | The response code issued by the third-party API server or the D3 SOAR system that can be used to locate the corresponding error category. For example, if the returned status code is 401, the selected connection is unauthorized to run the command. The user or system support would need to check the permission setting in the Splunk v2 portal. Refer to the HTTP Status Code Registry for details. | Status Code: 400. |
Message | The raw data or captured key error message from the integration API server about the API request failure. | Message: Invalid rule_id value. |
Error Sample Data Update Notable Events failed. Status Code: 400. Message: Invalid rule_id value. |
Upload Files
Uploads structured log file(s) to your Splunk instance.
READER NOTE
Index is an optional parameter to run this command.
Run the List Indexes command to obtain Index. Index is referring to the Index Name, which can be found in the returned raw data at the path $.entry[*].name.
File ID and File Source
It is not recommended to use the Test Command feature with the Upload Files command as it is designed for dynamic input files in Playbooks, Incident Attachments, and Artifact Attachments. There is a simple workaround to test the command:
Navigate to Configuration on the top bar menu.
Click on Utility Commands on the left sidebar menu.
Use the search box to find and select the Create a File from input Text Array command.
Click on the Test tab.
Input the required information for the parameters.
Click on the Test Command button. A D3 File ID will appear in the output data after the file has been successfully created. The D3 File Source of the created file will be Playbook File.
Input
Input Parameter | Required/Optional | Description | Example |
Index | Optional | The name of the index to send events. Index names can be obtained using the List Indexes command. If this parameter is not specified, the default index will be used. | history |
Source | Optional | The source value to define the events' metadata. If this parameter is not defined, the names of the uploaded files will be the source. | customEvent20230228 |
Source Type | Optional | The source type to apply to the events. If this parameter is not defined, the uploaded file types will be the source. | csv |
Host | Optional | The host of the events. If this parameter is not specified, the local host will be used. | testHost |
File IDs | Required | The file paths according to the file source. | [ "750", "751" ] |
File Source | Required | The file source of the file to send. The options for file sources are: Incident Attachment File: Manually uploaded file from Incident Playbook File: Output from another Task Artifact File: Ingested Artifact in an Event | Playbook File |
Output
To view the sample output data for all commands, refer to this article.
Error Handling
If the Return Data is Failed, an Error tab will appear in the Test Result window.
The error tab contains the details responded from D3 SOAR or third-party API calls, including Failure Indicator, Status Code, and Message. This can help you locate the root cause of a command failure.
Parts in Error | Description | Example |
Failure Indicator | Indicates the command failure that happened at a specific input and/or API call. | Upload Files failed. |
Status Code | The response code issued by the third-party API server or the D3 SOAR system that can be used to locate the corresponding error category. For example, if the returned status code is 401, the selected connection is unauthorized to run the command. The user or system support would need to check the permission setting in the Splunk v2 portal. Refer to the HTTP Status Code Registry for details. | Status Code: 404. |
Message | The raw data or captured key error message from the integration API server about the API request failure. | Message: File Not Found. |
Error Sample Data Upload Files failed. Status Code: 404. Message: File Not Found. |
Upload Lookup Tables
Uploads lookup tables to create lookup table files. Note: Installing the Splunk App for Lookup File Editing is required to use this command (available at https://splunkbase.splunk.com/app/1724).
File ID and File Source
It is not recommended to use the Test Command feature with the Upload Lookup Tables command as it is designed for dynamic input files in Playbooks, Incident Attachments, and Artifact Attachments. There is a simple workaround to test the command:
Navigate to Configuration on the top bar menu.
Click on Utility Commands on the left sidebar menu.
Use the search box to find and select the Create a File from input Text Array command.
Click on the Test tab.
Input the required information for the parameters.
Click on the Test Command button. A D3 File ID will appear in the output data after the file has been successfully created. The D3 File Source of the created file will be Playbook File.
Input
Input Parameter | Required/Optional | Description | Example |
File IDs | Required | The file paths according to the file source. Files should be in .csv format. | [ "750", "751" ] |
File Source | Required | The file source of the file to send. The options for file sources are: Incident Attachment File: Manually uploaded file from Incident Playbook File: Output from another Task Artifact File: Ingested Artifact in an Event | Playbook File |
Output
To view the sample output data for all commands, refer to this article.
Error Handling
If the Return Data is Failed, an Error tab will appear in the Test Result window.
The error tab contains the details responded from D3 SOAR or third-party API calls, including Failure Indicator, Status Code, and Message. This can help you locate the root cause of a command failure.
Parts in Error | Description | Example |
Failure Indicator | Indicates the command failure that happened at a specific input and/or API call. | Upload Lookup Tables failed. |
Status Code | The response code issued by the third-party API server or the D3 SOAR system that can be used to locate the corresponding error category. For example, if the returned status code is 401, the selected connection is unauthorized to run the command. The user or system support would need to check the permission setting in the Splunk v2 portal. Refer to the HTTP Status Code Registry for details. | Status Code: 404. |
Message | The raw data or captured key error message from the integration API server about the API request failure. | Message: File Not Found. |
Error Sample Data Upload Lookup Tables failed. Status Code: 404. Message: File Not Found. |
Test Connection
Allows you to perform a health check on an integration connection. You can schedule a periodic health check by selecting Connection Health Check when editing an integration connection.
Input
N/A
Output
Output Type | Description | Return Data Type |
Return Data | Indicates one of the possible command execution states: Successful or Failed. The Failed state can be triggered by any of the following errors:
More details about an error can be viewed in the Error tab. | String |
Error Handling
If the Return Data is Failed, an Error tab will appear in the Test Result window.
The error tab contains the details responded from D3 SOAR or third-party API calls, including Failure Indicator, Status Code, and Message. This can help you locate the root cause of a command failure.
Parts in Error | Description | Example |
Failure Indicator | Indicates the command failure that happened at a specific input and/or API call. | Test Connection failed. Failed to check the connector. |
Status Code | The response code issued by the third-party API server or the D3 SOAR system that can be used to locate the corresponding error category. For example, if the returned status code is 401, the selected connection is unauthorized to run the command. The user or system support would need to check the permission setting in the Splunk v2 portal. Refer to the HTTP Status Code Registry for details. | Status Code: 400. |
Message | The raw data or captured key error message from the integration API server about the API request failure. | Message: A connection attempt failed because the connected party did not properly respond after a period of time, or established connection failed because connected host has failed to respond. |
Error Sample Data Test Connection failed. Failed to check the connector. Status Code: 400. Message: A connection attempt failed because the connected party did not properly respond after a period of time, or established connection failed because connected host has failed to respond. |
Use Case
Task #44566 for the client (S&P Global) involves searching for data from the past 90 days in Splunk. However, the query for a large amount of data exceeds the API limit, resulting in a "Request Size Exceed the Limit" error message. Their search process typically takes over 15-30 minutes.
To address this issue, D3 has designed three commands: Start Search, Get Search Status, and Get Search Result. These commands separate the functionalities of the Fetch Event command into three separate commands.
The Start Search command initiates the search operation and returns the search IDs instead of the actual results. The Get Search Status command can then be used to check the status of the search job associated with the search IDs. Once the status is "Done," the Get Search Result command can be run with specific parameters to retrieve the desired data.
The following approach can be used to utilize the parameters of the Get Search Result command: If you encounter "Request Size Exceed the Limit" error while running the command, begin by setting the Results Count parameter to a defined value, such as 50, to retrieve the first 50 events. Then, adjust the results count to 50 and set the offset to 50 to retrieve events 51-100. Repeat these steps until you have obtained the complete list of events. Adjust the number based on your use case.
FAQ
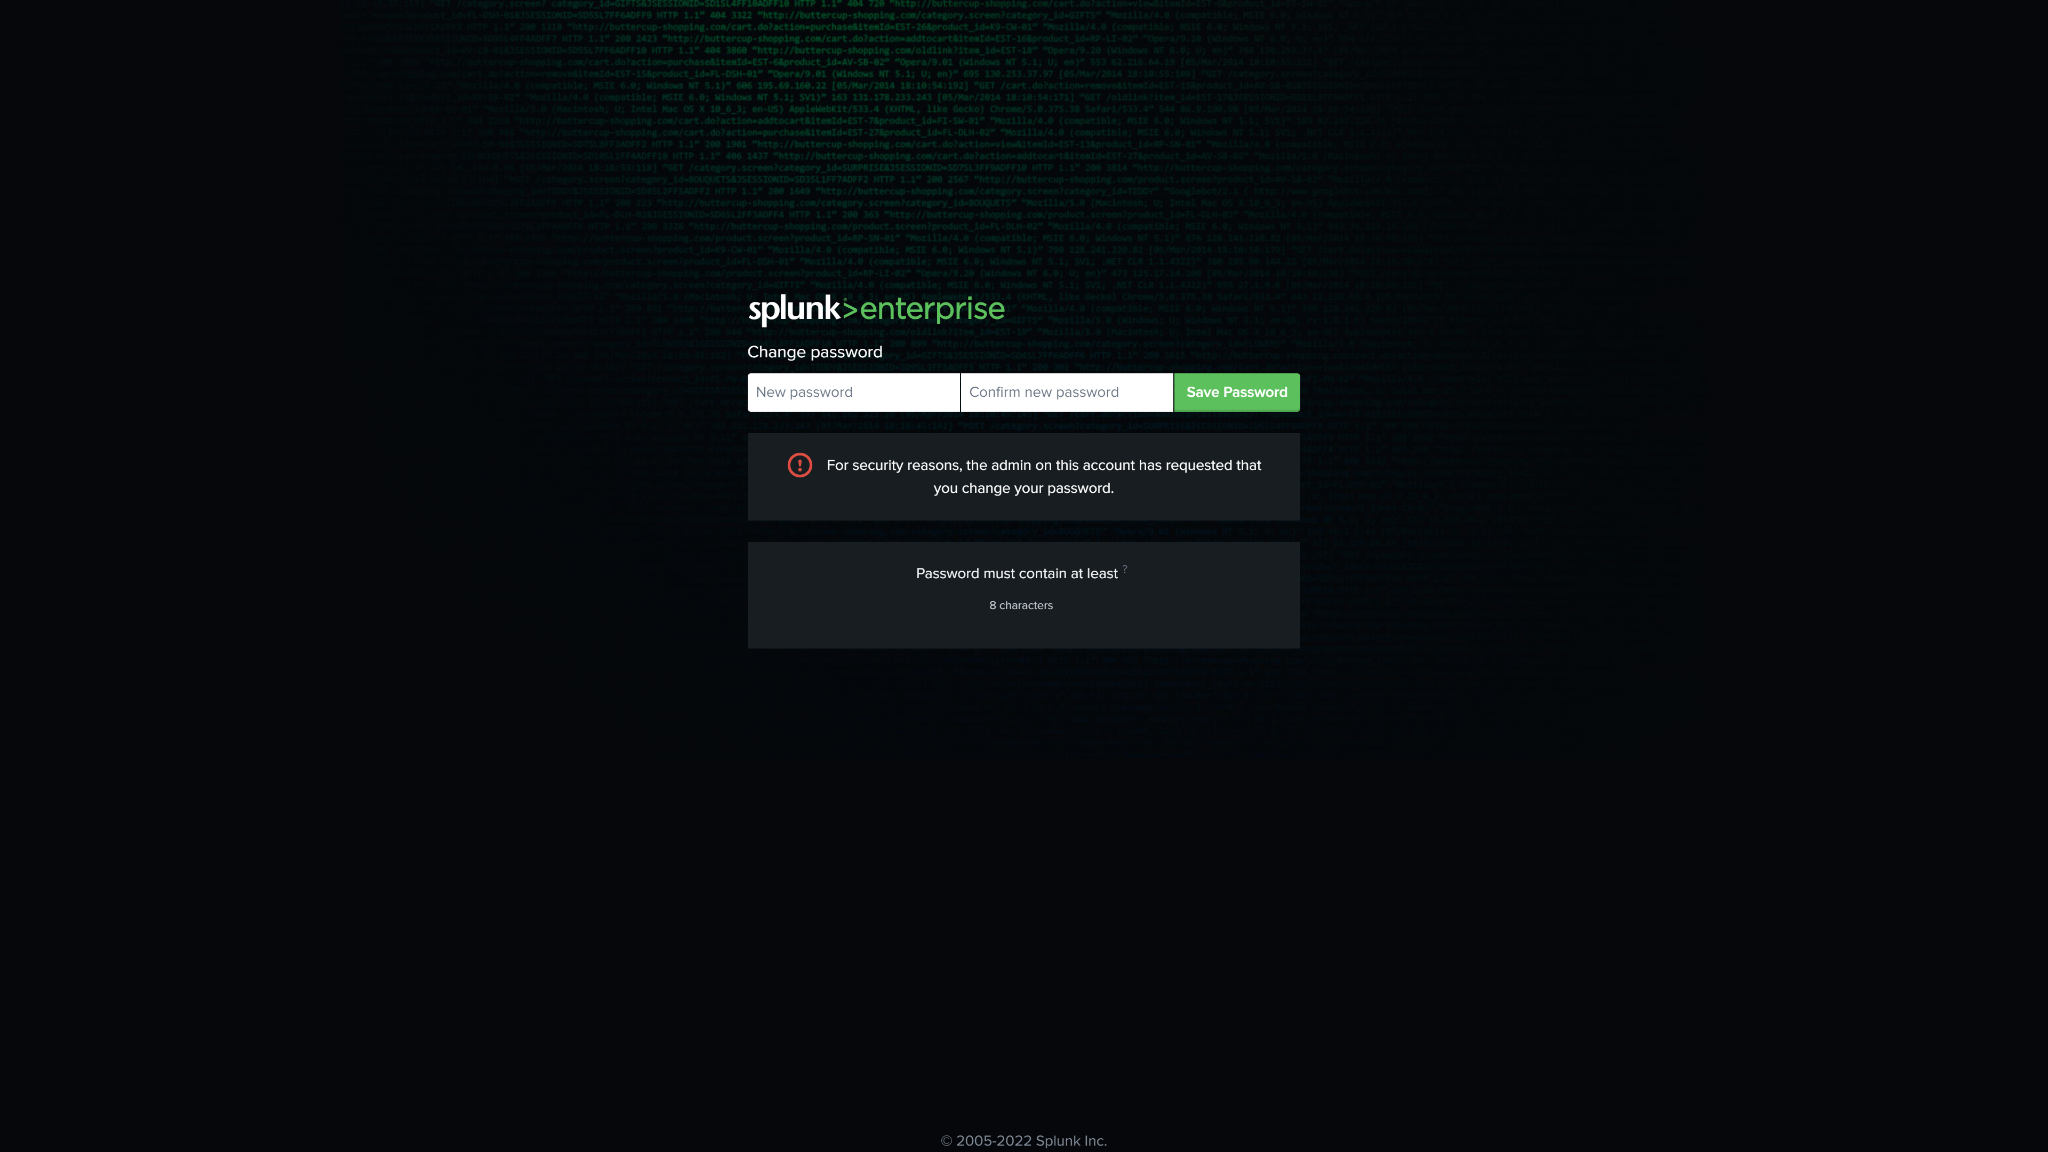
Question 1: What causes the error message "For security reasons, the admin on this account has requested that you change your password" while establishing a connection using Basic Authentication?
Answer: To address this issue, you need to activate your new account. Start by logging out of the admin account and logging in to your new account. Once logged in, you will be directed to a page where you can update your password. Make sure to update your password as prompted. Once you have successfully updated your password, you will be able to establish a connection using your newly created account.