
Sophos Central V2
LAST UPDATED: AUG 5, 2025
Overview
Sophos Central is the unified console for managing Sophos products. Sophos Central gives users one place to manage their endpoint, mobile, encryption, web, email, server, and wireless security. D3's Sophos Central V2 integration uses OAuth Authentication to ingest detections and common alerts.
D3 SOAR is providing REST operations to function with Sophos Central V2.
Sophos Central V2 is available for use in:
Known Limitations
Sophos Central enforces API rate limits to prevent overuse. Exceeding the API rate limits will return a 429 error. To avoid this, users should refer to the following request limits:
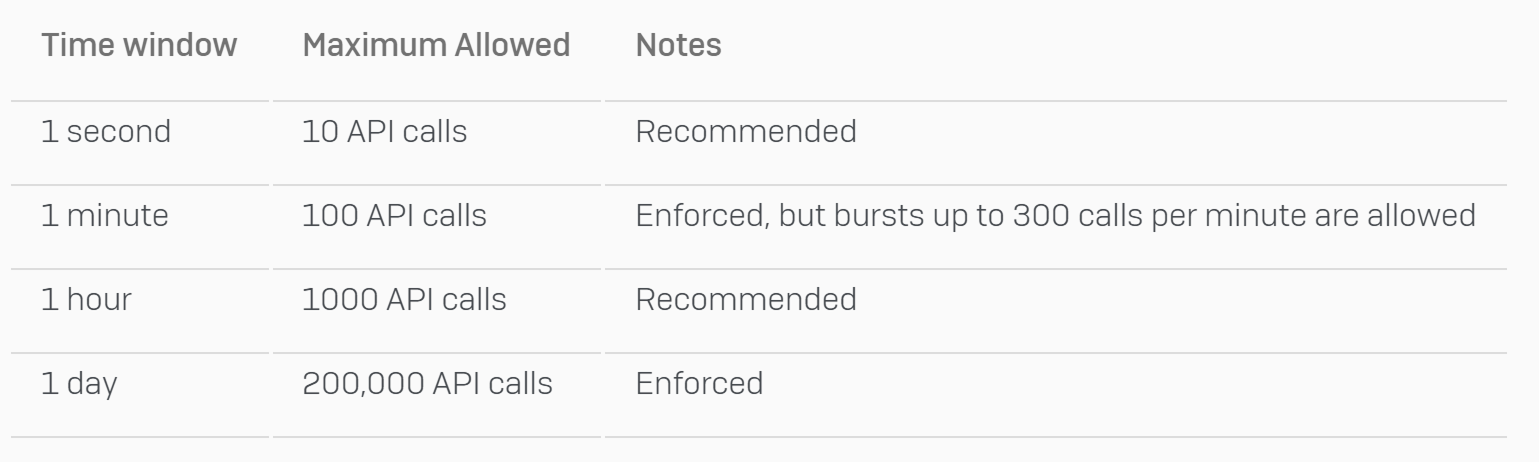
Refer to How Our APIs Work | Sophos Central APIs for detailed information about the rate limits of the Sophos Central API.
Connection
To connect to Sophos Central V2 from D3 SOAR, follow this part to collect the required information below:
Parameter | Description | Example |
Server URL | The region API server URL of the Sophos Central instance. If the regional API server URL is not known, users may leave this parameter blank. | https://api-ca01.central.sophos.com |
Client ID | The Client ID used to authenticate the connection. | ***** |
Client Secret | The Client Secret used to authenticate the connection. | ***** |
API Version | The version of the API to use for the connection. The default value is v1. | v1 |
Permission Requirements
Each endpoint in the Sophos Central V2 API requires a certain permission scope. The following are the predefined roles that grant the minimum required scopes for the commands in this integration.
Command | Minimum Required Predefined Role |
Fetch Event | Detections: Service Principal Super Admin Alerts/Cases: Service Principal ReadOnly |
Get Case Detections | Service Principal ReadOnly |
Get Case Impacted Entities | Service Principal ReadOnly |
Get Case Mitre Attack | Service Principal ReadOnly |
Update Cases | Service Principal Super Admin |
Test Connection | Service Principal ReadOnly |
As Sophos Central V2 is using role-based access control (RBAC), the Client ID and Client Secret are generated based on a specific user account and the application. Therefore, the command permissions are inherited from the user account’s role. Users need to configure their user profile from the Sophos Central V2 console for each command in this integration.
Configuring Sophos Central V2 to Work with D3 SOAR
Retrieving the Server URL (Optional)
Log into the Sophos Central platform.
Navigate to
 (Profile Menu) > Support settings, then identify the account region.
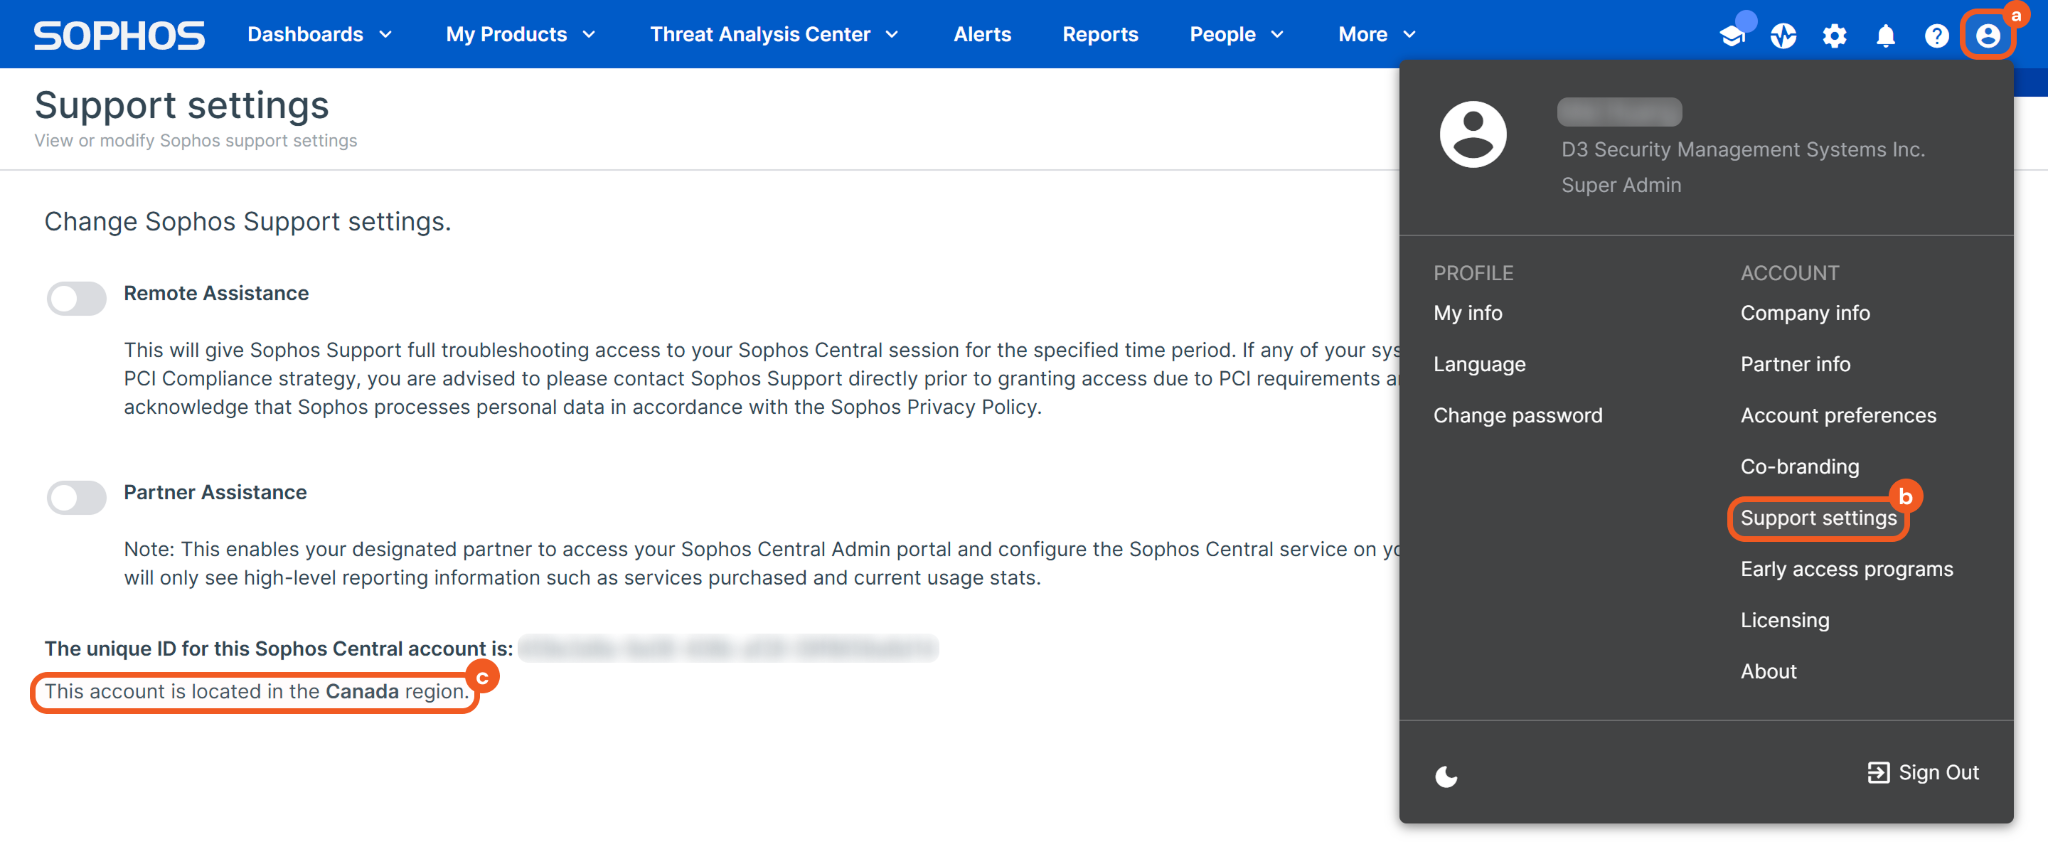
Visit How Our APIs Work | Sophos Central APIs to check the corresponding base URL for the account region.
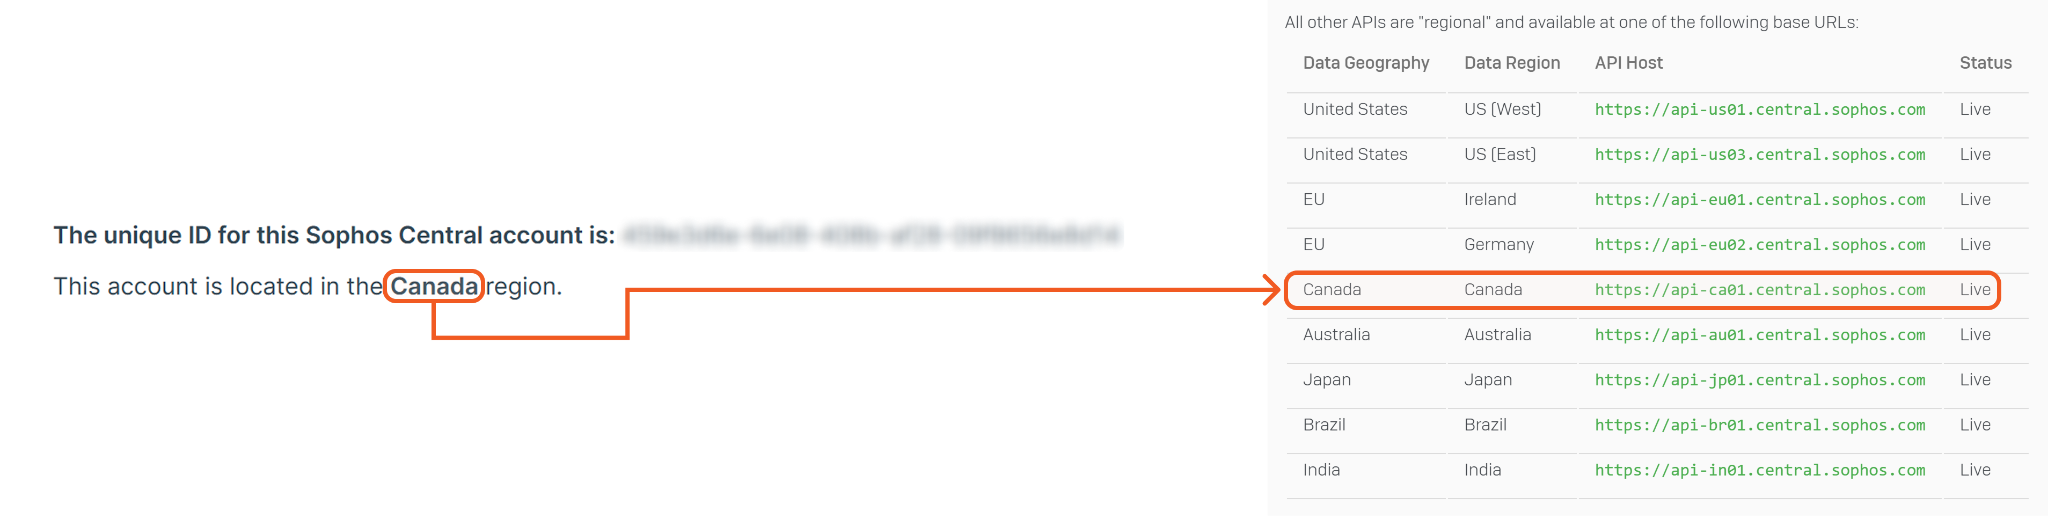
For instance, the Server URL for the Canada account region is https://api-ca01.central.sophos.com.
Copy the URL for the account region. Refer to step 3i sub-step 1 in Configuring D3 SOAR to Work with Sophos Central V2.
Retrieving the Client ID and Client Secret
Navigate to
 (General Settings) > API Credentials Management.
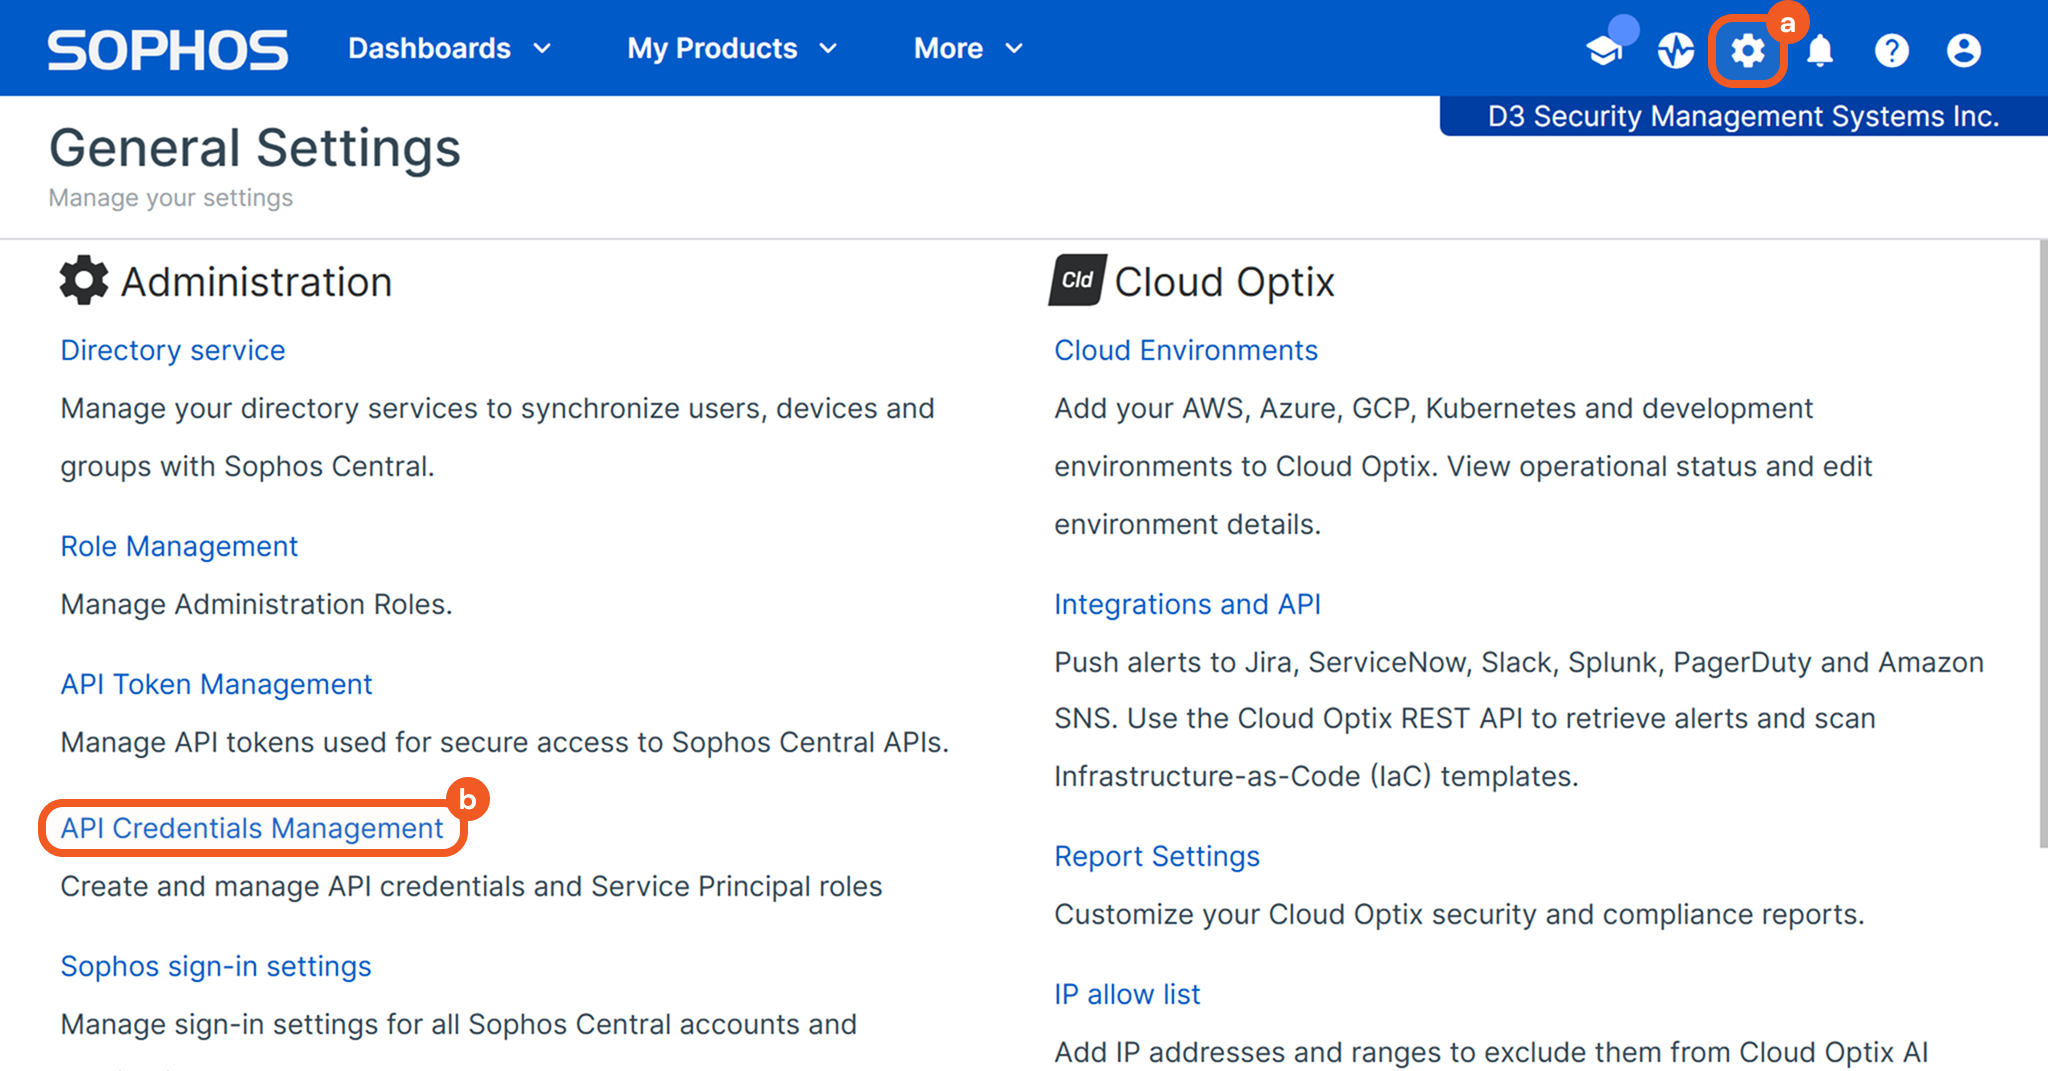
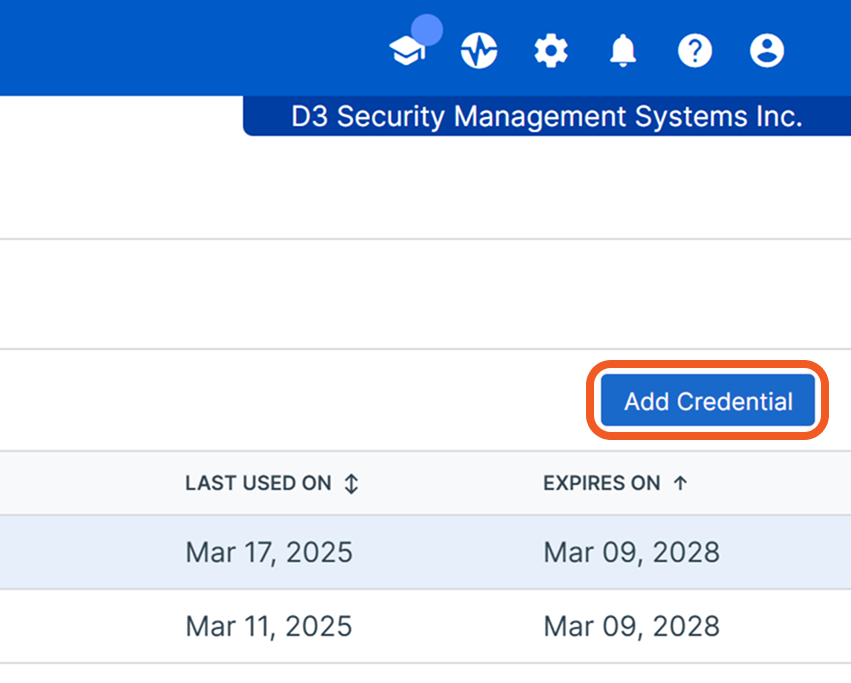
Click the Add Credential button.
Fill the form to add credentials.
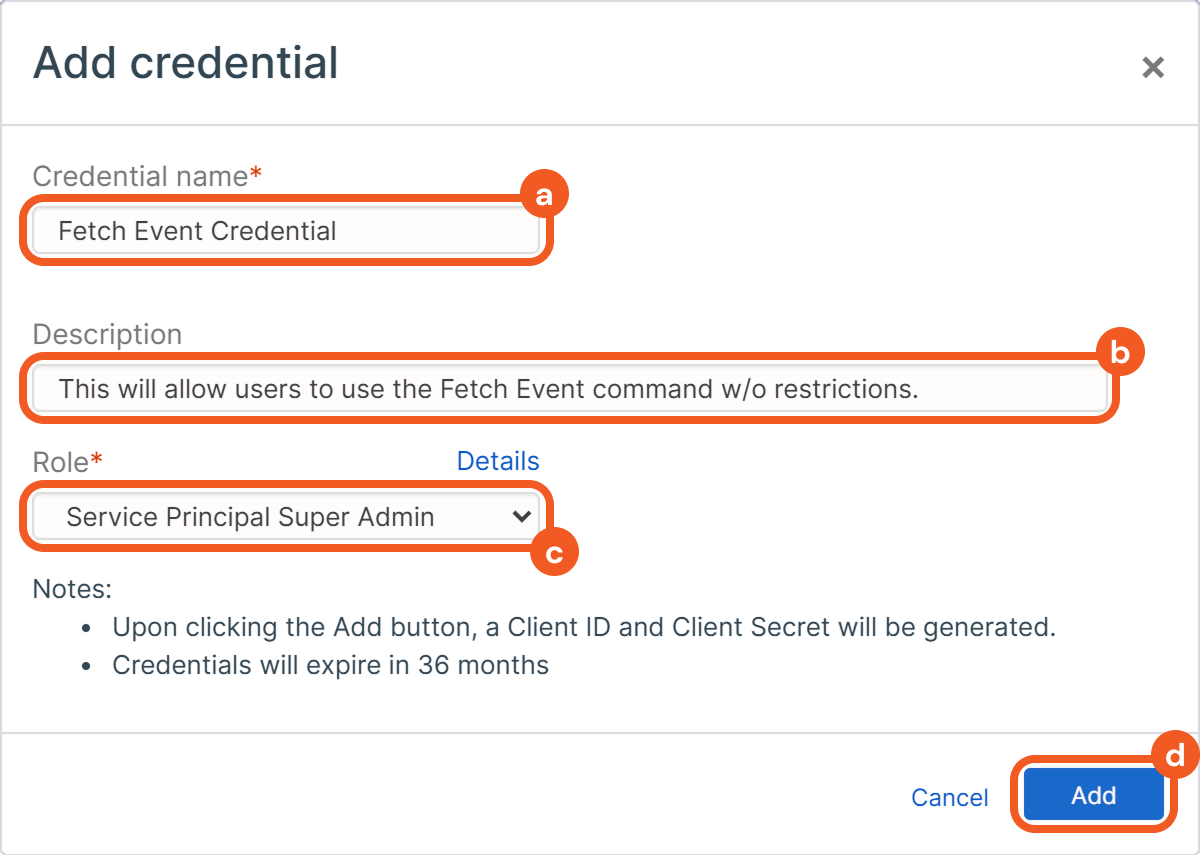
Enter a name for the credential.
(Optional) Add a description.
Select the role. For example, to fetch all event types using the Fetch Event command, select the Service Principal Super Admin role.
Click the Add button.
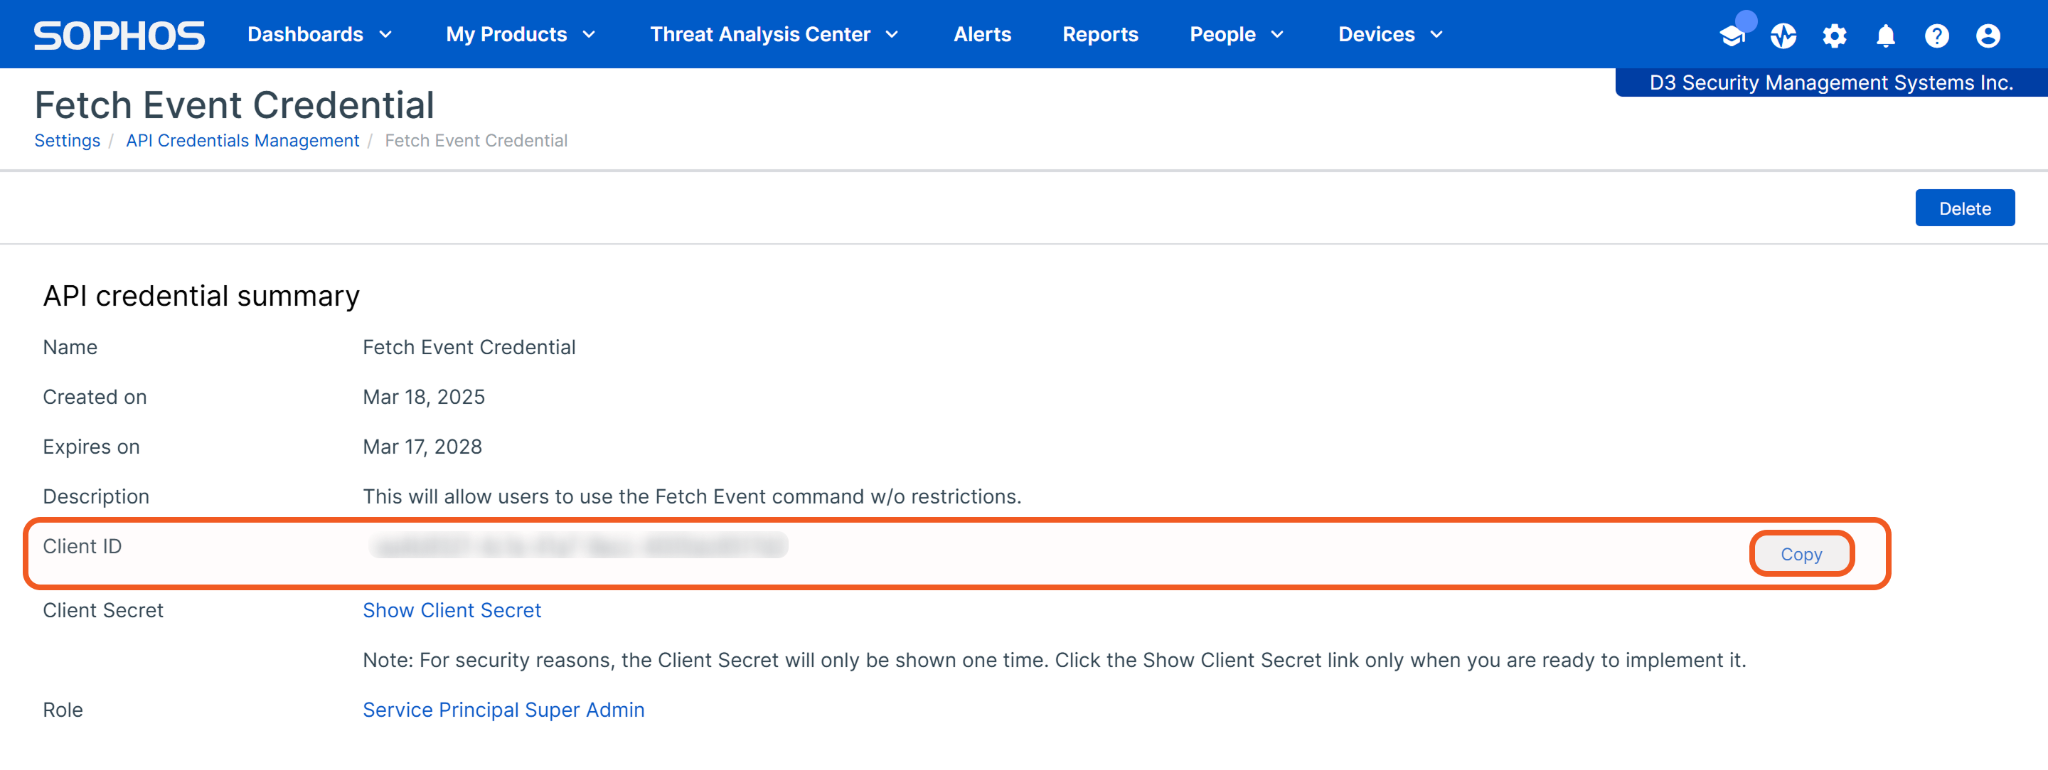
Click the Copy button and save the Client ID in a secure place. Refer to step 3i sub-step 2 in Configuring D3 SOAR to Work with Sophos Central V2.
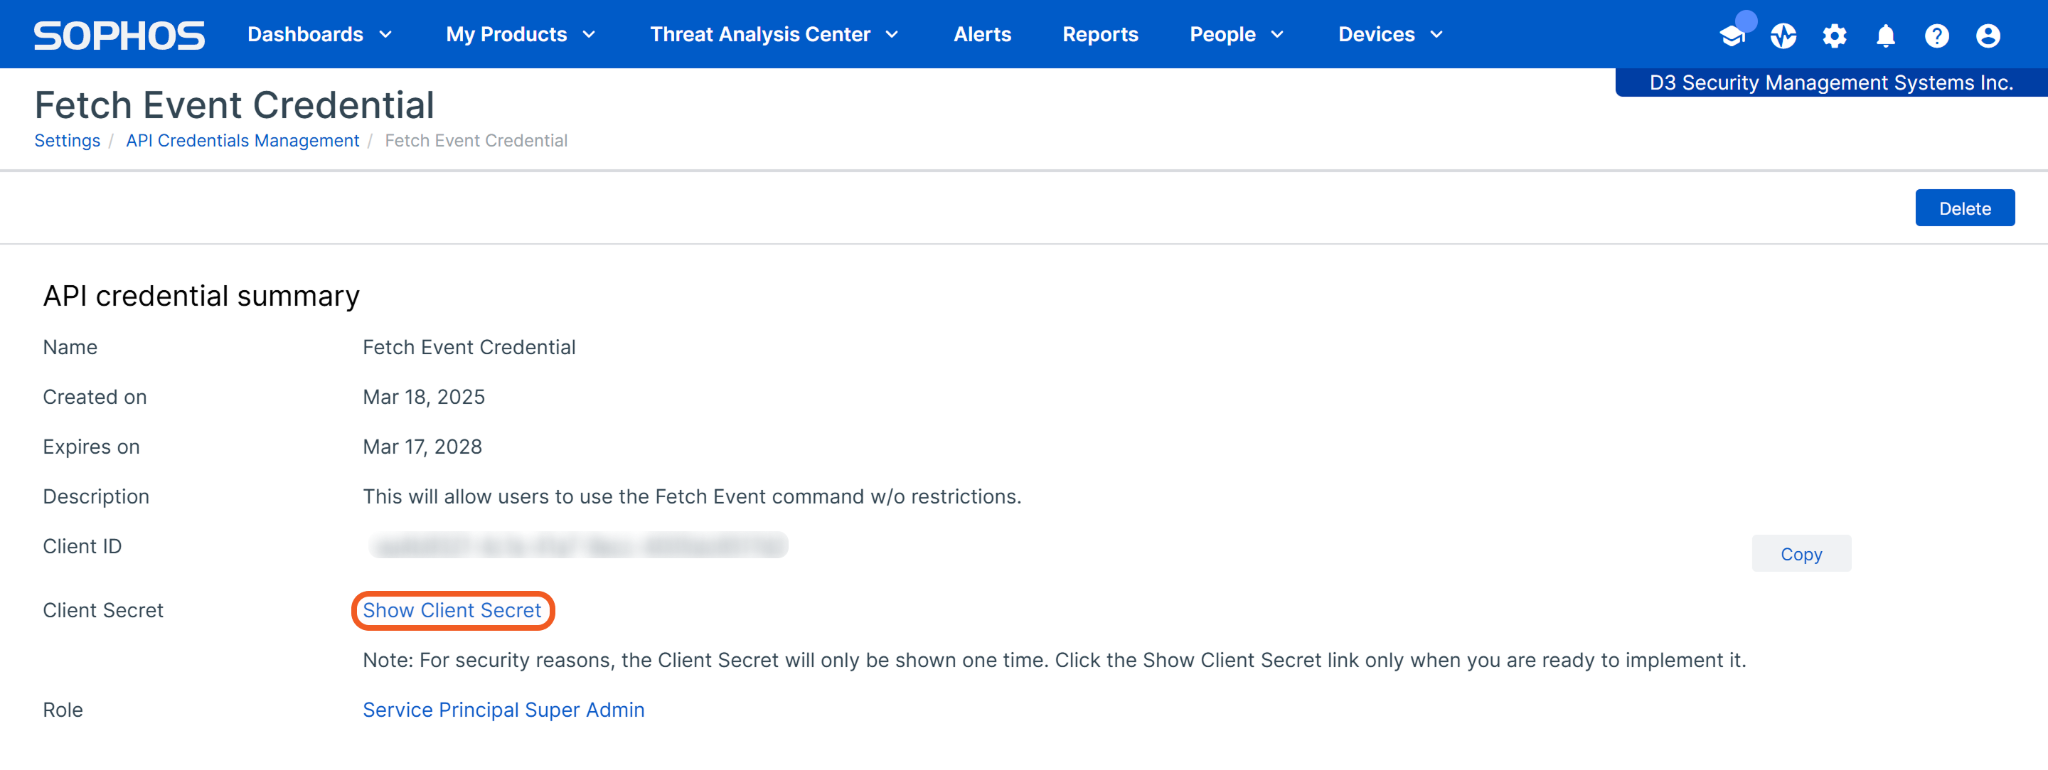
Click the Show Client Secret link to reveal the Client Secret.
Click the Copy button and save the Client Secret in a secure place. Refer to step 3i sub-step 3 in Configuring D3 SOAR to Work with Sophos Central V2.
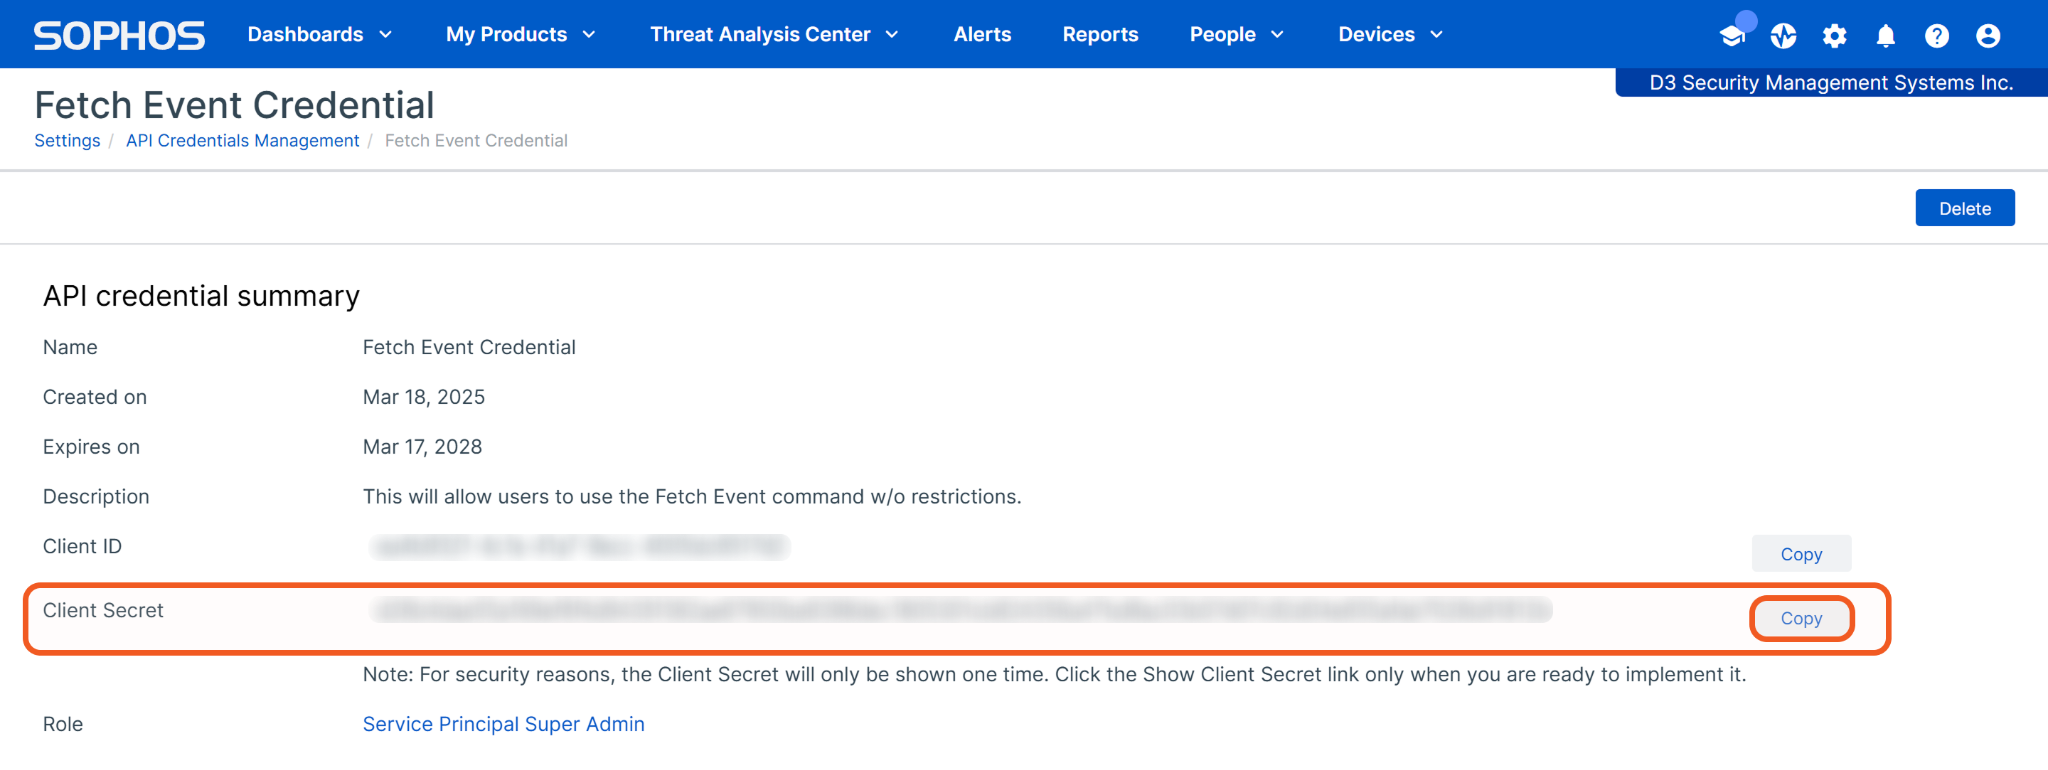
Users will not be able to view their Client Secret past this point.
Configuring D3 SOAR to Work with Sophos Central V2
Log in to D3 SOAR.
Find the Sophos Central V2 integration.
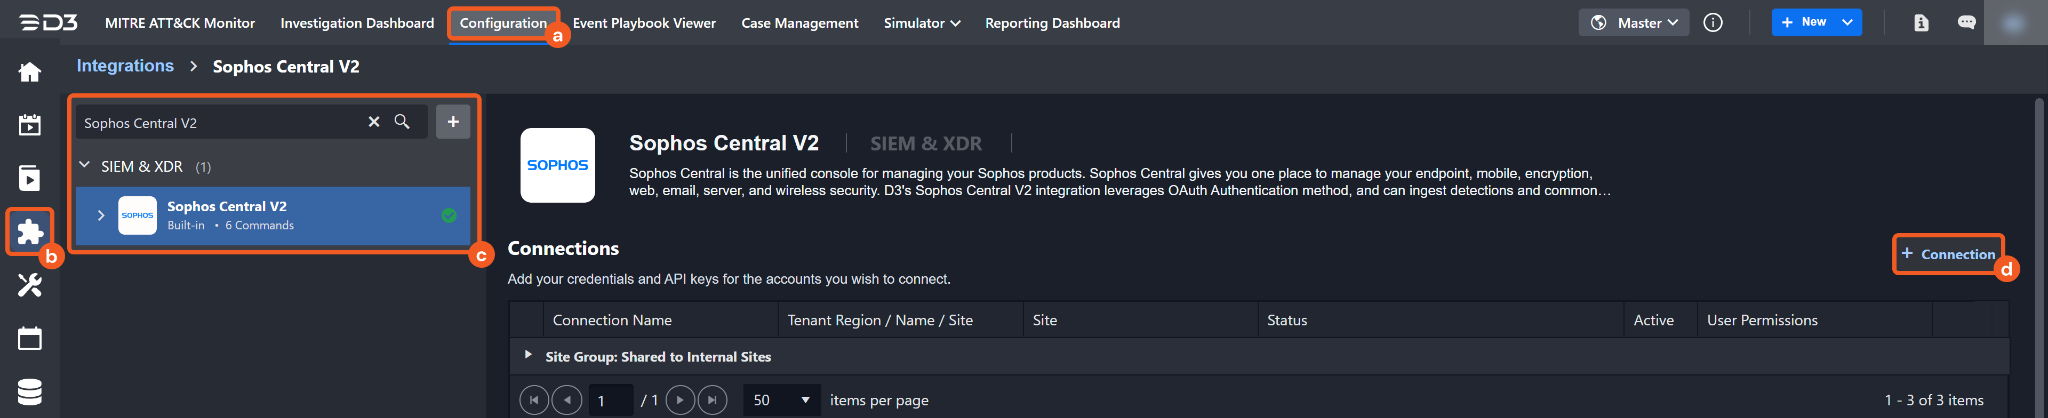
Navigate to Configuration on the top header menu.
Click on the Integration icon on the left sidebar.
Type Sophos Central V2 in the search box to find the integration, then click it to select it.
Click on the + Connection button on the right side of the Connections section. A new connection window will appear.
Configure the following fields to create a connection to Sophos Central V2.
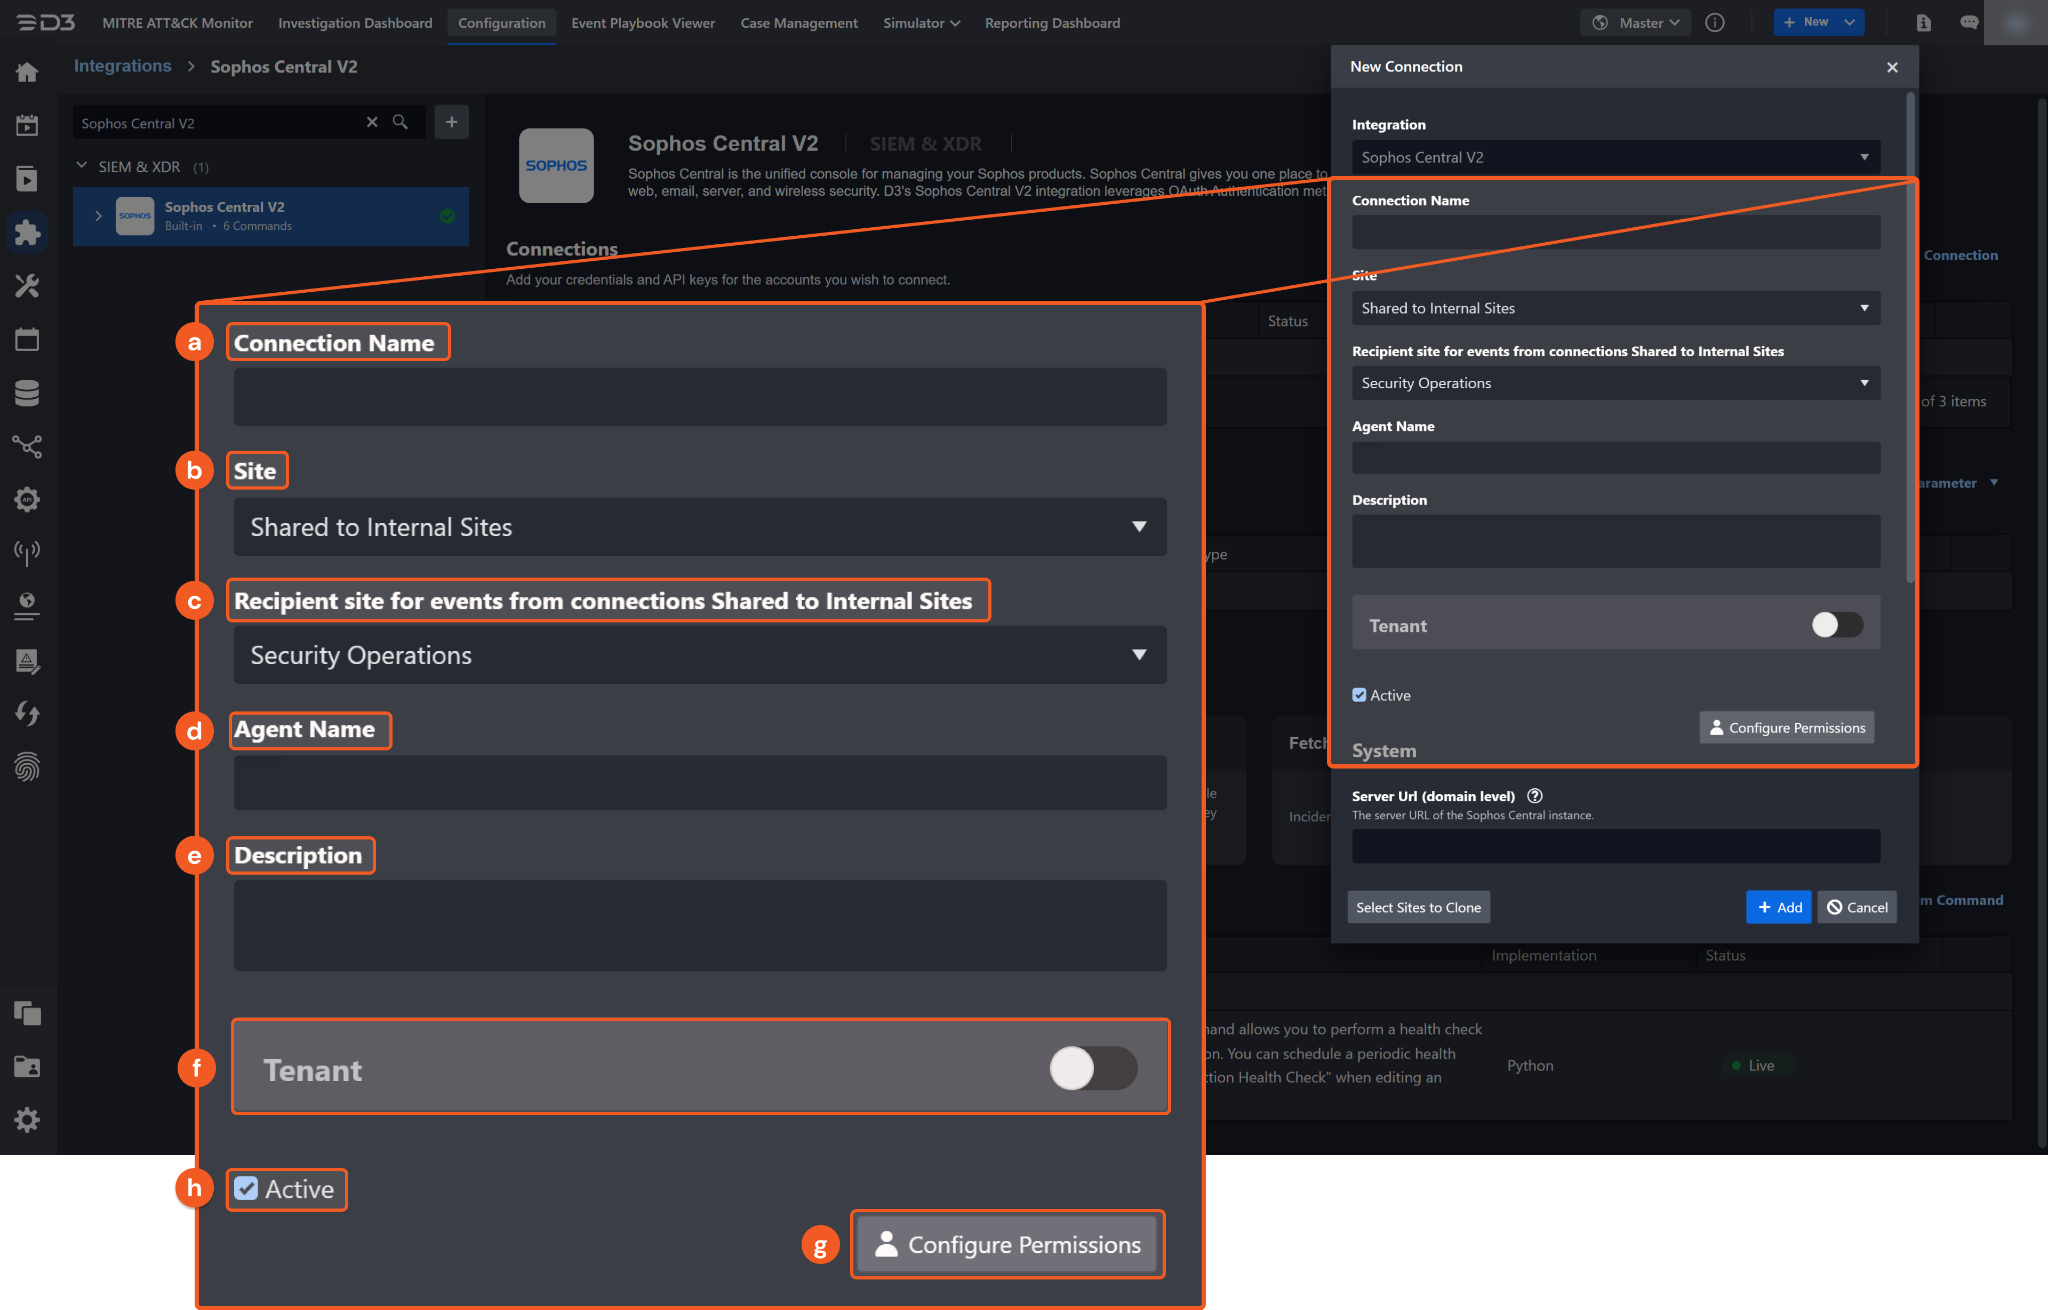
Connection Name: The desired name for the connection.
Site: Specifies the site to use the integration connection. Use the drop-down menu to select the site. The Share to Internal Sites option enables all sites defined as internal sites to use the connection. Selecting a specific site will only enable that site to use the connection.
Recipient site for events from connections Shared to Internal Sites: This field is displayed when Share to Internal Sites is selected for the Site field, allowing selection of the internal site for deploying the integration connection.
Agent Name (Optional): Specifies the proxy agent required to build the connection. Use the dropdown menu to select the proxy agent from a list of previously configured proxy agents.
Description (Optional): Add a description for the connection.
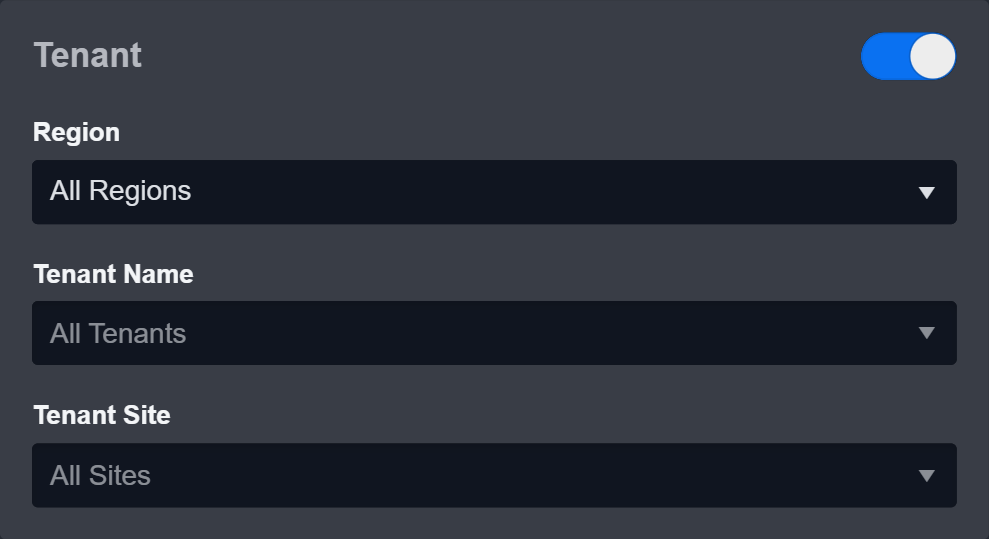
Tenant (Optional): When configuring the connection from a master tenant site, users have the option to choose the specific tenant sites to share the connection with. Once this setting is enabled, users can filter and select the desired tenant sites from the dropdowns to share the connection.
Active: Check the checkbox to ensure the connection is available for use.
Configure User Permissions: Defines which users have access to the connection.
System: This section contains the parameters defined specifically for the integration. These parameters must be configured to create the integration connection.
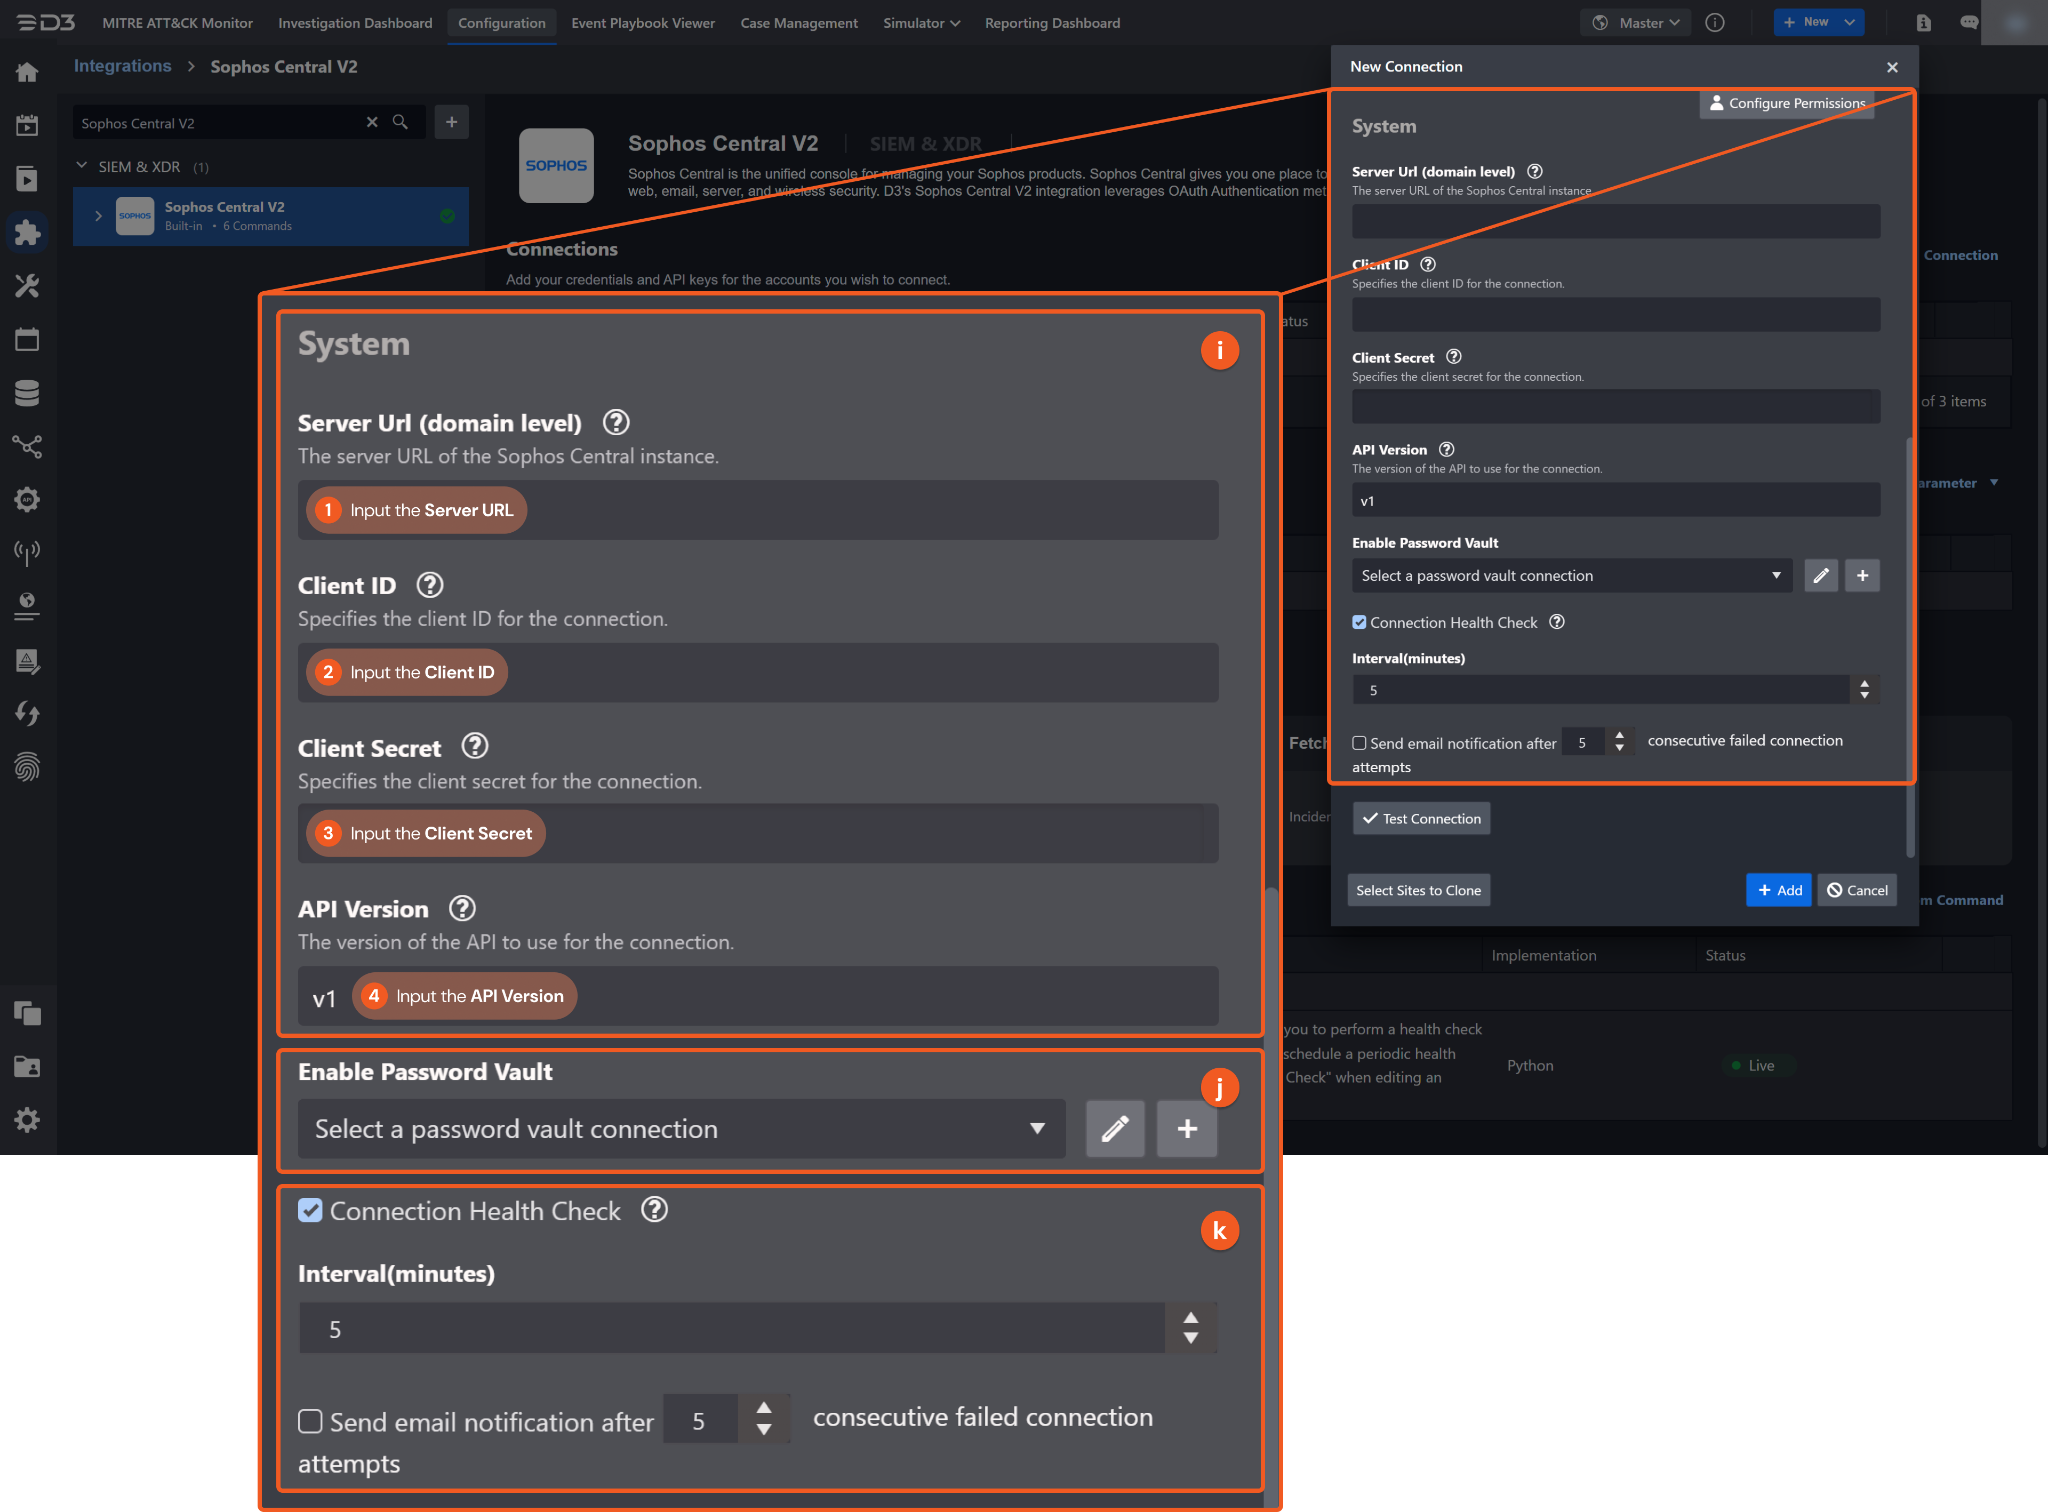
1. Input the Server URL. Refer to step 4 in Retrieving the Server URL.
2. Input the Client ID from the Sophos Central V2 platform. Refer to step 4 of Retrieving the Client ID and Client Secret.
3. Input the Client Secret from the Sophos Central V2 platform. Refer to step 6 of Retrieving the Client ID and Client Secret.
4. Input the API Version. The default value is v1.
Enable Password Vault: An optional feature that allows users to take the stored credentials from their own password vault. Refer to the password vault connection guide if needed.
Connection Health Check: Periodically checks the connection status by scheduling the Test Connection command at the specified interval (in minutes). Available only for active connections, this feature also allows configuring email notifications for failed attempts.
Test the connection.
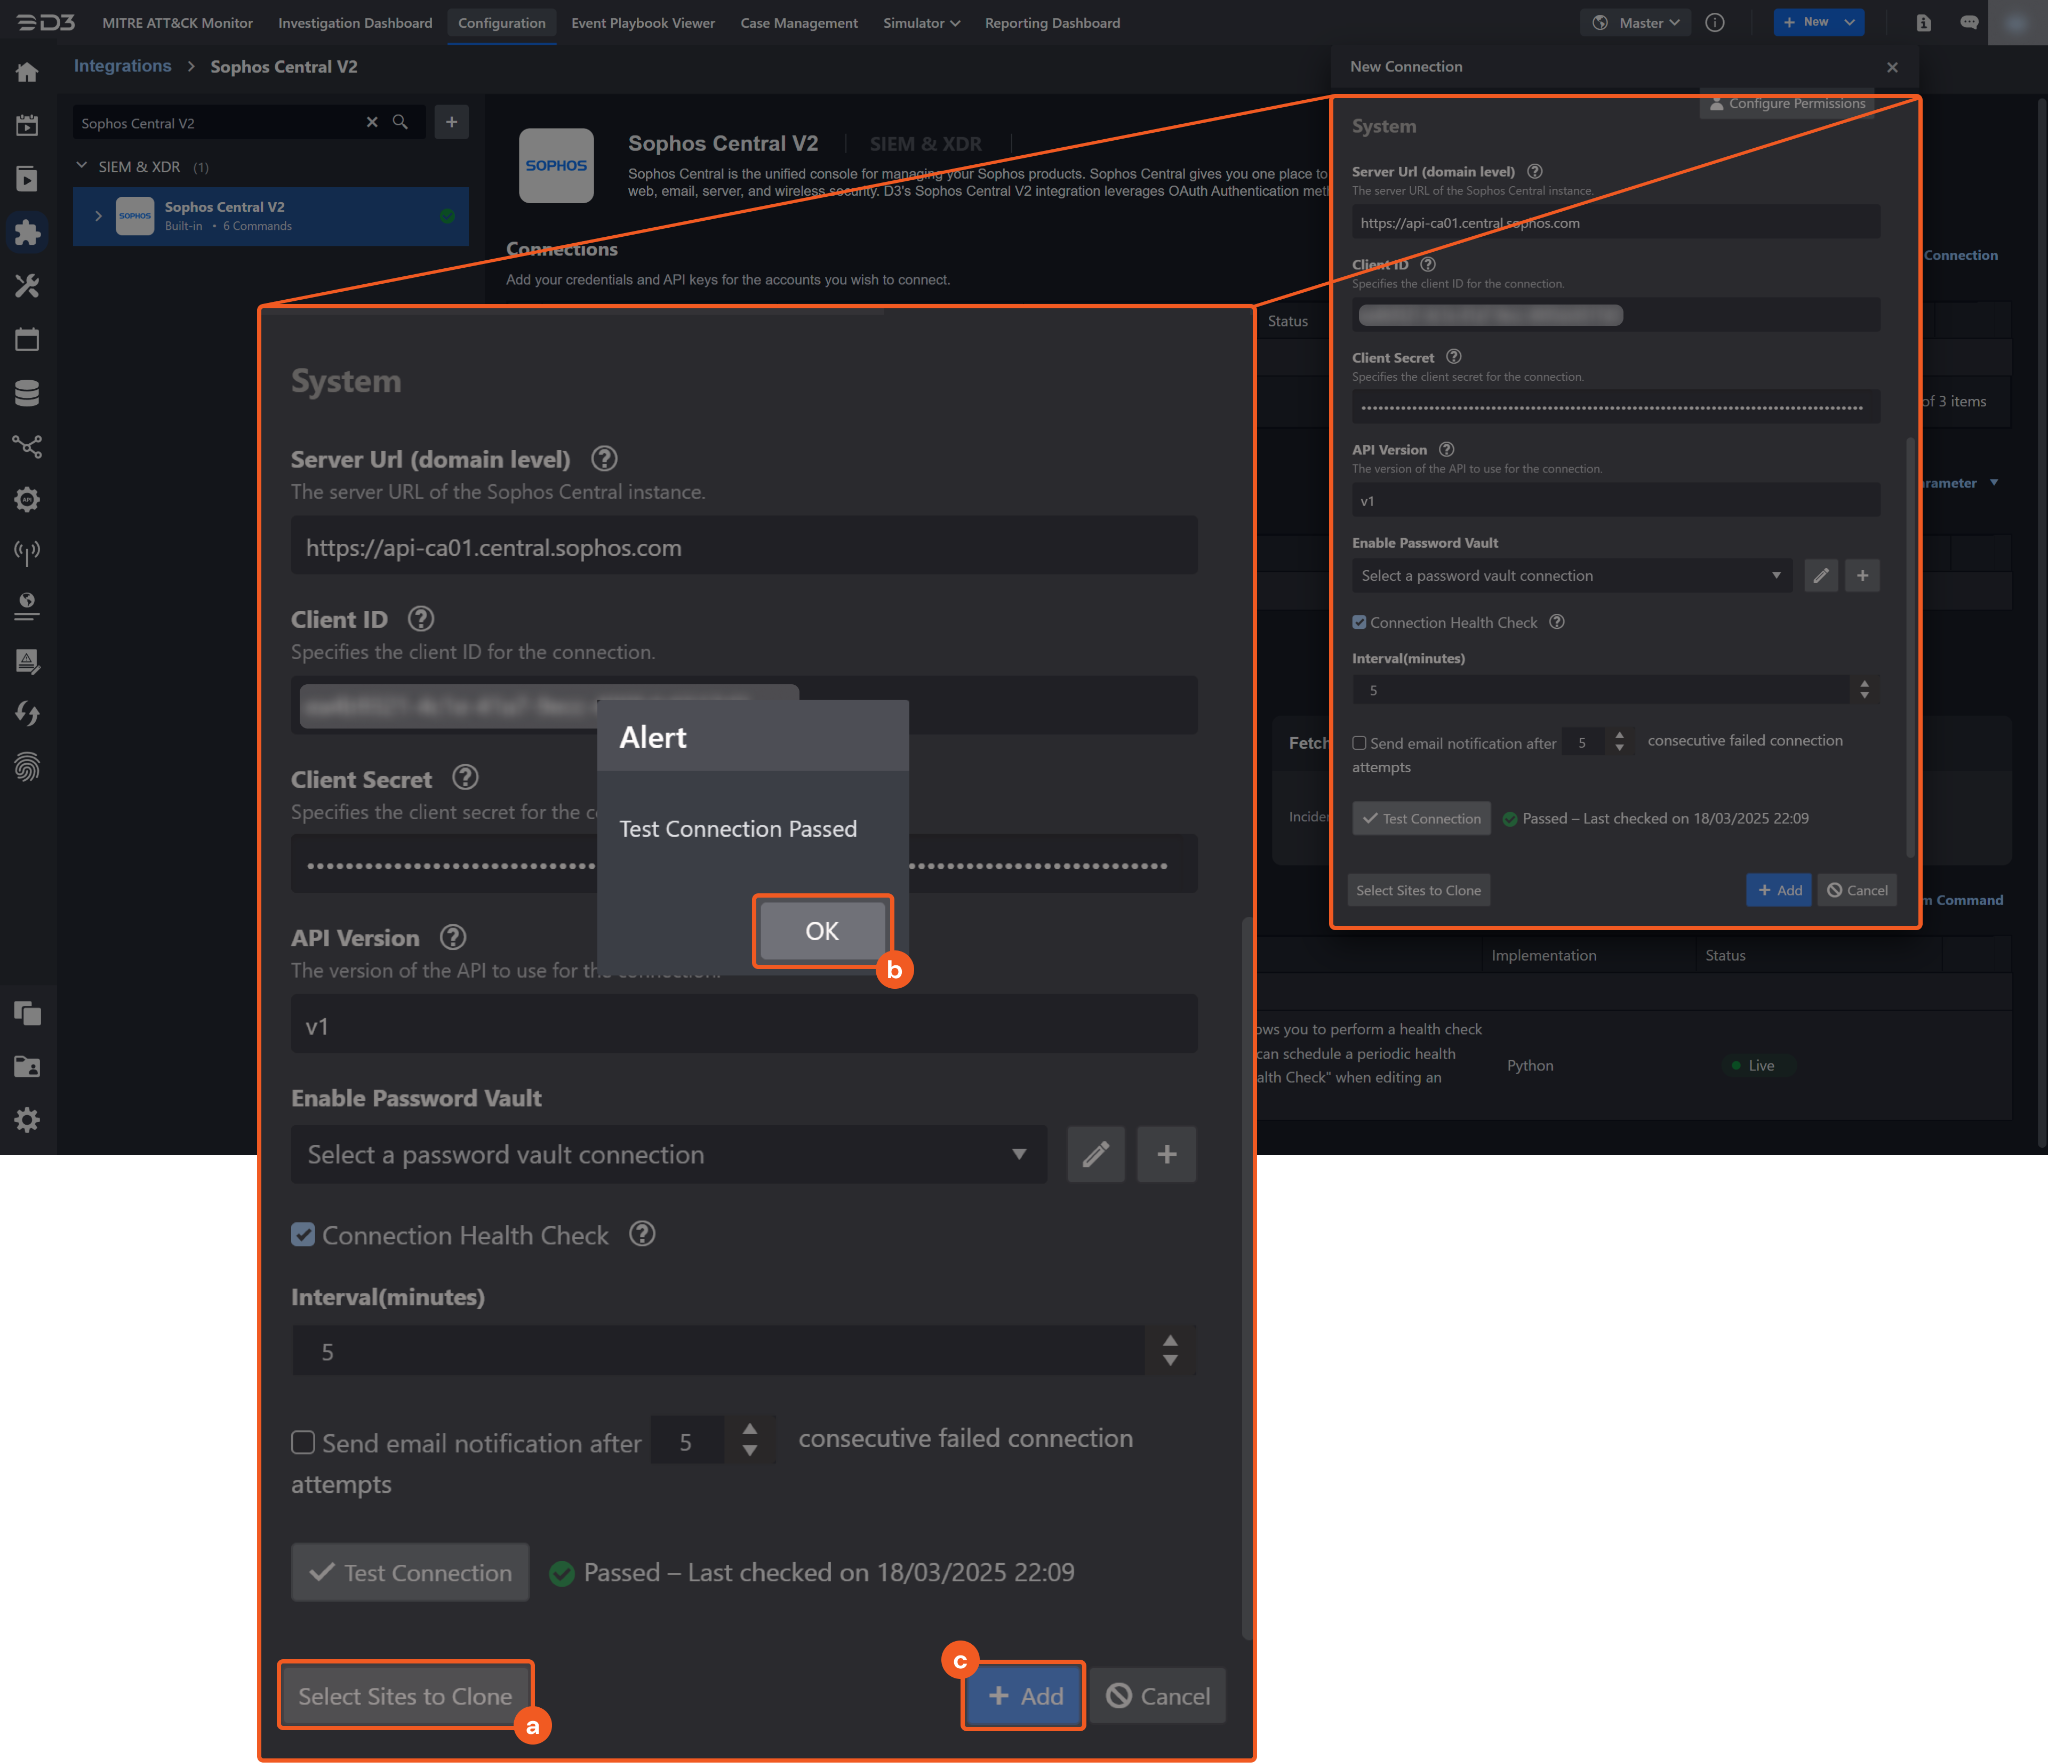
Click on the Test Connection button to verify credentials and connectivity. A success alert displays Passed with a green checkmark. If the connection fails, review the parameters and retry.
Click OK to close the alert window.
Click + Add to create and add the configured connection.
Commands
Sophos Central V2 includes the following executable commands for users to set up schedules or create playbook workflows. With the Test Command function, users can execute these commands independently for playbook troubleshooting.
Integration API Note
For more information about the Sophos Central V2 API, refer to the Sophos Central V2 API reference.
READER NOTE
Certain permissions are required for each command. Refer to the Permission Requirements and Configuring Sophos Central V2 to Work with D3 SOAR sections for details.
Note for Time-related parameters
The input format of time-related parameters may vary based on user account settings, which may cause the sample data in commands to differ from what is displayed. To adjust the time format, follow these steps:
Navigate to Configuration Application Settings. Select Date/Time Format.
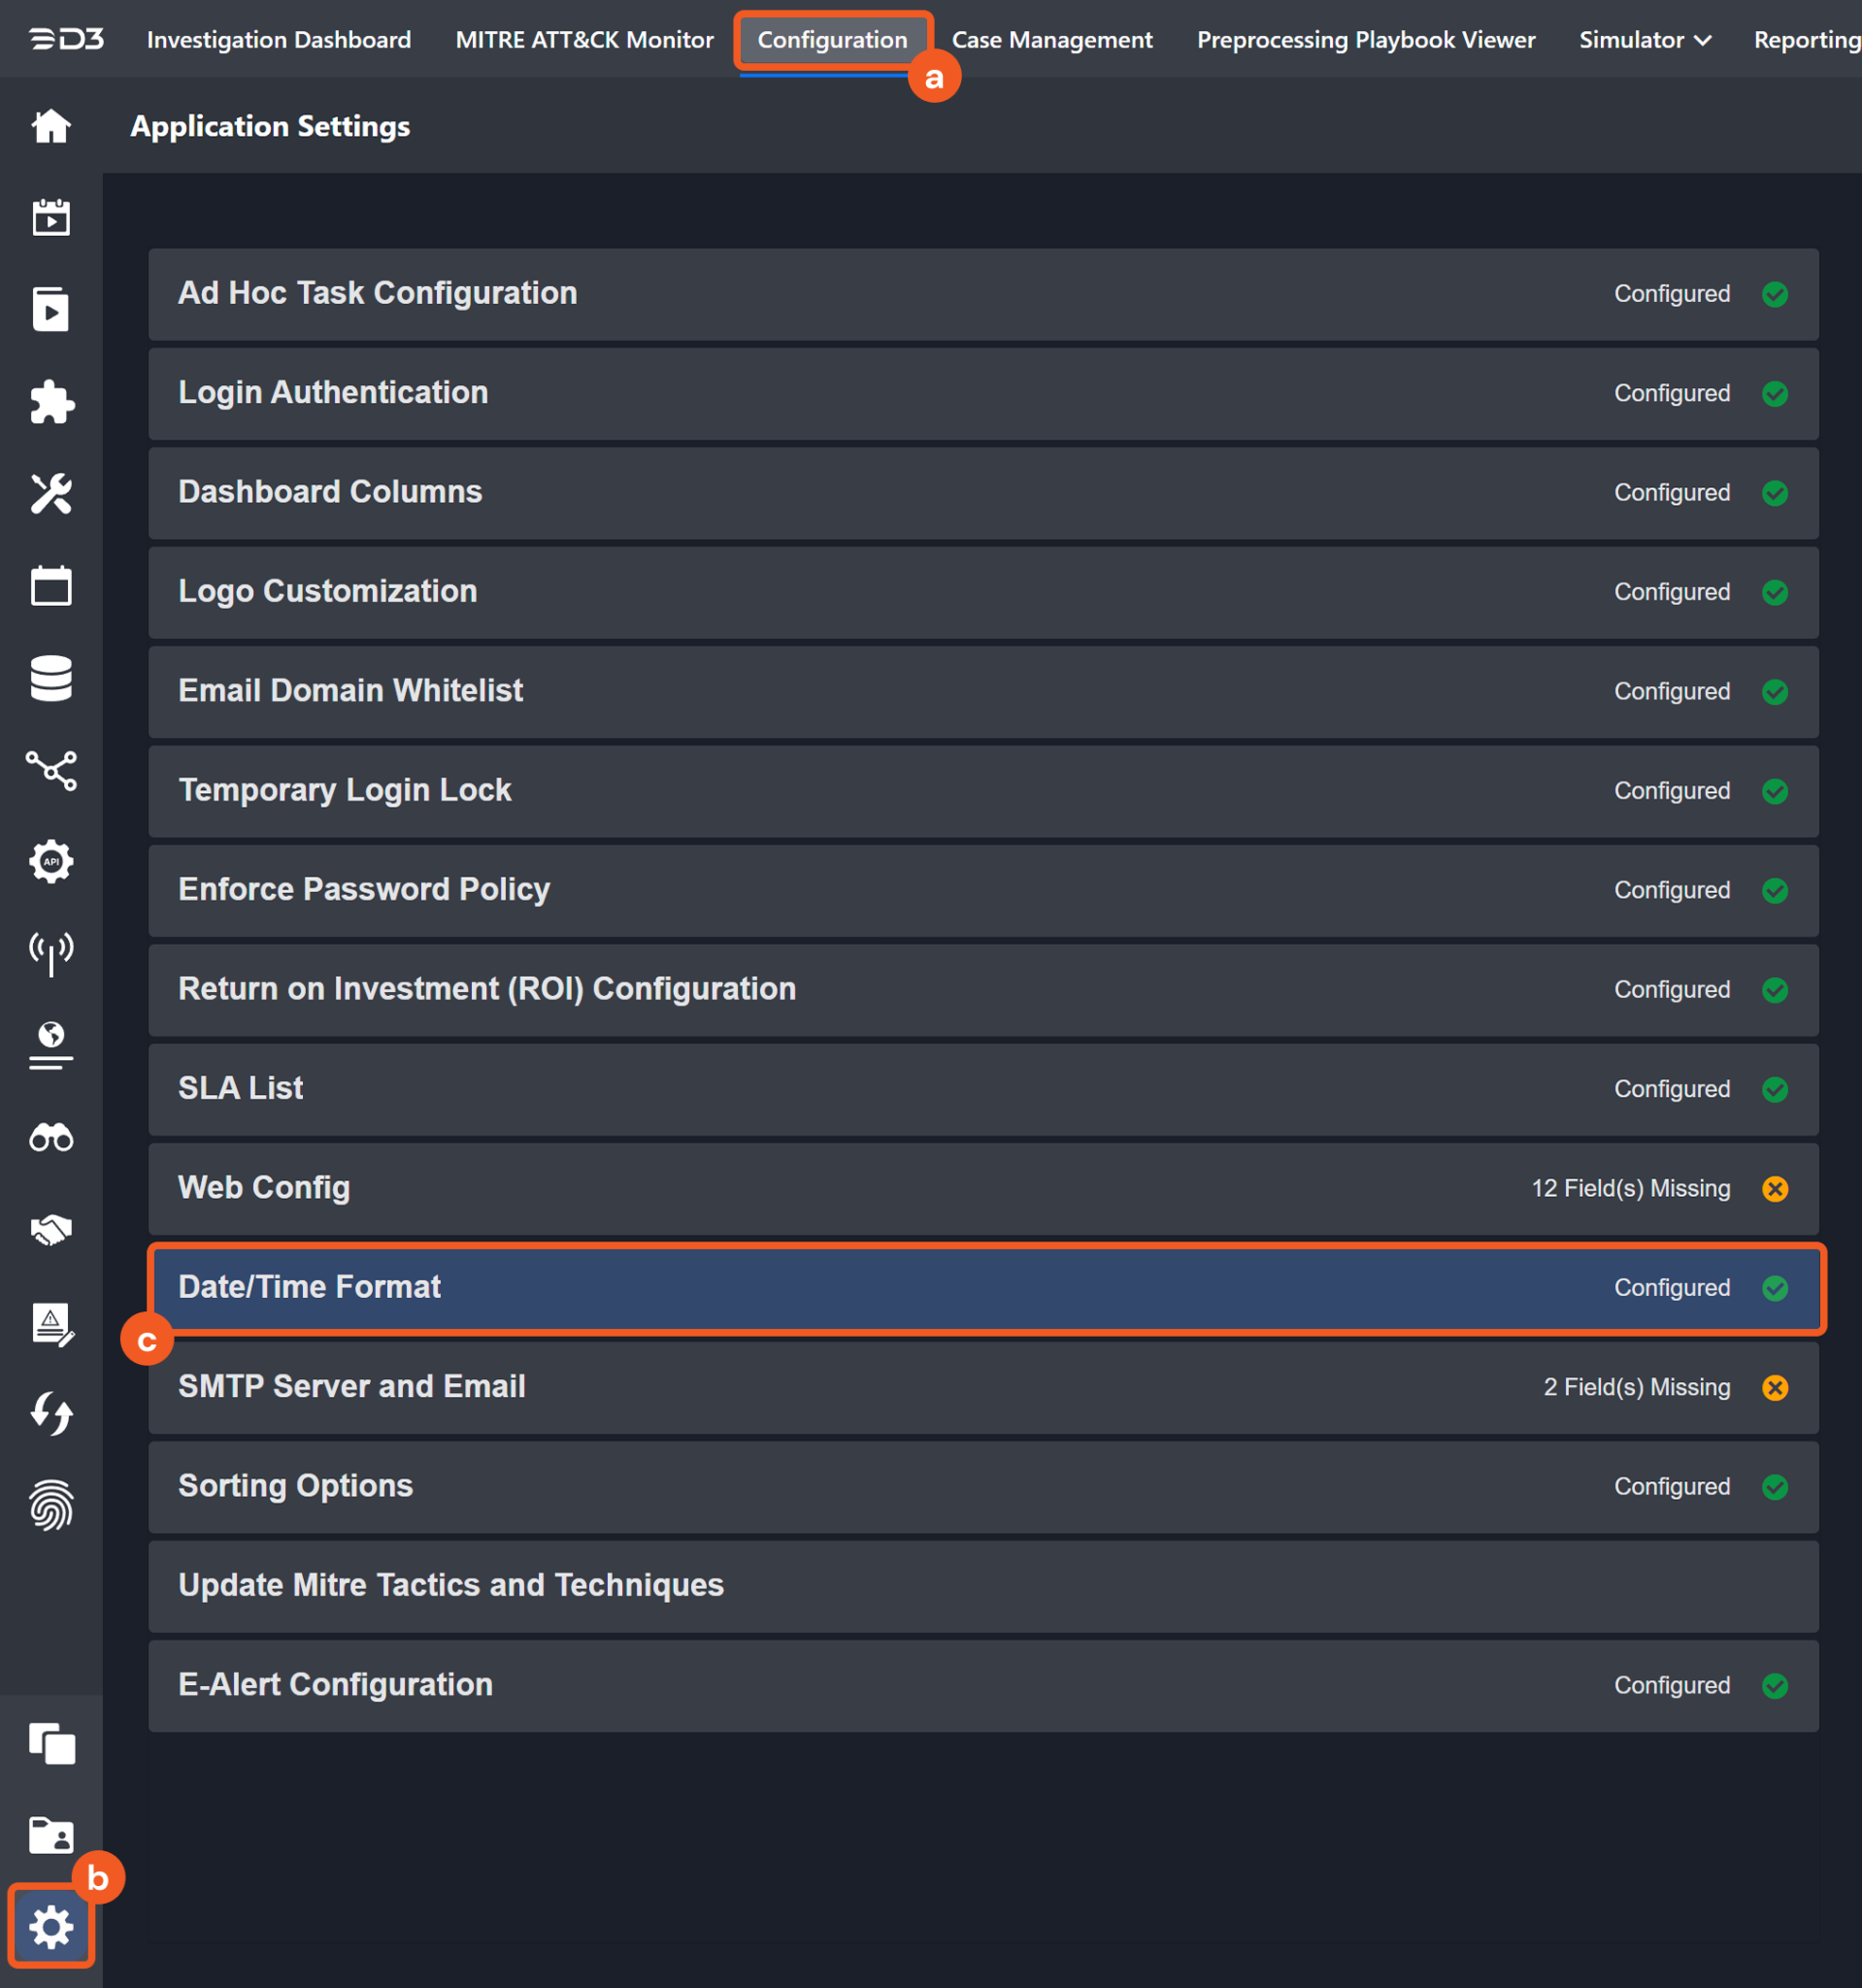
Choose the desired date and time format, then click on the Save button.
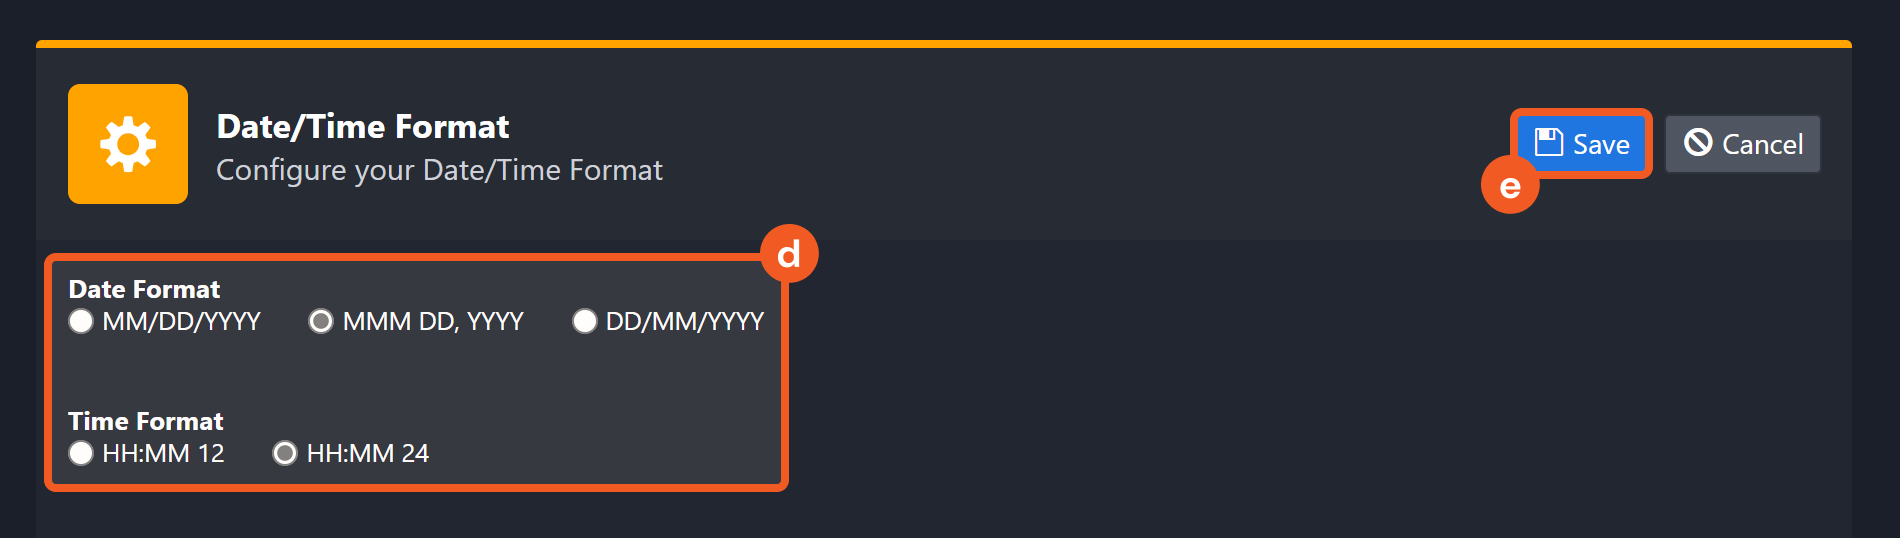
The selected time format will now be visible when configuring Date/Time command input parameters.
Fetch Event
Fetches events (Alerts, Detections or Cases) from the platform based on specified criteria.
Input
Input Parameter | Required/Optional | Description | Example |
Start Time | Required | Sets the start of the time range for fetching events (in UTC, MM/dd/yyyy HH:mm AM|PM). | 09/06/2023 12:00 AM |
End Time | Optional | Sets the end of the time range for fetching events (in UTC, MM/dd/yyyy HH:mm AM|PM). By default, the value is the current time in UTC. | 09/13/2023 12:00 AM |
Event Type | Optional | The type of event to fetch. Available options are:
By default, the value is Detections. | Alerts |
Number of Event(s) Fetched | Optional | The maximum number of events to retrieve. The value must be an integer between 1 and 1000. If not specified or set outside of this range, all events in the defined time range are returned. | 2 |
Alert Severity | Optional | This parameter only applies to events of the Alerts or Cases type. Filters Alerts or Cases by severity. Available options are:
By default, all Alerts or Cases regardless of their severity are returned. | High |
Alert Product Type | Optional | This parameter only applies to events of the Alerts type. Filters alerts by product type. Allowed values are:
Multiple values can be specified, separated by commas. | endpoint,server,wireless |
Alert Category | Optional | This parameter only applies to events of the Alerts type. Filters alerts by category. Allowed values are:
Multiple values can be specified, separated by commas. | applicationControl,runtimeDetections,security |
Detection Filters | Optional | This parameter only applies to events of the Detections type. Filters detections using filter expressions. Refer to Filter Detections | Detections - Sophos Central Admin for more information. | ioc_severity>=5 AND ioc_detection_type='Threat' AND meta_hostname='WIN-05CORDTT4CR' |
Tolerance Scope (Minutes) | Optional | The tolerance scope (in minutes) for the query to retrieve events between the specified Start Time and End Time, accounting for potential delays in Sophos Central's event generation to prevent event loss. When Tolerance Scope is provided, events will be fetched between {Start Time - Tolerance Scope} and {End Time}. | 5 |
Case Types | Optional | This parameter only applies to events of the Cases type. Filters Cases by type. Available Case types are:
By default, all Cases regardless of their type are returned. | ["Investigation", "Incident" ] |
Case Status | Optional | This parameter only applies to events of the Cases type. Filters Cases by status. Available options are:
By default, all Cases regardless of their status are returned. The Action Required status applies only to Sophos-managed cases. | Investigating |
Case Verdict | Optional | This parameter only applies to events of the Cases type. Filter Cases by verdict. Available options are:
By default, all Cases regardless of their verdict are returned. | True Positive |
Case Overview | Optional | This parameter only applies to events of the Cases type. Filters Cases by partial match on their overview. | Test case |
Get Case Detections | Optional | This parameter only applies to events of the Cases type.
By default, the value is False. To retrieve more than 50 detections, use the Get Case Detections command. | True |
Output
To view the sample output data for all commands, refer to this article.
Fetch Event Field Mapping
Fetch Event commands require event field mapping. Field mapping plays a key role for data normalization within the event pipeline. Field mapping converts the original data fields from the different providers to standardized D3 fields as defined by the D3 Model. Refer to Event and Incident Intake Field Mapping for details.
To add a custom field, click on the + Add Field button. Users can also remove built-in field mappings by clicking x. Note that two underscore characters will automatically prefix the defined Field Name as the System Name for a custom field mapping. Additionally, if an input Field Name contains any spaces, they will automatically be replaced with underscores for the corresponding System Name.
As a system integration, the Sophos Central V2 integration has some pre-configured field mappings for default field mapping.
Default Event Source
The Default Event Source is the default set of field mappings that are applied when this fetch event command is executed. For out-of-the-box integrations, users will find a set of field mappings provided by the system. Default event source provides field mappings for common fields from the fetched data. The default event source has a "Main Event JSON Path" (i.e. $.items) that is used to extract a batch of events from the response raw data. View the "Main Event JSON Path" by clicking on the Edit Event Source button.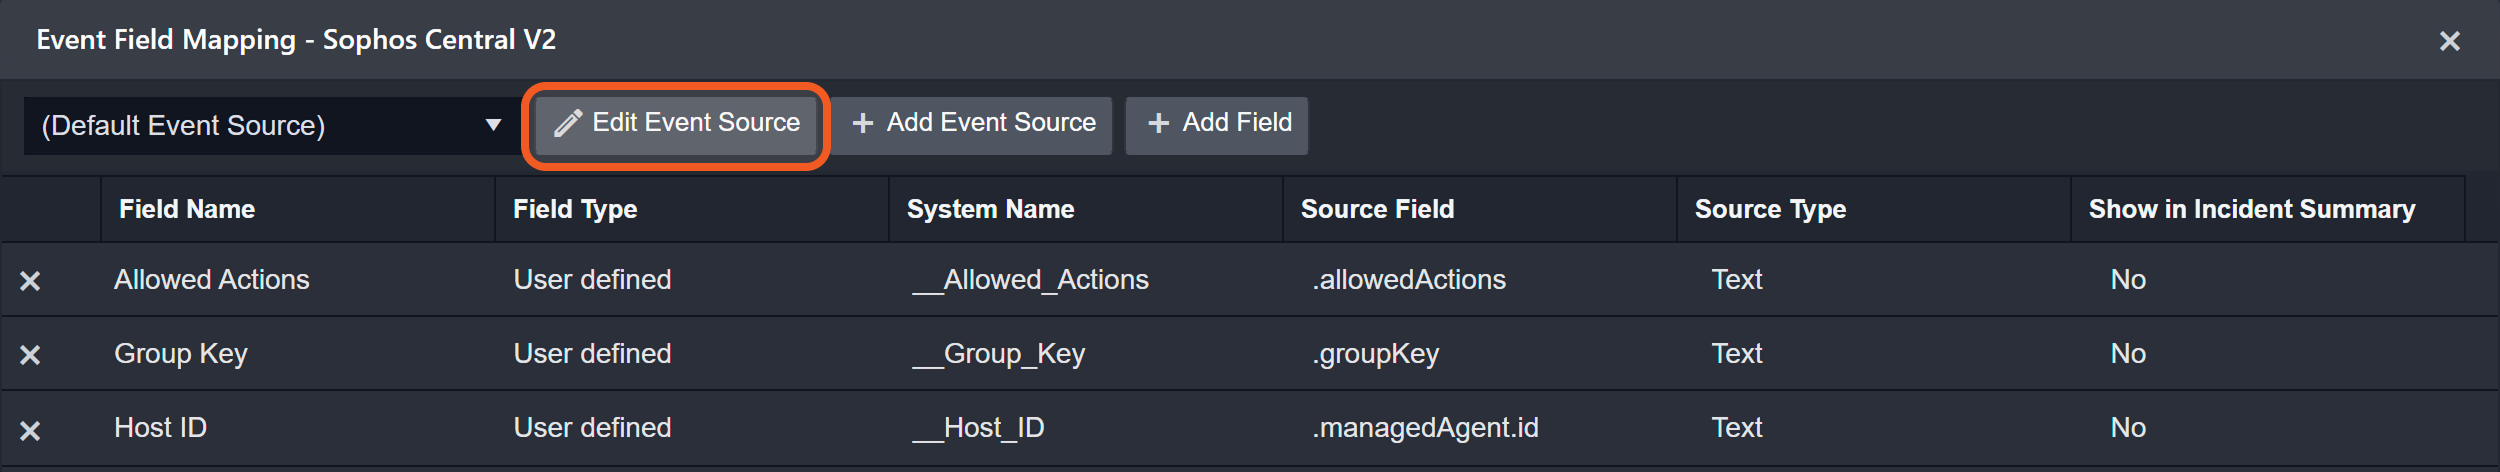
Main Event JSON Path: $.items
The Main Event JSON Path determines the root path where the system starts parsing raw response data into D3 event data. The JSON path begins with $, representing the root element. The path is formed by appending a sequence of child elements to $, each separated by a dot (.). Square brackets with nested quotation marks ([‘...’]) should be used to separate child elements in JSON arrays.
For example, the root node of a JSON Path is items. The child node denoting the Unique Event Key field would be id. Putting it together, the JSON Path expression to extract the Unique Event Key is $.items.id.
The pre-configured field mappings are detailed below:
Field Name | Source Field |
Default | |
Allowed Actions | .allowedActions |
Group Key | .groupKey |
Host ID | .managedAgent.id |
Host Type | .managedAgent.type |
Tenant ID | .tenant.id |
Event category | .category |
Unique Event Key | .id |
Description | .description |
Event Type | .type |
Hostname | .managedAgent.name |
Start Time | .raisedAt |
Severity | .severity |
Detections (Search String: {$.eventType}=detections) | |
Tactics | .ioc_detection_mitre_attack |
Threat type | .threat_type |
Username | .meta_username |
Start Time | .ioc_created_at |
Hostname | .meta_hostname |
Description | .ioc_detection_description |
Operating system | .meta_os_name |
Parent process image path | .process_parent_path |
Parent process ID | .process_parent_sophos_pid |
Parent process name | .process_parent_name |
Process command line | .process_cmd_line |
Process file path | .process_path |
Process Hash SHA256 | .process_sha256 |
Process ID | .sophos_pid |
Process Name | .process_name |
Rule name | .ioc_detection_id |
Severity | .ioc_severity |
Event name | .detection_name |
Event Type | .ioc_detection_type |
Event category | .ioc_detection_category |
Event code | .detection_identifier |
Threat Source | .threat_source |
Device IP address | .meta_ip_address |
Device MAC address | .meta_mac_address |
Host Type | .meta_endpoint_type |
Machine Learning Score | .process_ml_score |
Region | .meta_public_ip_state |
Reputation Score | .process_sha256_reputation_score |
Attack Type | .ioc_attack_type |
City | .meta_public_ip_city |
Country | .meta_public_ip_country |
Detection Attack | .ioc_detection_attack |
Cases (Search String: {$.eventType}=cases) | |
Event code | .id |
Event Type | .type |
Severity | .severity |
Start Time | .createdAt |
Tenant ID | .tenant.id |
Status | .status |
Event name | .name |
Aggregated / Correlated Event count | .detectionCount |
Assignee | .assignee.name |
Verdict | .verdict |
Description | .overview |
Escalated | .escalated |
Initial Detection ID | .initialDetection.id |
Sub Event | .Detections |
Updated Time | .updatedAt |
Detection Tactics | .Detections[*].detectionAttack |
Tactics | .initialDetection.mitreAttacks[*].tactic.id |
Techniques | .initialDetection.mitreAttacks[*].tactic.techniques[*].id |
Error Handling
If the Return Data displays Failed, an Error tab will appear in the Test Result window.
The error tab contains the details responded from D3 SOAR or third-party API calls, including Failure Indicator, Status Code, and Message. This can help locate the root cause of a command failure.
Parts in Error | Description | Example |
Failure Indicator | Indicates the command failure that happened at a specific input and/or API call. | Fetch Event failed. |
Status Code | The response code issued by the third-party API server or the D3 SOAR system that can be used to locate the corresponding error category. For example, if the returned status code is 401, the selected connection is unauthorized to run the command. The user or system support would need to check the permission setting in the Sophos Central V2 portal. Refer to the HTTP Status Code Registry for details. | Status Code: 400. |
Message | The raw data or captured key error message from the integration API server about the API request failure. | Message: Invalid operation due to Query execution FAILED (Query failed (#*****): line 9:7: Column '*****' cannot be resolved). |
Error Sample Data Fetch Event failed. Status Code: 400. Message: Invalid operation due to Query execution FAILED (Query failed (#*****): line 9:7: Column '*****' cannot be resolved). |
Get Case Detections
Retrieves all detections of the specified cases.
READER NOTE
Case IDs is a required parameter to run this command.
Run the Fetch Event command with Event Type set to Cases to obtain the Case IDs. Case IDs can be found in the raw data at the path $.items[*].id.
Input
Input Parameter | Required/Optional | Description | Example |
Case IDs | Required | The IDs of the Cases for which to retrieve detections. Case IDs can be obtained using the Fetch Event command, with Event Type set to Cases. |
JSON
|
Output
To view the sample output data for all commands, refer to this article.
Error Handling
If the Return Data displays Partially Successful or Failed, an Error tab will appear in the Test Result window.
The error tab contains the details responded from D3 SOAR or third-party API calls, including Failure Indicator, Status Code, and Message. This can help locate the root cause of a command failure.
Parts in Error | Description | Example |
Failure Indicator | Indicates the command failure that happened at a specific input and/or API call. | Get Case Detections failed. |
Status Code | The response code issued by the third-party API server or the D3 SOAR system that can be used to locate the corresponding error category. For example, if the returned status code is 401, the selected connection is unauthorized to run the command. The user or system support would need to check the permission setting in the Sophos Central V2 portal. Refer to the HTTP Status Code Registry for details. | Status Code: 400. |
Message | The raw data or captured key error message from the integration API server about the API request failure. | Message: Bad request. |
Error Sample Data Get Case Detections failed. Status Code: 400. Message: Bad request. |
Get Case Impacted Entities
Retrieves impacted entities for the specified Cases.
READER NOTE
Case IDs is a required parameter to run this command.
Run the Fetch Event command with Event Type set to Cases to obtain the Case IDs. Case IDs can be found in the raw data at the path $.items[*].id.
Detection Rule and Detection ID are optional parameters to run this command.
Run the Get Case Detections command to obtain the Detection Rule. Detection Rules can be found in the raw data at the path $.Results[*].items[*].detectionRule.
Run the Get Case Detections command to obtain the Detection ID. Detection IDs can be found in the raw data at the path $.Results[*].items[*].id.
Input
Input Parameter | Required/Optional | Description | Example |
Case IDs | Required | The IDs of the Cases for which to retrieve impacted entities. Case IDs can be obtained using the Fetch Event command, with Event Type set to Cases. |
JSON
|
Entity Type | Optional | This parameter applies to all specified Case IDs. Filters impacted entities by entity type. Available options are:
By default, all impacted entities regardless of their type are returned. | Device |
Entity Name | Optional | This parameter applies to all specified Case IDs. Filters impacted entities by full or partial entity name. | lab2-pc2 |
Detection Rule | Optional | This parameter applies to all specified Case IDs. Filters impacted entities by full or partial detection rule name. Detection Rule names can be obtained using the Get Case Detections command. | WIN-EVA-PRC-MAVINJECT-RUNNING-1 |
Detection ID | Optional | This parameter applies to all specified Case IDs. Filters impacted entities by full or partial detection ID. Detection ID can be obtained using the Get Case Detections command. | ***** |
Output
To view the sample output data for all commands, refer to this article.
Error Handling
If the Return Data displays Partially Successful or Failed, an Error tab will appear in the Test Result window.
The error tab contains the details responded from D3 SOAR or third-party API calls, including Failure Indicator, Status Code, and Message. This can help locate the root cause of a command failure.
Parts in Error | Description | Example |
Failure Indicator | Indicates the command failure that happened at a specific input and/or API call. | Get Case Impacted Entities failed. |
Status Code | The response code issued by the third-party API server or the D3 SOAR system that can be used to locate the corresponding error category. For example, if the returned status code is 401, the selected connection is unauthorized to run the command. The user or system support would need to check the permission setting in the Sophos Central V2 portal. Refer to the HTTP Status Code Registry for details. | Status Code: 400. |
Message | The raw data or captured key error message from the integration API server about the API request failure. | Message: Bad request. |
Error Sample Data Get Case Impacted Entities failed. Status Code: 400. Message: Bad request. |
Get Case Mitre Attack
Retrieves a summary of MITRE ATT&CK Tactics and Techniques for the specified Cases.
READER NOTE
Case IDs is a required parameter to run this command.
Run the Fetch Event command with Event Type set to Cases to obtain the Case IDs. Case IDs can be found in the raw data at the path $.items[*].id.
Input
Input Parameter | Required/Optional | Description | Example |
Case IDs | Required | The IDs of the Cases for which to retrieve the MITRE ATT&CK summary. Case IDs can be obtained using the Fetch Event command with Event Type set to Cases. |
JSON
|
Output
To view the sample output data for all commands, refer to this article.
Error Handling
If the Return Data displays Partially Successful or Failed, an Error tab will appear in the Test Result window.
The error tab contains the details responded from D3 SOAR or third-party API calls, including Failure Indicator, Status Code, and Message. This can help locate the root cause of a command failure.
Parts in Error | Description | Example |
Failure Indicator | Indicates the command failure that happened at a specific input and/or API call. | Get Case Mitre Attack failed. |
Status Code | The response code issued by the third-party API server or the D3 SOAR system that can be used to locate the corresponding error category. For example, if the returned status code is 401, the selected connection is unauthorized to run the command. The user or system support would need to check the permission setting in the Sophos Central V2 portal. Refer to the HTTP Status Code Registry for details. | Status Code: 400. |
Message | The raw data or captured key error message from the integration API server about the API request failure. | Message: Bad request. |
Error Sample Data Get Case Mitre Attack failed. Status Code: 400. Message: Bad request. |
Update Cases
Update the specified Cases.
READER NOTE
Case IDs is a required parameter to run this command.
Run the Fetch Event command with Event Type set to Cases to obtain the Case IDs. Case IDs can be found in the raw data at the path $.items[*].id.
Input
Input Parameter | Required/Optional | Description | Example |
Case IDs | Required | The IDs of the Cases to update. Case IDs can be obtained using the Fetch Event command, with Event Type set to Cases. |
JSON
|
Case Name | Optional | The new name of the Cases. | test2 |
Case Severity | Optional | The updated severity of the Cases. Available options are:
| High |
Case Status | Optional | The updated status of the Cases. Available options are:
The Action Required status applies only to Sophos-managed cases. | On Hold |
Case Summary | Optional | The updated overview of the Cases. | test2 description |
Assignee Email | Optional | The email address of the person assigned to the Cases. The email address must belong to a valid user. |
Output
To view the sample output data for all commands, refer to this article.
Error Handling
If the Return Data displays Partially Successful or Failed, an Error tab will appear in the Test Result window.
The error tab contains the details responded from D3 SOAR or third-party API calls, including Failure Indicator, Status Code, and Message. This can help locate the root cause of a command failure.
Parts in Error | Description | Example |
Failure Indicator | Indicates the command failure that happened at a specific input and/or API call. | Update Cases failed. |
Status Code | The response code issued by the third-party API server or the D3 SOAR system that can be used to locate the corresponding error category. For example, if the returned status code is 401, the selected connection is unauthorized to run the command. The user or system support would need to check the permission setting in the Sophos Central V2 portal. Refer to the HTTP Status Code Registry for details. | Status Code: 400. |
Message | The raw data or captured key error message from the integration API server about the API request failure. | Message: Bad request. |
Error Sample Data Update Cases failed. Status Code: 400. Message: Bad request. |
Test Connection
Allows users to perform a health check on an integration connection. Users can schedule a periodic health check by selecting Connection Health Check when editing an integration connection.
Input
N/A
Output
Output Type | Description | Return Data Type |
Return Data | Indicates one of the possible command execution states: Successful or Failed. The Failed state can be triggered by any of the following errors:
More details about an error can be viewed in the Error tab. | String |
Error Handling
If the Return Data displays Failed, an Error tab will appear in the Test Result window.
The error tab contains the details responded from D3 SOAR or third-party API calls, including Failure Indicator, Status Code, and Message. This can help locate the root cause of a command failure.
Parts in Error | Description | Example |
Failure Indicator | Indicates the command failure that happened at a specific input and/or API call. | Test Connection failed. Failed to check the connector. |
Status Code | The response code issued by the third-party API server or the D3 SOAR system that can be used to locate the corresponding error category. For example, if the returned status code is 401, the selected connection is unauthorized to run the command. The user or system support would need to check the permission setting in the Sophos Central V2 portal. Refer to the HTTP Status Code Registry for details. | Status Code: 401. |
Message | The raw data or captured key error message from the integration API server about the API request failure. | Message: Unauthorized. |
Error Sample Data Test Connection failed. Failed to check the connector. Status Code: 401. Message: Unauthorized. |