
Prisma Cloud
LAST UPDATED: AUG 5, 2025
Overview
Prisma Cloud provides comprehensive visibility and threat detection across an organization's hybrid, multi-cloud infrastructure.
D3 SOAR is providing REST operations to function with Prisma Cloud.
Prisma Cloud is available for use in:
Known Limitations
Prisma Cloud APIs use rate limiting to protect service performance and availability. Rate limiting is enforced on the following API metrics:
Request Rate Limit: Number of individual requests allowed in a given duration (usually seconds) by the endpoint.
Burst Rate: Maximum number of concurrent requests allowed in one second.
Prisma Cloud APIs enforce the applicable rate limits on a per-user basis using a key generated from the user’s authentication token in API requests. If a user has multiple authentication tokens, the limits apply to the user and not to the discrete authentication tokens.
The following rate limits apply:
Command | Limit |
Fetch Event |
|
Get Alert Details |
|
Test Connection |
|
Connection
To connect to Prisma Cloud from D3 SOAR, follow this part to collect the required information below:
Parameter | Description | Example |
Server URL | The server URL of the Prisma Cloud server at the domain level. For example, If the Prisma Cloud tenant is https://app2.prismacloud.io, then https://api2.prismacloud.io must be used as the API server URL. | https://api.prismacloud.io |
Access Key ID | The API access key ID obtained from the Prisma Cloud UI. | ***** |
Secret Key | The API secret key obtained from the Prisma Cloud UI. | ***** |
Configuring Prisma Cloud to Work with D3 SOAR
Refer to Create and Manage Access Keys | Prisma Cloud TechDocs for information on retrieving the Access Key ID and Secret Key.
Configuring D3 SOAR to Work with Prisma Cloud
Log in to D3 SOAR.
Find the Prisma Cloud integration.
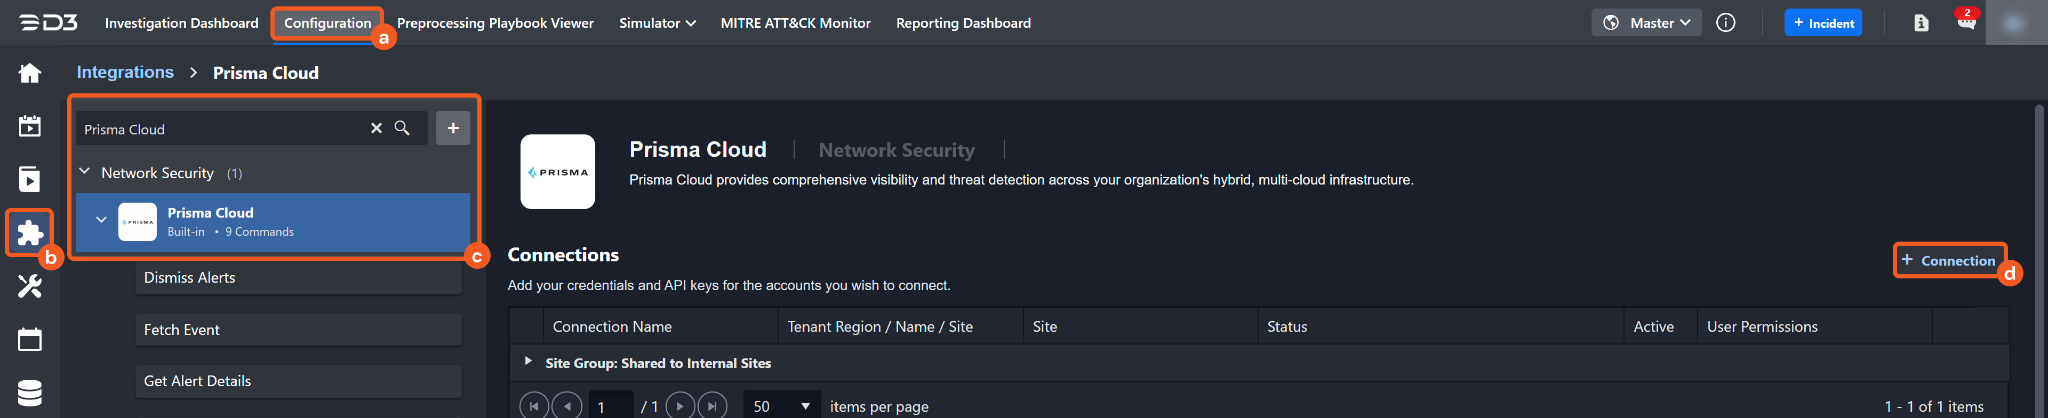
Navigate to Configuration on the top header menu.
Click on the Integration icon on the left sidebar.
Type Prisma Cloud in the search box to find the integration, then click it to select it.
Click on the + Connection button on the right side of the Connections section. A new connection window will appear.
Configure the following fields to create a connection to Prisma Cloud.
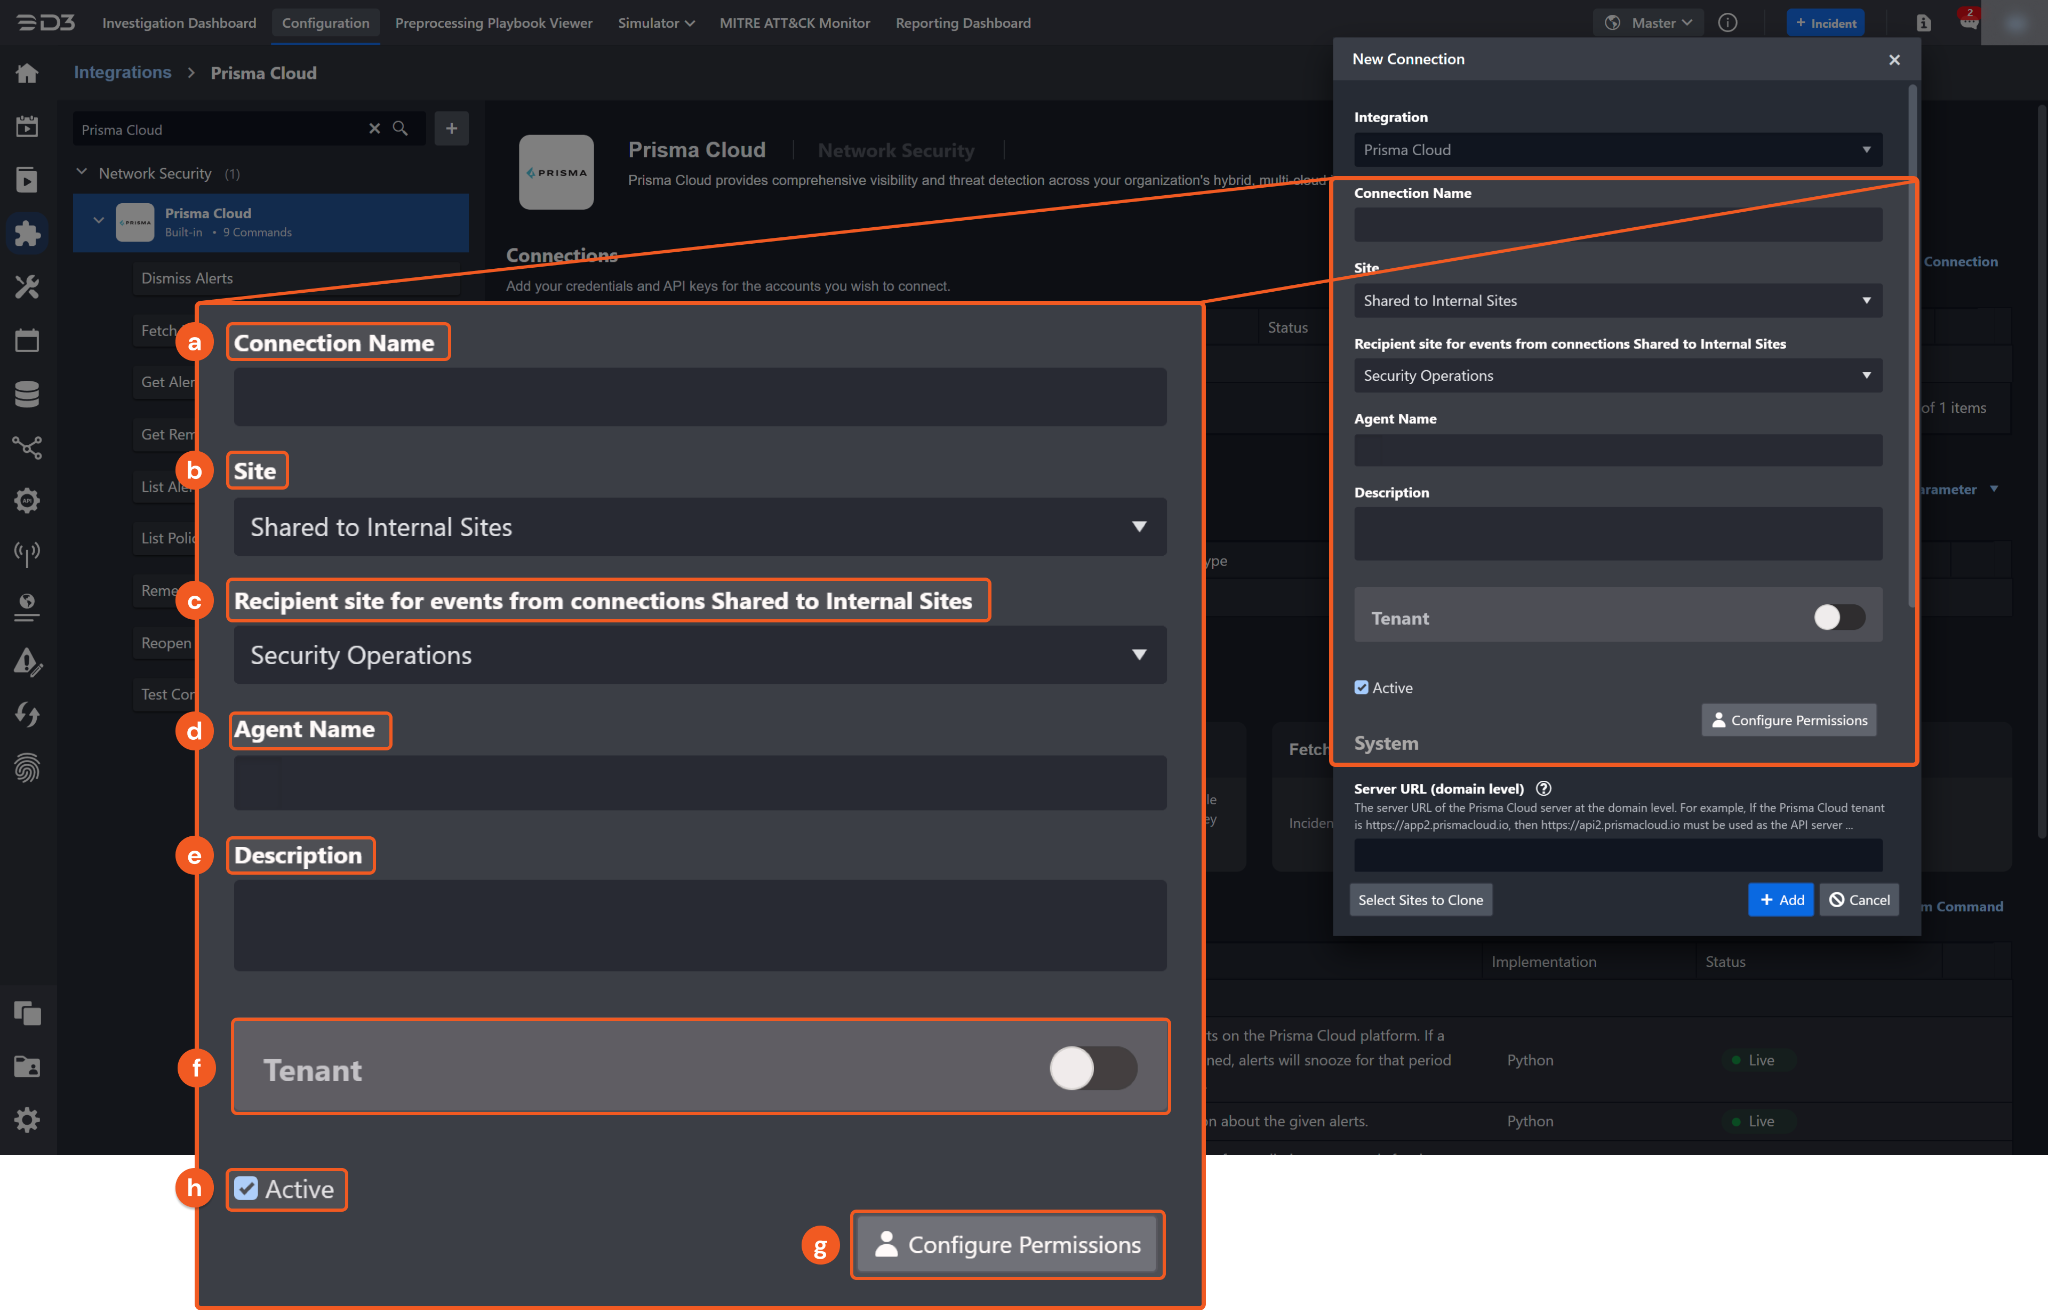
Connection Name: The desired name for the connection.
Site: Specifies the site to use the integration connection. Use the drop-down menu to select the site. The Share to Internal Sites option enables all sites defined as internal sites to use the connection. Selecting a specific site will only enable that site to use the connection.
Recipient site for events from connections Shared to Internal Sites: This field is displayed when Share to Internal Sites is selected for the Site field, allowing selection of the internal site for deploying the integration connection.
Agent Name (Optional): Specifies the proxy agent required to build the connection. Use the dropdown menu to select the proxy agent from a list of previously configured proxy agents.
Description (Optional): Add a description for the connection.
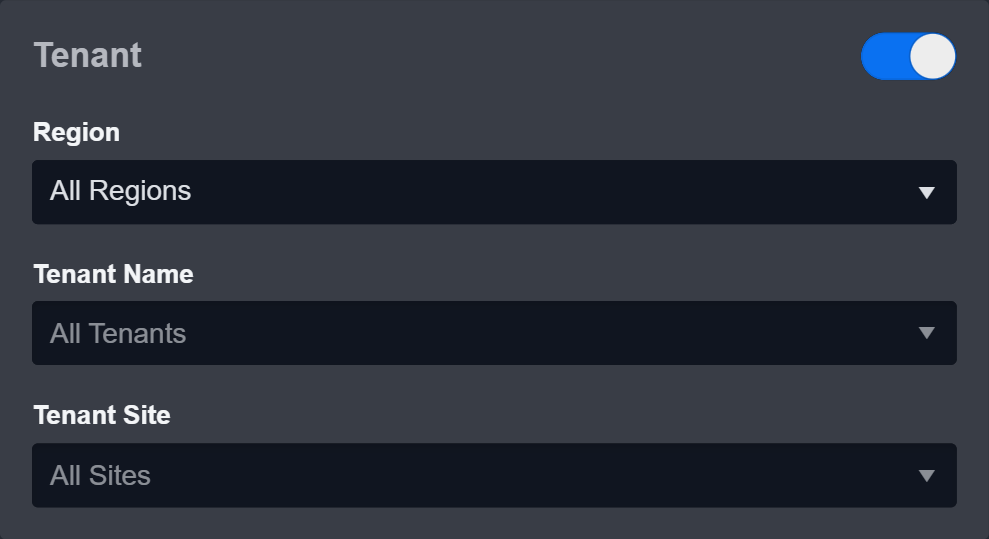
Tenant (Optional): When configuring the connection from a master tenant site, users have the option to choose the specific tenant sites to share the connection with. Once this setting is enabled, users can filter and select the desired tenant sites from the dropdowns to share the connection.
Configure User Permissions: Defines which users have access to the connection.
Active: Check the checkbox to ensure the connection is available for use.
System: This section contains the parameters defined specifically for the integration. These parameters must be configured to create the integration connection.
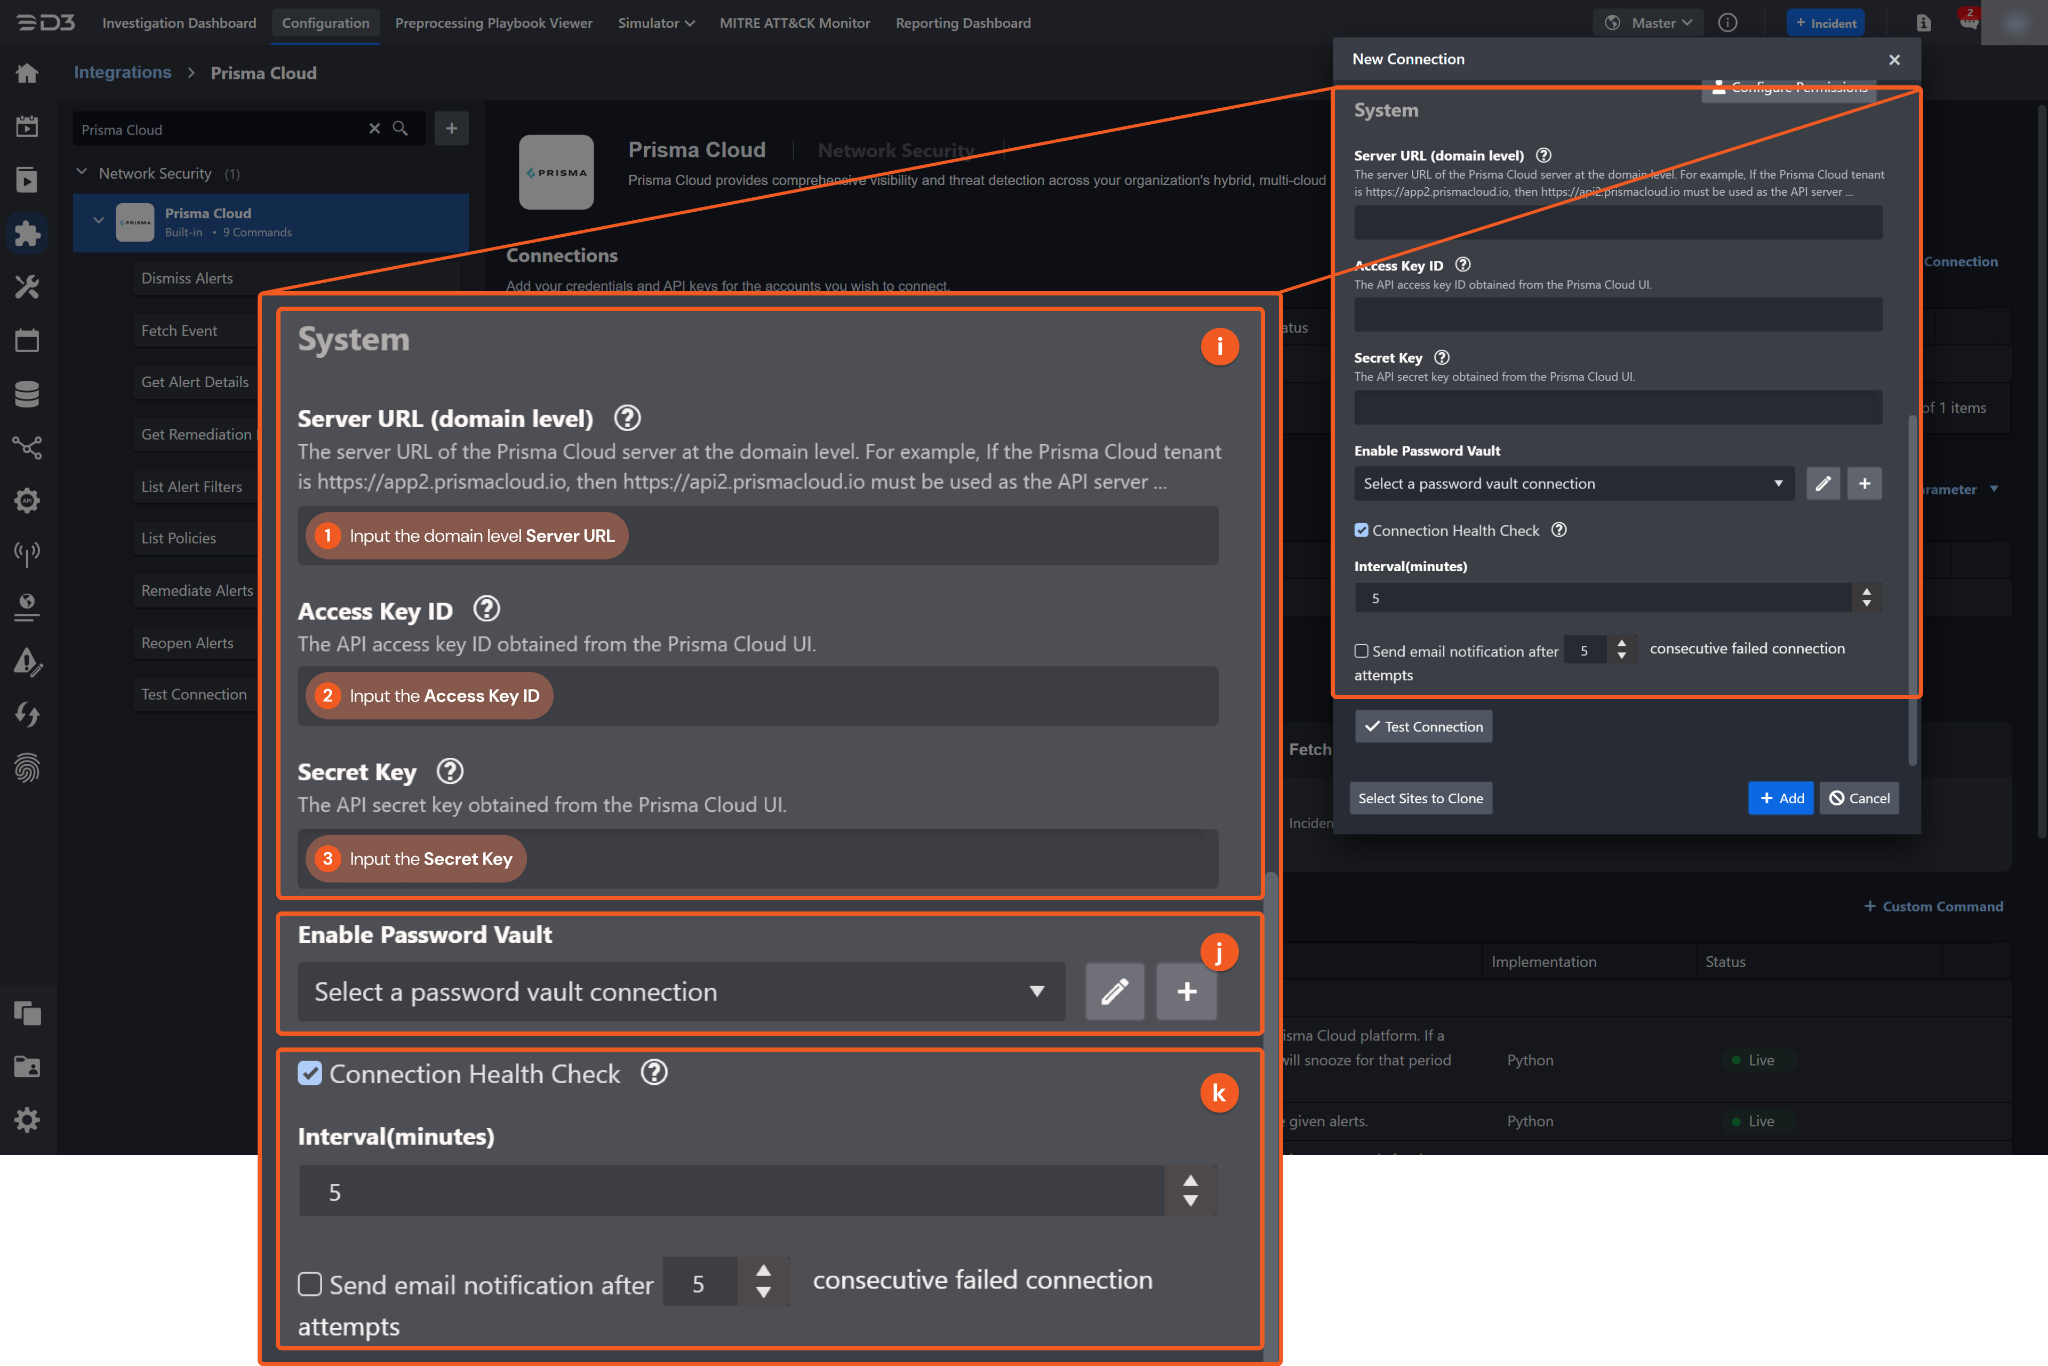
1. Input the domain-level Server URL.
2. Copy the Access Key ID from the Prisma Cloud platform. Refer to Configuring Prisma Cloud to Work with D3 SOAR.
3. Copy the Secret Key from the Prisma Cloud platform. Refer to Configuring Prisma Cloud to Work with D3 SOAR.
Enable Password Vault: An optional feature that allows users to take the stored credentials from their own password vault. Refer to the password vault connection guide if needed.
Connection Health Check: Periodically checks the connection status by scheduling the Test Connection command at the specified interval (in minutes). Available only for active connections, this feature also allows configuring email notifications for failed attempts.
Test the connection.
Click on the Test Connection button to verify credentials and connectivity. A success alert displays Passed with a green checkmark. If the connection fails, review the parameters and retry.
Click OK to close the alert window.
Click + Add to create and add the configured connection.
Commands
Prisma Cloud includes the following executable commands for users to set up schedules or create playbook workflows. With the Test Command function, users can execute these commands independently for playbook troubleshooting.
Integration API Note
For more information about the Prisma Cloud API, refer to the Prisma Cloud API reference.
Note for Time-related parameters
The input format of time-related parameters may vary based on user account settings, which may cause the sample data in commands to differ from what is displayed. To adjust the time format, follow these steps:
Navigate to Configuration > Application Settings. Select Date/Time Format.
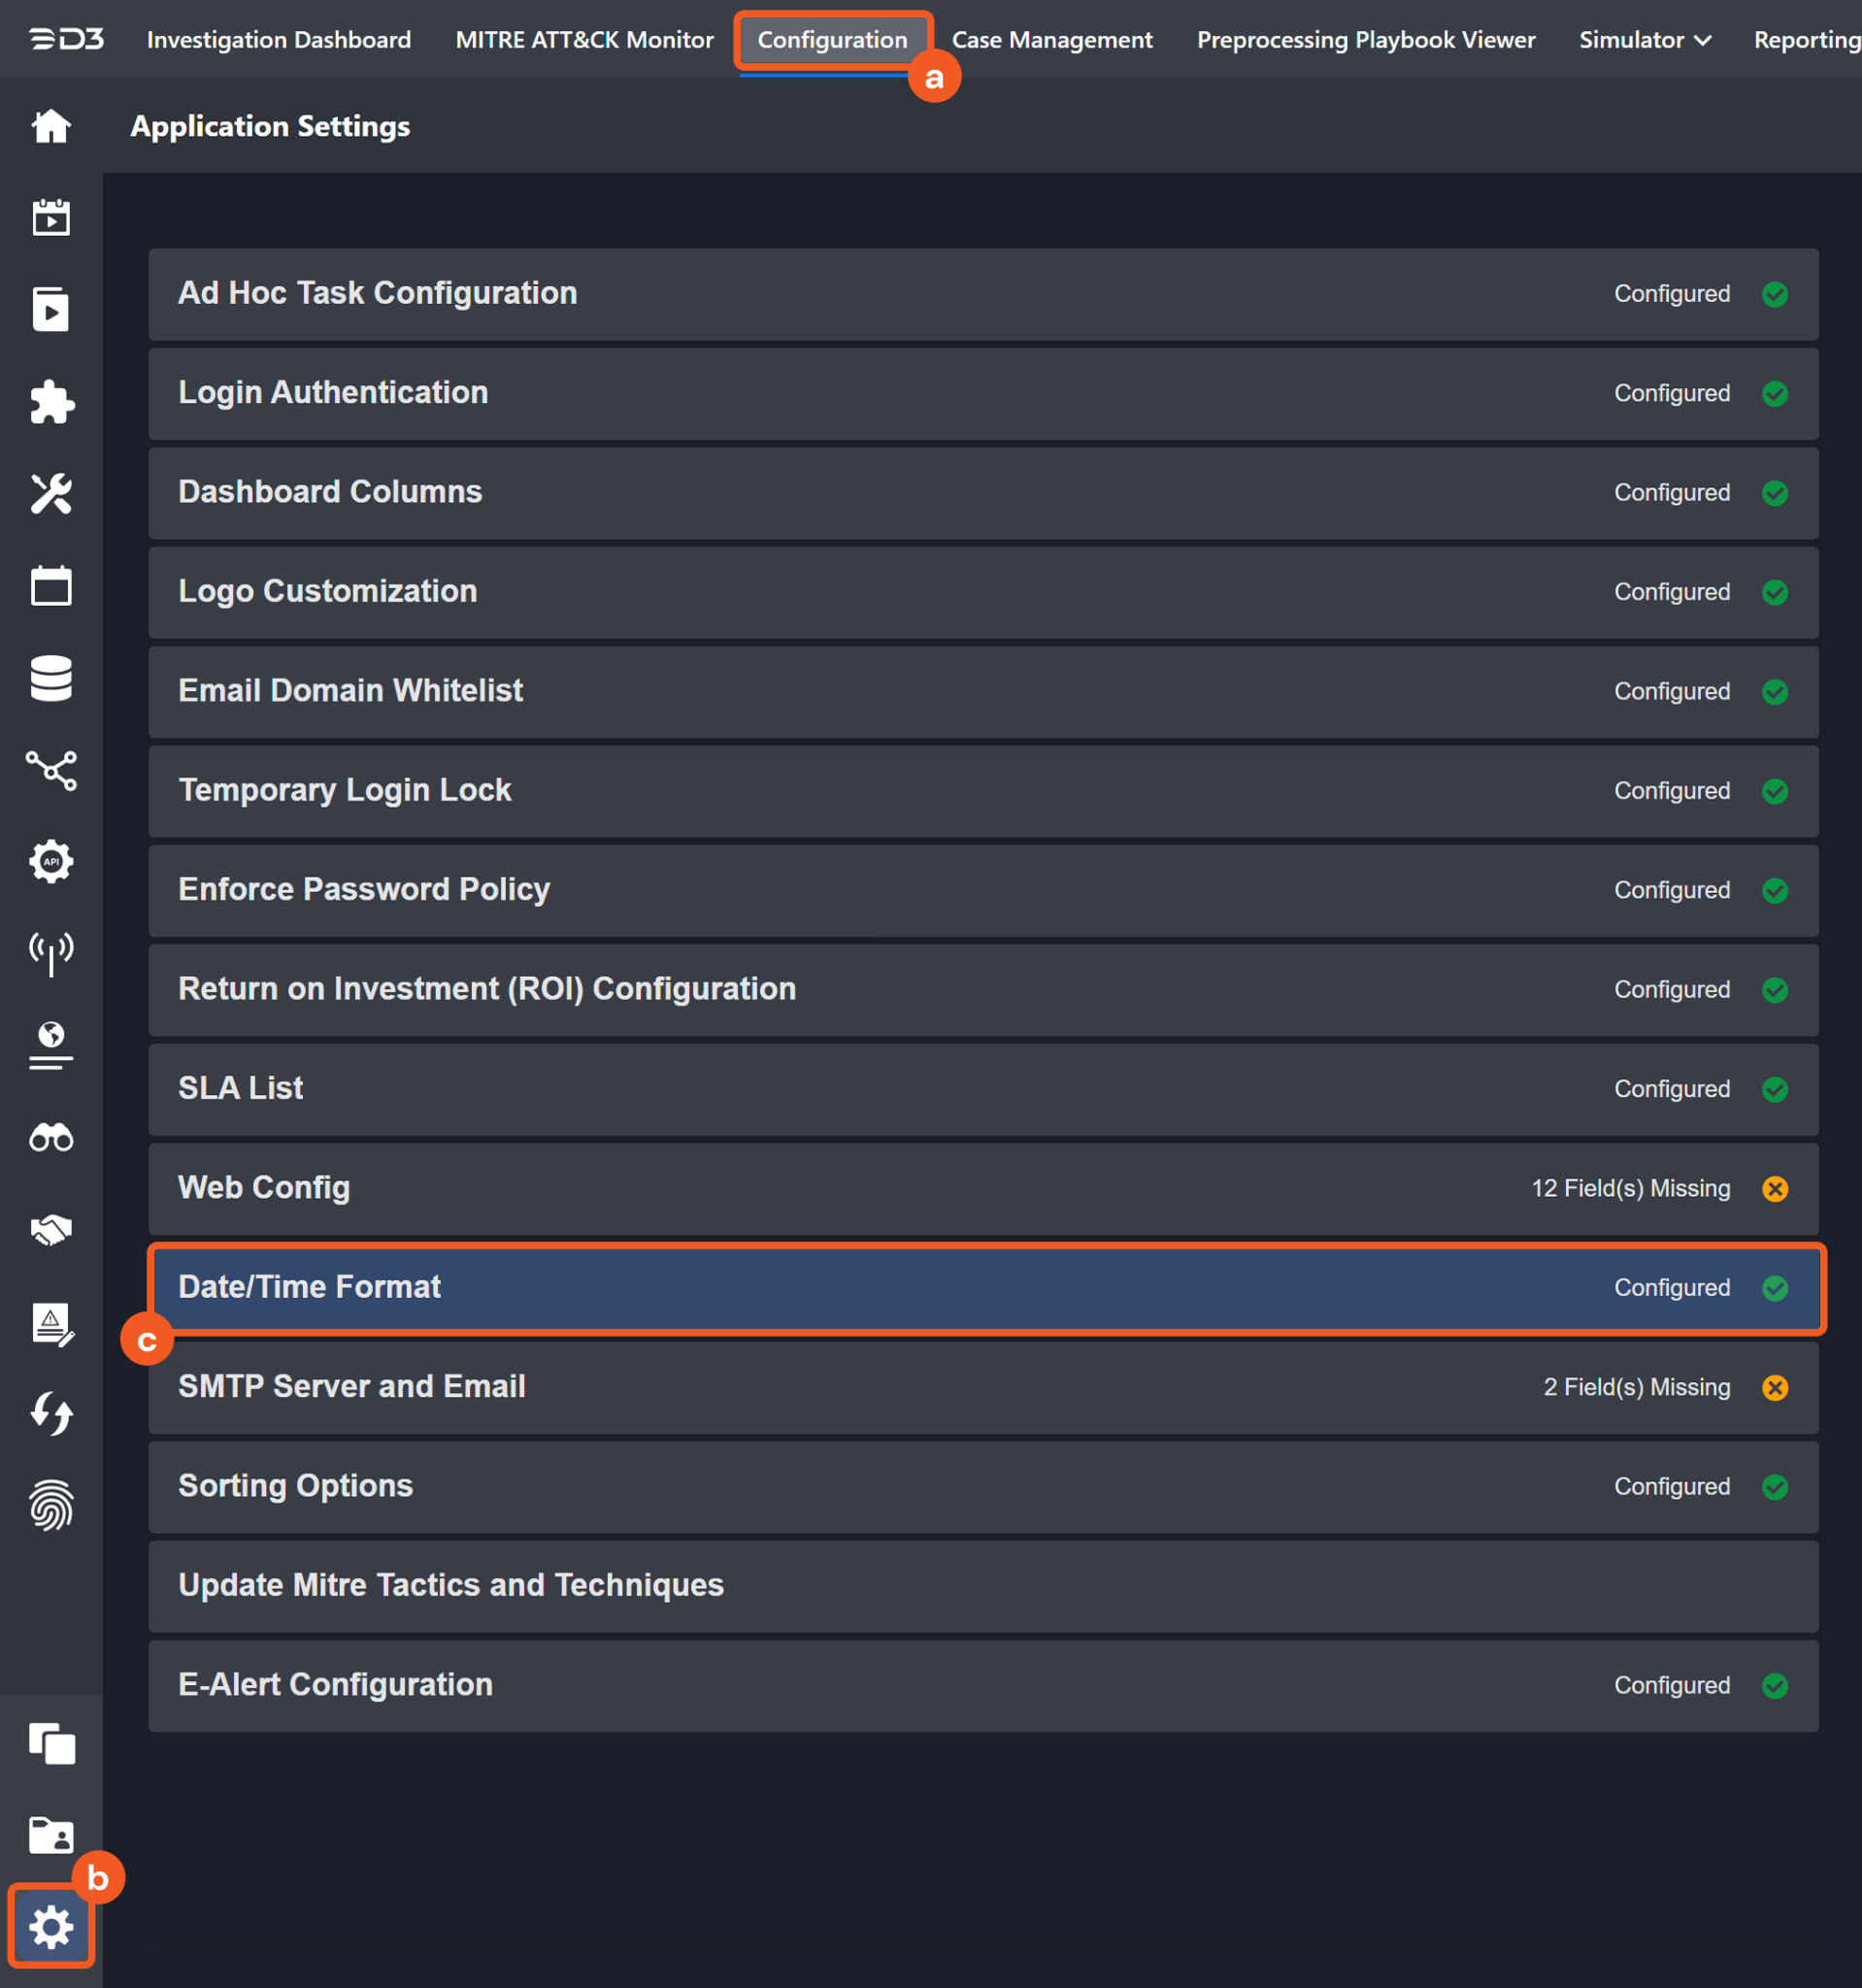
Choose the desired date and time format, then click on the Save button.
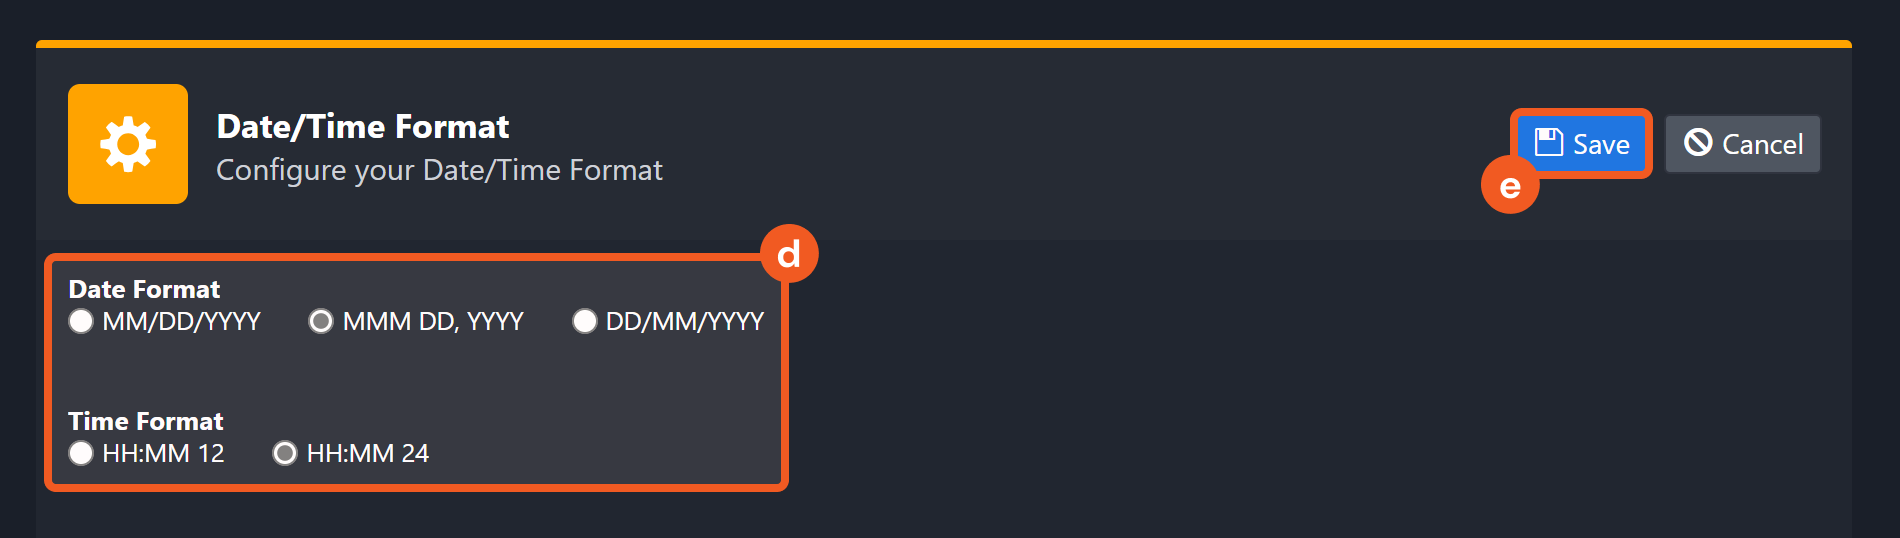
The selected time format will now be visible when configuring Date/Time command input parameters.
Dismiss Alerts
Dismisses one or more alerts on the Prisma Cloud platform. If a dismissal time range is defined, alerts will snooze for that period instead of being dismissed.
READER NOTE
Alert IDs and Policy IDs are optional parameters to run this command.
Run the Fetch Event command to obtain the Alert IDs. Alert IDs can be found in the raw data at the path $.items[*].id.
Run the List Policies command to obtain the Policy IDs. Policy IDs can be found in the raw data at the path $.Results[*].policyId.
Either Policy IDs or Alert IDs must be provided.
Input
Input Parameter | Required/Optional | Description | Example |
Alert IDs | Optional | The IDs of the alerts to be dismissed. Alert IDs can be obtained using the Fetch Event command. Either Policy IDs or Alert IDs must be provided. |
JSON
|
Policy IDs | Optional | The IDs of the policies by which the alerts to be dismissed are triggered. Policy IDs can be obtained using the List Policies command. Either Policy IDs or Alert IDs must be provided. |
JSON
|
Snooze Time Unit | Optional | The time unit for snoozing alerts. Available options are:
By default, the value is set to Minute. | Hour |
Snooze Time Value | Optional | The number of time units for snoozing alerts. By default, the alerts will be immediately dismissed. | 5 |
Dismissal Note | Optional | The reason for dismissing the alerts. This parameter is omitted if the user specifies a Snooze Time Value and Snooze Time Unit. | False Positive |
Start Time | Optional | Filters alerts by alert time. Alerts generated after this time will be dismissed. | 2024-01-01 00:00:00 |
End Time | Optional | Filters alerts by alert time. Alerts generated before this time will be dismissed. | 2024-01-02 00:00:00 |
Filters | Optional | Filters alerts based on filter key-value pairs. All valid filters can be obtained using the List Alert Filters command. |
JSON
|
Output
To view the sample output data for all commands, refer to this article.
Error Handling
If the Return Data displays Failed, an Error tab will appear in the Test Result window.
The error tab contains the details responded from D3 SOAR or third-party API calls, including Failure Indicator, Status Code, and Message. This can help locate the root cause of a command failure.
Parts in Error | Description | Example |
Failure Indicator | Indicates the command failure that happened at a specific input and/or API call. | Dismiss Alerts failed. |
Status Code | The response code issued by the third-party API server or the D3 SOAR system that can be used to locate the corresponding error category. For example, if the returned status code is 401, the selected connection is unauthorized to run the command. The user or system support would need to check the permission setting in the Prisma Cloud portal. Refer to the HTTP Status Code Registry for details. | Status Code: 400. |
Message | The raw data or captured key error message from the integration API server about the API request failure. | Message: Bad request. |
Error Sample Data Dismiss Alerts failed. Status Code: 400. Message: Bad request. |
Fetch Event
Ingests alerts into VSOC as events based on search conditions.
Input
Input Parameter | Required/Optional | Description | Example |
Start Time | Optional | The start of the range for fetching events (in UTC). By default, the Start Time is 24 hours before the End Time. | 12/20/2024 10:30 AM |
End Time | Optional | The end of the range for fetching events (in UTC). By default, the End Time is the current time. | 12/23/2024 07:23 PM |
Number of Incident(s) Fetched | Optional | The maximum number of alerts to return for each project. By default, 10000 alerts will be returned. Valid values are integers from 1 to 10000. | 10 |
Filters | Optional | Filters alerts based on filter key-value pairs. All valid filters can be obtained using the List Alert Filters command. |
JSON
|
Output
To view the sample output data for all commands, refer to this article.
Fetch Event Field Mapping
Fetch Event commands require event field mapping. Field mapping plays a key role for data normalization within the event pipeline. Field mapping converts the original data fields from the different providers to standardized D3 fields as defined by the D3 Model. Refer to Event and Incident Intake Field Mapping for details.
To add a custom field, click on the + Add Field button. Users can also remove built-in field mappings by clicking x. Note that two underscore characters will automatically prefix the defined Field Name as the System Name for a custom field mapping. Additionally, if an input Field Name contains any spaces, they will automatically be replaced with underscores for the corresponding System Name.
As a system integration, the Prisma Cloud integration has some pre-configured field mappings for default field mapping.
Default Event Source
The Default Event Source is the default set of field mappings that are applied when this fetch event command is executed. For out-of-the-box integrations, users will find a set of field mappings provided by the system. Default event source provides field mappings for common fields from the fetched data. The default event source has a "Main Event JSON Path" (i.e. $.items) that is used to extract a batch of events from the response raw data. View the "Main Event JSON Path" by clicking on the Edit Event Source button.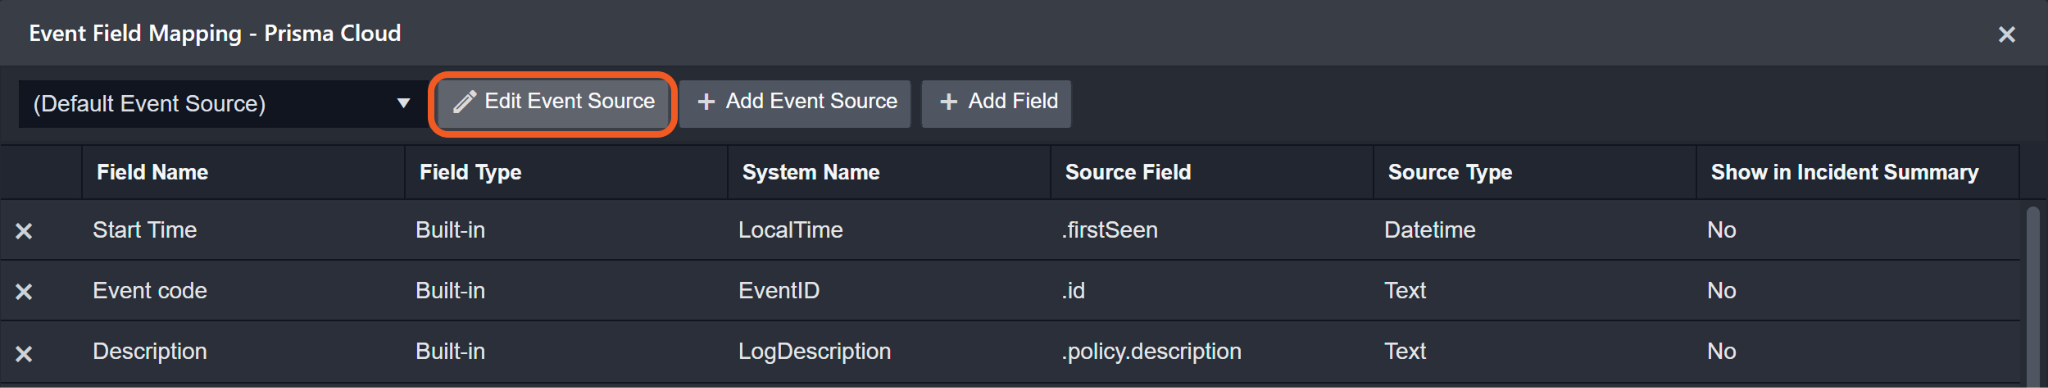
Main Event JSON Path: $.items
The Main Event JSON Path determines the root path where the system starts parsing raw response data into D3 event data. The JSON path begins with $, representing the root element. The path is formed by appending a sequence of child elements to $, each separated by a dot (.). Square brackets with nested quotation marks ([‘...’]) should be used to separate child elements in JSON arrays.
For example, the root node of a JSON Path is items. The child node denoting the Event code field would be id. Putting it together, the JSON Path expression to extract the Event code is $.items.id.
The pre-configured field mappings are detailed below:
Field Name | Source Field |
Start Time | .firstSeen |
Event code | .id |
Description | .policy.description |
Status | .status |
Status Reason | .reason |
Policy ID | .policy.policyId |
Alert Updated Time | .lastUpdated |
Status Updated Time | .lastSeen |
Policy Name | .policy.name |
Policy Type | .policy.policyType |
Severity | .policy.severity |
Remediable | .policy.remediable |
Recommendation | .policy.recommendation |
Remediation Description | .policy.remediation.description |
Remediation Impact | .policy.remediation.impact |
Remediation CLI Script Template | .policy.remediation.cliScriptTemplate |
Resource Type | .resource.resourceType |
Resource Name | .resource.name |
Resource Account | .resource.account |
Resource ID | .resource.id |
Cloud Type | .resource.cloudType |
Resource Account ID | .resource.accountId |
Resource RRN | .resource.rrn |
URL | .resource.url |
Risk Score | .riskDetail.score |
Error Handling
If the Return Data displays Failed, an Error tab will appear in the Test Result window.
The error tab contains the details responded from D3 SOAR or third-party API calls, including Failure Indicator, Status Code, and Message. This can help locate the root cause of a command failure.
Parts in Error | Description | Example |
Failure Indicator | Indicates the command failure that happened at a specific input and/or API call. | Fetch Event failed. |
Status Code | The response code issued by the third-party API server or the D3 SOAR system that can be used to locate the corresponding error category. For example, if the returned status code is 401, the selected connection is unauthorized to run the command. The user or system support would need to check the permission setting in the Prisma Cloud portal. Refer to the HTTP Status Code Registry for details. | Status Code: 400. |
Message | The raw data or captured key error message from the integration API server about the API request failure. | Message: Bad request. |
Error Sample Data Fetch Event failed. Status Code: 400. Message: Bad request. |
Get Alert Details
Returns detailed information about the given alerts.
READER NOTE
Alert IDs is a required parameter to run this command.
Run the Fetch Event command to obtain the Alert IDs. Alert IDs can be found in the raw data at the path $.items[*].id.
Input
Input Parameter | Required/Optional | Description | Example |
Alert IDs | Required | The IDs of the alerts for which to retrieve details. Alert IDs can be obtained using the Fetch Event command. |
JSON
|
Output
To view the sample output data for all commands, refer to this article.
Error Handling
If the Return Data displays Partially Successful or Failed, an Error tab will appear in the Test Result window.
The error tab contains the details responded from D3 SOAR or third-party API calls, including Failure Indicator, Status Code, and Message. This can help locate the root cause of a command failure.
Parts in Error | Description | Example |
Failure Indicator | Indicates the command failure that happened at a specific input and/or API call. | Get Alert Details failed. |
Status Code | The response code issued by the third-party API server or the D3 SOAR system that can be used to locate the corresponding error category. For example, if the returned status code is 401, the selected connection is unauthorized to run the command. The user or system support would need to check the permission setting in the Prisma Cloud portal. Refer to the HTTP Status Code Registry for details. | Status Code: 400. |
Message | The raw data or captured key error message from the integration API server about the API request failure. | Message: Bad request. |
Error Sample Data Get Alert Details failed. Status Code: 400. Message: Bad request. |
Get Remediation Details for Alerts
Generates and returns a list of remediation commands for the specified alerts and policies. Data returned for a successful call include fully constructed commands for remediation.
READER NOTE
Alert IDs and Policy IDs are optional parameters to run this command.
Run the Fetch Event command to obtain the Alert IDs. Alert IDs can be found in the raw data at the path $.items[*].id.
Run the List Policies command to obtain the Policy IDs. Policy IDs can be found in the raw data at the path $.Results[*].policyId.
Either Policy IDs or Alert IDs must be provided.
Input
Input Parameter | Required/Optional | Description | Example |
Alert IDs | Optional | The IDs of the alerts. If no policy IDs are specified, one or more alert IDs associated with a single policy must be provided. If a policy ID is specified, all provided alert IDs must belong to that policy. Alert IDs can be obtained using the Fetch Event command. |
JSON
|
Policy IDs | Optional | The IDs of the policies. If no alert IDs are specified, at least one policy ID must be provided. Policy IDs can be obtained using the List Policies command. |
JSON
|
Start Time | Optional | Filters alerts by alert time. Remediation commands for alerts generated after this time will be returned. By default, the start time is 24 hours before the end time. | 2024-01-01 00:00:00 |
End Time | Optional | Filters alerts by alert time. Remediation commands for alerts generated before this time will be returned. By default, the start time is the current time. | 2024-01-02 00:00:00 |
Output
To view the sample output data for all commands, refer to this article.
Error Handling
If the Return Data displays Failed, an Error tab will appear in the Test Result window.
The error tab contains the details responded from D3 SOAR or third-party API calls, including Failure Indicator, Status Code, and Message. This can help locate the root cause of a command failure.
Parts in Error | Description | Example |
Failure Indicator | Indicates the command failure that happened at a specific input and/or API call. | Get Remediation Details for Alerts failed. |
Status Code | The response code issued by the third-party API server or the D3 SOAR system that can be used to locate the corresponding error category. For example, if the returned status code is 401, the selected connection is unauthorized to run the command. The user or system support would need to check the permission setting in the Prisma Cloud portal. Refer to the HTTP Status Code Registry for details. | Status Code: 400. |
Message | The raw data or captured key error message from the integration API server about the API request failure. | Message: Bad request. |
Error Sample Data Get Remediation Details for Alerts failed. Status Code: 400. Message: Bad request. |
List Alert Filters
Returns an object whose keys are all available policy filters. Each key's value is either its default or the most recently set filter option.
Input
N/A
Output
To view the sample output data for all commands, refer to this article.
Error Handling
If the Return Data displays Failed, an Error tab will appear in the Test Result window.
The error tab contains the details responded from D3 SOAR or third-party API calls, including Failure Indicator, Status Code, and Message. This can help locate the root cause of a command failure.
Parts in Error | Description | Example |
Failure Indicator | Indicates the command failure that happened at a specific input and/or API call. | List Alert Filters failed. |
Status Code | The response code issued by the third-party API server or the D3 SOAR system that can be used to locate the corresponding error category. For example, if the returned status code is 401, the selected connection is unauthorized to run the command. The user or system support would need to check the permission setting in the Prisma Cloud portal. Refer to the HTTP Status Code Registry for details. | Status Code: 400. |
Message | The raw data or captured key error message from the integration API server about the API request failure. | Message: Bad request. |
Error Sample Data List Alert Filters failed. Status Code: 400. Message: Bad request. |
List Policies
Returns all available policies, including both system-default and custom policies. Users can apply filters to narrow the policy list or to select a specific policy. For improved performance, the response excludes open alert counts.
Input
Input Parameter | Required/Optional | Description | Example |
Policy Name | Optional | Filters policies by policy name. | Policy_Name |
Policy Severity | Optional | Filters policies by policy severity. Available options are:
By default, all policies regardless of their severity will be returned. | Critical |
Policy Type | Optional | Filters policies by policy type. Available options are:
By default, all policies regardless of their type will be returned. | Config |
Policy Enabled | Optional | Whether only enabled policies are returned. By default, all policies regardless of their enabled state will be returned. | True |
Policy Remediable | Optional | Whether only Remediable policies are returned. By default, all policies regardless of their remediable state will be returned. | True |
Policy Mode | Optional | Filters policies by policy mode. Available options are:
By default, all policies regardless of their mode will be returned. | Redlock_Default |
Policy Label | Optional | Filters policies by policy label. | POLICY_LABEL |
Compliance Standard | Optional | Filters policies by compliance standard name. | COMPLIANCE_STANDARD_NAME |
Compliance Requirement | Optional | Filters policies by compliance requirement name. | COMPLIANCE_REQUIREMENT_NAME |
Policy Rule Type | Optional | Filters policies by policy rule type. Available options are:
By default, all policies regardless of their rule type will be returned. | TF |
Policy Subtype | Optional | Filters policies by policy subtype. Available options are:
By default, all policies regardless of their subtype will be returned. | Run |
Output
To view the sample output data for all commands, refer to this article.
Error Handling
If the Return Data displays Failed, an Error tab will appear in the Test Result window.
The error tab contains the details responded from D3 SOAR or third-party API calls, including Failure Indicator, Status Code, and Message. This can help locate the root cause of a command failure.
Parts in Error | Description | Example |
Failure Indicator | Indicates the command failure that happened at a specific input and/or API call. | List Policies failed. |
Status Code | The response code issued by the third-party API server or the D3 SOAR system that can be used to locate the corresponding error category. For example, if the returned status code is 401, the selected connection is unauthorized to run the command. The user or system support would need to check the permission setting in the Prisma Cloud portal. Refer to the HTTP Status Code Registry for details. | Status Code: 400. |
Message | The raw data or captured key error message from the integration API server about the API request failure. | Message: Bad request. |
Error Sample Data List Policies failed. Status Code: 400. Message: Bad request. |
Remediate Alerts
Remediates alerts if they are associated with a remediable policy. Users can use the Get Remediation Details for Alerts command to determine which remediations will run for the specified alerts.
READER NOTE
Alert IDs is a required parameter to run this command.
Run the Fetch Event command to obtain the Alert IDs. Alert IDs can be found in the raw data at the path $.items[*].id.
Input
Input Parameter | Required/Optional | Description | Example |
Alert IDs | Required | The IDs of the alerts to be remediated. Alert IDs can be obtained using the Fetch Event command. |
JSON
|
Output
To view the sample output data for all commands, refer to this article.
Error Handling
If the Return Data displays Failed, an Error tab will appear in the Test Result window.
The error tab contains the details responded from D3 SOAR or third-party API calls, including Failure Indicator, Status Code, and Message. This can help locate the root cause of a command failure.
Parts in Error | Description | Example |
Failure Indicator | Indicates the command failure that happened at a specific input and/or API call. | Remediate Alerts failed. |
Status Code | The response code issued by the third-party API server or the D3 SOAR system that can be used to locate the corresponding error category. For example, if the returned status code is 401, the selected connection is unauthorized to run the command. The user or system support would need to check the permission setting in the Prisma Cloud portal. Refer to the HTTP Status Code Registry for details. | Status Code: 400. |
Message | The raw data or captured key error message from the integration API server about the API request failure. | Message: Bad request. |
Error Sample Data Remediate Alerts failed. Status Code: 400. Message: Bad request. |
Reopen Alerts
Sets the status of one or more dismissed or snoozed alerts on the Prisma Cloud platform to open.
READER NOTE
Alert IDs and Policy IDs are optional parameters to run this command.
Run the Fetch Event command to obtain the Alert IDs. Alert IDs can be found in the raw data at the path $.items[*].id.
Run the List Policies command to obtain the Policy IDs. Policy IDs can be found in the raw data at the path $.Results[*].policyId.
Either Policy IDs or Alert IDs must be provided.
Input
Input Parameter | Required/Optional | Description | Example |
Alert IDs | Optional | The IDs of the alerts to be reopened. Alert IDs can be obtained using the Fetch Event command. Either Policy IDs or Alert IDs must be provided. |
JSON
|
Policy IDs | Optional | The IDs of the policies by which the alerts to be reopened are triggered. Policy IDs can be obtained using the List Policies command. Either Policy IDs or Alert IDs must be provided. |
JSON
|
Start Time | Optional | Filters alerts by alert time. Alerts generated after this time will be reopened. | 2024-01-01 00:00:00 |
End Time | Optional | Filters alerts by alert time. Alerts generated before this time will be reopened. | 2024-01-02 00:00:00 |
Filters | Optional | Filters alerts based on filter key-value pairs. All valid filters can be obtained using the List Alert Filters command. |
JSON
|
Output
To view the sample output data for all commands, refer to this article.
Error Handling
If the Return Data displays Failed, an Error tab will appear in the Test Result window.
The error tab contains the details responded from D3 SOAR or third-party API calls, including Failure Indicator, Status Code, and Message. This can help locate the root cause of a command failure.
Parts in Error | Description | Example |
Failure Indicator | Indicates the command failure that happened at a specific input and/or API call. | Reopen Alerts failed. |
Status Code | The response code issued by the third-party API server or the D3 SOAR system that can be used to locate the corresponding error category. For example, if the returned status code is 401, the selected connection is unauthorized to run the command. The user or system support would need to check the permission setting in the Prisma Cloud portal. Refer to the HTTP Status Code Registry for details. | Status Code: 400. |
Message | The raw data or captured key error message from the integration API server about the API request failure. | Message: Bad request. |
Error Sample Data Reopen Alerts failed. Status Code: 400. Message: Bad request. |
Test Connection
Allows users to perform a health check on an integration connection. Users can schedule a periodic health check by selecting Connection Health Check when editing an integration connection.
Input
N/A
Output
Output Type | Description | Return Data Type |
Return Data | Indicates one of the possible command execution states: Successful or Failed. The Failed state can be triggered by any of the following errors:
More details about an error can be viewed in the Error tab. | String |
Error Handling
If the Return Data displays Failed, an Error tab will appear in the Test Result window.
The error tab contains the details responded from D3 SOAR or third-party API calls, including Failure Indicator, Status Code, and Message. This can help locate the root cause of a command failure.
Parts in Error | Description | Example |
Failure Indicator | Indicates the command failure that happened at a specific input and/or API call. | Test Connection failed. Failed to check the connector. |
Status Code | The response code issued by the third-party API server or the D3 SOAR system that can be used to locate the corresponding error category. For example, if the returned status code is 401, the selected connection is unauthorized to run the command. The user or system support would need to check the permission setting in the Prisma Cloud portal. Refer to the HTTP Status Code Registry for details. | Status Code: 401. |
Message | The raw data or captured key error message from the integration API server about the API request failure. | Message: Invalid credentials. |
Error Sample Data Test Connection failed. Failed to check the connector. Status Code: 401. Message: Invalid credentials. |