
Microsoft 365 Defender
LAST UPDATED: JULY 30, 2025
Overview
Microsoft 365 Defender, part of Microsoft's XDR solution, leverages the Microsoft 365 security portfolio to automatically analyze threat data across domains, building a complete picture of each attack in a single dashboard. This integration allows organizations to fetch security incidents, update security incidents and run advanced hunting queries to inspect unusual activity, detect possible threats, and even respond to attacks.
D3 SOAR is providing REST operations for working with Microsoft 365 Defender.
Microsoft 365 Defender is available for use in:
Known Limitations
Please check the command READER NOTEs for the detailed limit rates.
Connection
To connect Microsoft 365 Defender from D3 SOAR, please follow this part to collect the required information below:
Parameter | Description | Example |
Tenant ID | The Tenant ID to authenticate the connection. | f621***-a095-***-8ee9-***feed |
Client ID | The Client ID to authenticate the connection. | 7c9a***-de31-***-9968-***9f8a |
Client Secret | The Client Secret to authenticate the connection. | 8lE************************-vbh |
READER NOTE
The clients using this integration are assumed to already have a Microsoft Entra ID Protection Account and Microsoft 365 Office Account with Security Apps available.
Permission Requirements
Each endpoint in the Microsoft 365 Defender API requires a certain permission scope. The following are required scopes for the commands in this integration:
Command | Required API Permissions (Application Permission) |
Microsoft Threat Protection with Application permission: AdvancedHunting.Read.All | |
Microsoft Graph with Application permission: SecurityAlert.ReadWrite.All | |
Fetch Event | EventType: threatSubmission Microsoft Graph with Application Permission: ThreatSubmission.Read.All EventType: defenderAlert Microsoft Graph with Application Permission: SecurityAlert.Read.All EventType: Incident Microsoft Graph with Application Permission: SecurityIncident.Read.All |
Microsoft Threat Protection with Application permission: Incident.Read.All | |
Microsoft Threat Protection with Application permission: Incident.Read.All | |
Microsoft Threat Protection with Application permission: SecurityAlert.Read.All | |
Microsoft Threat Protection with Application permission: SecurityAlert.Read.All | |
Microsoft Threat Protection with Application permission: ThreatSubmission.ReadWrite.All | |
Update Alerts (Both Create comment for alert and Update alert are used here) | Microsoft Graph with Application permission: SecurityAlert.ReadWrite.All |
Microsoft Graph with Application permission: SecurityIncident.ReadWrite.All | |
Test Connection (Both List incidents API in Microsoft Defender XDR and List incidents - Microsoft Graph v1.0 are used here) | Microsoft Threat Protection with Application permission: Incident.Read.All and SecurityAlert.Read.All |
Please refer to Configuring Microsoft 365 Defender to Work with D3 SOAR for more information about API permission settings.
To access the Microsoft 365 Defender portal, the designated user will need to have certain user roles. There are two ways to manage access to Microsoft 365 Defender:
Global Microsoft Entra ID Protection roles. See Assign Microsoft Entra roles to users for more details.
Custom role access. Please refer to Custom roles in role-based access control for Microsoft 365 Defender for more details.
READER NOTE
Accounts with the following Global Microsoft Entra ID Protection roles can access Microsoft 365 Defender's functionality and data:
Global administrator
Security administrator
Security Operator
Global Reader
Security Reader
Please refer to Permission & Roles, Manage Admin Access and Manage Access to Microsoft 365 Defender from Microsoft's documentation for user profile and configuration details.
Configuring Microsoft 365 Defender to Work with D3 SOAR
Log into the Azure Portal (https://portal.azure.com/).
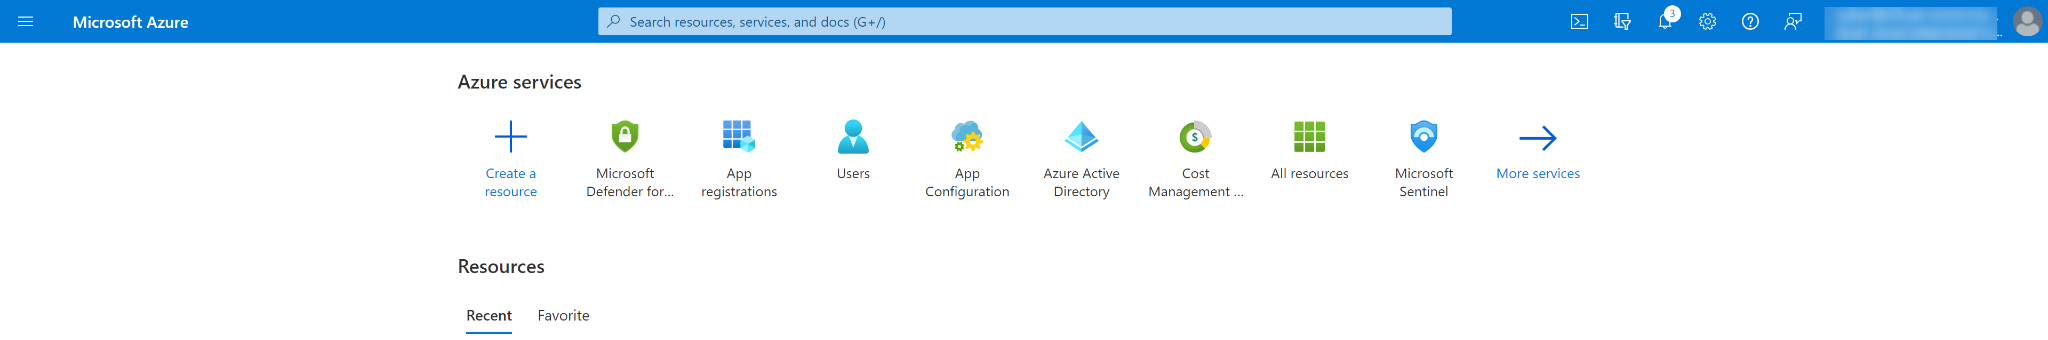
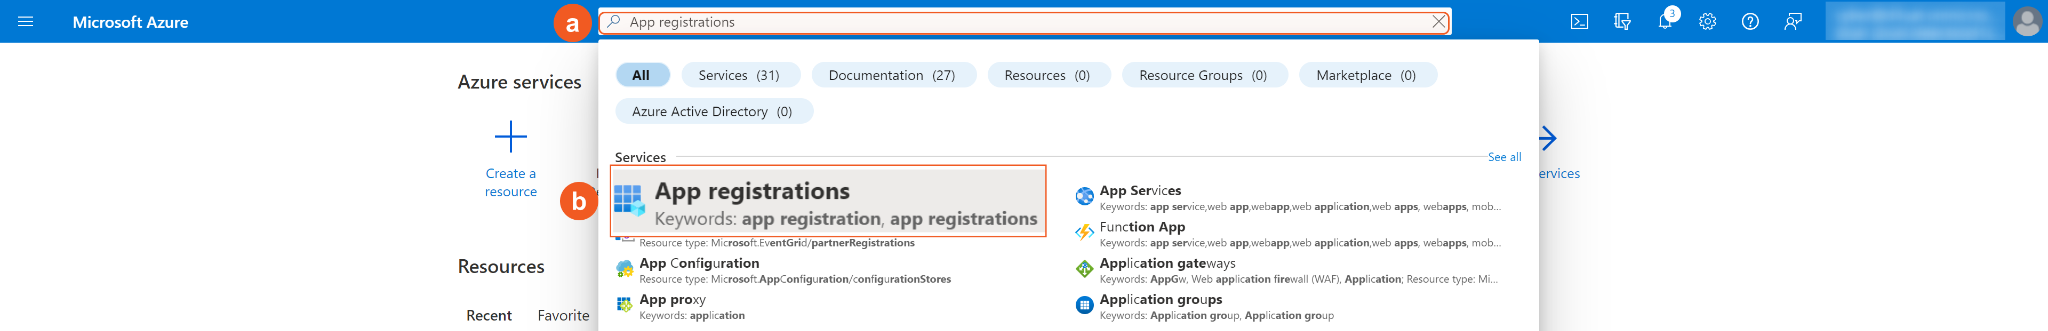
Navigate to the top search bar and search 'App registrations', then click App Registrations.
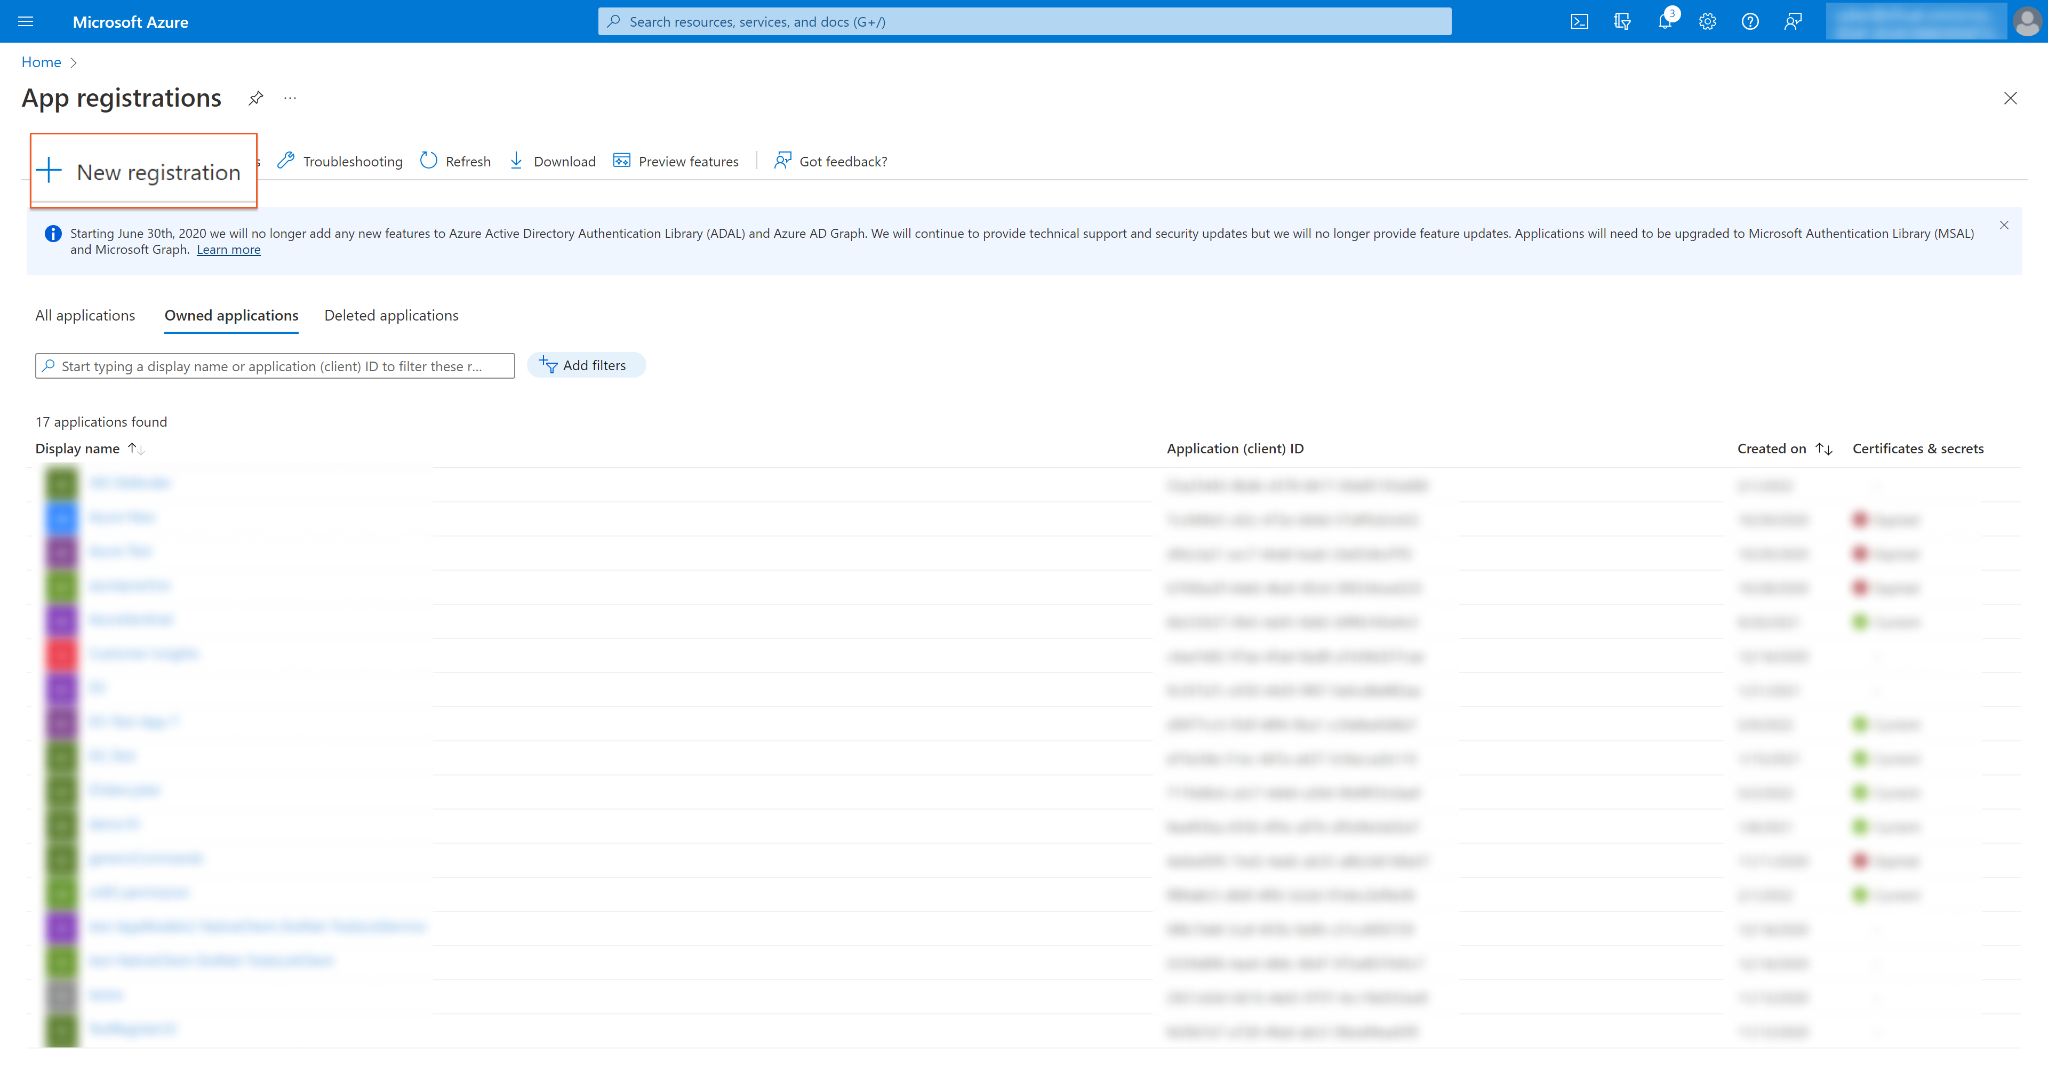
If you already have created Apps, you can use one of them. Skip to step 6 to obtain the Client ID & Tenant ID.
If you do not have an App, click + New registration found near the top left corner to create one.
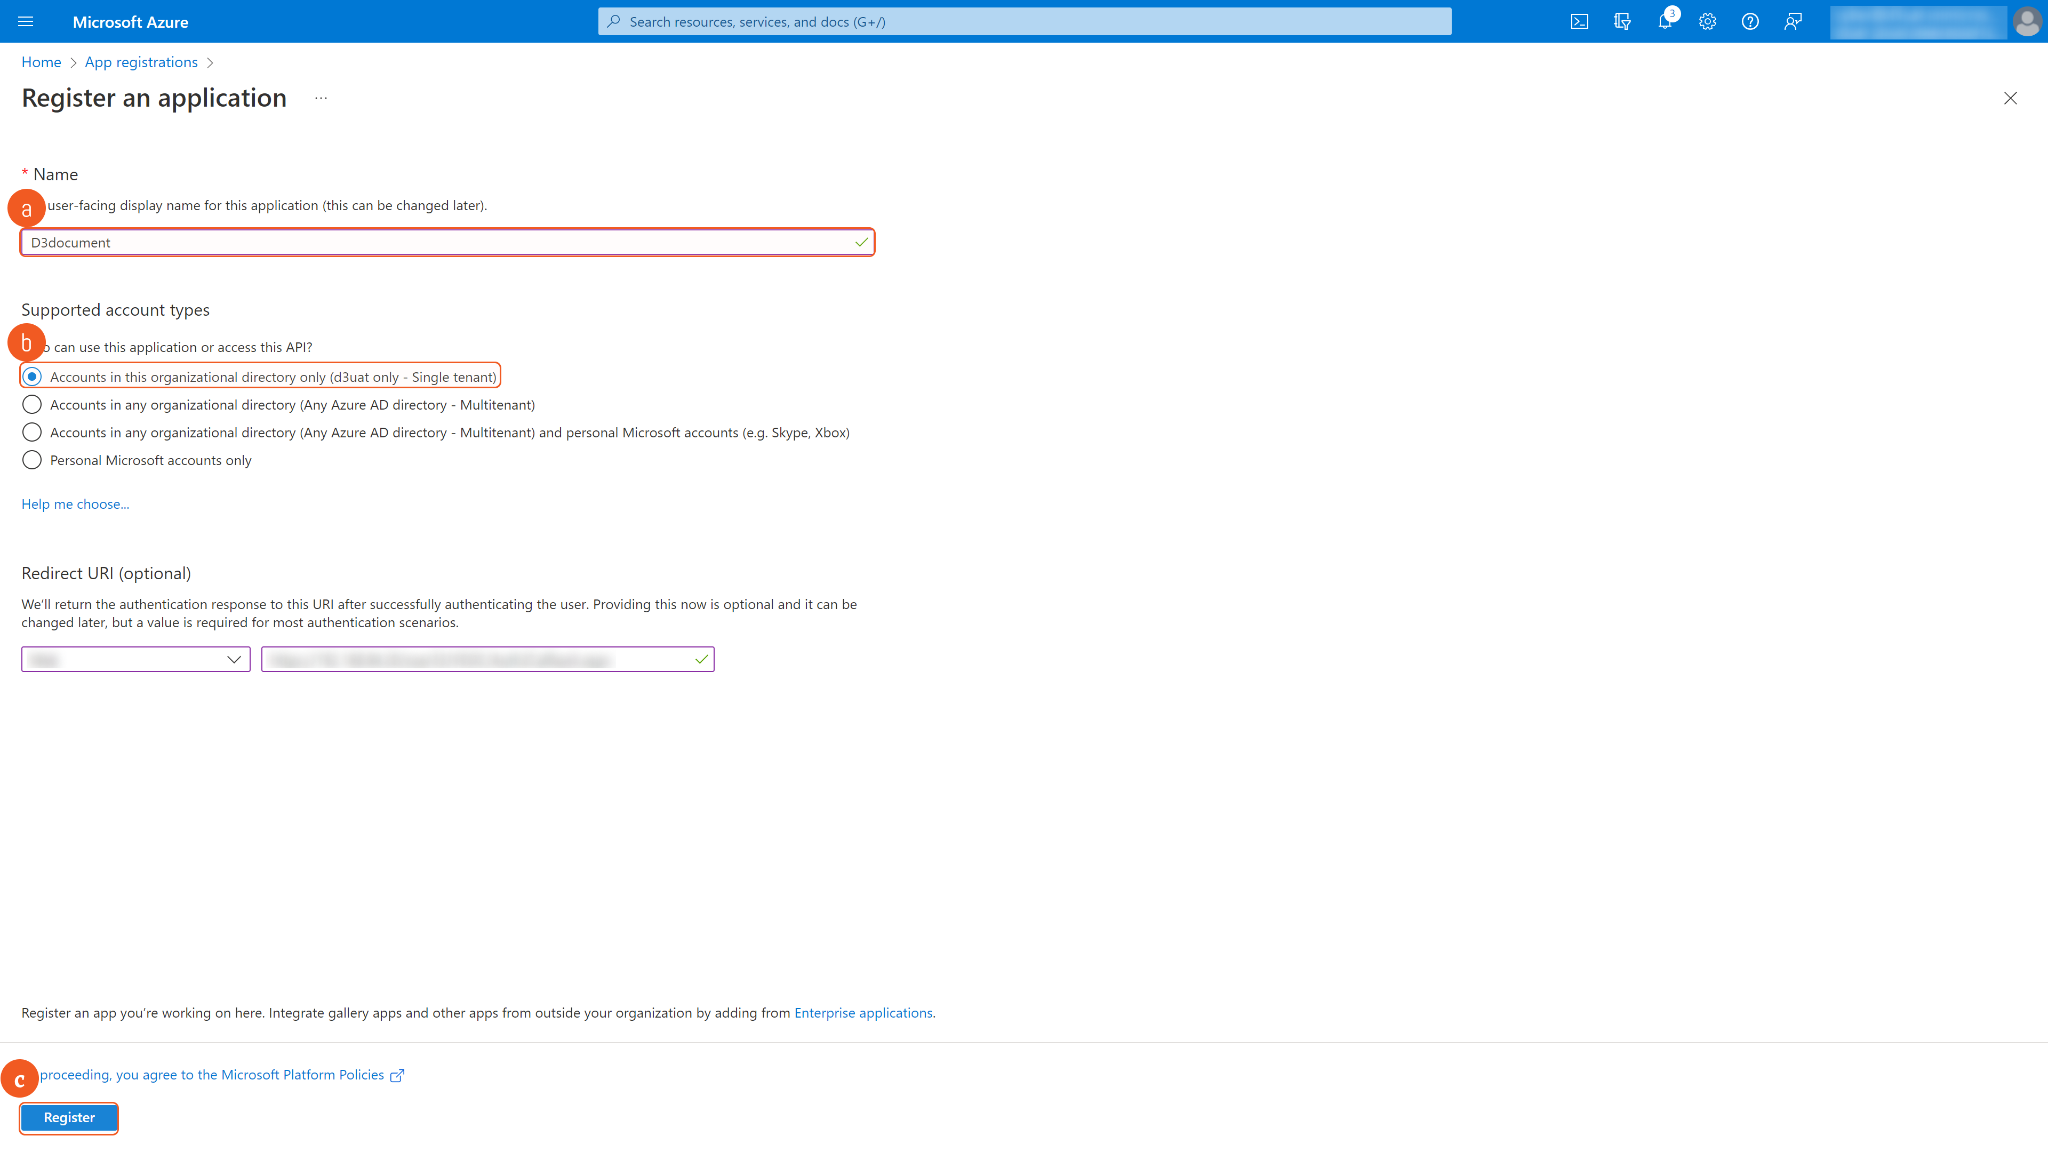
Register an application:
Enter an application Name.
Under Support account types to Accounts select Accounts in this organizational directory only (d3uat only - Single tenant).
Click Register.
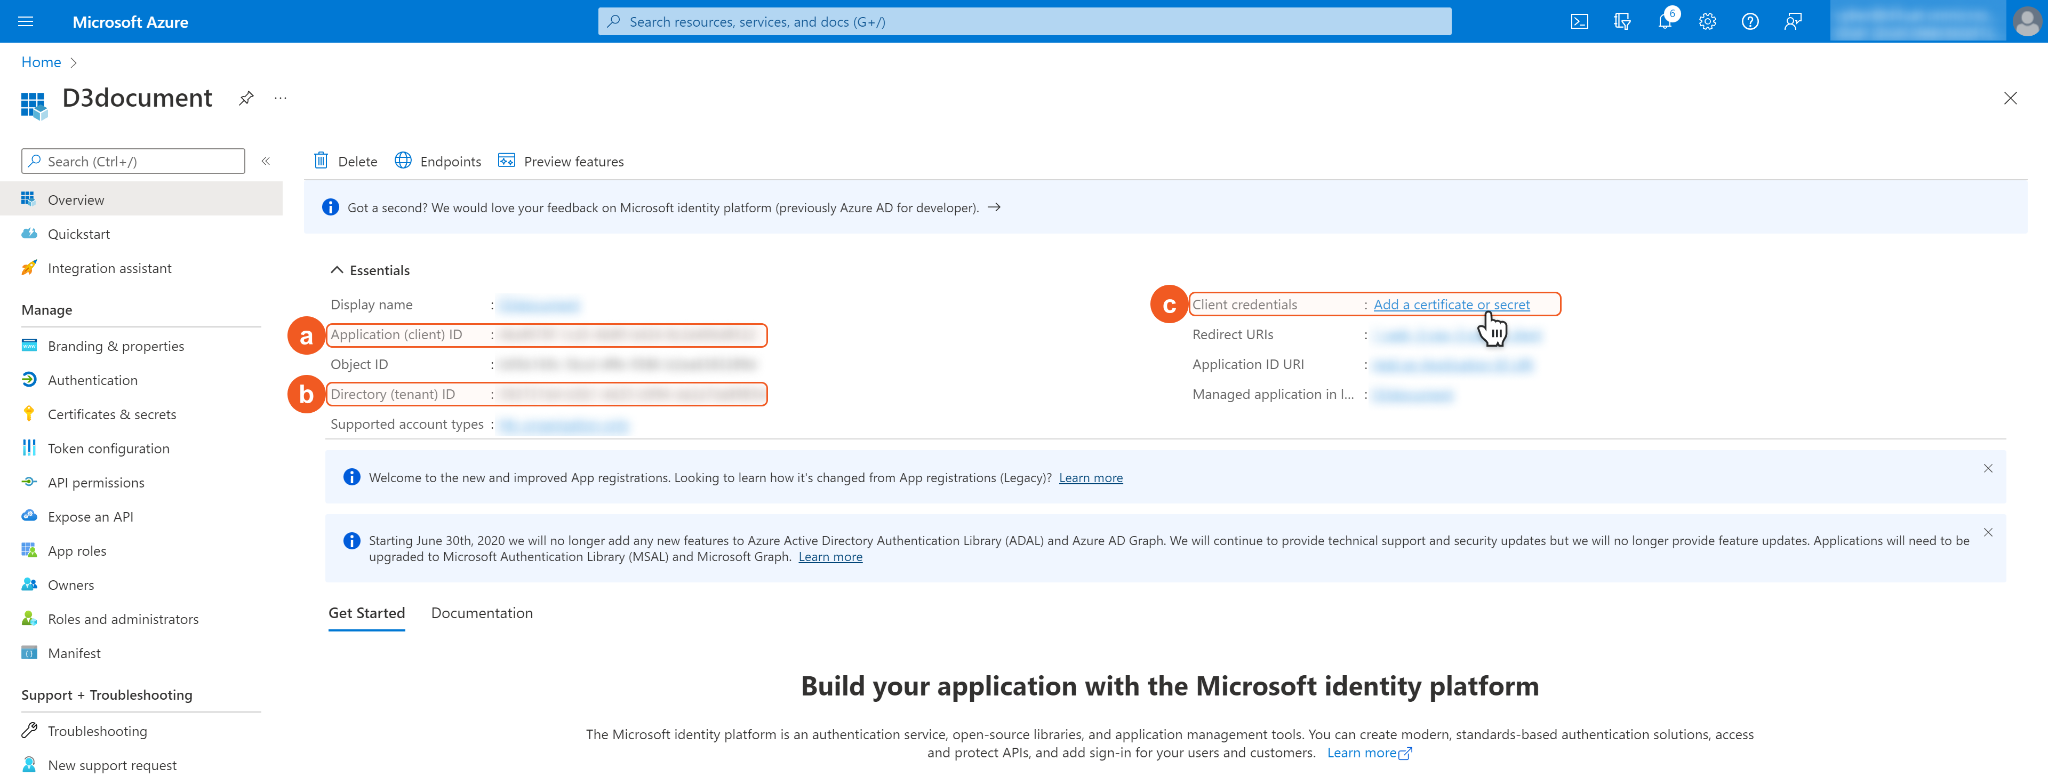
In the App Overview tab, copy and save the Application(client) ID and Directory(tenant) ID for building the D3 SOAR connection. Navigate to Client credentials, then click Add a certificate or secret.
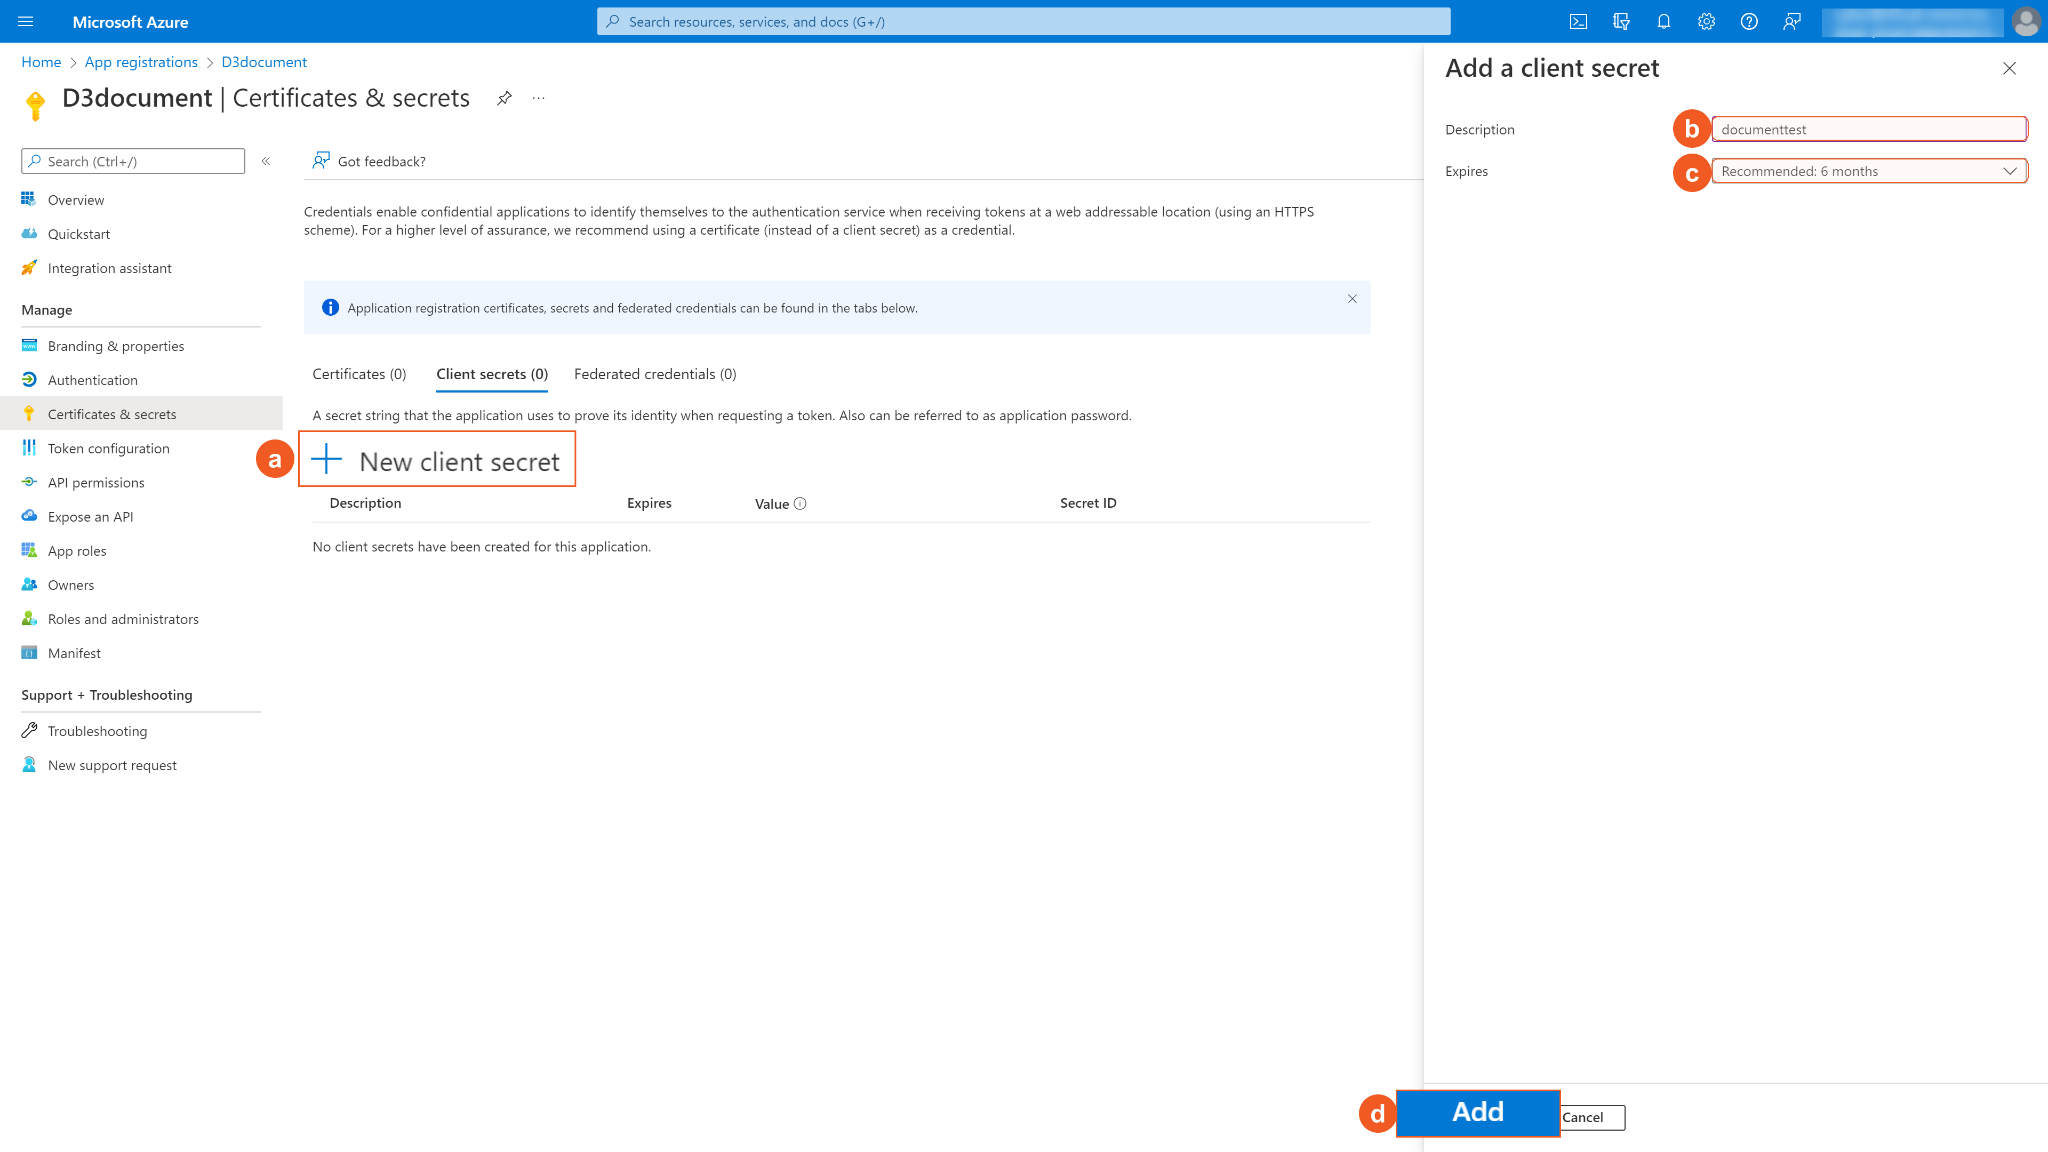
Click + New client secret. Enter a Description for the client secret, and select a client secret expiry period using the Expires dropdown menu. Please note, the client ID cannot access API resources when the client secret expires. You must renew the client secret to keep the client ID active. Click Add to add the client secret.
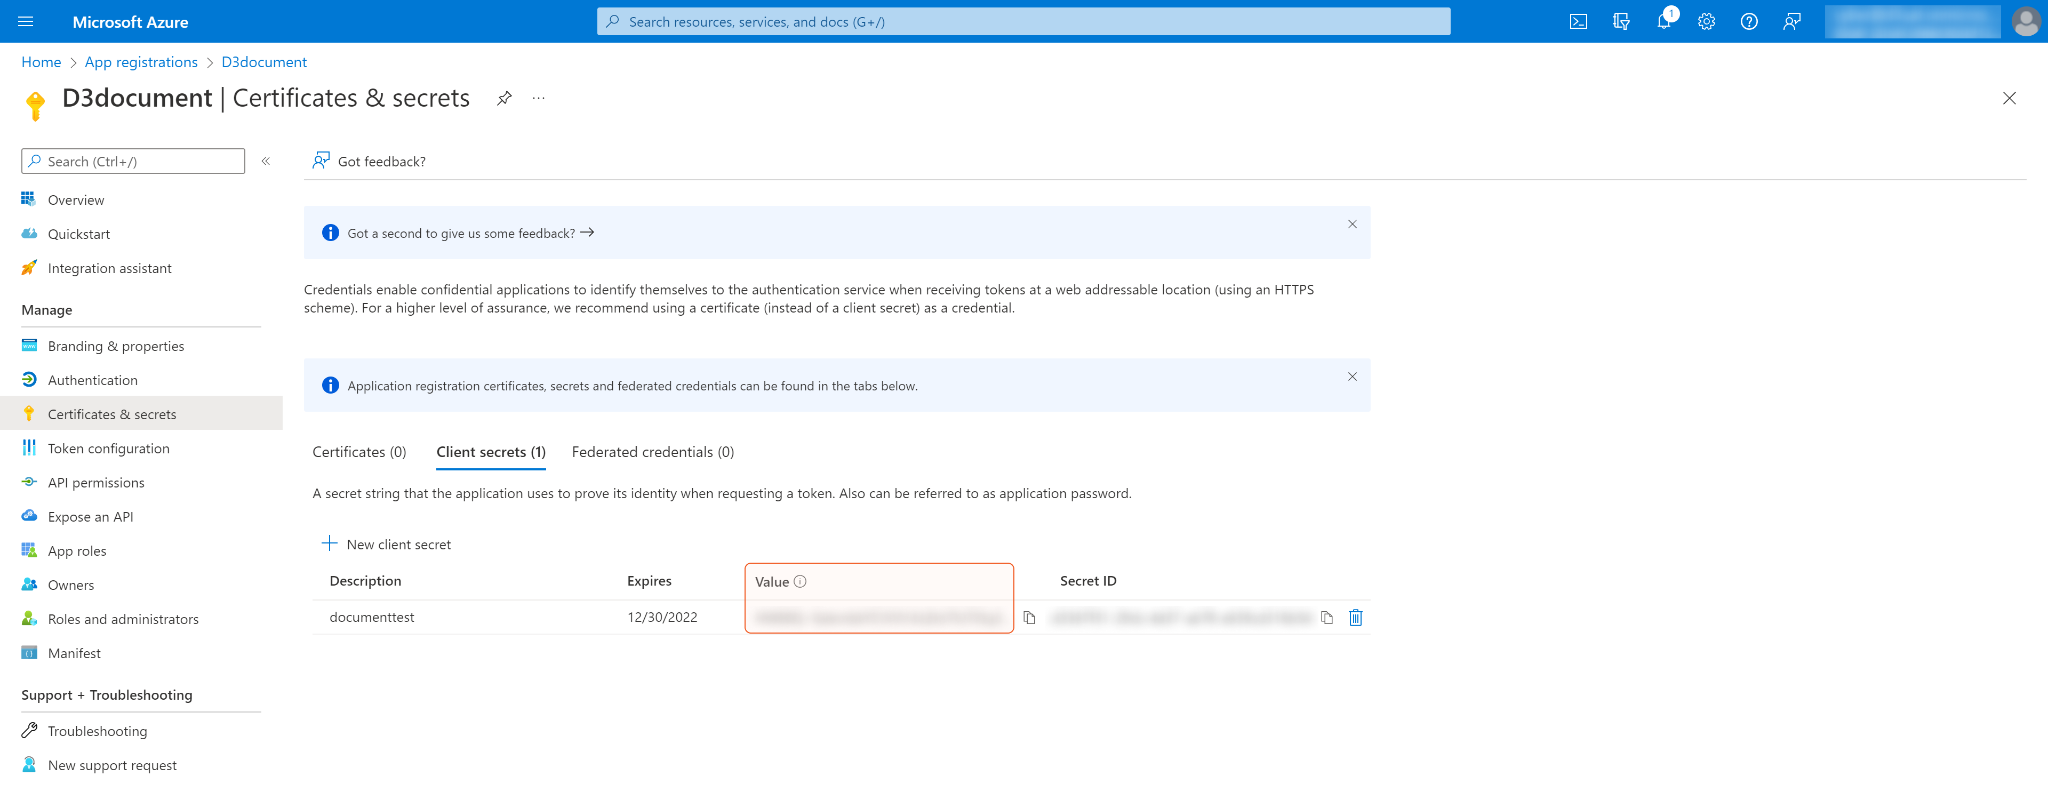
Copy and save Secret Value for building the D3 SOAR connection. Please note that your Client Secret can only be viewed once. Store it securely before leaving the page.
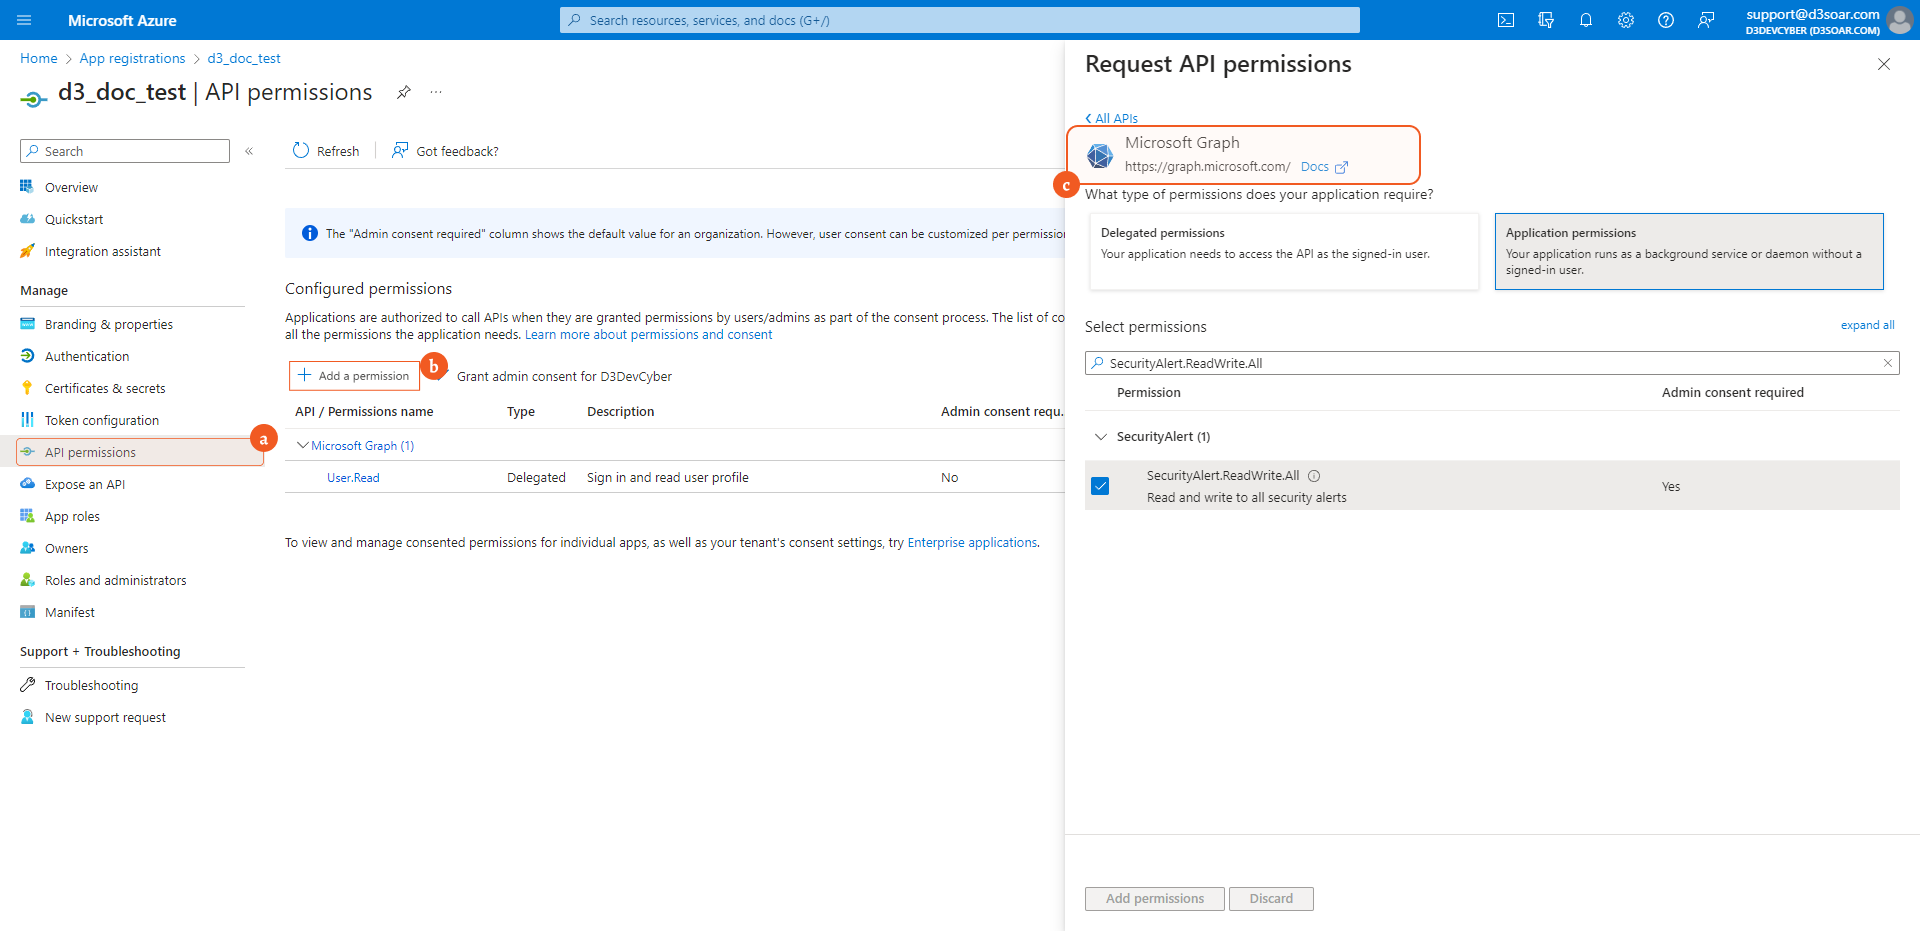
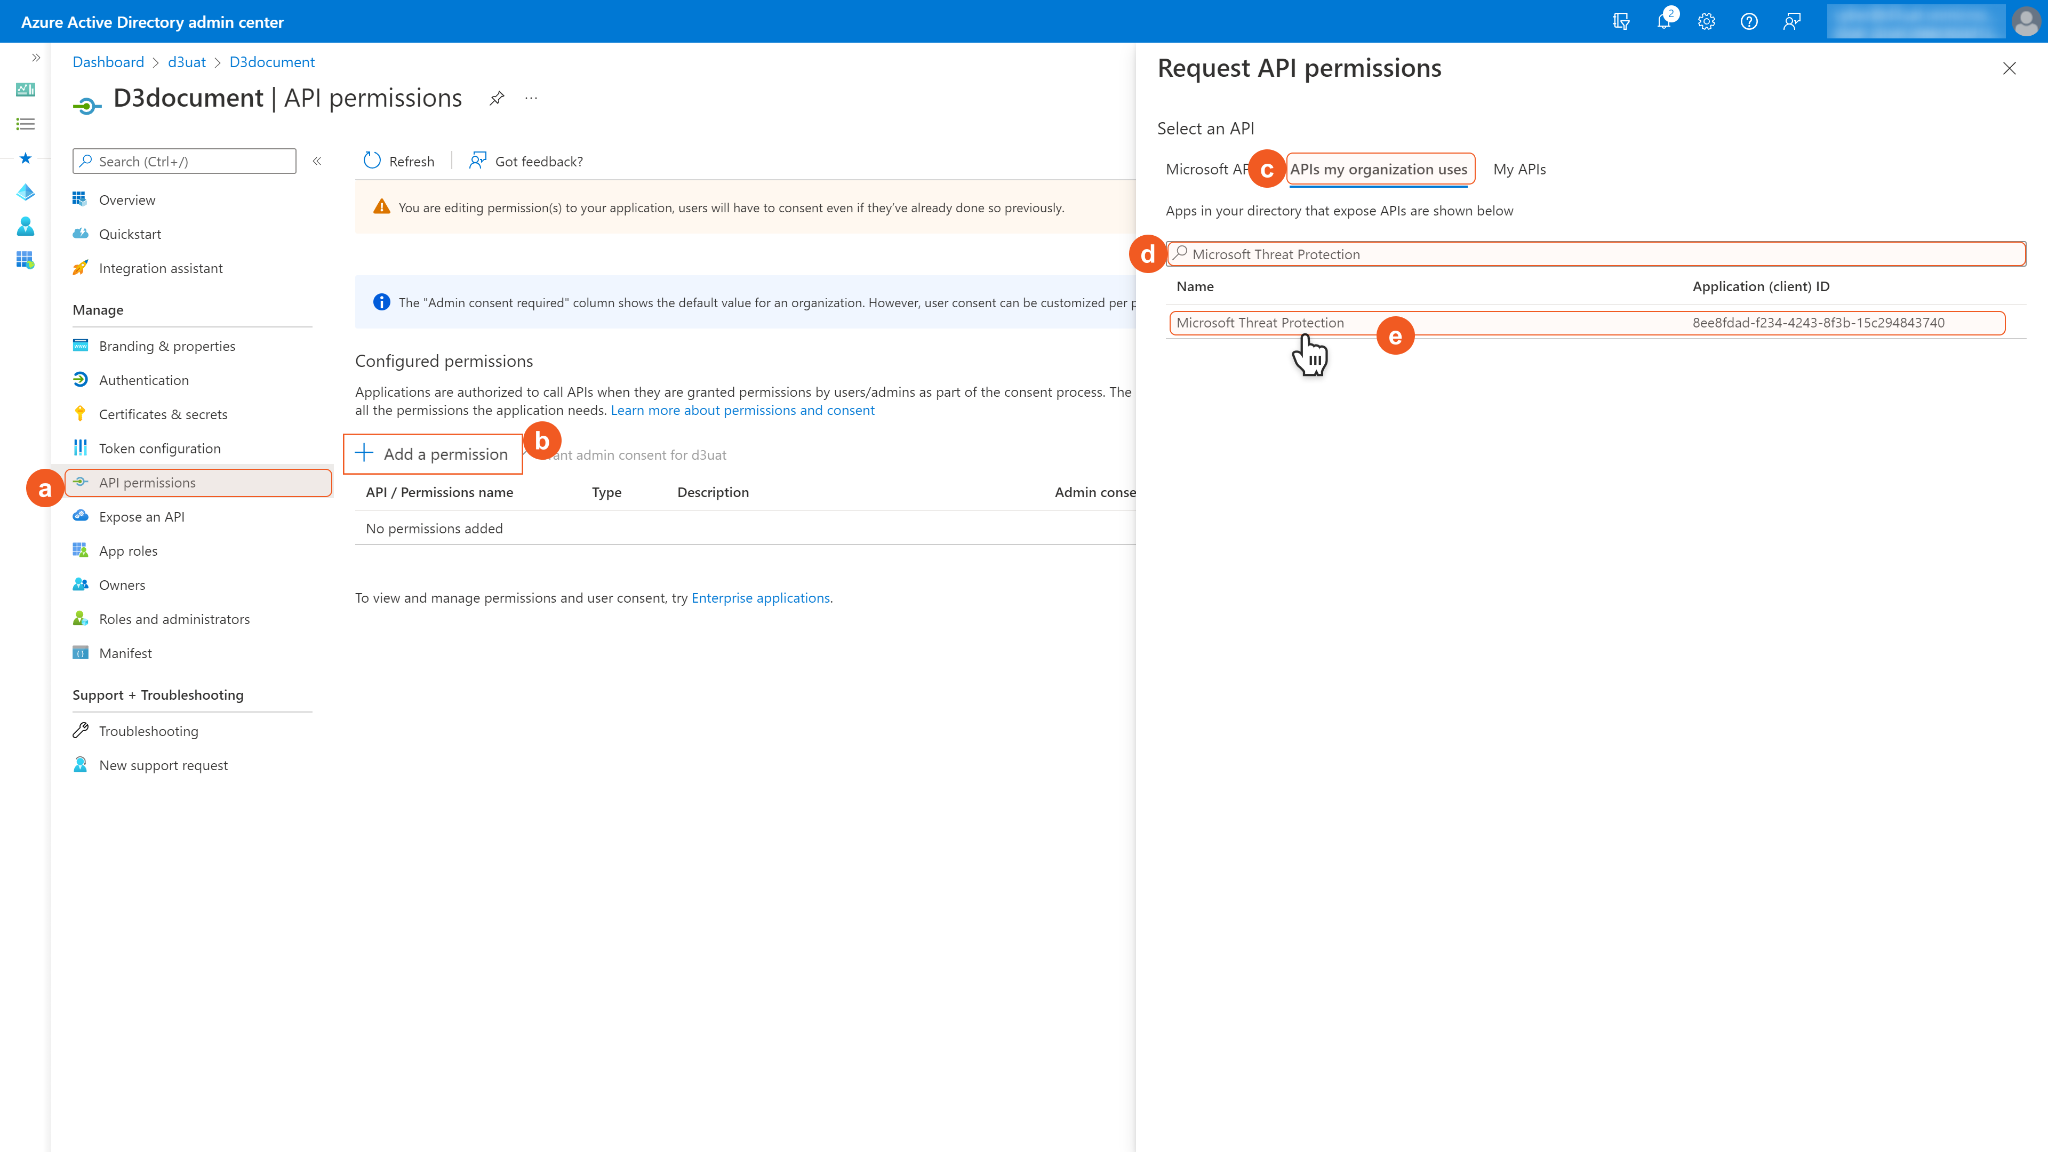
Configure the API permissions. Click API permissions on the left navigation menu, then + Add a permission. To run all commands, designated users will need to have both Microsoft Graph permissions and Microsoft Threat Protection permissions. For each command's details, please refer to the Permission Requirements section.
To set up graph permissions, select Microsoft Graph.
To set up ms threat protection permissions, choose APIs my organization uses, then search and select Microsoft Threat Protection.
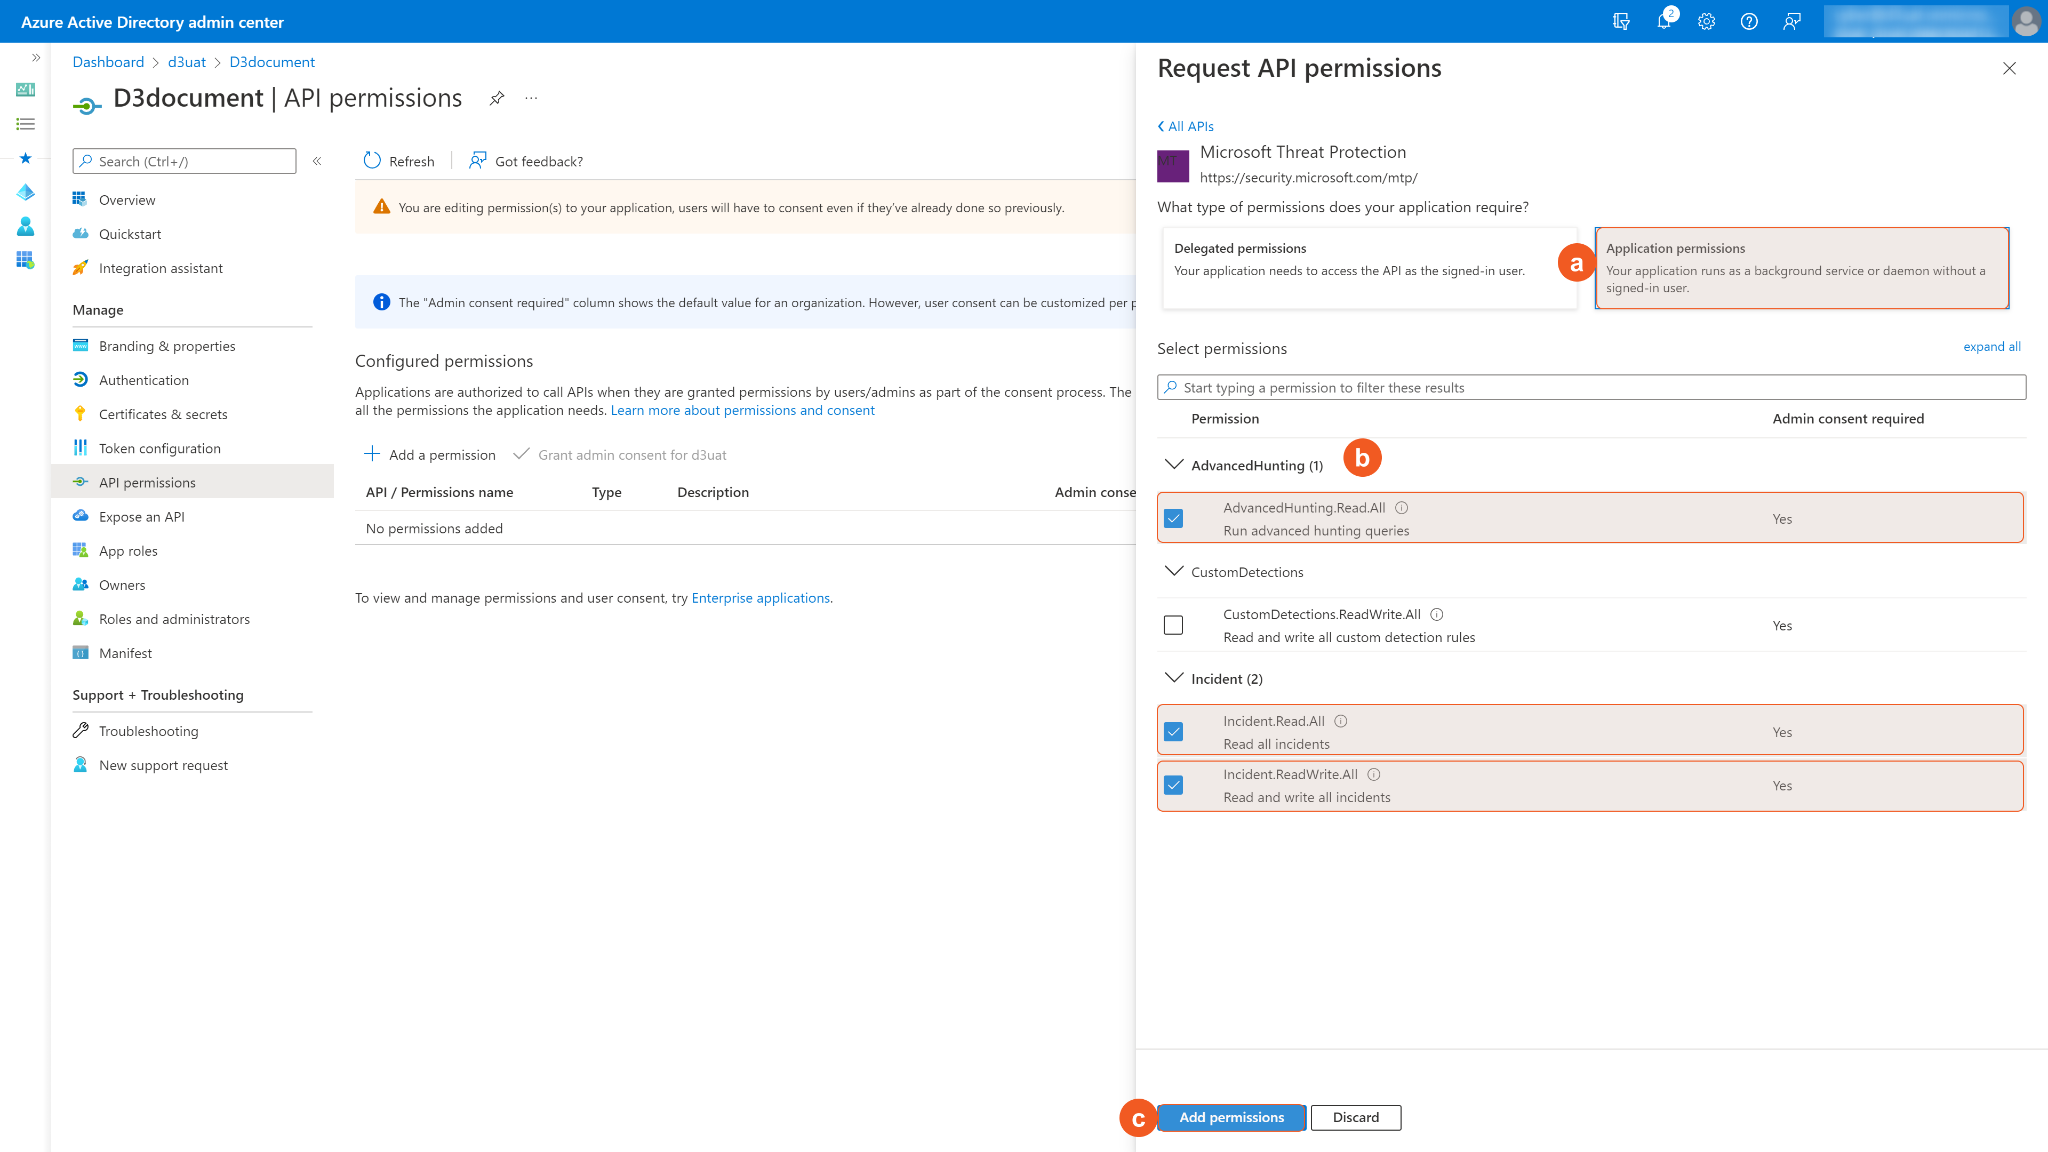
Select the required Application permissions and choose the permissions you need. Then Add permissions.
Some permissions may need to be granted admin consent for d3uat to use. Ensure Grant admin consent for d3uat is checked.
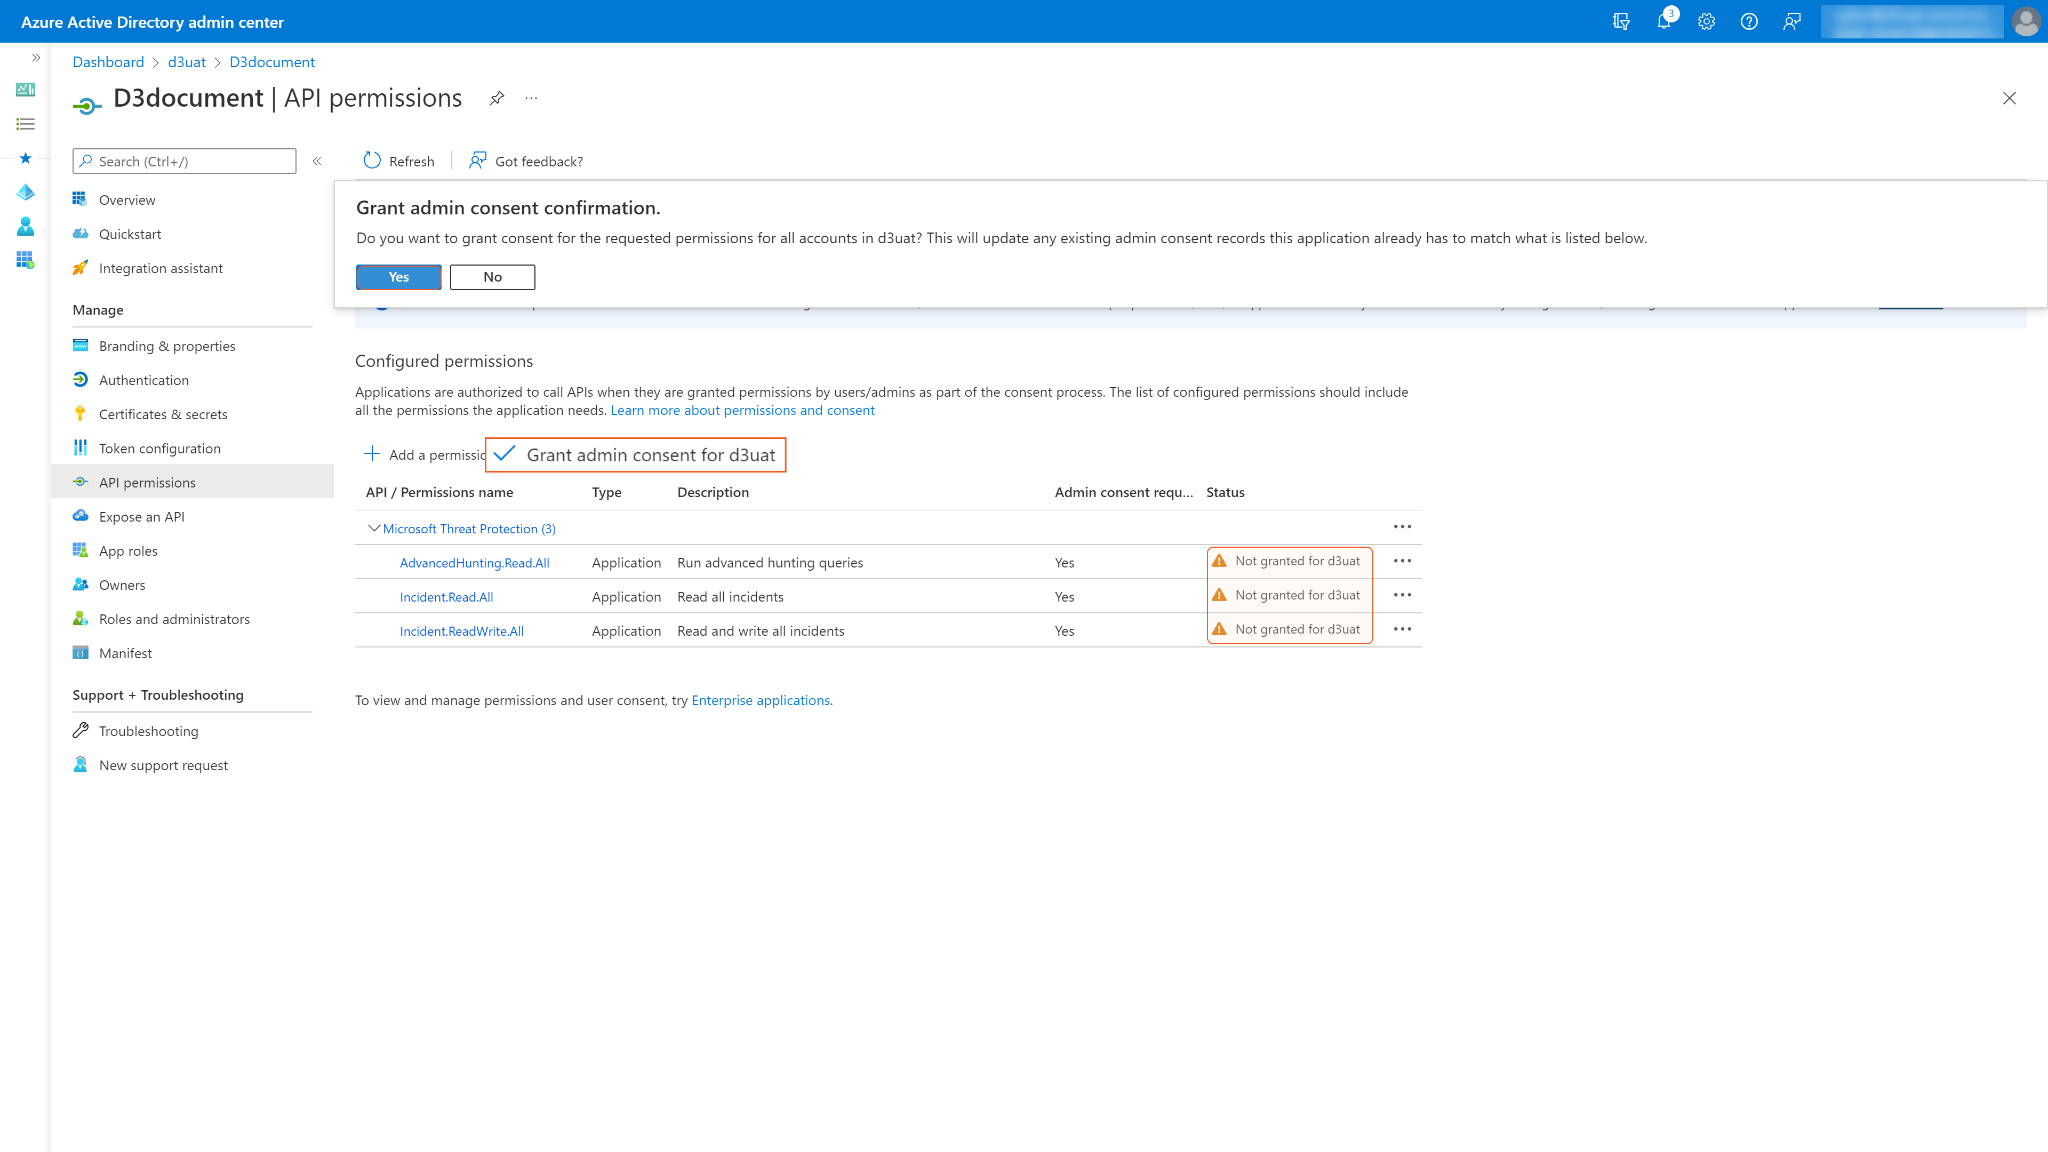
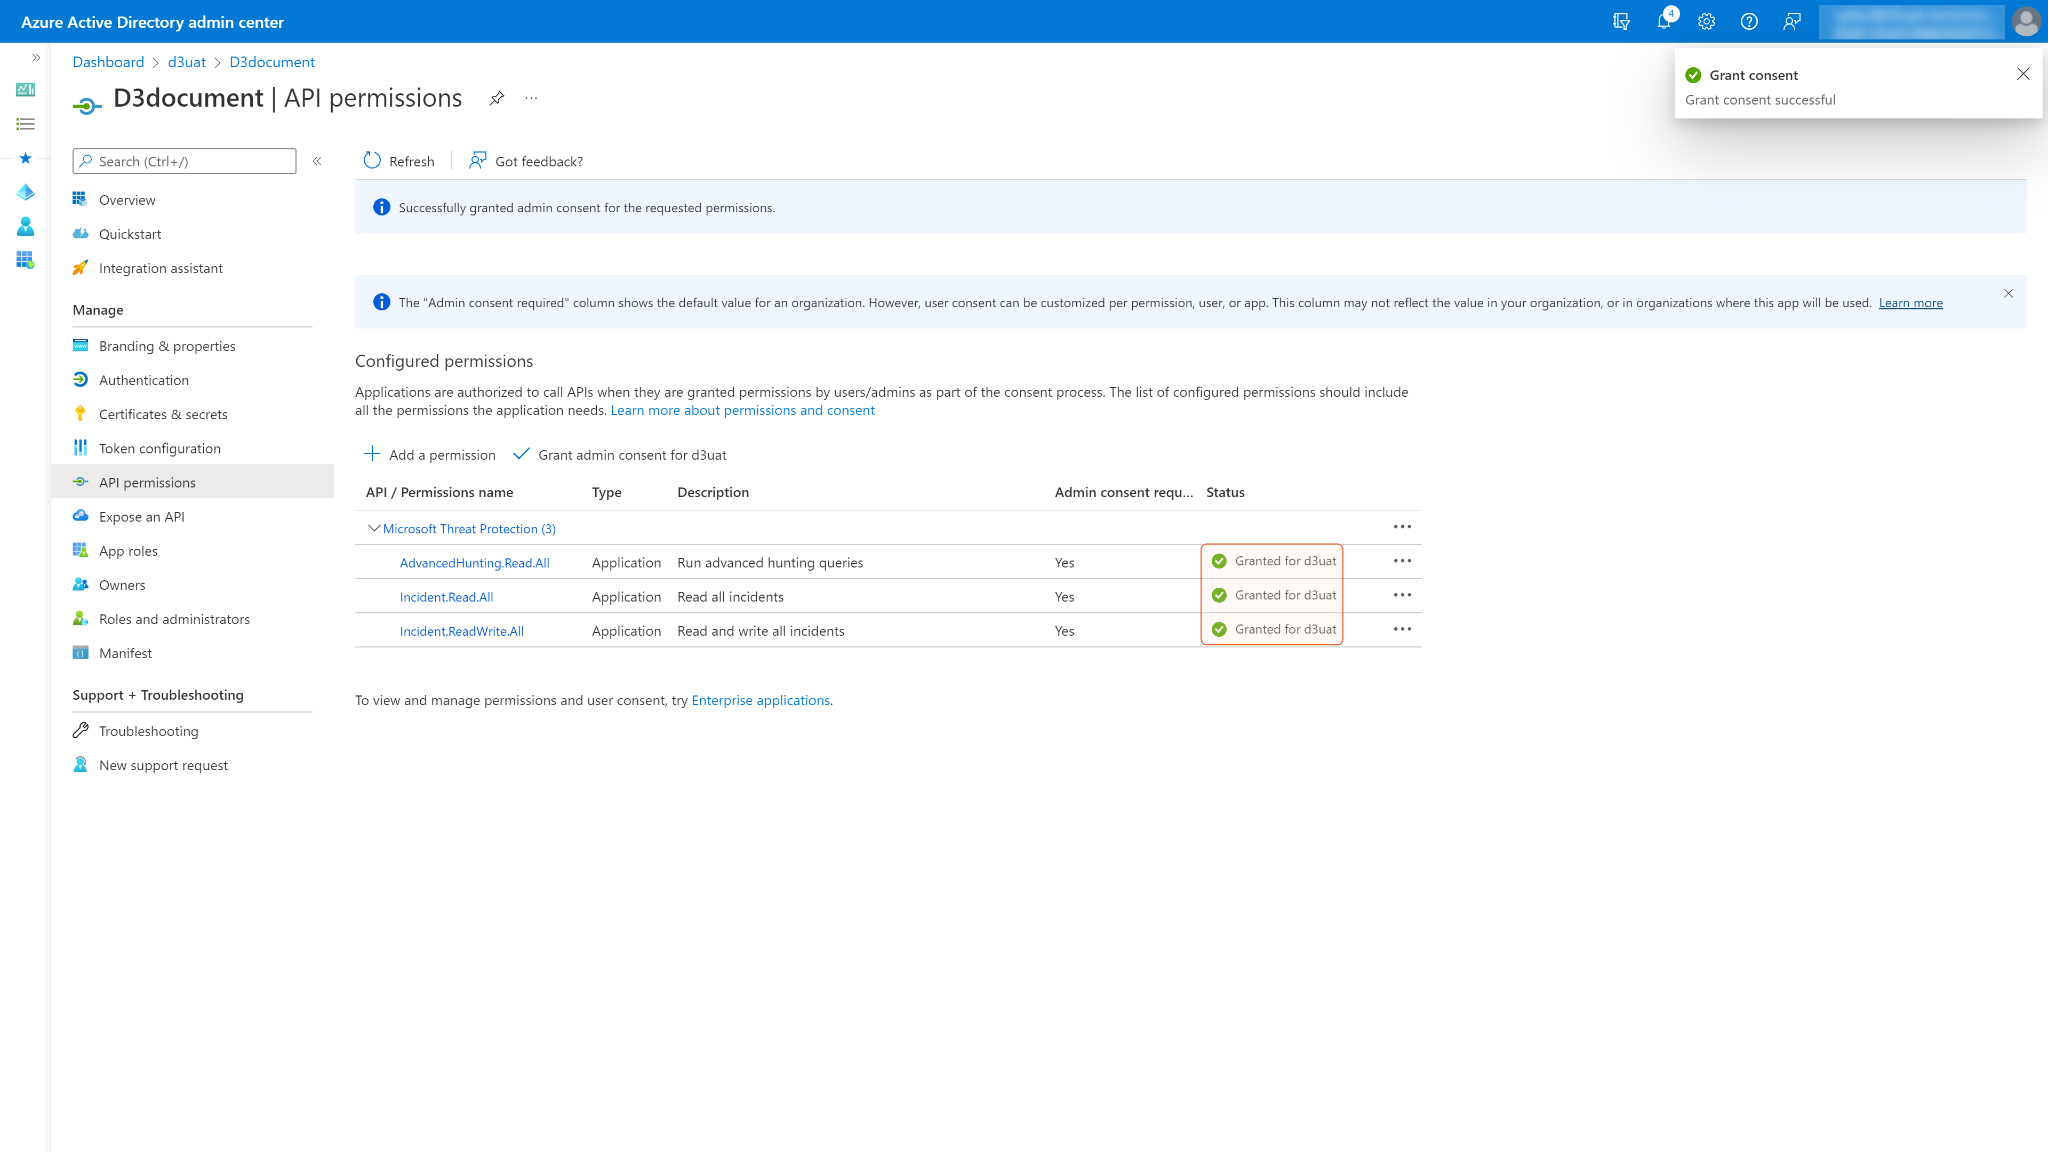
You may see Not granted for d3uat in the status column. Those are the ungranted permissions you want to use. After you successfully grant permissions, a green checkmark will appear under the permission status column for the corresponding permissions. If your login account does not have admin privileges, ask your admin to grant consent.
Configuring D3 SOAR to Work with Microsoft 365 Defender
Log in to D3 SOAR.
Find the Microsoft 365 Defender integration.
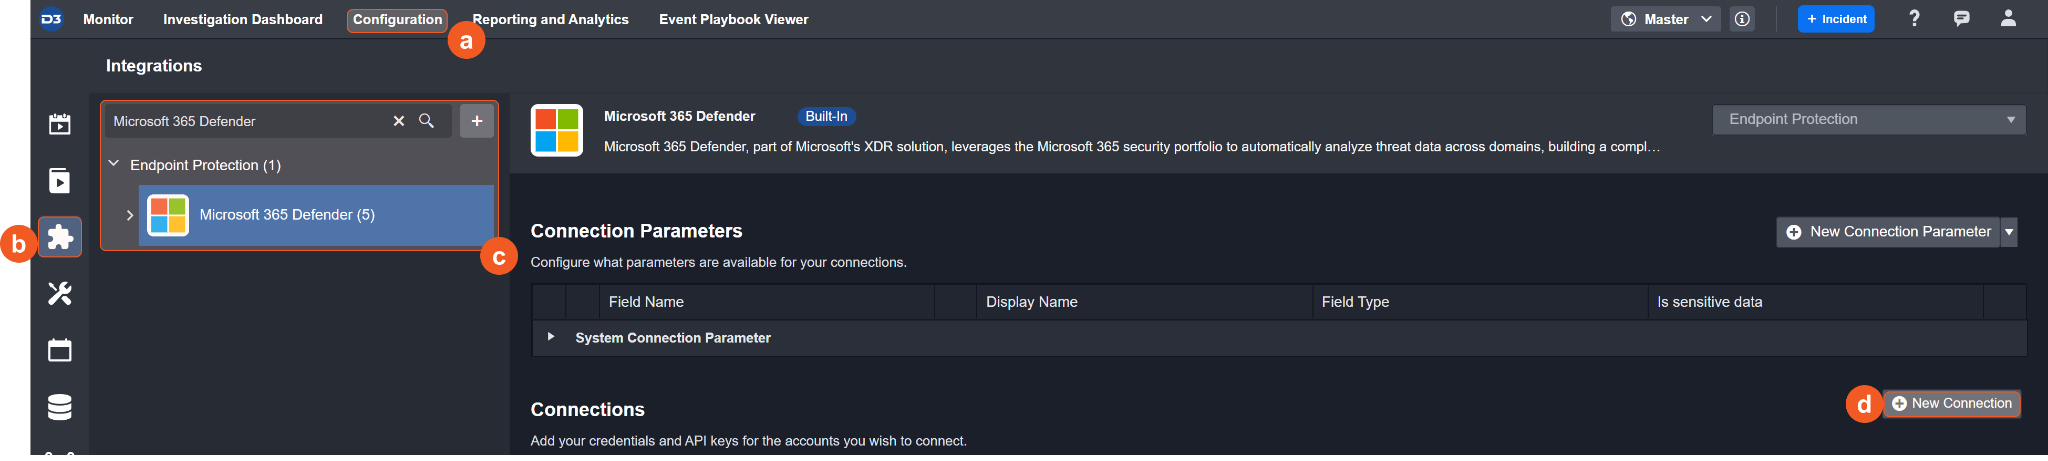
Navigate to Configuration on the top header menu.
Click on the Integration icon on the left sidebar.
Type Microsoft 365 Defender in the search box to find the integration, then click it to select it.
Click + Connection, on the right side of the Connections section. A new connection window will appear.
Configure the following fields to create a connection to Microsoft 365 Defender.
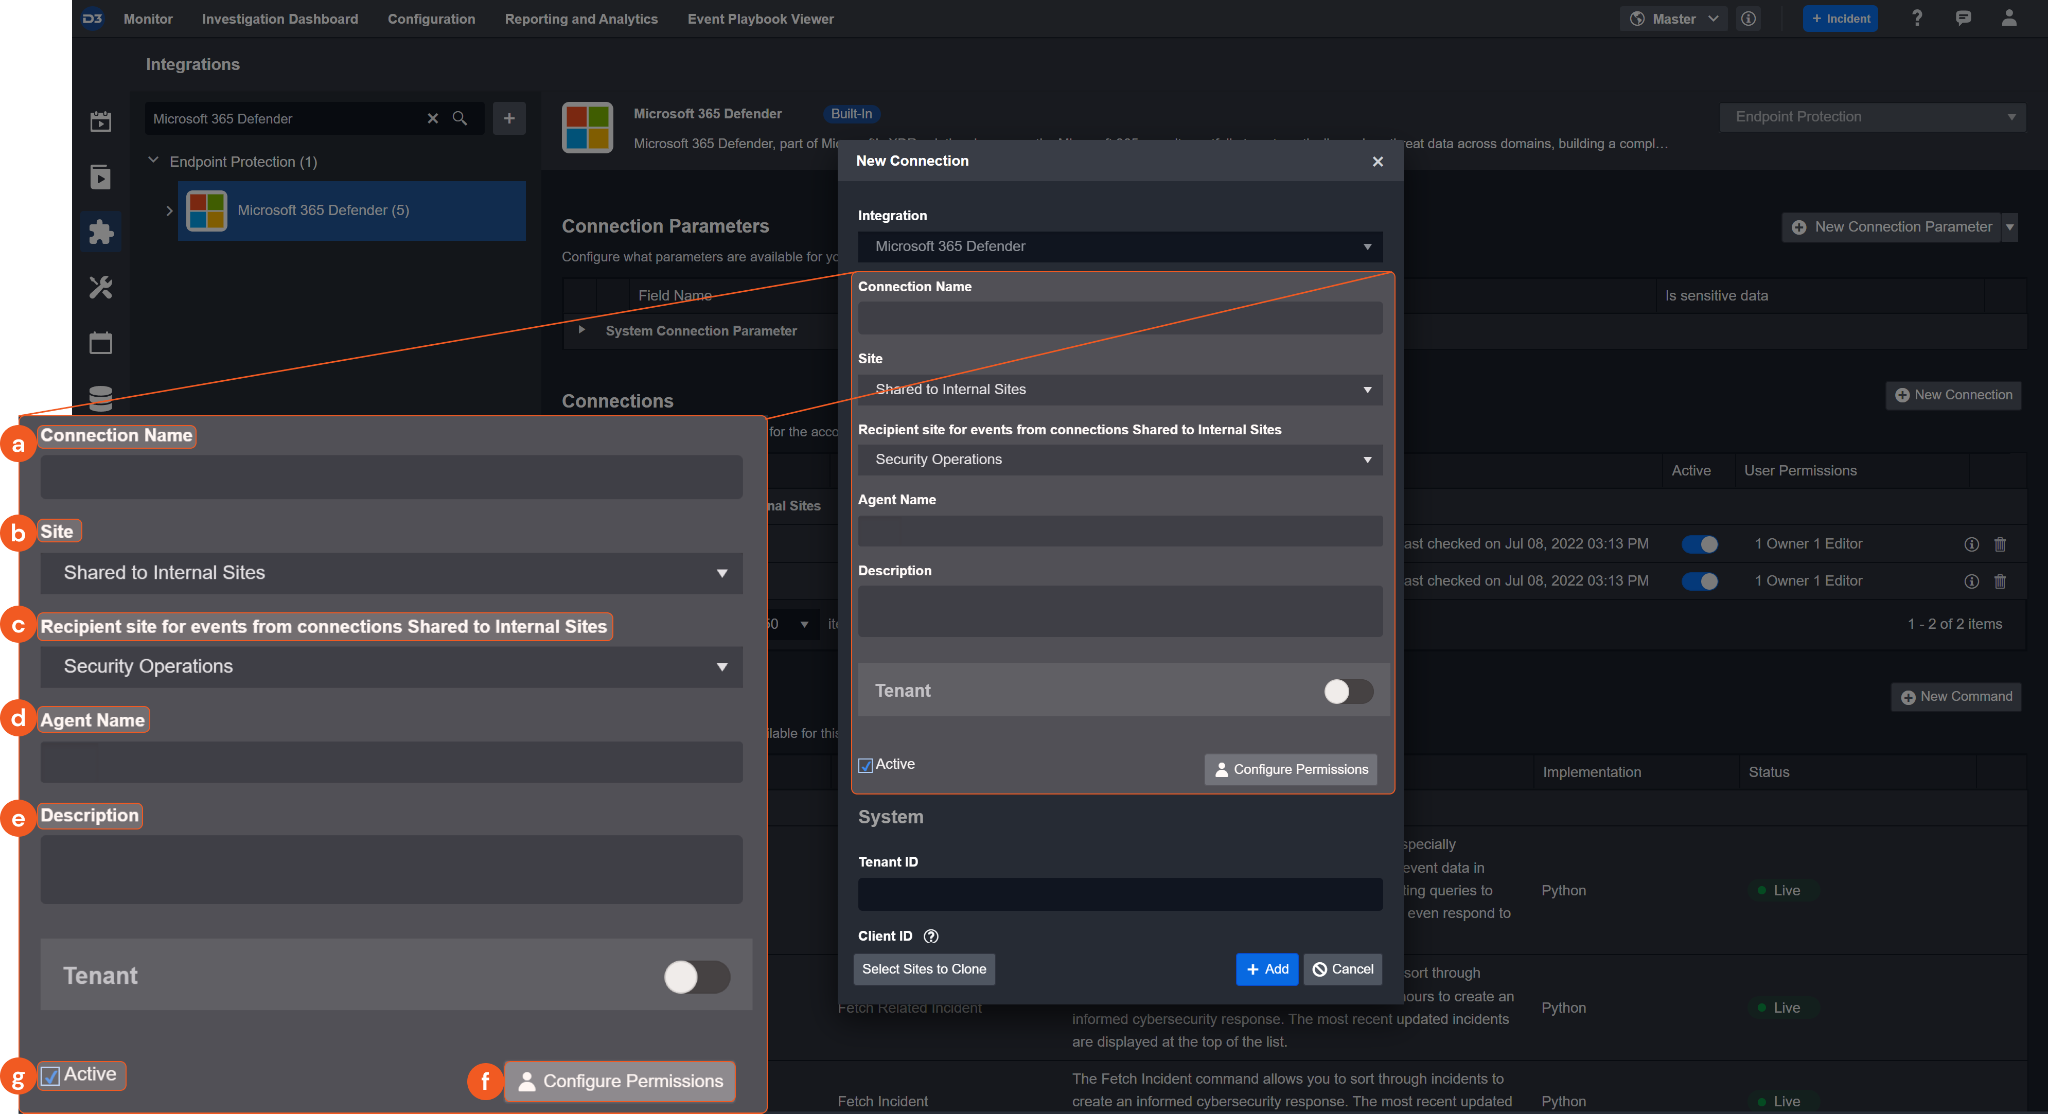
Connection Name: The desired name for the connection.
Site: Specifies the site to use the integration connection. Use the drop-down menu to select the site. The Share to Internal Sites option enables all sites defined as internal sites to use the connection. Selecting a specific site will only enable that site to use the connection.
Recipient site for events from connections Shared to Internal Sites: This field appears if you selected Share to Internal Sites for Site to let you select the internal site to deploy the integration connection.
Agent Name (Optional): Specifies the proxy agent required to build the connection. Use the dropdown menu to select the proxy agent from a list of previously configured proxy agents.
Description (Optional): Add your desired description for the connection.
Configure User Permissions: Defines which users have access to the connection.
Active: Check the tick box to ensure the connection is available for use.
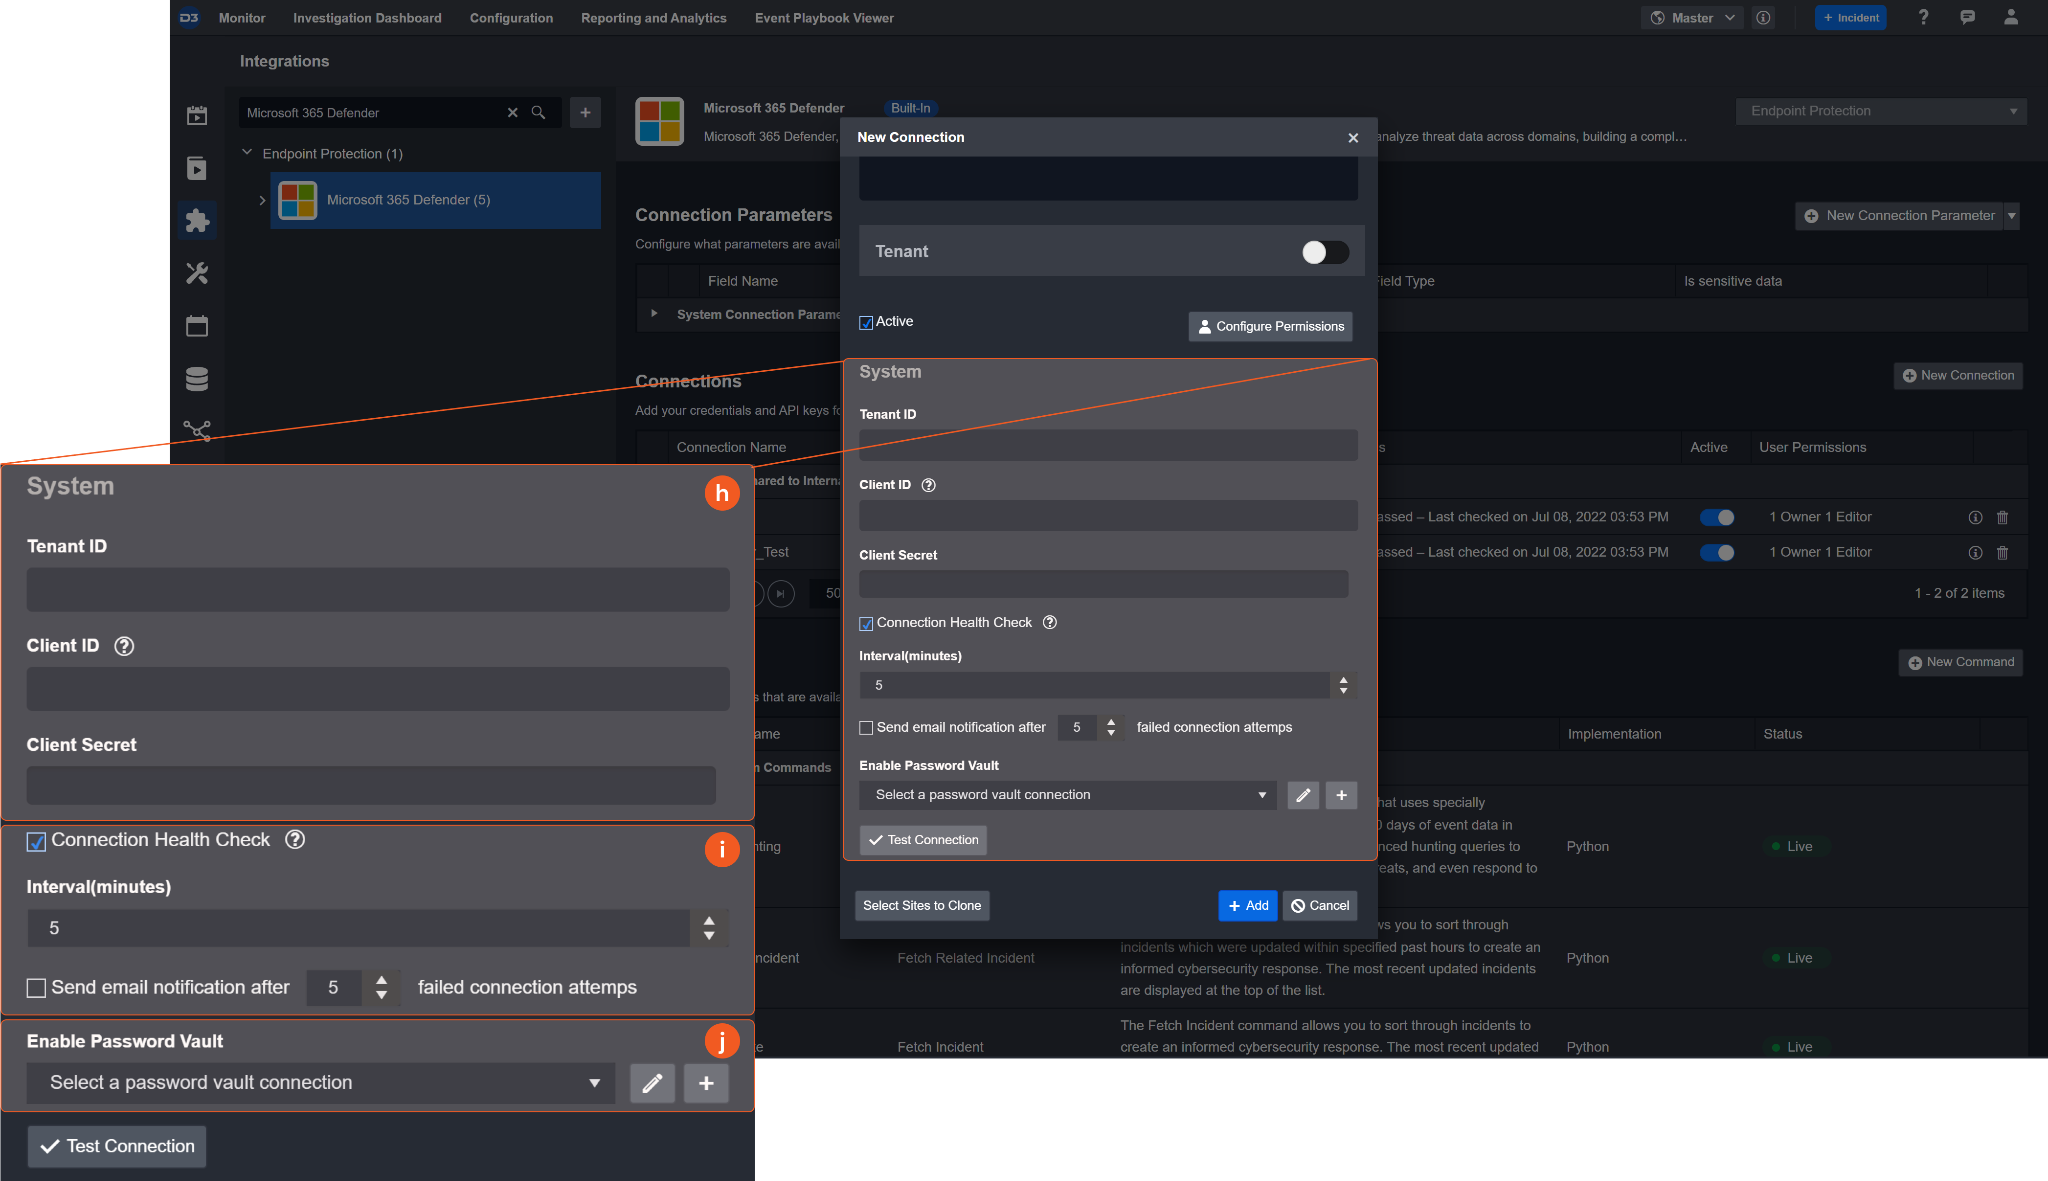
System: This section contains the parameters defined specifically for the integration. These parameters must be configured to create the integration connection.
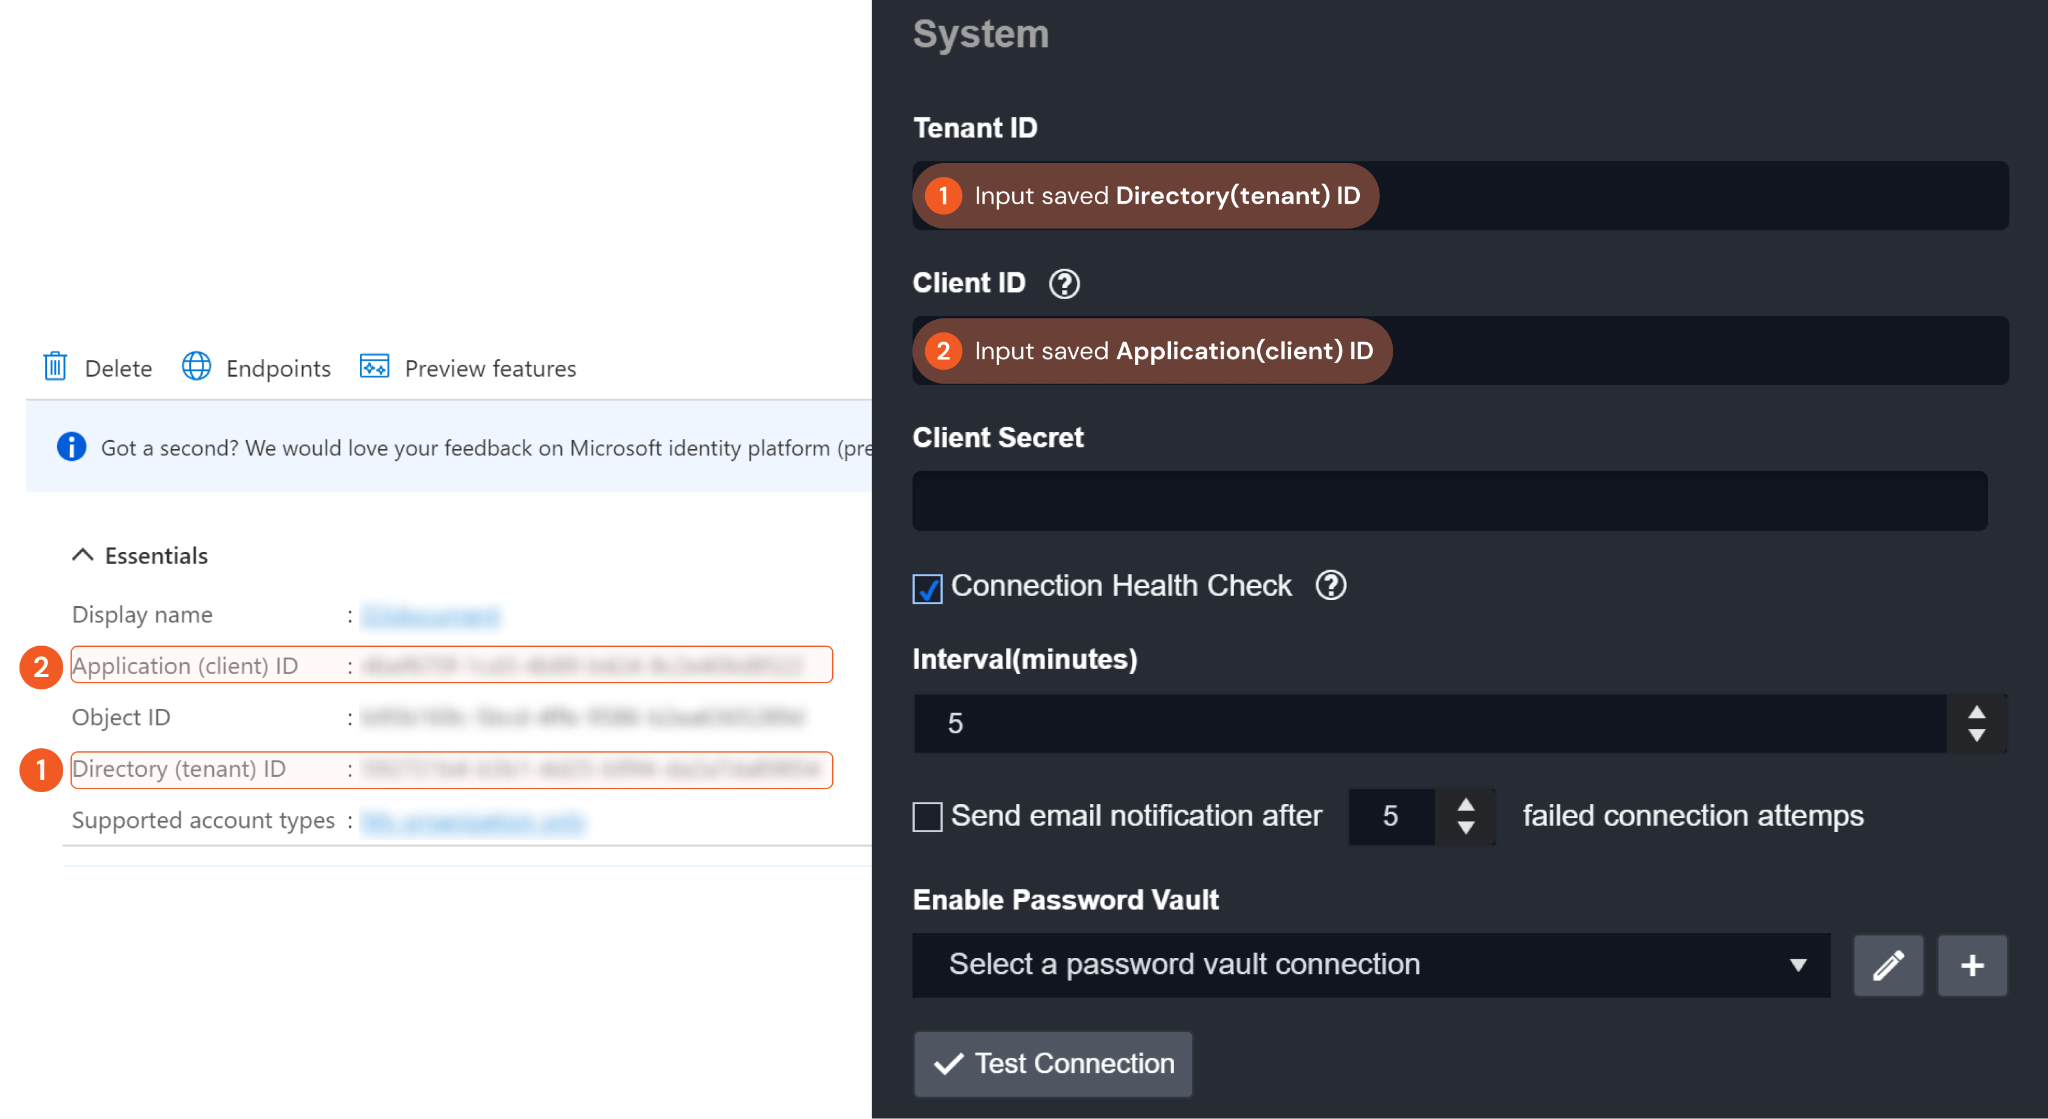
1. Input the previously saved Directory (tenant) ID into the Tenant ID field. Please refer to step 6 of Configuring Microsoft 365 Defender to Work with D3 SOAR.
2. Input the previously saved Application (client) ID into the Client ID field. Please refer to step 6 of Configuring Microsoft 365 Defender to Work with D3 SOAR.
3. Input the previously saved value to the Client Secret field. Please refer to step 8 of Configuring Microsoft 365 Defender to Work with D3 SOAR.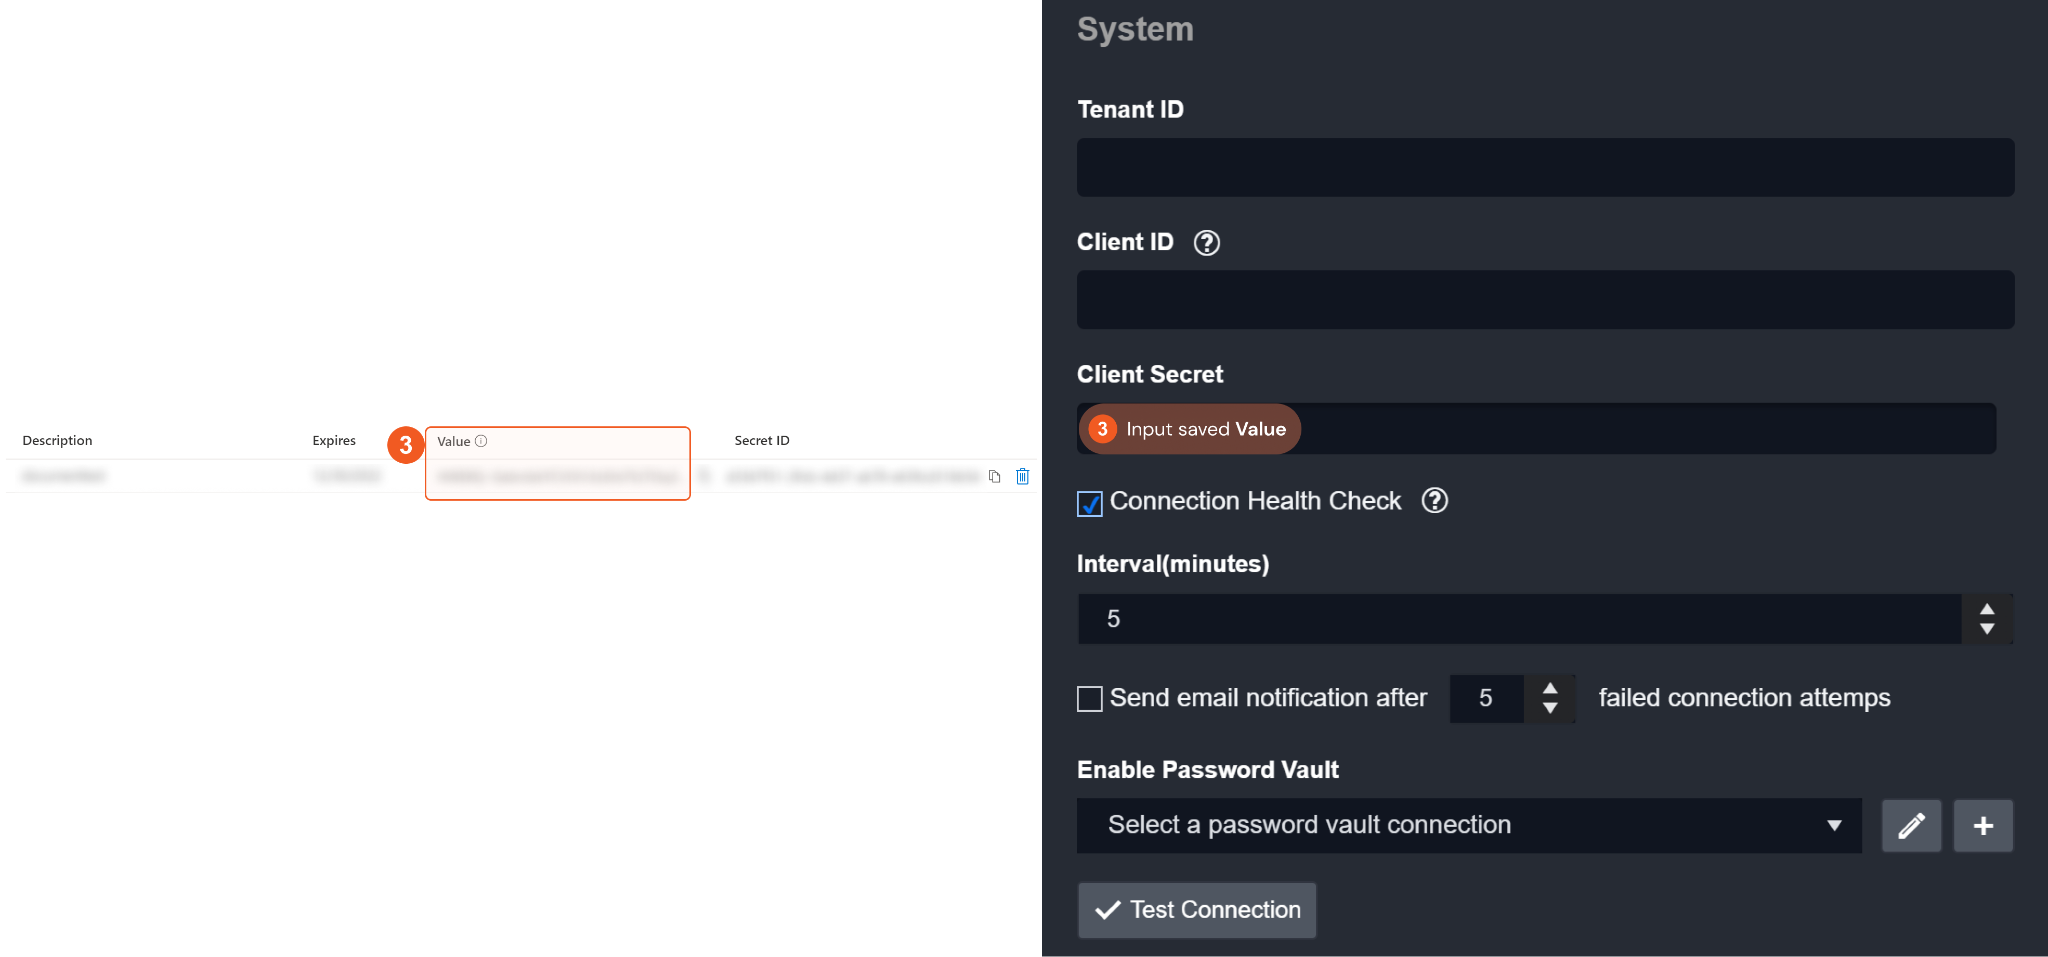
Connection Health Check: Updates the connection status you have created. A connection health check is done by scheduling the Test Connection command of this integration. This can only be done when the connection is active.
To set up a connection health check, check the Connection Health Check tickbox. You can customize the interval (minutes) for scheduling the health check. An email notification can be set up after a specified number of failed connection attempts.Enable Password Vault: An optional feature that allows users to take the stored credentials from their own password vault. Please refer to the password vault connection guide if needed.
Test the connection.
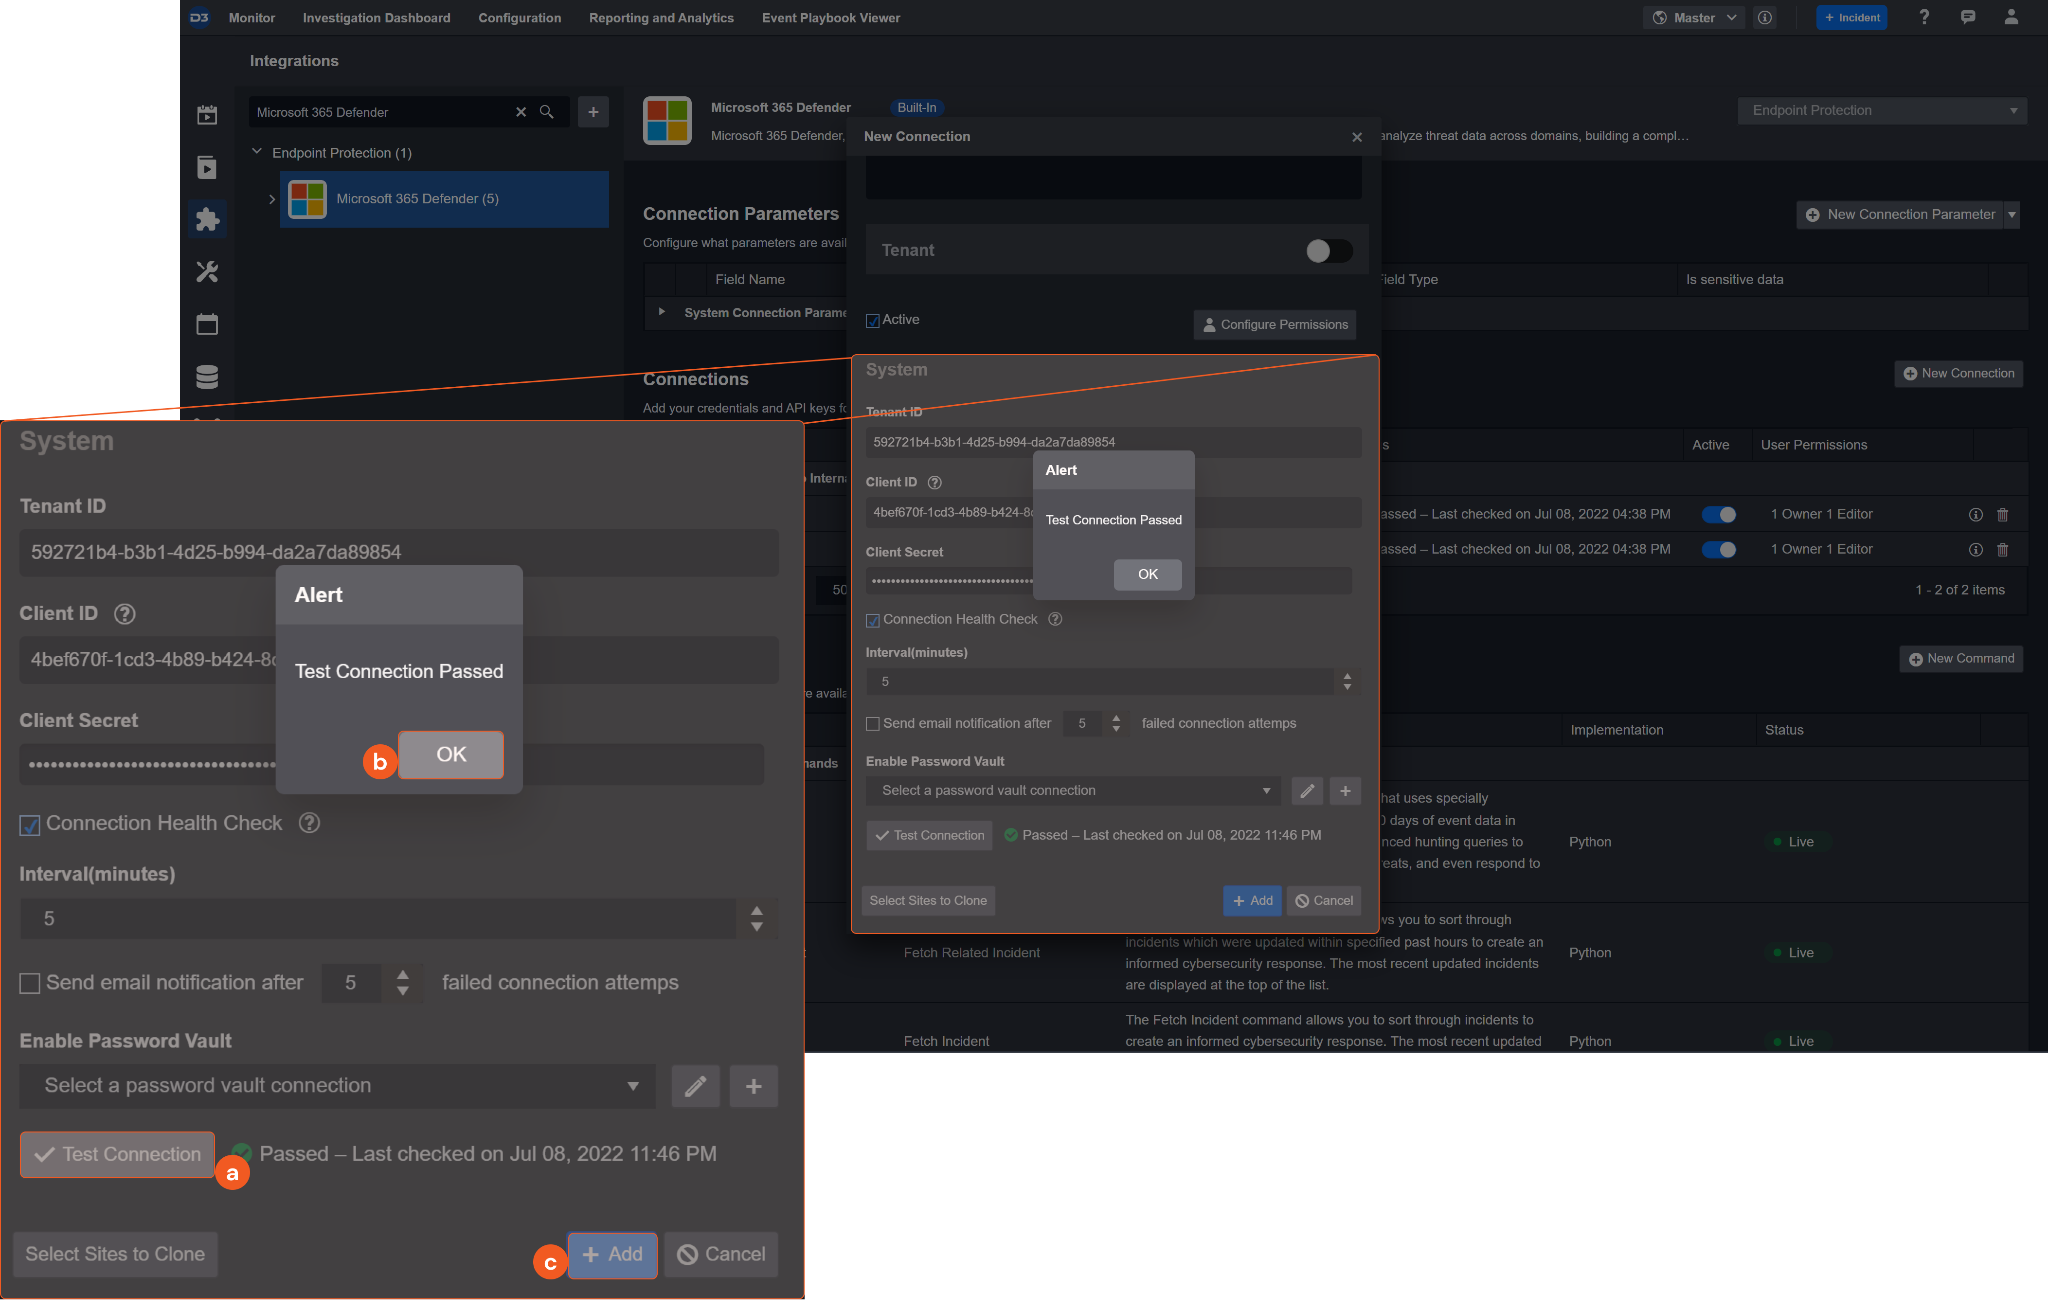
Click Test Connection to verify the account credentials and network connection. If the Test Connection Passed alert window appears, the test connection is successful. You will see Passed with a green checkmark appear beside the Test Connection button. If the test connection fails, please check your connection parameters and try again.
Click OK to close the alert window.
Click + Add to create and add the configured connection.
Commands
Microsoft 365 Defender includes the following executable commands for users to set up schedules or create playbook workflows. With the Test Command, you can execute these commands independently for playbook troubleshooting.
Integration API Note
For more information about the Microsoft 365 Defender API, please refer to the Microsoft 365 Defender API reference.
READER NOTE
Certain permissions are required for each command. Please refer to the Permission Requirements and Configuring Microsoft 365 Defender to Work with D3 SOAR for detailed information.
Note for Time-related parameters
The input format of time-related parameters may vary based on your account settings. As a result, the sample data provided in our commands is different from what you see. To set your preferred time format, follow these steps:
Navigate to Configuration > Application Settings. Select Date/Time Format.
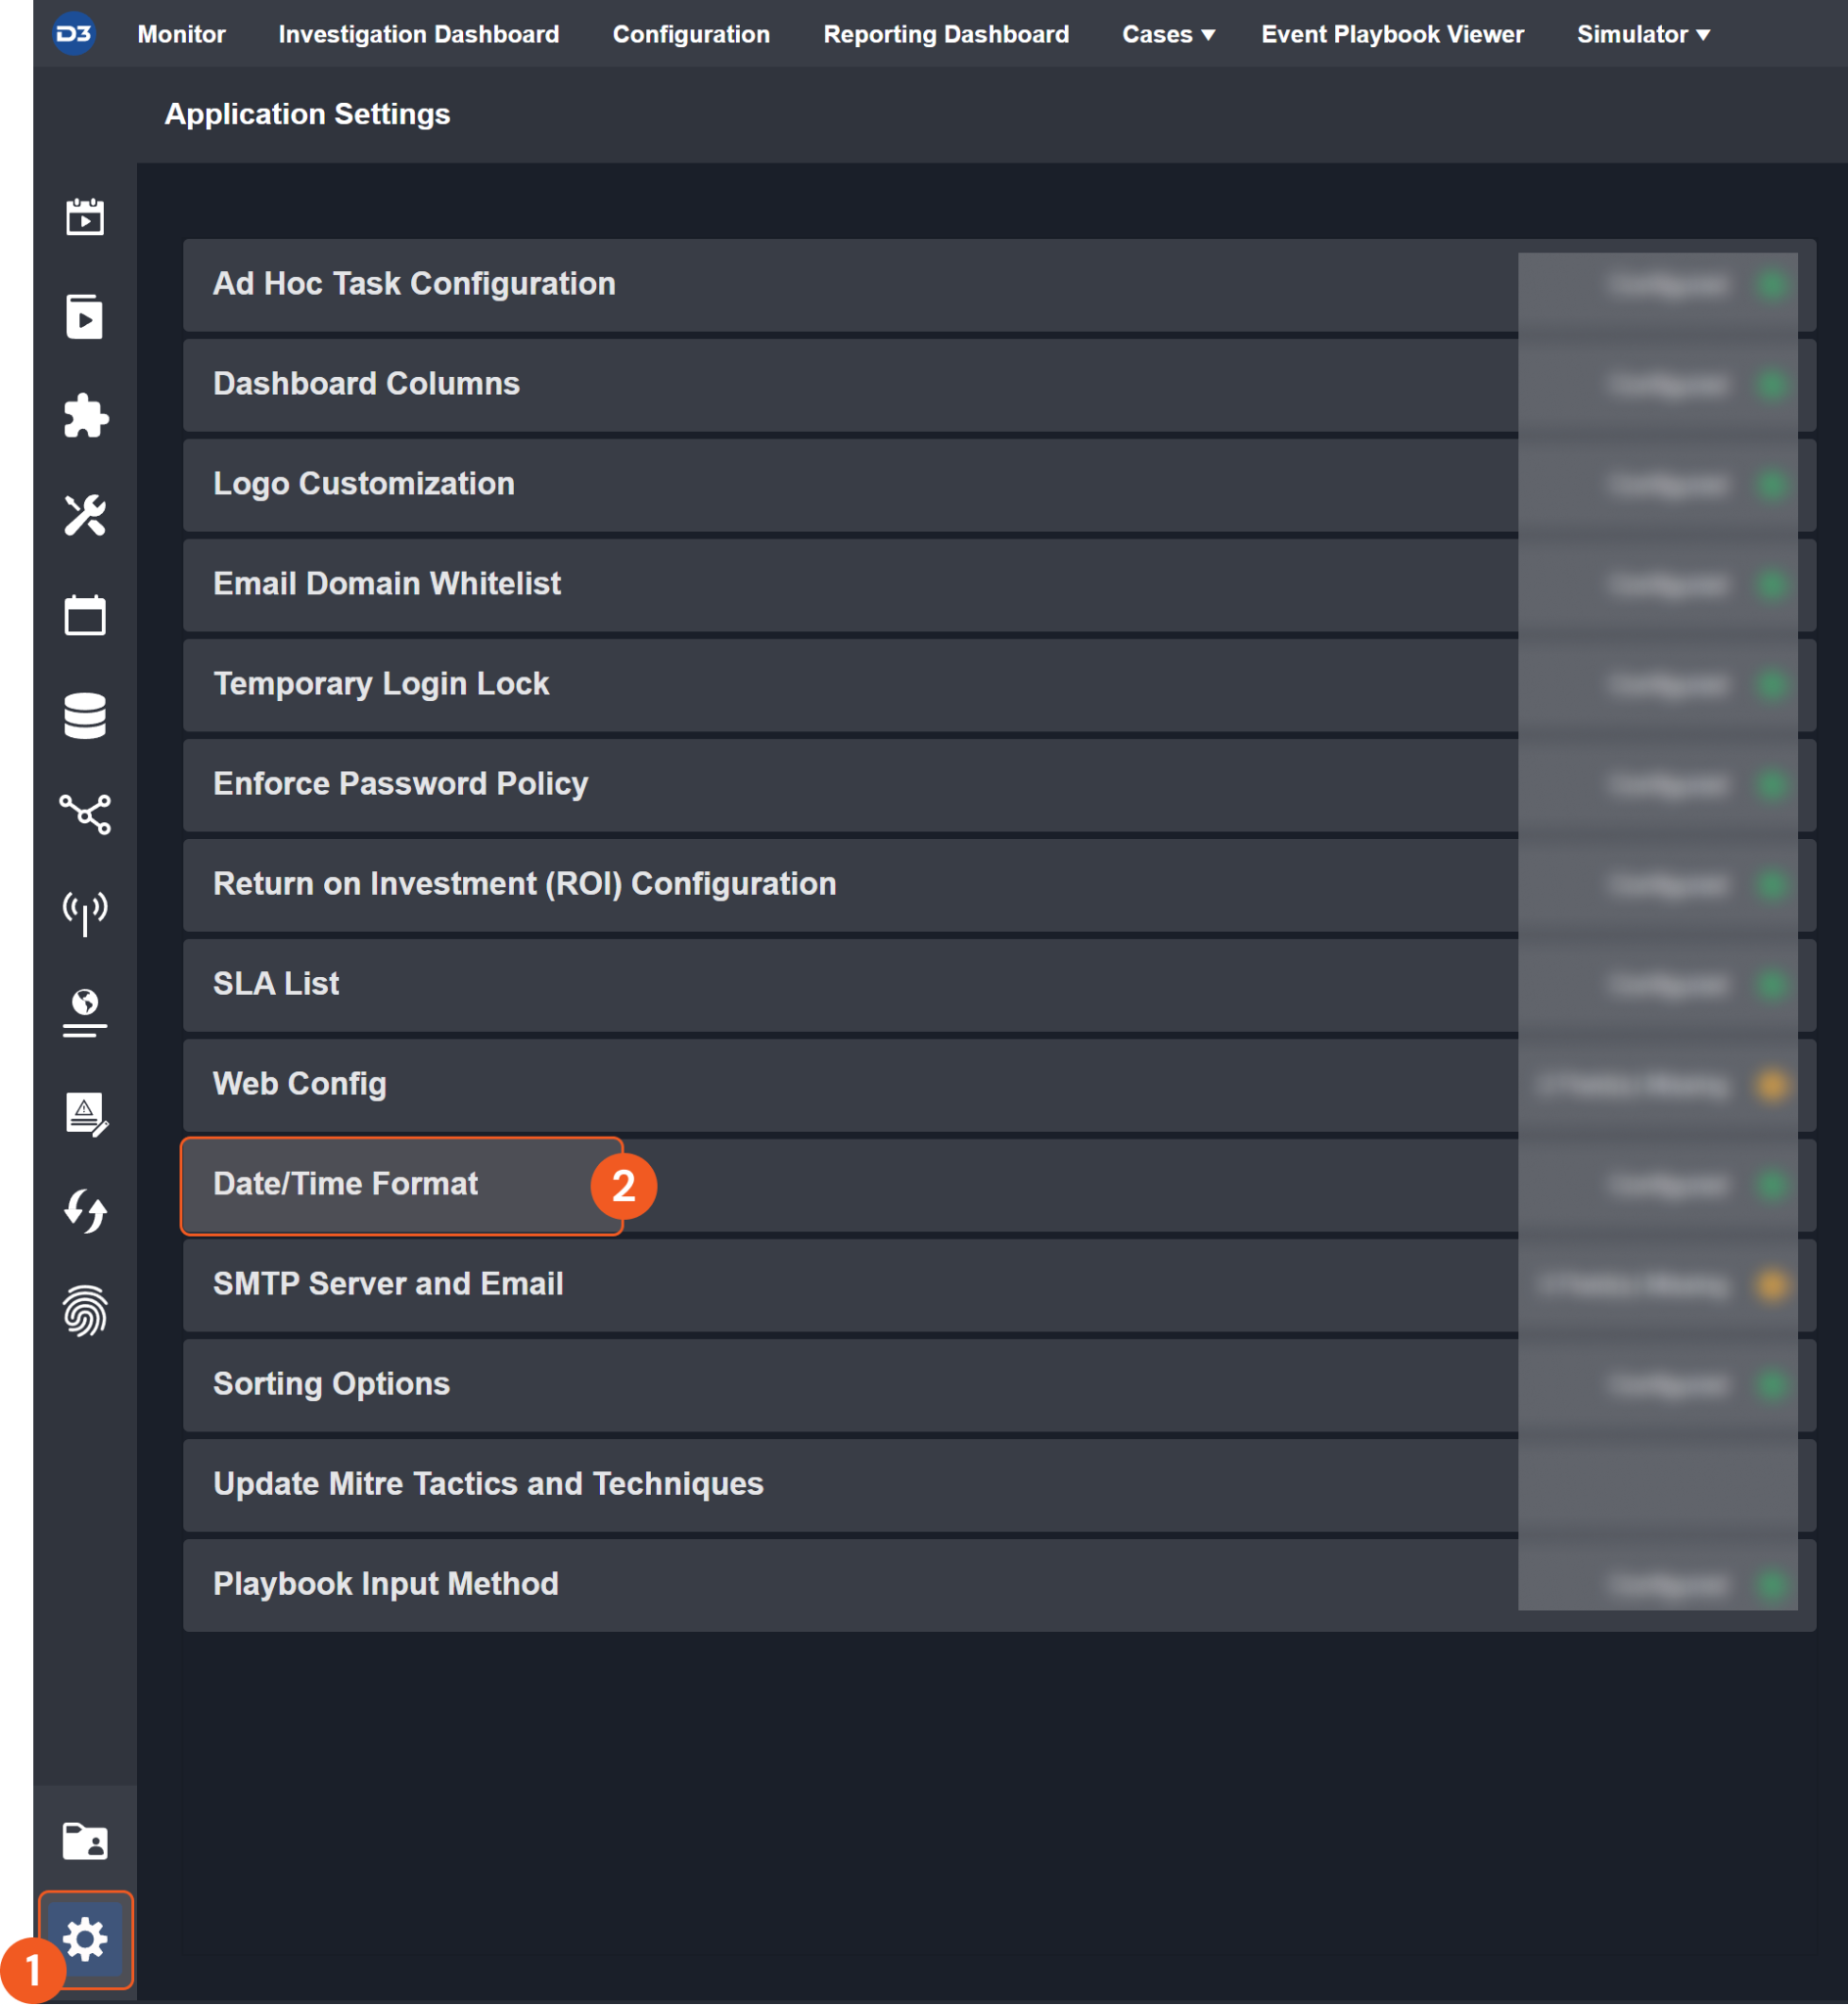
Choose your desired date and time format.
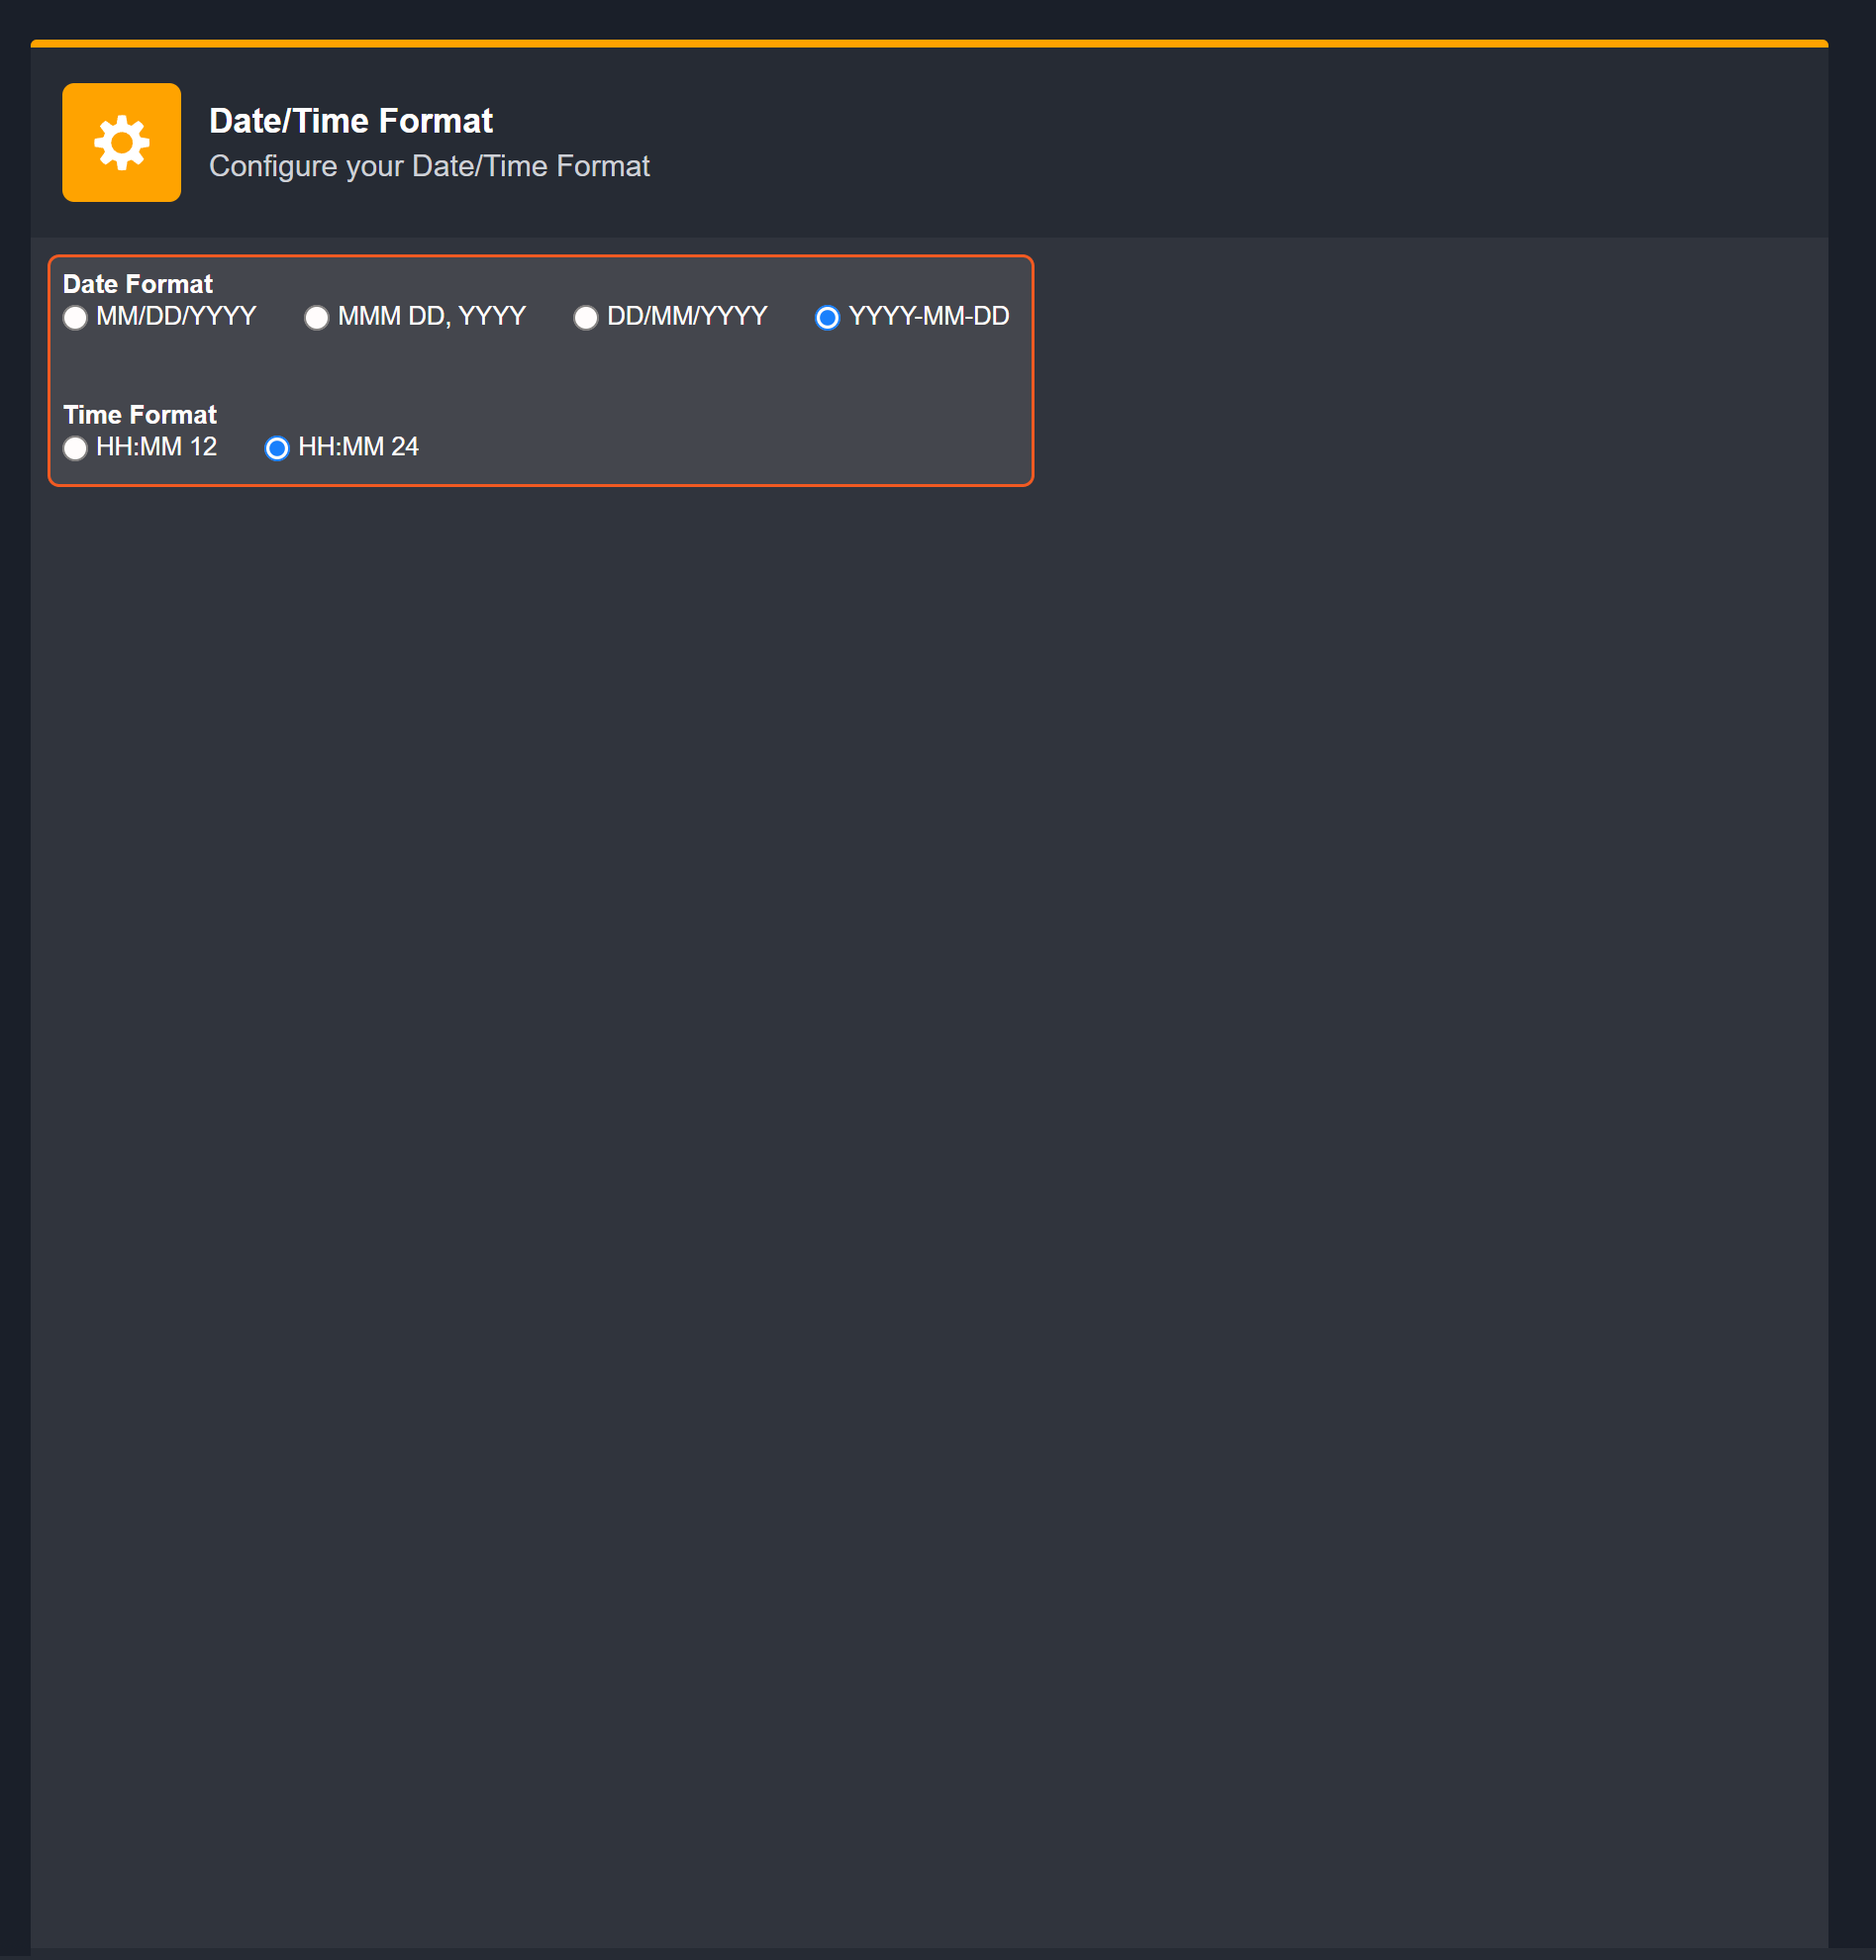
After that, you will be able to view your preferred time format when configuring the DateTime input parameters for commands.
Advanced Hunting
Examines event data from the past 30 days in Microsoft 365 Defender and detects threats using specially constructed queries. Advanced hunting queries can be used to inspect unusual activities, detect possible threats, and even respond to attacks.
READER NOTE
Queries can only run on data from the last 30 days.
A maximum of 100,000 rows can be included in the results.
The max limit of executions per tenant are as follows:
API calls: Up to 45 calls per minute, up to 1500 calls per hour.
Execution time: 10 minutes of running time every hour and 3 hours of running time a day.
The maximal execution time of a single request is 200 seconds.
The error ‘429 response’ will represent reaching quota limit either by number of requests or by CPU. Read the response body to understand what limit has been reached.
The maximum size of a single query result request cannot exceed 124 MB. If exceeded, HTTP 400 Bad Request with the message "Query execution has exceeded the allowed result size. Optimize your query by limiting the number of results and try again" will be displayed.
Input
Input Parameter | Required /Optional | Description | Example |
Query | Required | The Kusto query string to define the search query. Please refer to Kusto Query Language (KQL) for how to use the language. Please note that KQL is case-sensitive, including table names, table column names, operators, functions, etc. | EmailEvents | where RecipientEmailAddress == "phish@d3soar.com" | project Timestamp, SenderMailFromAddress, SenderIPv4, RecipientEmailAddress, Subject, InternetMessageId | order by Timestamp desc | limit 3 |
Output
Error Handling
If the Return Data is Failed, an Error tab will appear in the Test Result window.
The error tab contains the details responded from D3 SOAR or third-party API calls, including Failure Indicator, Status Code, and Message. This can help you locate the root cause of a command failure.
Parts in Error | Description | Example |
Failure Indicator | Indicates the command failure that happened at a specific input and/or API call. | Advanced Hunting failed. |
Status Code | The response code issued by the third-party API server or the D3 SOAR system that can be used to locate the corresponding error category. For example, if the returned status code is 401, the selected connection is unauthorized to run the command. The user or system support would need to check the permission setting in the Microsoft 365 Defender portal. Refer to the Common Microsoft 365 Defender REST API Error Codes for details. | Status Code: 400. |
Message | The raw data or captured key error message from the integration API server about the API request failure. | Message: Invalid query. |
Error Sample Data Advanced Hunting failed. Status Code: 400. Message: Invalid query. |
Create Alert Comment
Creates a comment for the existing alert(s).
READER NOTE
The parameter Alert IDs is required to run this command.
Run the Fetch Event command to obtain Alert IDs. Alert IDs can be found in the returned raw data at the path $.value[*].id. Ensure the event type parameter of the fetch event command is set to Defender Alert when obtaining the alert IDs. The Threat Submission event type does not have alert IDs in its returned data.
Input
Input Parameter | Required /Optional | Description | Example |
Alert IDs | Required | The ID(s) of the alert(s) that still requires a comment. Alert IDs can be obtained by running the Fetch Event command with Event Type parameter choose to Defender Alert. Please note that only the Defender Alert type of events has the alert ID information. | ["**********************"] |
Comment | Required | The comment text added to the specified alert(s). | Alert comment test. 0901b |
Output
Error Handling
If the Return Data is Partially Successful or Failed, an Error tab will appear in the Test Result window.
The error tab contains the details responded from D3 SOAR or third-party API calls, including Failure Indicator, Status Code, and Message. This can help you locate the root cause of a command failure.
Parts in Error | Description | Example |
Failure Indicator | Indicates the command failure that happened at a specific input and/or API call. | Create Alert Comment failed. |
Status Code | The response code issued by the third-party API server or the D3 SOAR system that can be used to locate the corresponding error category. For example, if the returned status code is 401, the selected connection is unauthorized to run the command. The user or system support would need to check the permission setting in the Microsoft 365 Defender portal. Refer to the Common Microsoft 365 Defender REST API Error Codes for details. | Status Code: 404. |
Message | The raw data or captured key error message from the integration API server about the API request failure. | Message: Alert IDs Not Found. |
Error Sample Data Create Alert Comment failed. Status Code: 404. Message: Alert IDs Not Found. |
Fetch Event
Returns events from Defender based on the selected event type. Note: This API is under the beta version in Microsoft Graph and is subject to change. Use of these APIs in production applications is not supported.
Input
Input Parameter | Required /Optional | Description | Example |
Start Time | Optional | The start time for fetching threat submissions or defender alerts or incidents in UTC time. For the Threat Submission event type, emails reported after this time are returned. For the Defender Alert event type, alerts updated after this time will be returned. For the Incident event type, incidents updated after this time will be returned. For all three event types, if this parameter is not defined, the default start time is 30 days before the current time. | 2023-03-10 19:40 |
End Time | Optional | The end time for fetching threat submissions or defender alerts or incidents in UTC time. For the Threat Submission event type, emails reported before this time are returned. For the Defender Alert event type, alerts updated before this time will be returned. For the Incident event type, incidents updated after this time will be returned. If this parameter is not defined, the default end time is the current time. | 2023-03-10 21:40 |
Number of Event(s) Fetched | Optional | The maximum number of threat submissions, defender alerts or incidents to fetch. If not specified, all events matching the time range and search condition will be returned. | 10 |
Event Type | Optional | The event type to be fetched. The available options are Threat Submission, Defender Alert and Incident. If this parameter is not defined, the default value is Threat Submission. | Defender Alert |
Search Condition | Optional | The query to filter results. This parameter only applies to the Defender Alert and Incident event type. See OData queries with Microsoft Defender for Endpoint for more about the search syntax. Note: Not all properties are filterable. Available properties that support $filter for Alert include: lastUpdateTime, incidentId, InvestigationId, status, severity, and category. | Sample for Defender Alert type: serviceSource in ("microsoftDataLossPrevention") Sample for Incident type: status eq 'Active' |
Tolerance Scope | Optional | The tolerance scope in minutes of the query to ingest events between start and end time to avoid the loss of events. The events will be fetched between {Start Time - Tolerance Scope, End Time}. | 10 |
Output
Event Field Mapping
Please note that Fetch Event commands require event field mapping. Field mapping plays a key role in the data normalization process part of the event pipeline. Field mapping converts the original data fields from the different providers to the D3 fields which are standardized by the D3 Model. Please refer to Event and Incident Intake Field Mapping for details.
To customize field mapping, click + Add Field and add the custom field of your choice. You may also remove built-in field mappings by clicking x. Please note that two underscore characters will automatically prefix the defined Field Name as the System Name for a custom field mapping. Additionally, if an input Field Name contains any spaces, they will automatically be replaced with underscores for the corresponding System Name.
Main Event JSON Path: $.value
The Main Event JSON Path determines the root path where the system starts parsing raw response data into D3 event data. The JSON path begins with $, representing the root element. The path is formed by appending a sequence of child elements to $, each separated by a dot (.). Square brackets with nested quotation marks (['...']) should be used to separate child elements in JSON arrays.Event Source for Incident
Configures the field mapping which are specific to the Incident-related events. If a source field in the field mapping is not found, the corresponding field mapping will be ignored. As the data of the Incident-related events have a character that the value of the eventType field is threatS ubmission, the Incident-related events can be defined by the Search String: {eventType}="incident". Click Edit Event Source to view the Search String.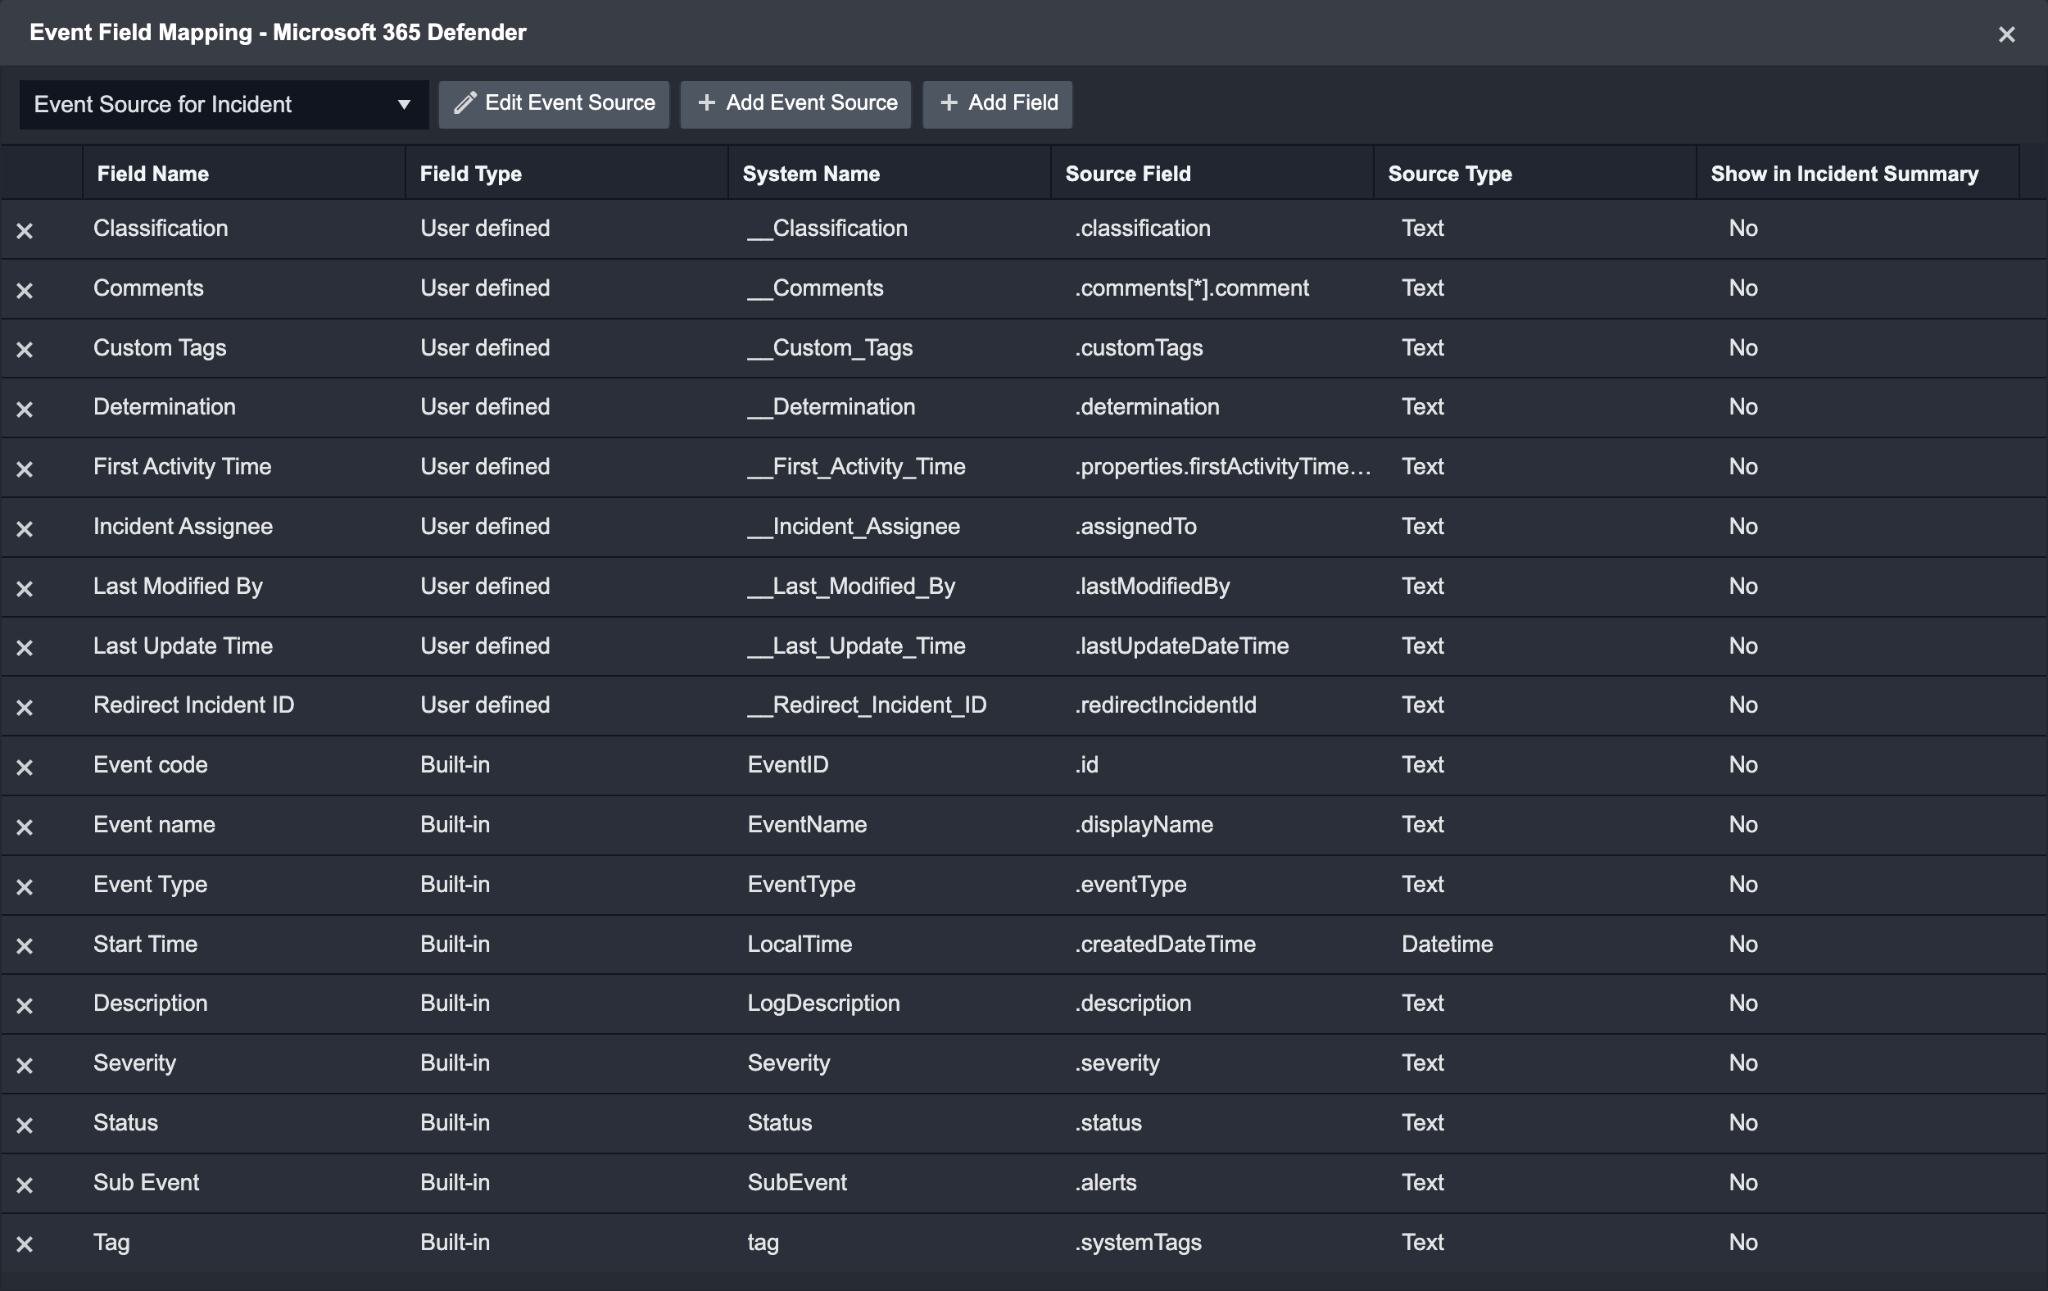
Event Source for Threat Submission Event
Configures the field mapping which are specific to the Threat Submission-related events. If a source field in the field mapping is not found, the corresponding field mapping will be ignored. As the data of the Threat Submission-related events have a character that the value of the eventType field is threatSubmission, the Threat Submission-related events can be defined by the Search String: {eventType}="threatSubmission". Click Edit Event Source to view the Search String.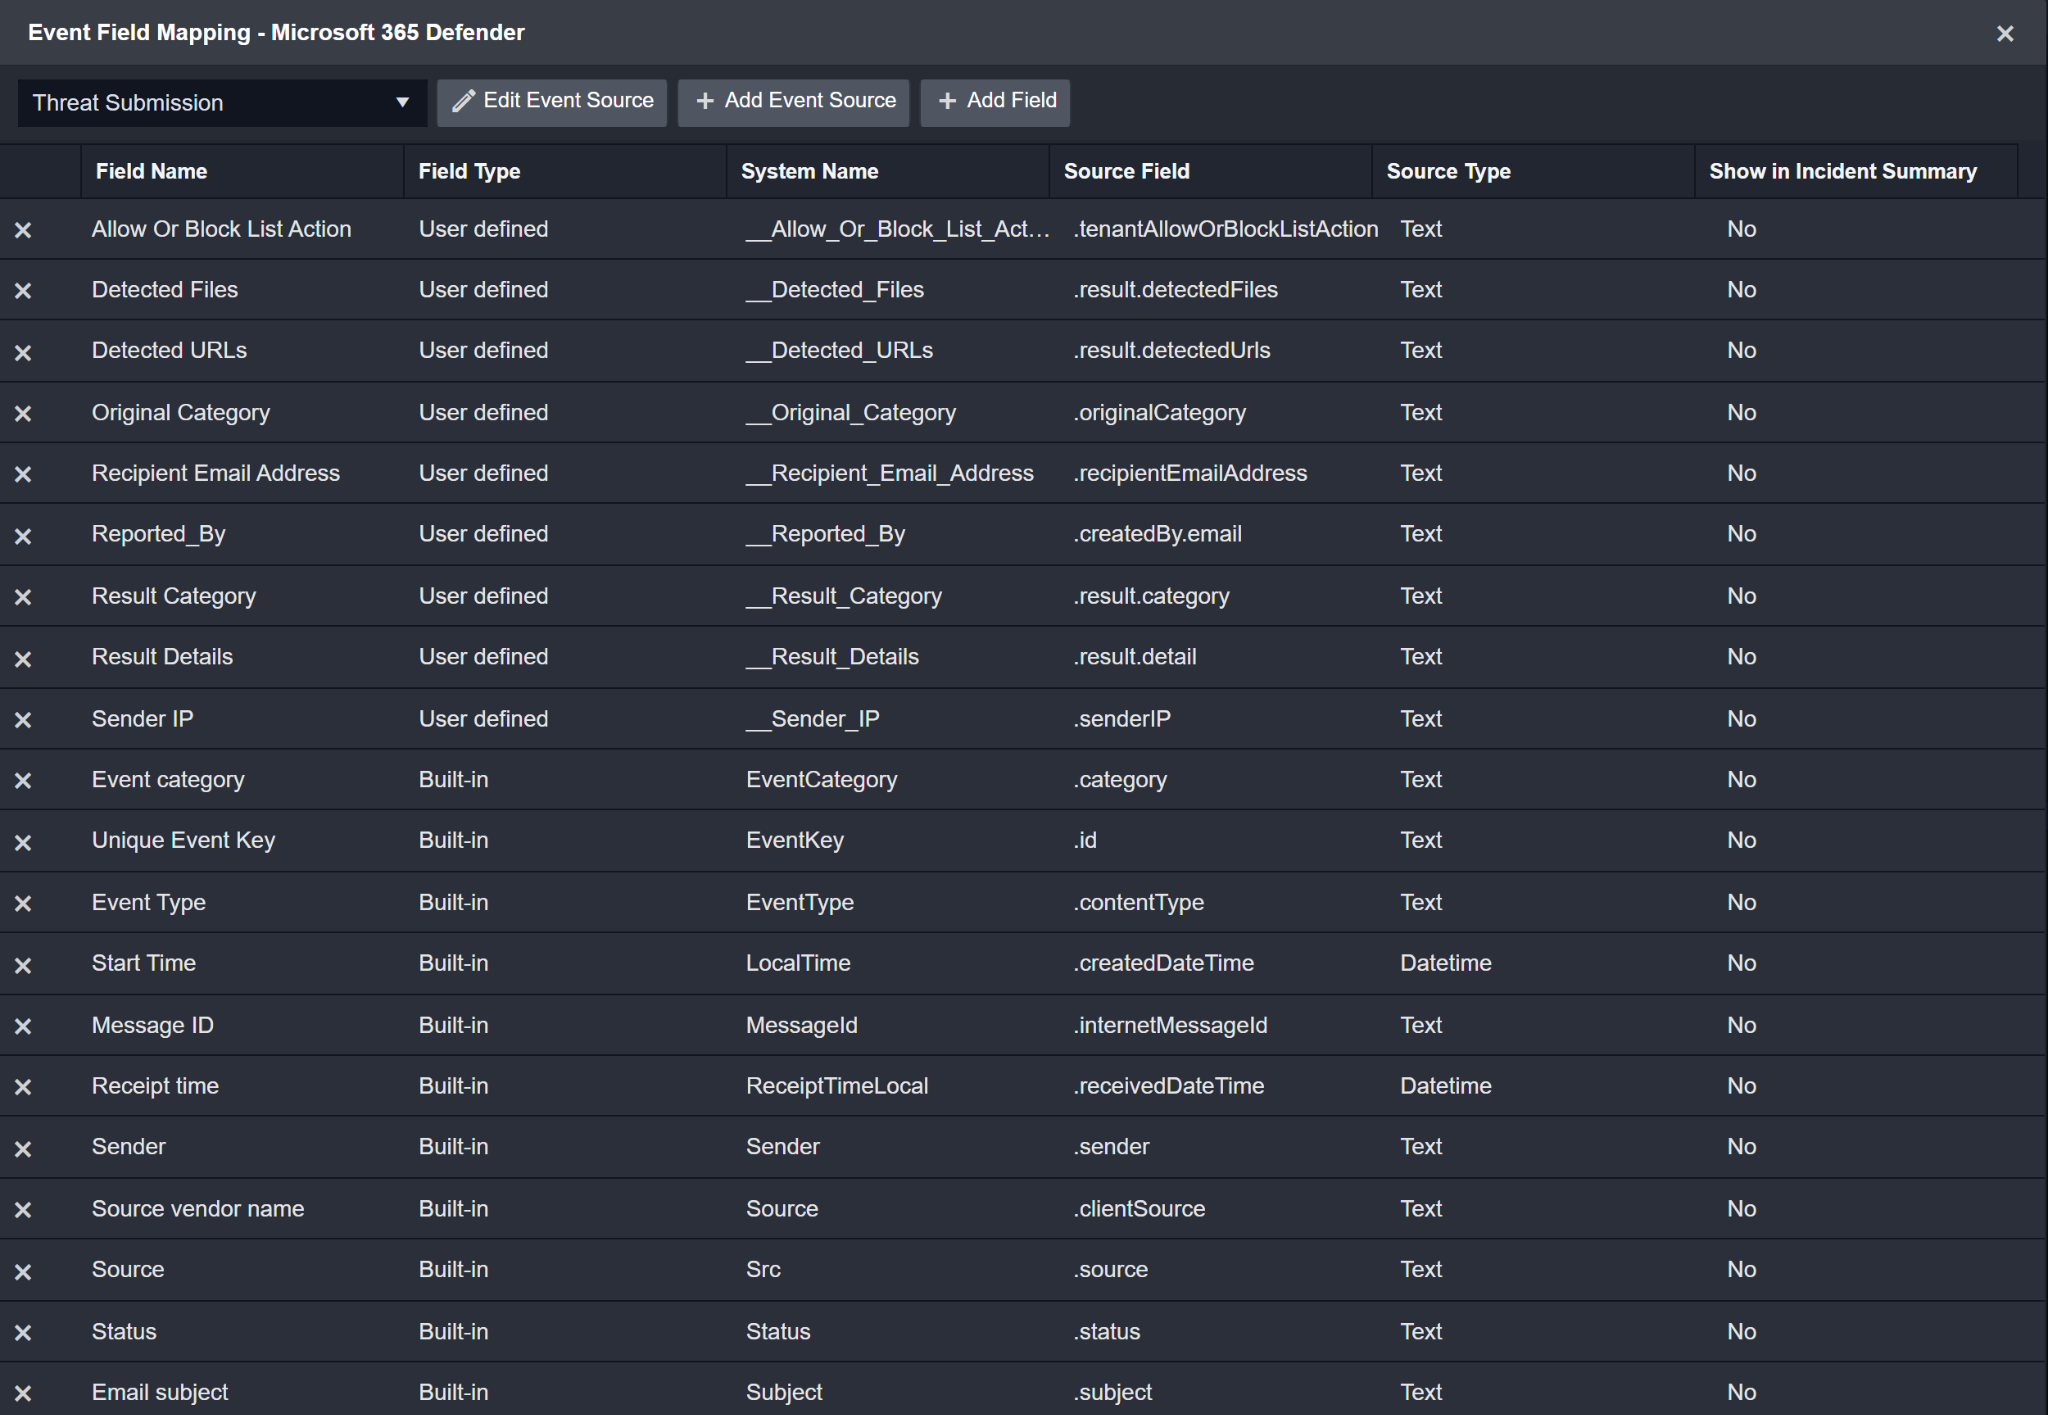
Event Source for Defender Alert
Configures the field mapping which are specific to the Defender Alert-related events. If a source field in the field mapping is not found, the corresponding field mapping will be ignored. As the data of the Defender Alert-related events have a character that the value of the eventType field is defenderAlert, the Defender Alert-related events can be defined by the Search String: {eventType}="defenderAlert". Click Edit Event Source to view the Search String.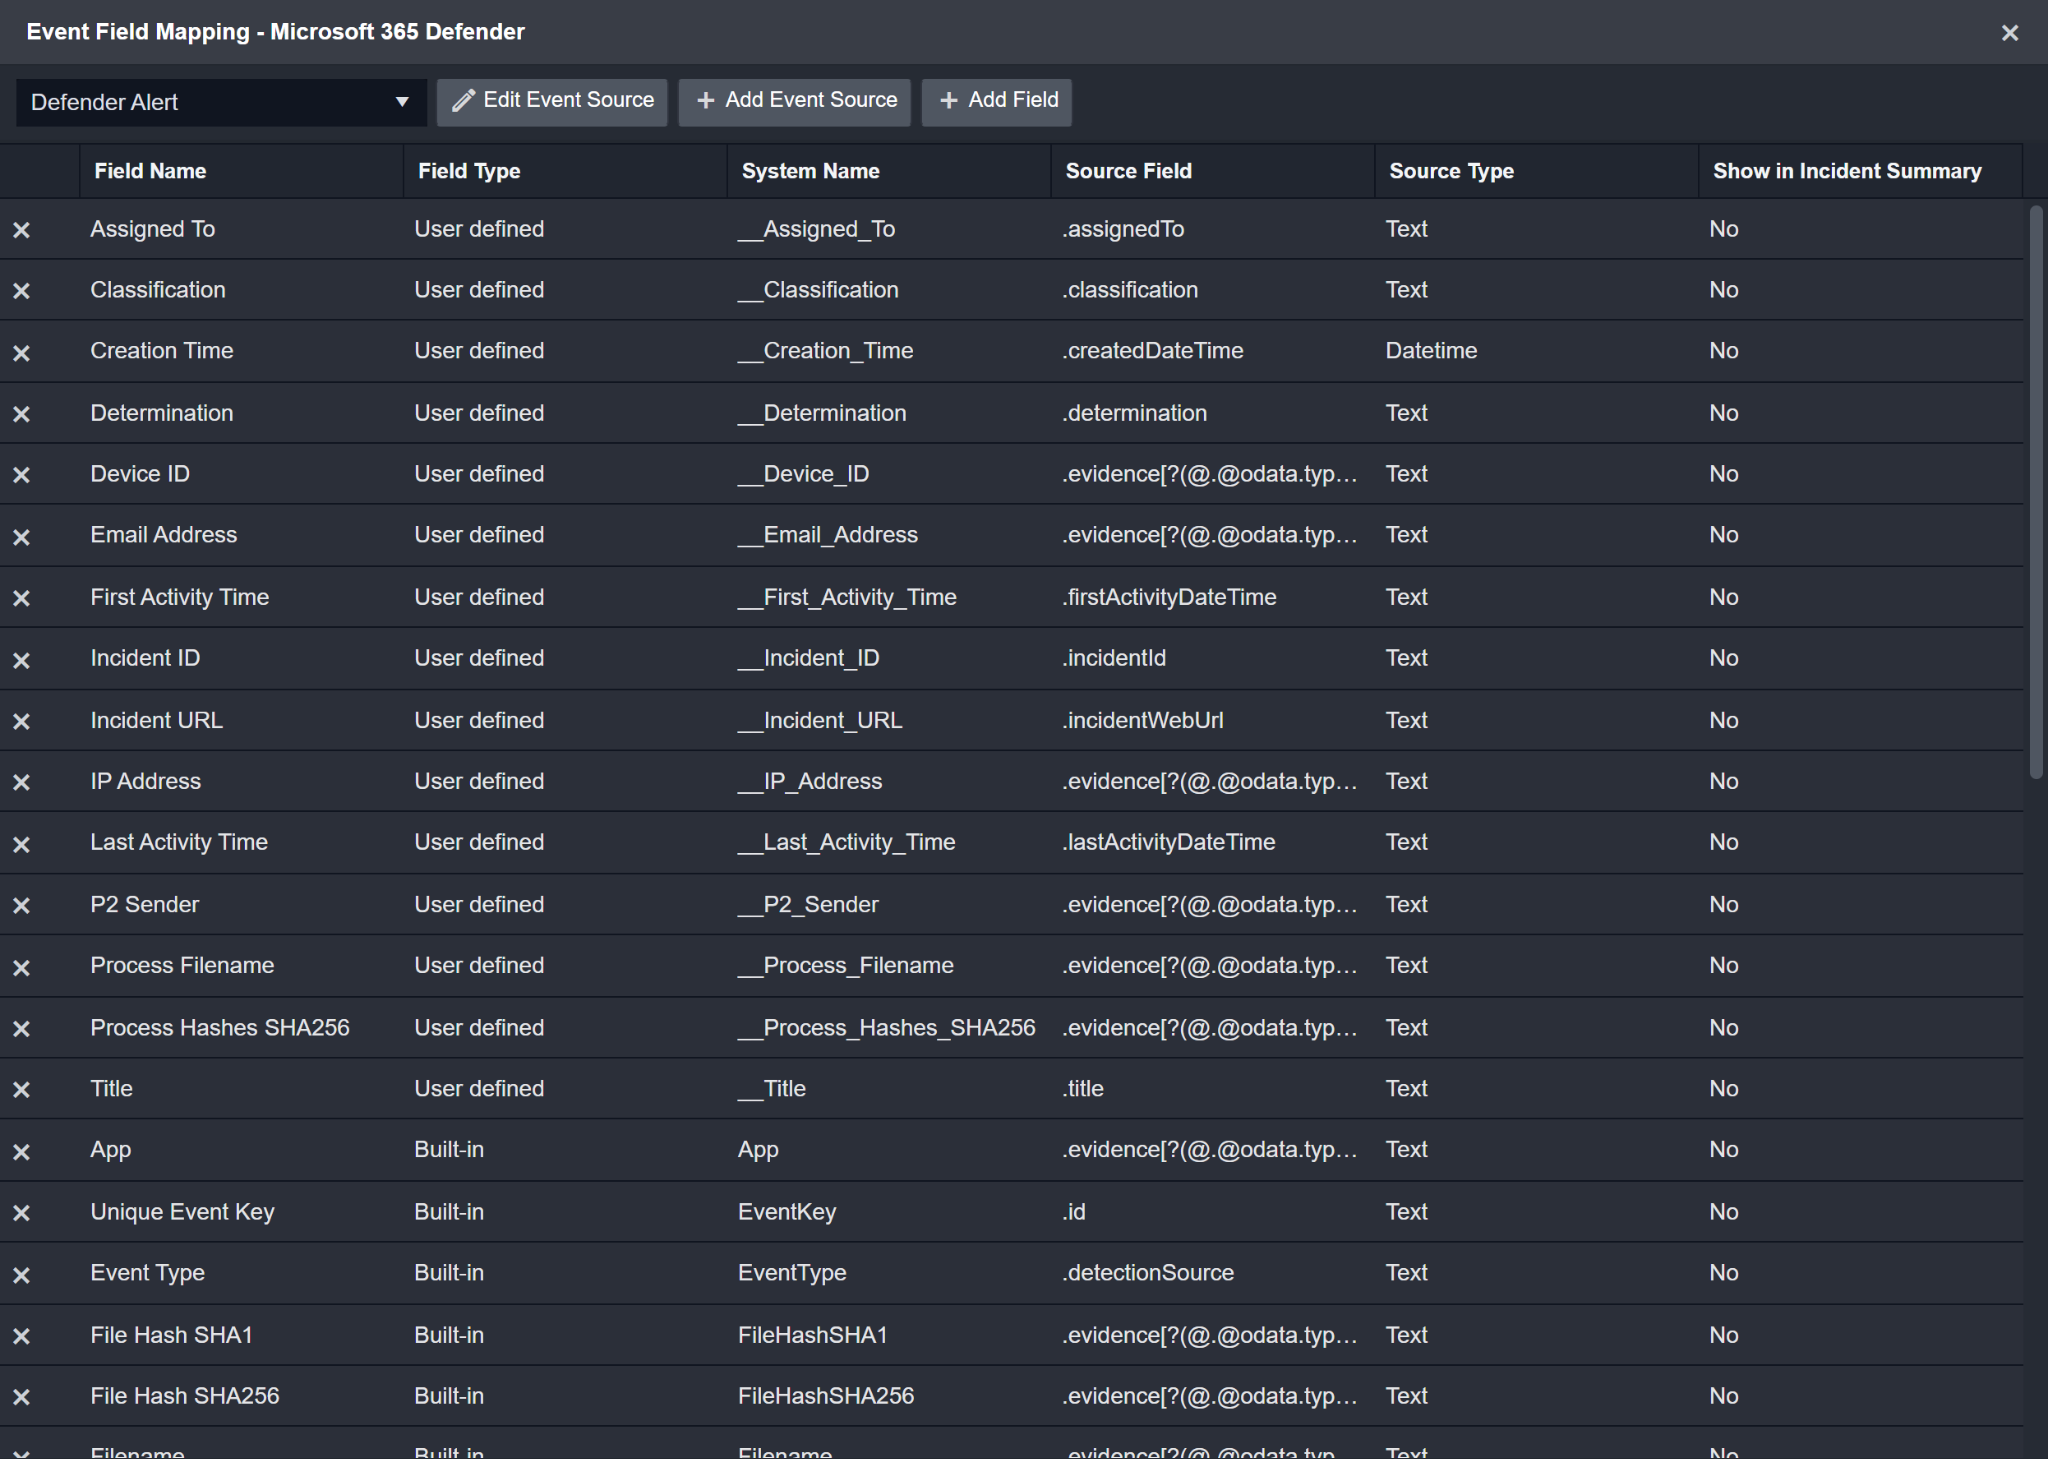
The pre-configured field mappings are detailed below:
Field Name | Source Field |
Event Source for Incident (Search String: {eventType}="incident") The search string format is {jsonpath}=value. If the value of the eventType key is incident in the event object under raw data, then the Incident-related events will use the field mapping below. | |
Event code | .id |
Event name | .displayName |
Event Type | .eventType |
Severity | .severity |
Description | .description |
Status | .status |
Start Time | .createdDateTime |
Comments | .comments[*].comment |
Last Update Time | .lastUpdateDateTime |
Incident Assignee | .assignedTo |
Redirect Incident ID | .redirectIncidentId |
Classification | .classification |
Determination | .determination |
First Activity Time | .properties.firstActivityTimeUtc |
Last Modified By | .lastModifiedBy |
Sub Event | .alerts |
Tag | .systemTags |
Custom Tags | .customTags |
Event Source for Threat Submission Event (Search String: {eventType}="threatSubmission") The search string format is {jsonpath}=value. If the value of the eventType key is threatSubmission in the event object under raw data, then the Threat Submission-related events will use the field mapping below. | |
Unique Event Key | .id |
Start Time | .createdDateTime |
Email Subject | .subject |
Event Type | .contentType |
Event Category | .category |
Status | .status |
Source | .source |
Message ID | .internetMessageId |
Source vendor name | .clientSource |
Recipient Email Address | .recipientEmailAddress |
Sender | .sender |
Sender IP | .senderIP |
Event Source for Defender Alert (Search String: {eventType}="defenderAlert") The search string format is {jsonpath}=value. If the value of the eventType key is defenderAlert in the event object under raw data, then the Defender Alert-related events will use the field mapping below. | |
Unique Event Key | .id |
Source vendor name | .detectionSource |
Creation Time | .createdDateTime |
Title | .title |
Description | .description |
Tactics | .category |
Techniques | .mitreTechniques |
Severity | .severity |
Incident URL | .incidentWebUrl |
Event Type | .detectionSource |
Status | .status |
Incident ID | .incidentId |
Classification | .classification |
Determination | .determination |
First Activity Time | .firstActivityDateTime |
Last Activity Time | .lastActivityDateTime |
Assigned To | .assignedTo |
IP Address | .evidence[?(@.@odata.type=='#microsoft.graph.security.ipEvidence')].ipAddress |
Username | .evidence[?(@.@odata.type=='#microsoft.graph.security.userEvidence')].userAccount.userPrincipalName |
App | .evidence[?(@.@odata.type=='#microsoft.graph.security.cloudApplicationEvidence')].displayName |
URL | .evidence[?(@.@odata.type=='#microsoft.graph.security.urlEvidence')].url |
Filename | .evidence[?(@.@odata.type=='#microsoft.graph.security.fileEvidence')].fileDetails.fileName |
File Hash SHA1 | .evidence[?(@.@odata.type=='#microsoft.graph.security.fileEvidence')].fileDetails.sha1 |
File Hash SHA256 | .evidence[?(@.@odata.type=='#microsoft.graph.security.fileEvidence')].fileDetails.sha256 |
Filepath | .evidence[?(@.@odata.type=='#microsoft.graph.security.fileEvidence')].fileDetails.filePath |
Parent process ID | .evidence[?(@.@odata.type=='#microsoft.graph.security.processEvidence')].parentProcessId |
Process ID | .evidence[?(@.@odata.type=='#microsoft.graph.security.processEvidence')].processId |
Process command line | .evidence[?(@.@odata.type=='#microsoft.graph.security.processEvidence')].processCommandLine |
Email subject | .evidence[?(@.@odata.type=='#microsoft.graph.security.analyzedMessageEvidence')].subject |
Sender | .evidence[?(@.@odata.type=='#microsoft.graph.security.analyzedMessageEvidence')].p1Sender.emailAddress |
P2 Sender | .evidence[?(@.@odata.type=='#microsoft.graph.security.analyzedMessageEvidence')].p2Sender.emailAddress |
Recipient | .evidence[?(@.@odata.type=='#microsoft.graph.security.analyzedMessageEvidence')].recipientEmailAddress |
Device ID | .evidence[?(@.@odata.type=='#microsoft.graph.security.deviceEvidence')].mdeDeviceId |
Email Address | .evidence[?(@.@odata.type=='#microsoft.graph.security.mailboxEvidence')].primaryAddress |
Registry hive | .evidence[?(@.@odata.type=='#microsoft.graph.security.registryValueEvidence')].registryHive |
Registry key name | .evidence[?(@.@odata.type=='#microsoft.graph.security.registryValueEvidence')].registryKey |
Registry value data | .evidence[?(@.@odata.type=='#microsoft.graph.security.registryValueEvidence')].registryValue |
Message ID | .evidence[?(@.@odata.type=='#microsoft.graph.security.analyzedMessageEvidence')].internetMessageId |
Process Filename | .evidence[?(@.@odata.type=='#microsoft.graph.security.processEvidence')].imageFile.fileName |
Process Hashes SHA1 | .evidence[?(@.@odata.type=='#microsoft.graph.security.processEvidence')].imageFile.sha1 |
Process Hashes SHA256 | .evidence[?(@.@odata.type=='#microsoft.graph.security.processEvidence')].imageFile.sha256 |
Process file path | .evidence[?(@.@odata.type=='#microsoft.graph.security.processEvidence')].imageFile.filePath |
Parent process name | .evidence[?(@.@odata.type=='#microsoft.graph.security.processEvidence')].parentProcessImageFile.fileName |
Parent process image path | .evidence[?(@.@odata.type=='#microsoft.graph.security.processEvidence')].parentProcessImageFile.filePath |
Error Handling
If the Return Data is Failed, an Error tab will appear in the Test Result window.
The error tab contains the details responded from D3 SOAR or third-party API calls, including Failure Indicator, Status Code, and Message. This can help you locate the root cause of a command failure.
Parts in Error | Description | Example |
Failure Indicator | Indicates the command failure that happened at a specific input and/or API call. | Fetch Event failed. |
Status Code | The response code issued by the third-party API server or the D3 SOAR system that can be used to locate the corresponding error category. For example, if the returned status code is 401, the selected connection is unauthorized to run the command. The user or system support would need to check the permission setting in the Microsoft 365 Defender portal. Refer to the Common Microsoft 365 Defender REST API Error Codes for details. | Status Code: 401. |
Message | The raw data or captured key error message from the integration API server about the API request failure. | Message: Unauthorized. |
Error Sample Data Fetch Event failed. Status Code: 401. Message: Unauthorized. |
Fetch Related Incident
Returns a list of incidents and corresponding details based on the specified number of hours before the current time and search conditions. The most recently updated incidents are displayed first. Note: This command requires the Incident.Read.All permission, but testing the connection needs an additional SecurityAlert.Read.All permission. You may encounter a failed connection status if running with only the minimum permission, but the command can still be executed successfully.
READER NOTE
To use this command, only the Incident.Read.All permission under Microsoft Threat Protection is needed. However, for testing the connection, an extra permission, SecurityAlert.Read.All, is required. You may encounter a failed connection status if running with only the minimum permission, but the command can still be executed successfully.
If all optional fields are left blank, all incidents within 24 hours will be returned based on the created time.
The query can be searched by Created Time or Updated Time, with the most recently updated incidents listed first.
If an incident has not been updated, its Updated Time will be the same as its Created Time.
Rate limitations for this API:
100 calls per minute
1500 calls per hour
Input
Input Parameter | Required /Optional | Description | Example |
The Hours Before | Optional | The number of hours prior to the current time within which the incidents were updated. If this parameter is not defined, the default value is 24. | 1 |
Top Recent Incident Count | Optional | The maximum number of incidents to be returned. If this parameter is not defined, a maximum of 100 incidents will be returned. | 10 |
Search Condition | Optional | The search condition for fetching incidents. Search conditions can be applied to lastUpdateTime, createdTime, status, and assignedTo. Please refer to OData $filter syntax in Azure Cognitive Search from Microsoft's documentation for more details. | status eq 'Active' and assignedTo eq 'admin@example.com' |
Query Time Type | Optional | The option to define whether the search is by Created Time or Updated Time. If this parameter is not defined, Created Time will be used. | Last Update Time |
Output
Error Handling
If the Return Data is Failed, an Error tab will appear in the Test Result window.
The error tab contains the details responded from D3 SOAR or third-party API calls, including Failure Indicator, Status Code, and Message. This can help you locate the root cause of a command failure.
Parts in Error | Description | Example |
Failure Indicator | Indicates the command failure that happened at a specific input and/or API call. | Fetch Related Incident failed. |
Status Code | The response code issued by the third-party API server or the D3 SOAR system that can be used to locate the corresponding error category. For example, if the returned status code is 401, the selected connection is unauthorized to run the command. The user or system support would need to check the permission setting in the Microsoft 365 Defender portal. Refer to the Common Microsoft 365 Defender REST API Error Codes for details. | Status Code: 400. |
Message | The raw data or captured key error message from the integration API server about the API request failure. | Message: Invalid Search condition. |
Error Sample Data Fetch Related Incident failed. Status Code: 400. Message: Invalid search condition. |
Fetch Incident
Returns a list of incidents and corresponding details based on the specified search conditions. The most recently updated incidents are displayed first. Note: This command requires the Incident.Read.All permission, but testing the connection needs an additional SecurityAlert.Read.All permission. You may encounter a failed connection status if running with only the minimum permission, but the command can still be executed successfully.
READER NOTE
To use this command, only the Incident.Read.All permission under Microsoft Threat Protection is needed. However, for testing the connection, an extra permission, SecurityAlert.Read.All, is required. You may encounter a failed connection status if running with only the minimum permission, but the command can still be executed successfully.
If all optional fields are left blank, all incidents will be fetched.
The query can be searched by Created Time or Updated Time, however, the most recently updated incidents will be listed first.
If an incident has not been updated, its Updated Time will be the same as its Created Time.
Rate limitations for this API are:
100 calls per minute
1500 calls per hour
Input
Input Parameter | Required /Optional | Description | Example |
Start Time | Optional | The start time of the time range for fetching incidents in UTC Time. | 2022-06-10 00:00 |
End Time | Optional | The end time of the time range for fetching incidents in UTC Time. | 2022-06-20 00:00 |
Number of Incident(s) Fetched | Optional | The maximum number of incidents to be returned. If this parameter is not defined, all incidents will be returned. | 10 |
Search | Optional | The search query to filter results. For the query syntax, please refer to OData $filter syntax in Azure Cognitive Search. It is recommended to refer to D3 sample data to build a query string for your use case. Available properties are status and assignedTo. | status eq 'Active' and assignedTo eq '***@example.com' |
Query Time Type | Optional | The option to define whether to fetch incident by Created Time or Updated Time. If this parameter is not defined, Created Time will be used. | Last Update Time |
Serverities | Optional | The severity levels to filter the incidents. If this parameter is not defined, incidents of all severity levels will be returned. The Valid severity values are: Informational, Low, Medium, and High. | ["Informational", "Low", "Medium", "High"] |
Tolerance Scope | Optional | The tolerance scope (in minutes) for the query to fetch incidents between the specified start and end time to avoid incidents loss or fetch failure. The incidents will be fetched between {Start Time - Tolerance Scope, End Time}. The default value is 0. | 10 |
Incident Field Mapping
In this integration, the default incident fields in D3 SOAR are fixed with no built-in source fields. Users can specify the source fields as needed.
Event and Incident Intake Field Mapping
Please note that incident and event intake commands require both Event Field and Incident Field Mapping. These field mappings are the default event/incident field mappings for D3 system integrations. You can edit the provided mappings or create custom mappings as needed. Please refer to Event and Incident Intake Field Mapping for more details.
Incident Main JSON Path: $.value
Field Name | Source Field |
Title | User to define |
Description | User to define |
Severity | User to define, default is ‘Low’ |
Incident Category | User to define |
Incident Type * | User to define, default is the first Incident form in D3 SOAR system |
Incident Creator | User to define |
Incident Owner | User to define |
Incident Playbook | User to define |
Due In Date | User to define |
Unique Key | User to define |
Tactics | User to define |
Techniques | User to define |
Event Field Mapping
Default Event Source Main Event JSON Path
$.alerts
Fetch Incident field mapping can be found in the Fetch Event command with the Defender Alert mapping.
Output
Error Handling
If the Return Data is Failed, an Error tab will appear in the Test Result window.
The error tab contains the details responded from D3 SOAR or third-party API calls, including Failure Indicator, Status Code, and Message. This can help you locate the root cause of a command failure.
Parts in Error | Description | Example |
Failure Indicator | Indicates the command failure that happened at a specific input and/or API call. | Fetch Incident failed. |
Status Code | The response code issued by the third-party API server or the D3 SOAR system that can be used to locate the corresponding error category. For example, if the returned status code is 401, the selected connection is unauthorized to run the command. The user or system support would need to check the permission setting in the Microsoft 365 Defender portal. Refer to the Common Microsoft 365 Defender REST API Error Codes for details. | Status Code: 400. |
Message | The raw data or captured key error message from the integration API server about the API request failure. | Message: Invalid Search Condition. |
Error Sample Data Fetch Incident failed. Status Code: 400. Message: Invalid Search Condition. |
Get Alerts
Retrieves the properties and relationships of the specified alert(s) in an organization based on Alert ID(s).
READER NOTE
The parameter Alert IDs is required to run this command.
Run the Fetch Event command to obtain Alert IDs. Alert IDs can be found in the returned raw data at the path $.value[*].id. Please make sure the event type parameter of the fetch event command is set to Defender Alert when obtaining the alert IDs. The Threat Submission event type does not have alert IDs in its returned data.
Input
Input Parameter | Required /Optional | Description | Example |
Alert IDs | Required | The ID(s) of the alert(s) to get details. Alert IDs can be obtained by running the Fetch Event command with the Event Type parameter set to Defender Alert. Please note that only the Defender Alert type of events has alert ID information. | ["**********************"] |
Output
Error Handling
If the Return Data is Partially Successful or Failed, an Error tab will appear in the Test Result window.
The error tab contains the details responded from D3 SOAR or third-party API calls, including Failure Indicator, Status Code, and Message. This can help you locate the root cause of a command failure.
Parts in Error | Description | Example |
Failure Indicator | Indicates the command failure that happened at a specific input and/or API call. | Get Alerts failed. |
Status Code | The response code issued by the third-party API server or the D3 SOAR system that can be used to locate the corresponding error category. For example, if the returned status code is 401, the selected connection is unauthorized to run the command. The user or system support would need to check the permission setting in the Microsoft 365 Defender portal. Refer to the Common Microsoft 365 Defender REST API Error Codes for details. | Status Code: 404. |
Message | The raw data or captured key error message from the integration API server about the API request failure. | Message: Alert IDs Not Found. |
Error Sample Data Get Alerts failed. Status Code: 404. Message: Alert IDs Not Found. |
Get Incident Alerts
Retrieves the properties and relationships of the alert(s) of a specific incident within a specified time range based on incident ID.
READER NOTE
The parameter Incident IDs is required to run this command.
Run the Fetch Incident or Fetch Related Incident commands to obtain Incident IDs. Incident ID can be found in the returned raw data for both commands at the path $.value[*].incidentId.
Input
Input Parameter | Required /Optional | Description | Example |
Incident ID | Required | The ID of the incident to retrieve related alerts. Incident ID can be obtained using the Fetch Incident or Fetch Related Incident commands. | ***** |
Start Time | Optional | The start time to filter incident alerts. Returns the alerts that were updated after this time. If this parameter is not defined, the default start time is 1 day ahead of End Time. | 2023-09-01 00:00 |
End Time | Optional | The end time to filter incident alerts. Returns the alerts that were updated before this time. If this parameter is not defined, the default end time is the current time. | 2023-09-02 00:00 |
Output
Error Handling
If the Return Data is Failed, an Error tab will appear in the Test Result window.
The error tab contains the details responded from D3 SOAR or third-party API calls, including Failure Indicator, Status Code, and Message. This can help you locate the root cause of a command failure.
Parts in Error | Description | Example |
Failure Indicator | Indicates the command failure that happened at a specific input and/or API call. | Get Incident Alerts failed. |
Status Code | The response code issued by the third-party API server or the D3 SOAR system that can be used to locate the corresponding error category. For example, if the returned status code is 401, the selected connection is unauthorized to run the command. The user or system support would need to check the permission setting in the Microsoft 365 Defender portal. Refer to the Common Microsoft 365 Defender REST API Error Codes for details. | Status Code: 404. |
Message | The raw data or captured key error message from the integration API server about the API request failure. | Message: Incident IDs Not Found. |
Review Email Threat Submissions
Reviews the specified email threat submission(s), and marks email(s) with specific category, notSpam, junk, phishing or malware. Please note, the review result update maybe delays for several minutes. This command uses beta API version.
READER NOTE
The parameter Email Threat IDs is required to run this command
Run the Fetch Event command with the Event Type parameter set to Threat Submission and the Search Condition parameter set to source eq 'user' to obtain the Email Threat IDs. Email Threat IDs can be found in the raw data at the path $.value[*].id.
Input
Input Parameter | Required /Optional | Description | Example |
Email Threat IDs | Required | The Email Threat ID(s) to be reviewed. Email Threat ID can be obtained using the Fetch Event command with Event Type parameter select to Threat Submission, and you need to set Search Condition parameter as source eq 'user'. | [ "5a1********fbc" ] |
Category | Required | The email(s) are being reported as specified category. | Phishing |
Output
Error Handling
If the Return Data is Partially Successful or Failed, an Error tab will appear in the Test Result window.
The errortab contains the details responded from D3 SOAR or third-party API calls, including Failure Indicator, Status Code, and Message. This can help you locate the root cause of a command failure.
Parts in Error | Description | Example |
Failure Indicator | Indicates the command failure that happened at a specific input and/or API call. | Review Email Threat Submissions failed. |
Status Code | The response code issued by the third-party API server or the D3 SOAR system that can be used to locate the corresponding error category. For example, if the returned status code is 401, the selected connection is unauthorized to run the command. The user or system support would need to check the permission setting in the Microsoft 365 Defender portal. Refer to the Common Microsoft 365 Defender REST API Error Codes for details. | Status Code: 404. |
Message | The raw data or captured key error message from the integration API server about the API request failure. | Message: Email Threat IDs Not Found. |
Error Sample Data Review Email Threat Submissions failed. Status Code: 404. Message: Email Threat IDs Not Found. |
Update Alerts
Updates the properties of the specified alert(s) and adds an alert comment optionally.
READER NOTE
The parameter Alert IDs is required to run this command.
Run the Fetch Event command to obtain Alert IDs. Alert IDs can be found in the returned raw data at the path $.value[*].id. Ensure the event type parameter of the Fetch Event command is set to Defender Alert when obtaining the alert IDs. The Threat Submission event type does not have alert IDs in its returned data.
Please note:
D3 will return alerts with updated and unchanged details after running this command. Original alert details will be returned if optional fields are left blank.
The parameters Status, Assigned to, and Classification will be updated based on your input and will be reflected in the output raw data. For the Comment parameter, your input will appear in the corresponding field, alongside any previous comments made on the alerts.
Input
Input Parameter | Required /Optional | Description | Example |
Alert IDs | Required | The ID(s) of the alert(s) to be updated. Alert IDs can be obtained using the Fetch Event command with Event Type parameter set to Defender Alert. Please note that only the Defender Alert type has alert ID information. | ["**********************"] |
Status | Optional | The new status of the alert(s). | In Progress |
Assigned To | Optional | The owner of the alert(s). | *****@example.com |
Classification | Optional | The classification of the alert(s). Please note, some determinations only apply to specific classifications. | Informational, Expected Activity - Other |
Comment | Optional | The comment for the alert update. | Determination Reason 901c |
Output
Error Handling
If the Return Data is Partially Successful or Failed, an Error tab will appear in the Test Result window.
The error tab contains the details responded from D3 SOAR or third-party API calls, including Failure Indicator, Status Code, and Message. This can help you locate the root cause of a command failure.
Parts in Error | Description | Example |
Failure Indicator | Indicates the command failure that happened at a specific input and/or API call. | Update Alerts failed. |
Status Code | The response code issued by the third-party API server or the D3 SOAR system that can be used to locate the corresponding error category. For example, if the returned status code is 401, the selected connection is unauthorized to run the command. The user or system support would need to check the permission setting in the Microsoft 365 Defender portal. Refer to the Common Microsoft 365 Defender REST API Error Codes for details. | Status Code: 404. |
Message | The raw data or captured key error message from the integration API server about the API request failure. | Message: Alert IDs Not Found. |
Error Sample Data Update Alerts failed. Status Code: 404. Message: Alert IDs Not Found. |
Update Incidents
Updates the properties of the specified incidents.
READER NOTE
The parameter Incident IDs is required to run this command.
Run the Fetch Incident or Fetch Related Incident command to obtain Incident IDs. Incident ID can be found in the returned raw data for both commands at the path $.value[*].incidentId.
Please note:
D3 will return incidents with updated and unchanged details after running this command. Original incident details will be returned if optional fields are left blank.
Some determinations only apply to specific classifications. Please see the dropdown for the matching pairs (the available classifications are in brackets):
Multi Staged Attack (True Positive): MultiStagedAttack
Malware (True Positive): Malware
Malicious User Activity (True Positive): MaliciousUserActivity
Unwanted Software (True Positive): UnwantedSoftware
Phishing (True Positive): Phishing
Compromised Account (True Positive): CompromisedAccount
Not Malicious (False Positive): NotMalicious
Not Enough Data To Validate (False Positive): NotAvailable
Security Testing (Informational): SecurityTesting
Confirmed Activity (Informational): ConfirmedActivity
Line Of Business Application (Informational): LineOfBusinessApplication
Other
Please note that the Tags field is not case-sensitive. For example, ‘test’ and ‘Test’ will be treated as the same tag, and only the first tag in the list will be returned.
Please follow the JSON array format when creating tags. An incorrectly formatted tag will be treated as ONE tag. An example of the correct format is ['tag1', ‘tag2’] for creating two tags.
The parameters Status, Assigned to, and Classification will be updated based on your input and will be reflected in the output raw data. For the Comment parameter, your input will appear in the corresponding field, alongside any previous comments made on the alerts.
Input
Input Parameter | Required /Optional | Description | Example |
Incident IDs | Required | The IDs of the incidents to be updated. The Incident ID can be obtained from the Fetch Incident or Fetch Related Incident commands. | ** |
Status | Optional | The current status of the incident. The available statuses are: new, in progress and resolved. | Resolved |
Assigned To | Optional | The owner of the incident. | ***@example.com |
Classification | Optional | The classification of the incident. | False Positive |
Determination | Optional | The determination of the incident. Ensure that the selected Classification parameter matches the corresponding classification indicated in the dropdown menu. For example, select the "True Positive" classification when making a "Malware" determination. | Malware(True Positive) |
Tags | Optional | The list of Incident tags. | [ "security test", "FP1" ] |
Comment | Optional | The comment to be added to the incident. | This is a test on 616 |
Output
Error Handling
If the Return Data is Partially Successful or Failed, an Error tab will appear in the Test Result window.
The error tab contains the details responded from D3 SOAR or third-party API calls, including Failure Indicator, Status Code, and Message. This can help you locate the root cause of a command failure.
Parts in Error | Description | Example |
Failure Indicator | Indicates the command failure that happened at a specific input and/or API call. | Update Incidents failed. |
Status Code | The response code issued by the third-party API server or the D3 SOAR system that can be used to locate the corresponding error category. For example, if the returned status code is 401, the selected connection is unauthorized to run the command. The user or system support would need to check the permission setting in the Microsoft 365 Defender portal. Refer to the Common Microsoft 365 Defender REST API Error Codes for details. | Status Code: 404. |
Message | The raw data or captured key error message from the integration API server about the API request failure. | Message: Incident IDs Not Found. |
Error Sample Data Update Incidents failed. Status Code: 404. Message: Incident IDs Not Found. |
Test Connection
Allows you to perform a health check on an integration connection. You can schedule a periodic health check by selecting Connection Health Check when editing an integration connection.
READER NOTE
Maximum page size:
100 incidents
Maximum rate of requests:
50 calls per minute
1500 calls per hour
Input
N/A
Output
Error Handling
If the Return Data is Failed, an Error tab will appear in the Test Result window.
The error tab contains the details responded from D3 SOAR or third-party API calls, including Failure Indicator, Status Code, and Message. This can help you locate the root cause of a command failure.
Parts in Error | Description | Example |
Failure Indicator | Indicates the command failure that happened at a specific input and/or API call. | Test Connection failed. Failed to check the connector. |
Status Code | The response code issued by the third-party API server or the D3 SOAR system that can be used to locate the corresponding error category. For example, if the returned status code is 401, the selected connection is unauthorized to run the command. The user or system support would need to check the permission setting in the Microsoft 365 Defender portal. Refer to the Common Microsoft 365 Defender REST API Error Codes for details. | Status Code: 403. |
Message | The raw data or captured key error message from the integration API server about the API request failure. | Message: Forbidden. |
Error Sample Data Test Connection failed. Failed to check the connector. Status Code: 403. Message: Forbidden. |