
LogPoint Director
LAST UPDATED: JULY 30, 2025
Overview
LogPoint Director is a platform for managing large deployments. The setup allows different customers of an MSSP or different departments of a large organization to work independent of each other, and still be controlled and monitored via a central entity.
D3 SOAR is providing REST operations to function with LogPoint Director.
LogPoint Director is available for use in:
Connection
To connect to LogPoint Director from D3 SOAR, please follow this part to collect the required information below:
Parameter | Description | Example |
Server URL | The server URL of the LogPoint instance. | https://sample.logicmonitor.com |
Token | The token to authenticate the integration. | c3*****q |
Pool UUID | The Pool UUID to authenticate the integration. | *** |
LogPoint Identifier | The LogPoint Identifier to authenticate the integration. | *** |
Configuring LogPoint Director to Work with D3 SOAR
How do I obtain a Bearer Token?
Bearer tokens can be obtained from the left navigation bar in the Director Console. Navigate to the Profile tab and select the Generate Token option. The token is valid only for 8 hours from the time it is generated. For times when the script runs for an extended period, you can use the Refresh Token API to obtain a new token automatically once the existing token expires.
How do I obtain the Pool UUID of the Fabric-enabled LogPoint?
The value of the pool_UUID parameter can be obtained by logging into the Logpoint Search Master (LPSM) and navigating to Settings > Configurations > LogPoint Pool section. A list of LPSM pools will be displayed. The pool_UUID (UUID) can be selected by their Pool Names from the UUID column.
How do I obtain the LogPoint Identifier?
The value of the logpoint_identifier parameter can be obtained by logging into Logpoint Search Master (LPSM) and navigating to Settings > Configurations > LogPoint Pool section. The details of all Fabric-enabled LogPoints associated with the pool can be found by clicking on the Details icon under the Actions column. Click on the Details icon and find the name of your LogPoint and its identifier.
Configuring D3 SOAR to Work with LogPoint Director
Log in to D3 SOAR.
Find the LogPoint Director integration.
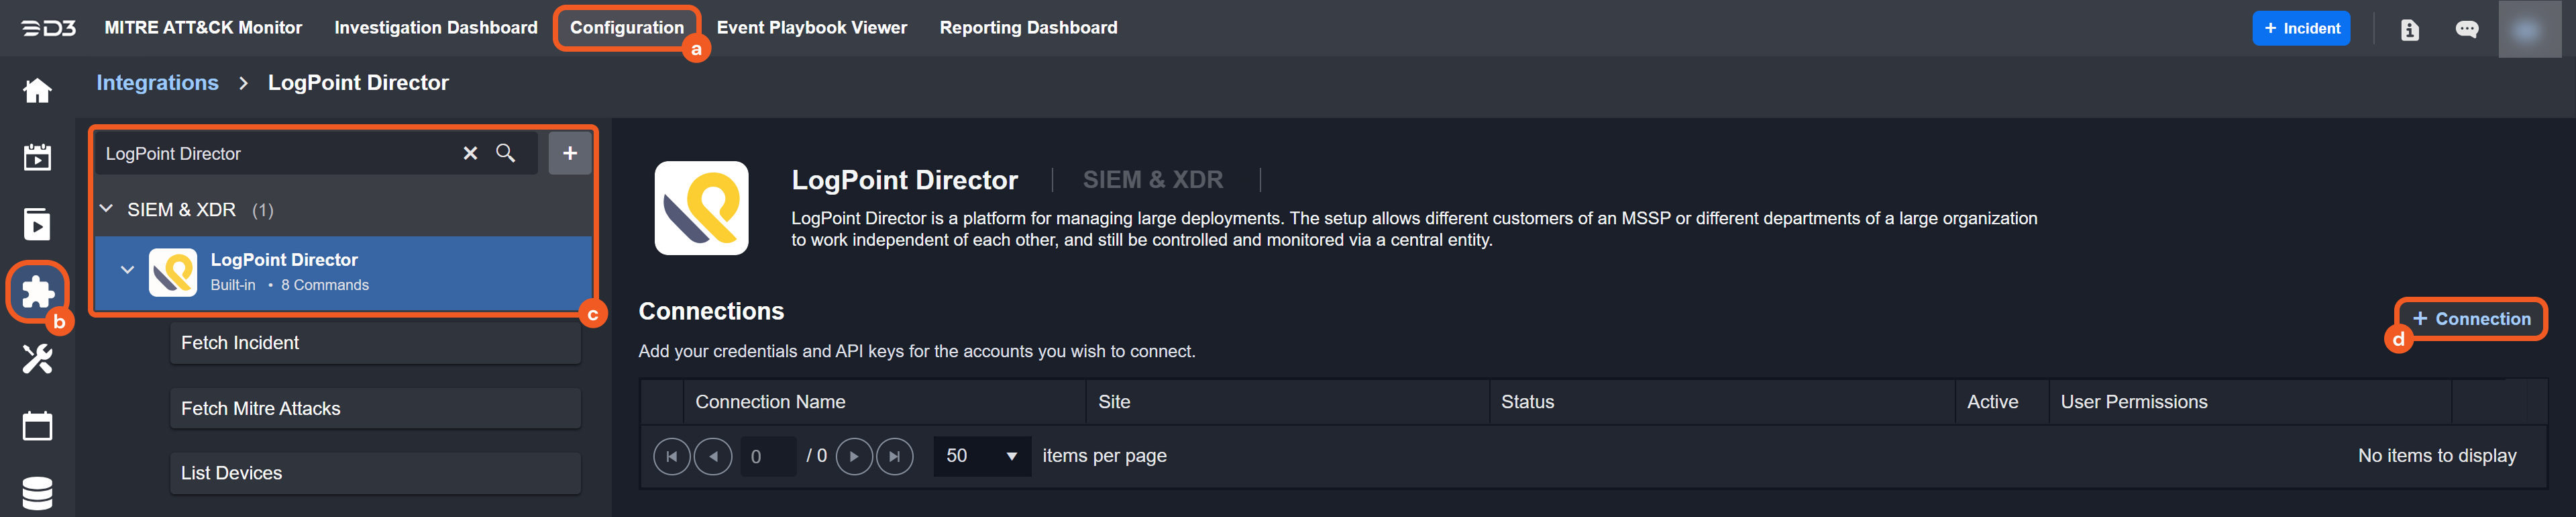
Navigate to Configuration on the top header menu.
Click on the Integration icon on the left sidebar.
Type LogPoint Director in the search box to find the integration, then click it to select it.
Click + New Connection, on the right side of the Connections section. A new connection window will appear.
Configure the following fields to create a connection to LogPoint Director.
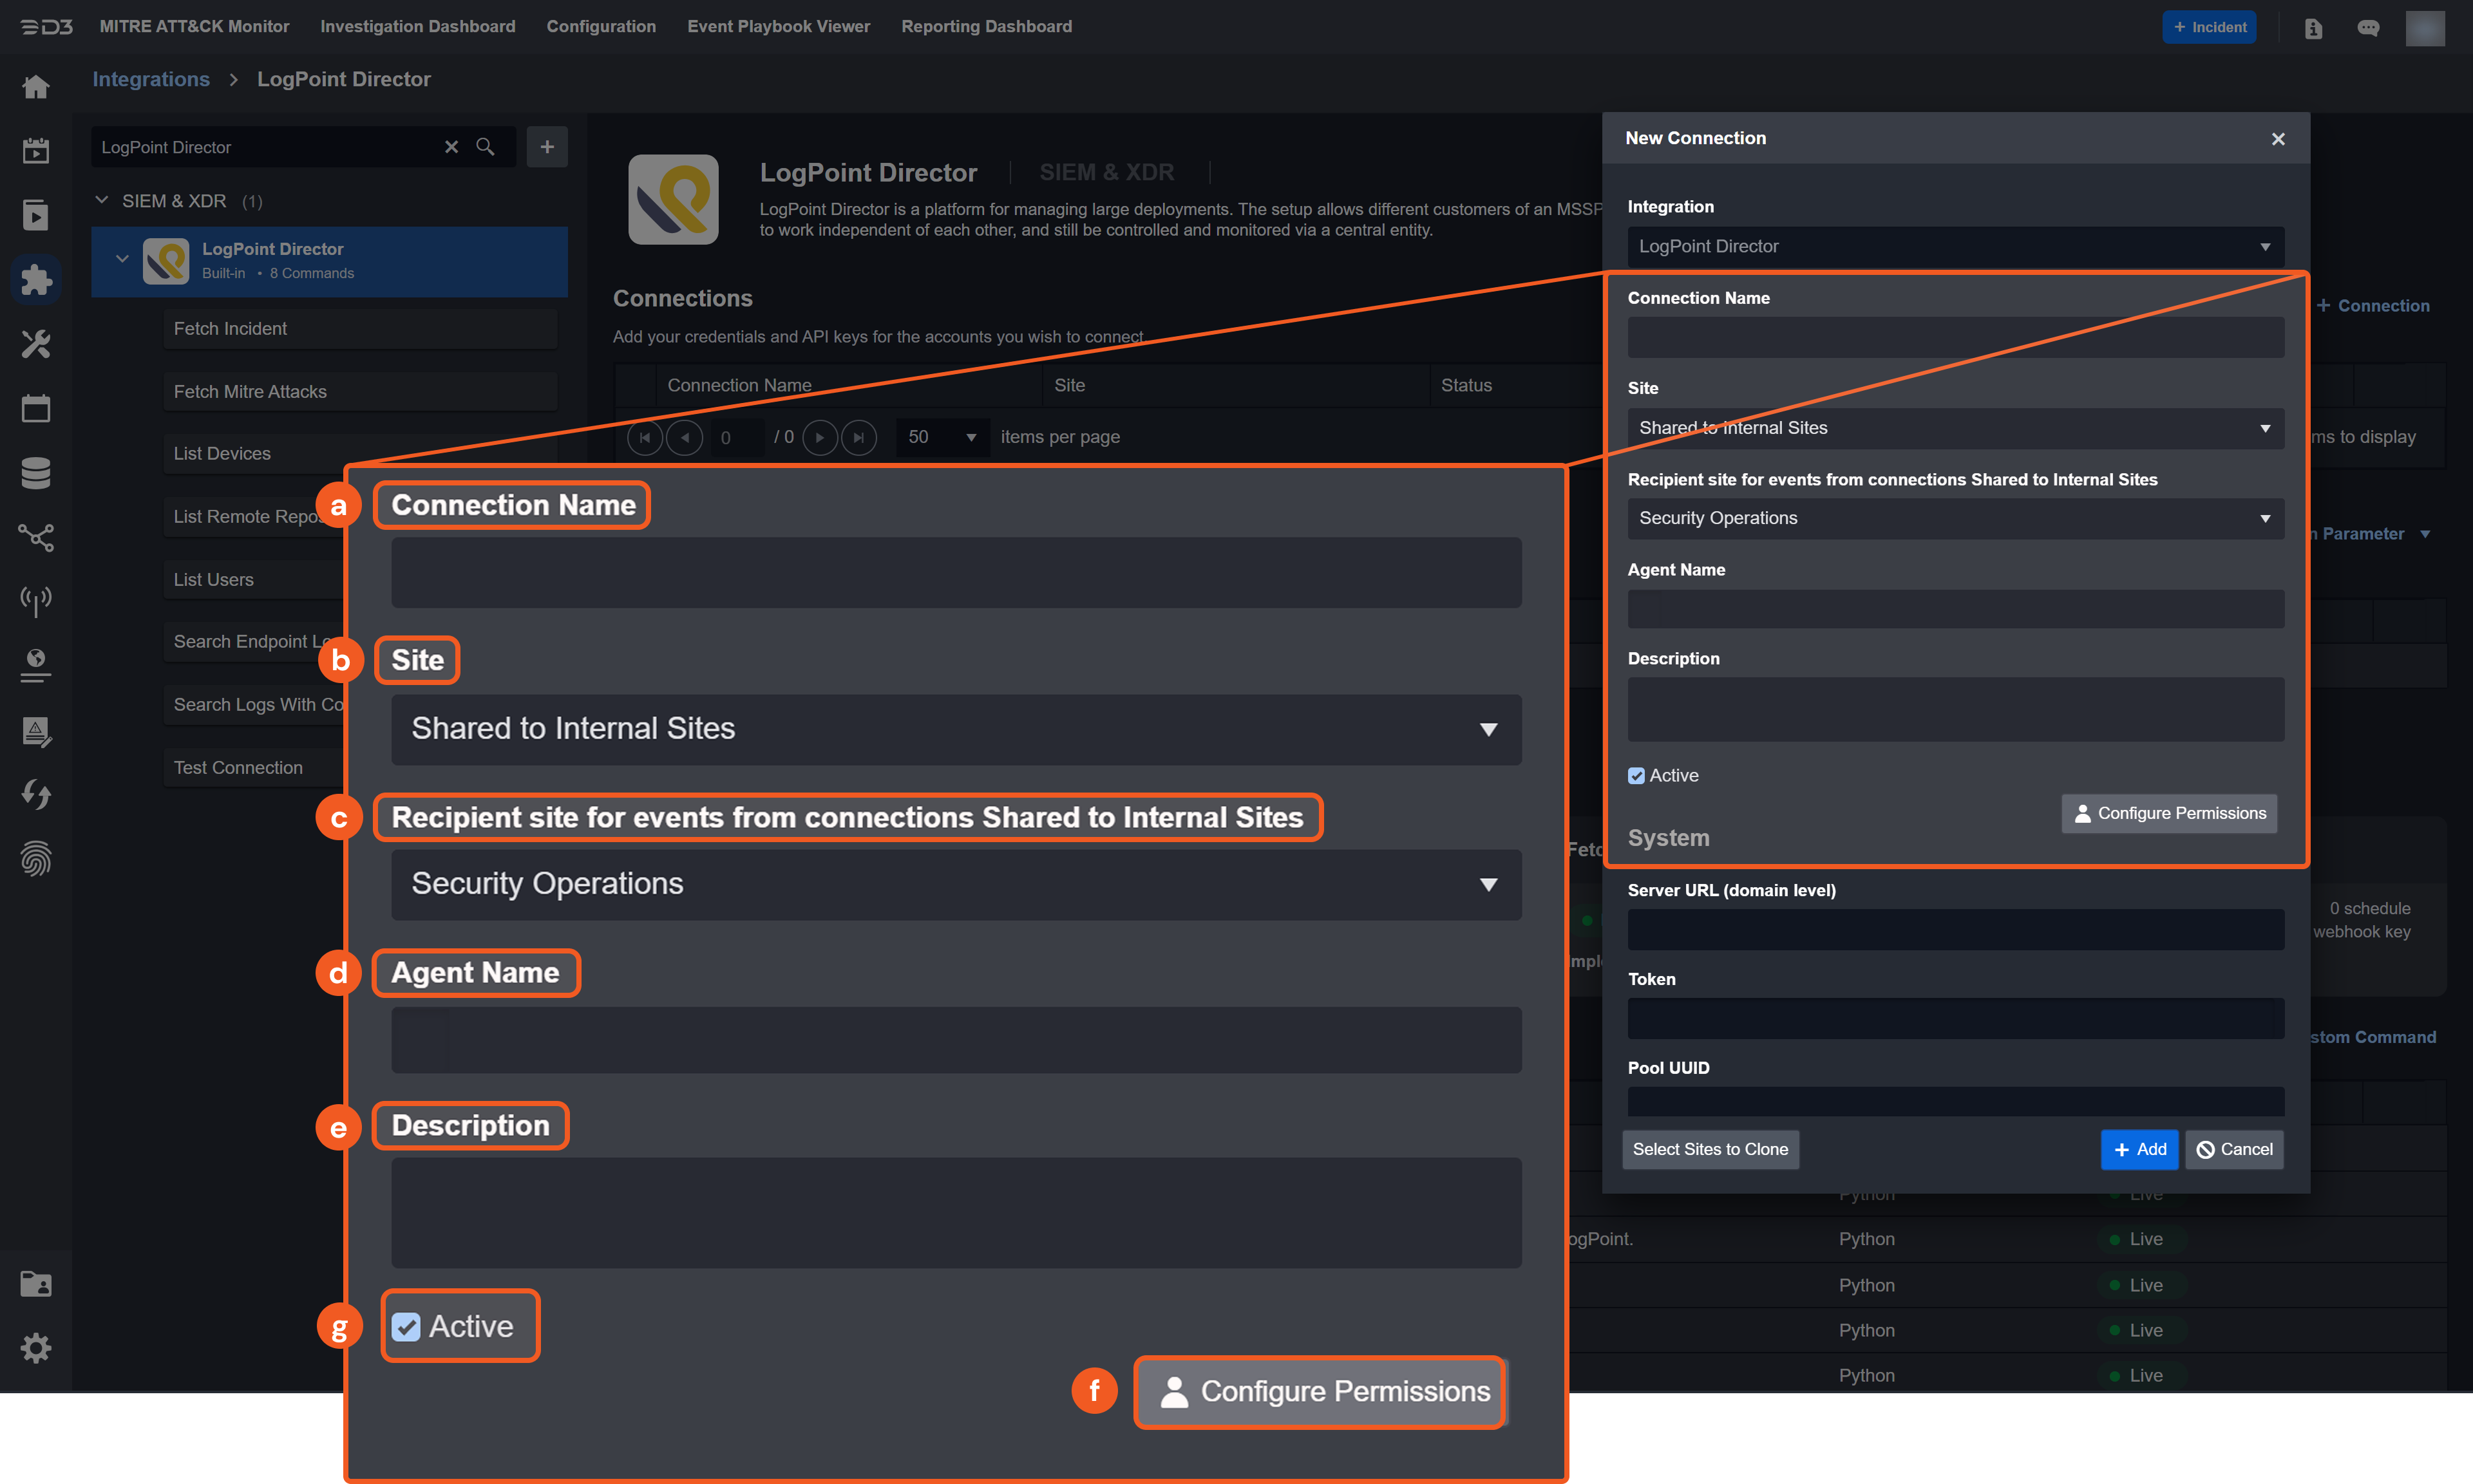
Connection Name: The desired name for the connection.
Site: Specifies the site to use the integration connection. Use the drop-down menu to select the site. The Share to Internal Sites option enables all sites defined as internal sites to use the connection. Selecting a specific site will only enable that site to use the connection.
Recipient site for events from connections Shared to Internal Sites: This field appears if you selected Share to Internal Sites for Site to let you select the internal site to deploy the integration connection.
Agent Name (Optional): Specifies the proxy agent required to build the connection. Use the dropdown menu to select the proxy agent from a list of previously configured proxy agents.
Description (Optional): Add your desired description for the connection.
Configure User Permissions: Defines which users have access to the connection.
Active: Check the tick box to ensure the connection is available for use.
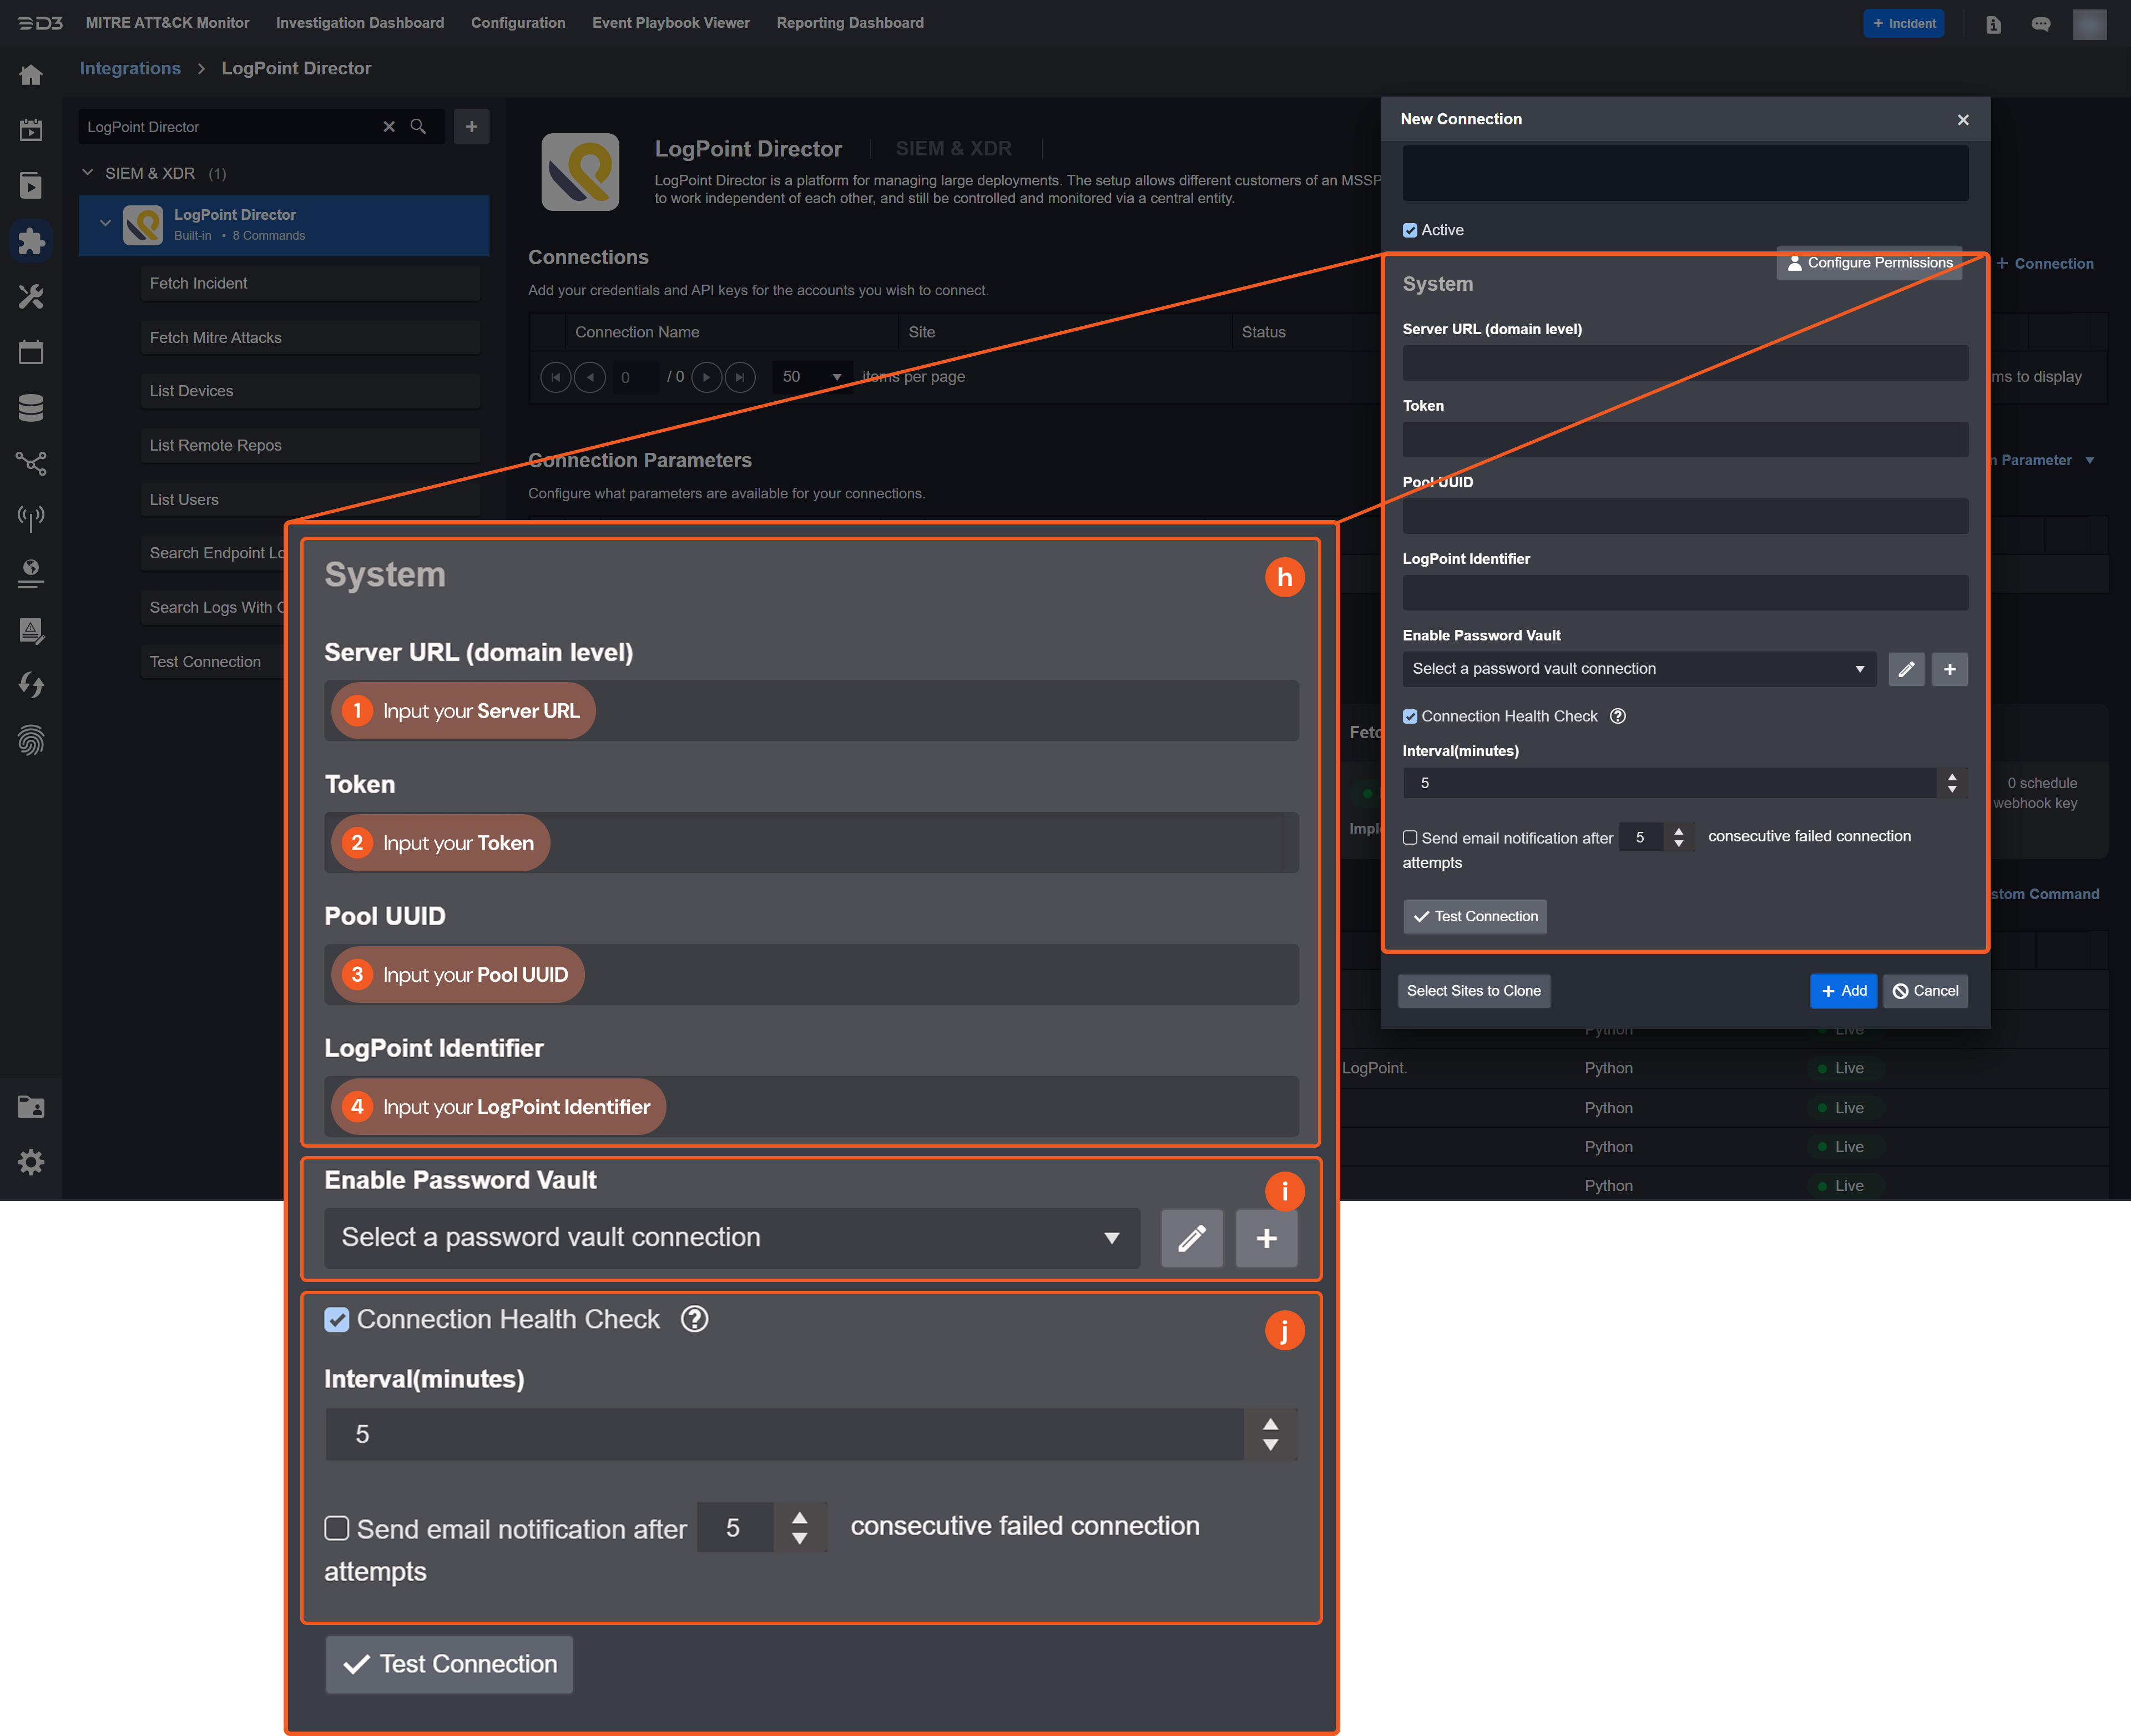
System: This section contains the parameters defined specifically for the integration. These parameters must be configured to create the integration connection.
1. Input your domain level Server URL.
2. Copy the Token from the LogPoint Director platform.
3. Copy the Pool UUID from the LogPoint Director platform.
4. Input the LogPoint Identifier.Enable Password Vault: An optional feature that allows users to take the stored credentials from their own password vault. Please refer to the password vault connection guide if needed.
Connection Health Check: Updates the connection status you have created. A connection health check is done by scheduling the Test Connection command of this integration. This can only be done when the connection is active.
To set up a connection health check, check the Connection Health Check tickbox. You can customize the interval (minutes) for scheduling the health check. An email notification can be set up after a specified number of failed connection attempts.
Test the connection.
Click Test Connection to verify the account credentials and network connection. If the Test Connection Passed alert window appears, the test connection is successful. You will see Passed with a green checkmark appear beside the Test Connection button. If the test connection fails, please check your connection parameters and try again.
Click OK to close the alert window.
Click + Add to create and add the configured connection.
Commands
LogPoint Director includes the following executable commands for users to set up schedules or create playbook workflows. With the Test Command, you can execute these commands independently for playbook troubleshooting.
Integration API Note
For more information about the LogPoint Director API, please refer to the LogPoint Director API reference.
READER NOTE
Certain permissions are required for each command. Please refer to Configuring LogPoint Director to Work with D3 SOAR for details.
Note for Time-related parameters
The input format of time-related parameters may vary based on your account settings. As a result, the sample data provided in our commands is different from what you see. To set your preferred time format, follow these steps:
Navigate to Configuration > Application Settings. Select Date/Time Format.
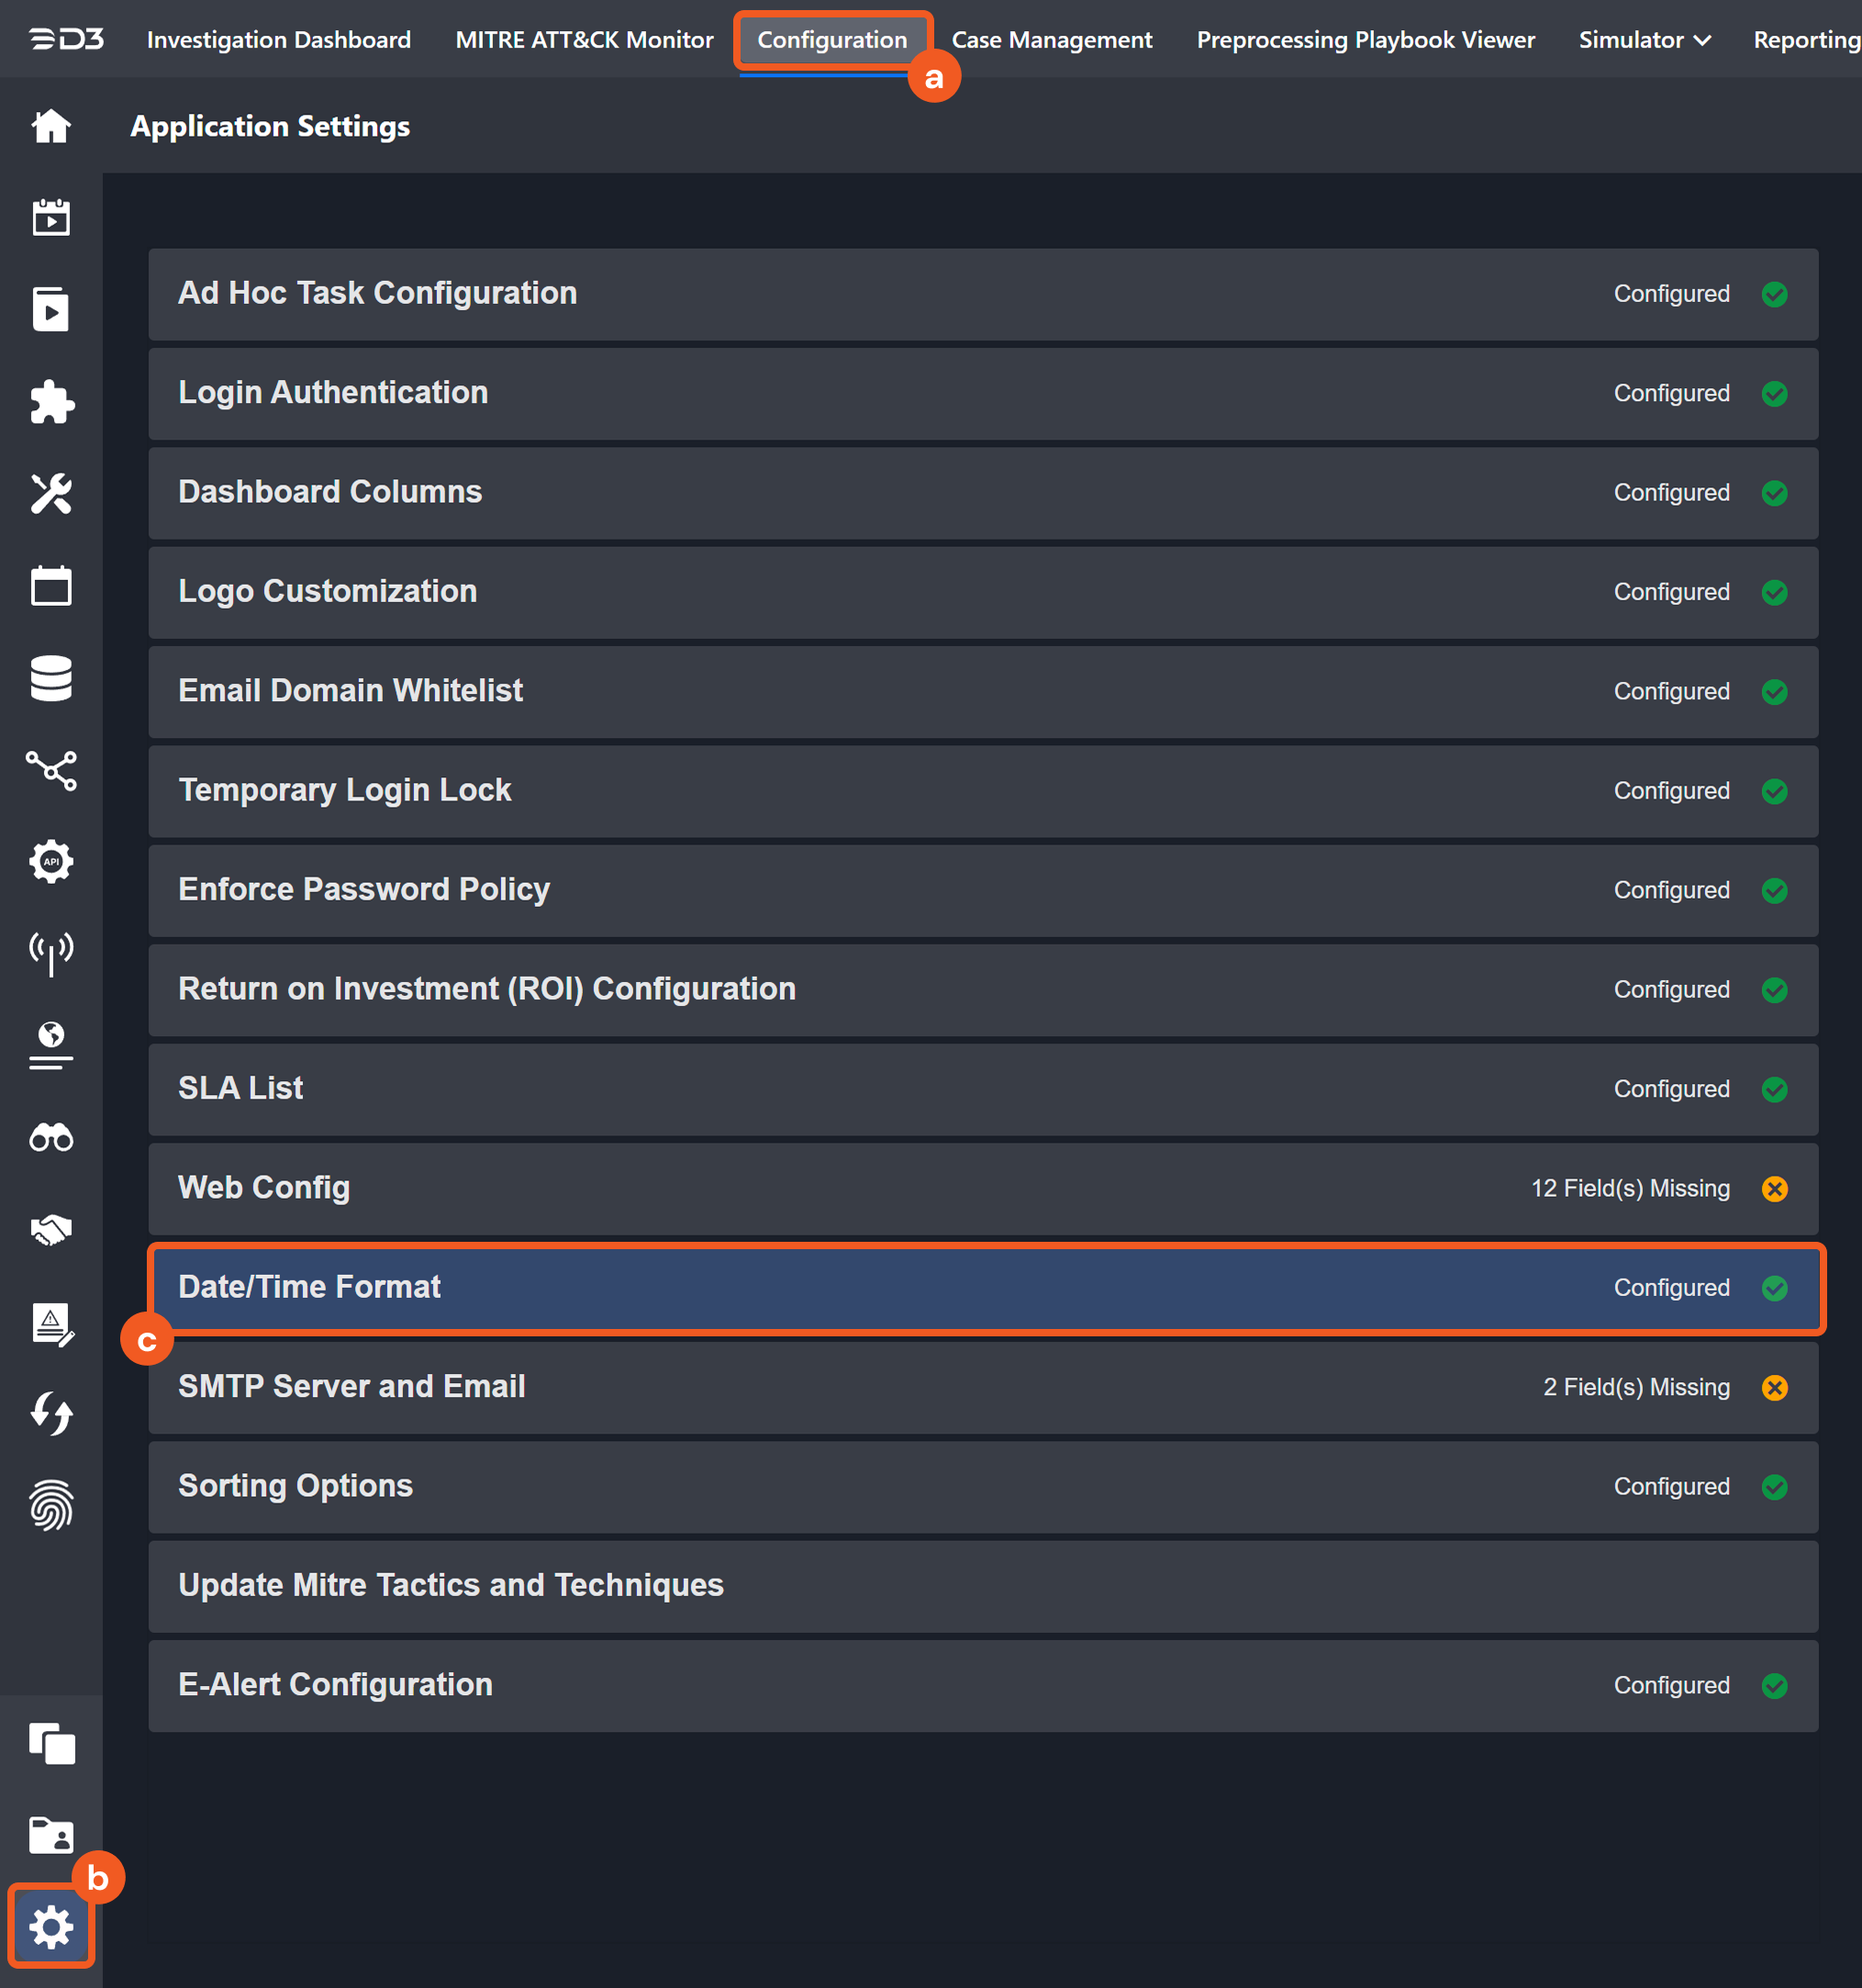
Choose your desired date and time format.
The selected time format will now be visible when configuring Date/Time command input parameters.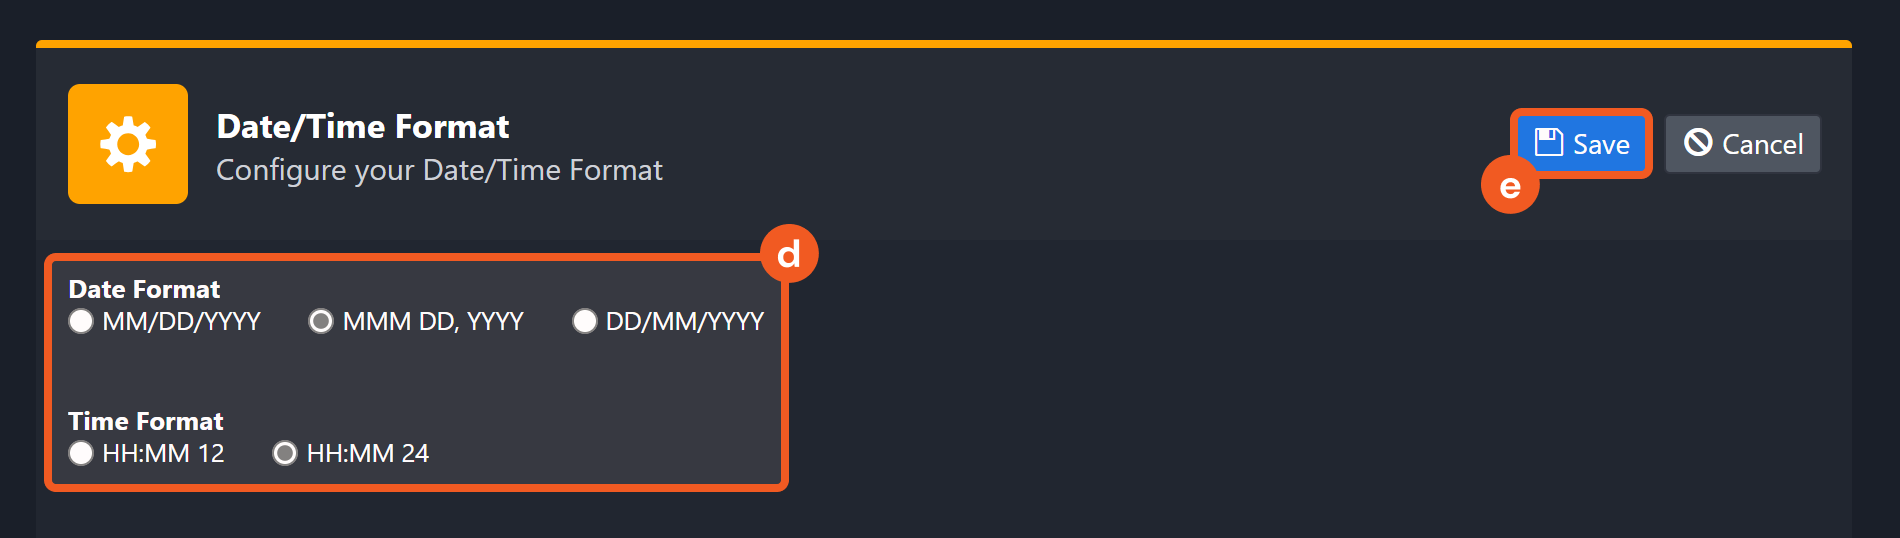
Fetch Incident
Retrieves incidents from the LogPoint Director platform based on specified criteria.
READER NOTE
Attack Tag, Attack Category and Assigned To Users are required parameters to run this command.
Run the List Users command to obtain Assigned To Users. User IDs can be found from the returned raw data at the path $.results[*].id.
Run the Fetch Mitre Attacks command to obtain the Attack Tag and Attack Category.
Input
Input Parameter | Required/Optional | Description | Example |
Start Time | Optional | The start time of the time range for fetching incidents in UTC Time. If the start time is specified, the end time must also be defined. By default, start time is 24 hours prior to the current time. | 2022-06-10 01:00 |
End Time | Optional | The end time of the time range for fetching incidents in UTC Time. If the end time is specified, the start time must also be defined. By default, end time is the current time. | 2022-06-11 00:00 |
Log Source | Optional | The list of log sources to filter. |
JSON
|
Type | Optional | The list of types from which the incident is generated. Values such as "alert", "search" and "UEBA" can be used. | ["alert"] |
Status | Optional | The list of statuses of the incident. Values such as "resolved", "unresolved" and "closed" can be used. |
JSON
|
Risk | Optional | The list of risk levels of the incident. Values such as "low", "medium", "high" and "critical" can be used. |
JSON
|
Attack Tag | Optional | The list of attack tags. Attack Tags can be obtained using the Fetch Mitre Attacks command. |
JSON
|
Attack Category | Optional | The list of attack categories. Attack category can be obtained using the Fetch Mitre Attacks command. |
JSON
|
Assigned To Users | Optional | The list of IDs of the users who are assigned the incident. User IDs can be obtained using the List Users command. |
JSON
|
Output
Incident Field Mapping
For this integration, the default incident fields in D3 SOAR are fixed with no built-in source fields. Users can specify the source fields as needed.
Event and Incident Intake Field Mapping
Incident and event intake commands require both Event Field and Incident Field Mapping. These field mappings are the default event/incident field mappings for D3 system integrations. Edit the provided mappings or create custom mappings as needed. Please refer to Event and Incident Intake Field Mapping for more details.
Incident Main JSON Path: $.response.rows
Field Name | Source Field |
Title | User defined |
Description | User defined |
Severity | User defined |
Incident Type * | User defined |
Incident Creator | User defined |
Incident Owner | User defined |
Incident Playbook | User defined |
Due In Date | User defined |
Unique Key | User defined |
Tactics | User defined |
Techniques | User defined |
Event Field Mapping
Main Event JSON Path
$
Field Name | Source Field |
Alert Incident ID | .incident_id |
Alert Object ID | .alert_obj_id |
Alert Rule ID | .alertrule_id |
Attack Tag | .attack_tag |
Description | .description |
Event code | .id |
Event name | .name |
Event Type | .type |
Repos | .repos |
Severity | .risk |
Source IP address | .kvp_info[?(@.key.text=='json.source_address')].value.text |
Source vendor product name | .logpoint_name |
Start Time | .kvp_info[?(@.key.text=='json.timestamp')].value.text |
Status | .status |
Tactics | .attack_category |
Techniques | .attack_id |
Username | .username |
WMI filter query | .query |
Error Handling
If the Return Data is Failed, an Error tab will appear in the Test Result window.
The error tab contains the details responded from D3 SOAR or third-party API calls, including Failure Indicator, Status Code, and Message. This can help you locate the root cause of a command failure.
Parts in Error | Description | Example |
Failure Indicator | Indicates the command failure that happened at a specific input and/or API call. | Fetch Incident failed. |
Status Code | The response code issued by the third-party API server or the D3 SOAR system that can be used to locate the corresponding error category. For example, if the returned status code is 401, the selected connection is unauthorized to run the command. The user or system support would need to check the permission setting in the LogPoint Director portal. Refer to the HTTP Status Code Registry for details. | Status Code: 400. |
Message | The raw data or captured key error message from the integration API server about the API request failure. | Message: Test Connection failed caused by an unexpected error. Please use test command and check Raw Data for the details. |
Error Sample Data Fetch Incident failed. Status Code: 400. Message: Test Connection failed caused by an unexpected error. Please use test command and check Raw Data for the details. |
Fetch Mitre Attacks
Lists all existing Mitre Attacks.
Input
N/A
Output
Error Handling
If the Return Data is Failed, an Error tab will appear in the Test Result window.
The error tab contains the details responded from D3 SOAR or third-party API calls, including Failure Indicator, Status Code, and Message. This can help you locate the root cause of a command failure.
Parts in Error | Description | Example |
Failure Indicator | Indicates the command failure that happened at a specific input and/or API call. | Fetch Mitre Attacks failed. |
Status Code | The response code issued by the third-party API server or the D3 SOAR system that can be used to locate the corresponding error category. For example, if the returned status code is 401, the selected connection is unauthorized to run the command. The user or system support would need to check the permission setting in the LogPoint Director portal. Refer to the HTTP Status Code Registry for details. | Status Code: 400. |
Message | The raw data or captured key error message from the integration API server about the API request failure. | Message: Test Connection failed caused of an unexpected error. Please use test command and check Raw Data for the details. |
Error Sample Data Fetch Mitre Attacks failed. Status Code: 400. Message: Test Connection failed caused of an unexpected error. Please use test command and check Raw Data for the details. |
List Devices
Lists all devices in the Fabric-enabled LogPoint.
Input
N/A
Output
Error Handling
If the Return Data is Failed, an Error tab will appear in the Test Result window.
The error tab contains the details responded from D3 SOAR or third-party API calls, including Failure Indicator, Status Code, and Message. This can help you locate the root cause of a command failure.
Parts in Error | Description | Example |
Failure Indicator | Indicates the command failure that happened at a specific input and/or API call. | List Devices failed. |
Status Code | The response code issued by the third-party API server or the D3 SOAR system that can be used to locate the corresponding error category. For example, if the returned status code is 401, the selected connection is unauthorized to run the command. The user or system support would need to check the permission setting in the LogPoint Director portal. Refer to the HTTP Status Code Registry for details. | Status Code: 400. |
Message | The raw data or captured key error message from the integration API server about the API request failure. | Message: Test Connection failed caused of an unexpected error. Please use test command and check Raw Data for the details. |
Error Sample Data List Devices failed. Status Code: 400. Message: Test Connection failed caused of an unexpected error. Please use test command and check Raw Data for the details. |
List Remote Repos
Fetches all local and remote Repos.
Input
N/A
Output
Error Handling
If the Return Data is Failed, an Error tab will appear in the Test Result window.
The error tab contains the details responded from D3 SOAR or third-party API calls, including Failure Indicator, Status Code, and Message. This can help you locate the root cause of a command failure.
Parts in Error | Description | Example |
Failure Indicator | Indicates the command failure that happened at a specific input and/or API call. | List Remote Repos failed. |
Status Code | The response code issued by the third-party API server or the D3 SOAR system that can be used to locate the corresponding error category. For example, if the returned status code is 401, the selected connection is unauthorized to run the command. The user or system support would need to check the permission setting in the LogPoint Director portal. Refer to the HTTP Status Code Registry for details. | Status Code: 400. |
Message | The raw data or captured key error message from the integration API server about the API request failure. | Message: Test Connection failed caused of an unexpected error. Please use test command and check Raw Data for the details. |
Error Sample Data List Remote Repos failed. Status Code: 400. Message: Test Connection failed caused of an unexpected error. Please use test command and check Raw Data for the details. |
List Users
Lists all existing users.
Input
N/A
Output
Error Handling
If the Return Data is Failed, an Error tab will appear in the Test Result window.
The error tab contains the details responded from D3 SOAR or third-party API calls, including Failure Indicator, Status Code, and Message. This can help you locate the root cause of a command failure.
Parts in Error | Description | Example |
Failure Indicator | Indicates the command failure that happened at a specific input and/or API call. | List Users failed. |
Status Code | The response code issued by the third-party API server or the D3 SOAR system that can be used to locate the corresponding error category. For example, if the returned status code is 401, the selected connection is unauthorized to run the command. The user or system support would need to check the permission setting in the LogPoint Director portal. Refer to the HTTP Status Code Registry for details. | Status Code: 400. |
Message | The raw data or captured key error message from the integration API server about the API request failure. | Message: Test Connection failed caused of an unexpected error. Please use test command and check Raw Data for the details. |
Error Sample Data List Users failed. Status Code: 400. Message: Test Connection failed caused of an unexpected error. Please use test command and check Raw Data for the details. |
Search Endpoint Logs
Searches endpoint logs.
READER NOTE
User ID is a required parameter to run this command.
Run the List Users command to obtain User ID. User IDs can be found from the returned raw data at the path $.results[*].id.
Input
Input Parameter | Required/Optional | Description | Example |
Start Time | Required | The start time of the time range for fetching search logs in UTC Time. | 2022-06-10 01:00 |
End Time | Required | The end time of the time range for fetching search logs in UTC Time. | 2022-06-11 00:00 |
Limit | Optional | The maximum number of rows returned in a single request. The default value of the limit parameter is 100. | 10 |
Query | Required | The valid LogPoint query to filter the response based on the given query. | event_id=4624 user=firstname.lastname |
Repos | Optional | The list of repos where the logs are searched. |
JSON
|
User ID | Required | The existing User ID. User IDs can be obtained using the List Users command. | 5d8*****41 |
Output
Error Handling
If the Return Data is Failed, an Error tab will appear in the Test Result window.
The error tab contains the details responded from D3 SOAR or third-party API calls, including Failure Indicator, Status Code, and Message. This can help you locate the root cause of a command failure.
Parts in Error | Description | Example |
Failure Indicator | Indicates the command failure that happened at a specific input and/or API call. | Search Endpoint Logs failed. |
Status Code | The response code issued by the third-party API server or the D3 SOAR system that can be used to locate the corresponding error category. For example, if the returned status code is 401, the selected connection is unauthorized to run the command. The user or system support would need to check the permission setting in the LogPoint Director portal. Refer to the HTTP Status Code Registry for details. | Status Code: 400. |
Message | The raw data or captured key error message from the integration API server about the API request failure. | Message: Test Connection failed caused of an unexpected error. Please use test command and check Raw Data for the details. |
Error Sample Data Search Endpoint Logs failed. Status Code: 400. Message: Test Connection failed caused of an unexpected error. Please use test command and check Raw Data for the details. |
Search Logs With Count
Retrieves the total number of grouped logs in the search result.
READER NOTE
User ID is a required parameter to run this command.
Run the List Users command to obtain User ID. User IDs can be found from the returned raw data at the path $.results[*].id.
Input
Input Parameter | Required/Optional | Description | Example |
Start Time | Required | The start time of the time range for fetching search logs in UTC Time. | 2022-06-10 01:00 |
End Time | Required | The end time of the time range for fetching search logs in UTC Time. | 2022-06-11 00:00 |
Limit | Optional | The maximum number of rows returned in a single request. The default value of the limit parameter is 100. | 10 |
Repos | Optional | The list of repos where the logs are searched. |
JSON
|
User ID | Required | The existing User ID. User IDs can be obtained using the List Users command. | 5d*****1 |
Group By | Required | The field that the logs should be grouped by. | device_ip |
Output
Error Handling
If the Return Data is Failed, an Error tab will appear in the Test Result window.
The error tab contains the details responded from D3 SOAR or third-party API calls, including Failure Indicator, Status Code, and Message. This can help you locate the root cause of a command failure.
Parts in Error | Description | Example |
Failure Indicator | Indicates the command failure that happened at a specific input and/or API call. | Search Logs With Count failed. |
Status Code | The response code issued by the third-party API server or the D3 SOAR system that can be used to locate the corresponding error category. For example, if the returned status code is 401, the selected connection is unauthorized to run the command. The user or system support would need to check the permission setting in the LogPoint Director portal. Refer to the HTTP Status Code Registry for details. | Status Code: 400. |
Message | The raw data or captured key error message from the integration API server about the API request failure. | Message: Test Connection failed caused of an unexpected error. Please use test command and check Raw Data for the details. |
Error Sample Data Search Logs With Count failed. Status Code: 400. Message: Test Connection failed because of an unexpected error. Please use test command and check Raw Data for the details. |
Test Connection
Allows you to perform a health check on an integration connection. You can schedule a periodic health check by selecting Connection Health Check when editing an integration connection.
Input
N/A
Output
Error Handling
If the Return Data is Failed, an Error tab will appear in the Test Result window.
The error tab contains the details responded from D3 SOAR or third-party API calls, including Failure Indicator, Status Code, and Message. This can help you locate the root cause of a command failure.
Parts in Error | Description | Example |
Failure Indicator | Indicates the command failure that happened at a specific input and/or API call. | Test Connection failed. Failed to check the connector. |
Status Code | The response code issued by the third-party API server or the D3 SOAR system that can be used to locate the corresponding error category. For example, if the returned status code is 401, the selected connection is unauthorized to run the command. The user or system support would need to check the permission setting in the LogPoint Director portal. Refer to the HTTP Status Code Registry for details. | Status Code: 400. |
Message | The raw data or captured key error message from the integration API server about the API request failure. | Message: Test Connection failed caused of an unexpected error. Please use test command and check Raw Data for the details. |
Error Sample Data Test Connection failed. Failed to check the connector. Status Code: 400. Message: Test Connection failed caused of an unexpected error. Please use test command and check Raw Data for the details. |