
Logpoint
LAST UPDATED: OCTOBER 06, 2025
Overview
Logpoint SIEM serves as a central hub for security event data within an organization. It collects, correlates, analyzes, and visualizes data from various sources, empowering security teams to detect and investigate security incidents quickly. Logpoint SIEM's reporting and historical data analysis capabilities ensure compliance with regulations and facilitate continuous improvement of an organization's security needs.
D3 SOAR is providing REST operations to function with Logpoint.
Logpoint is available for use in:
Connection
To connect to Logpoint from D3 SOAR, follow this part to collect the required information below:
Parameter | Description | Example |
Server URL | The server URL of the Logpoint SIEM instance. | https://Logpoint-IP |
User Name | The Logpoint username for authentication matching the user's assigned system roles. | John |
Access Key | The access key obtained from Logpoint. | ***** |
Configuring Logpoint to Work with D3 SOAR
Refer to Finding the Access Key | Logpoint API Reference for instructions on retrieving the Access Key.
Configuring D3 SOAR to Work with Logpoint
Log in to D3 SOAR.
Find the Logpoint integration.
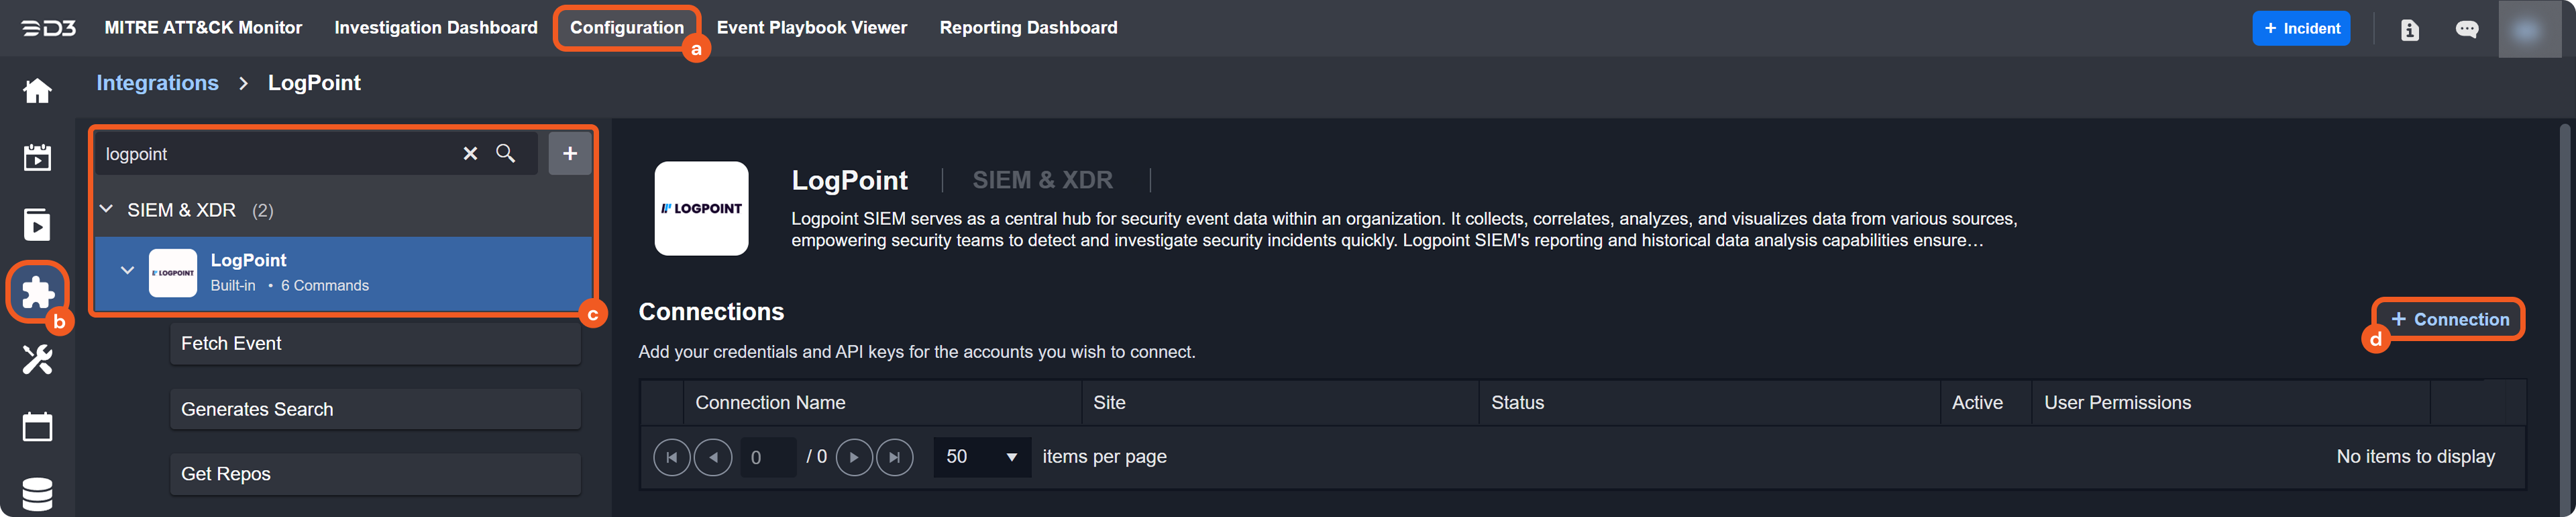
Navigate to Configuration on the top header menu.
Click on the Integration icon on the left sidebar.
Type Logpoint in the search box to find the integration, then click it to select it.
Click on the + Connection button on the right side of the Connections section. A new connection window will appear.
Configure the following fields to create a connection to Logpoint.
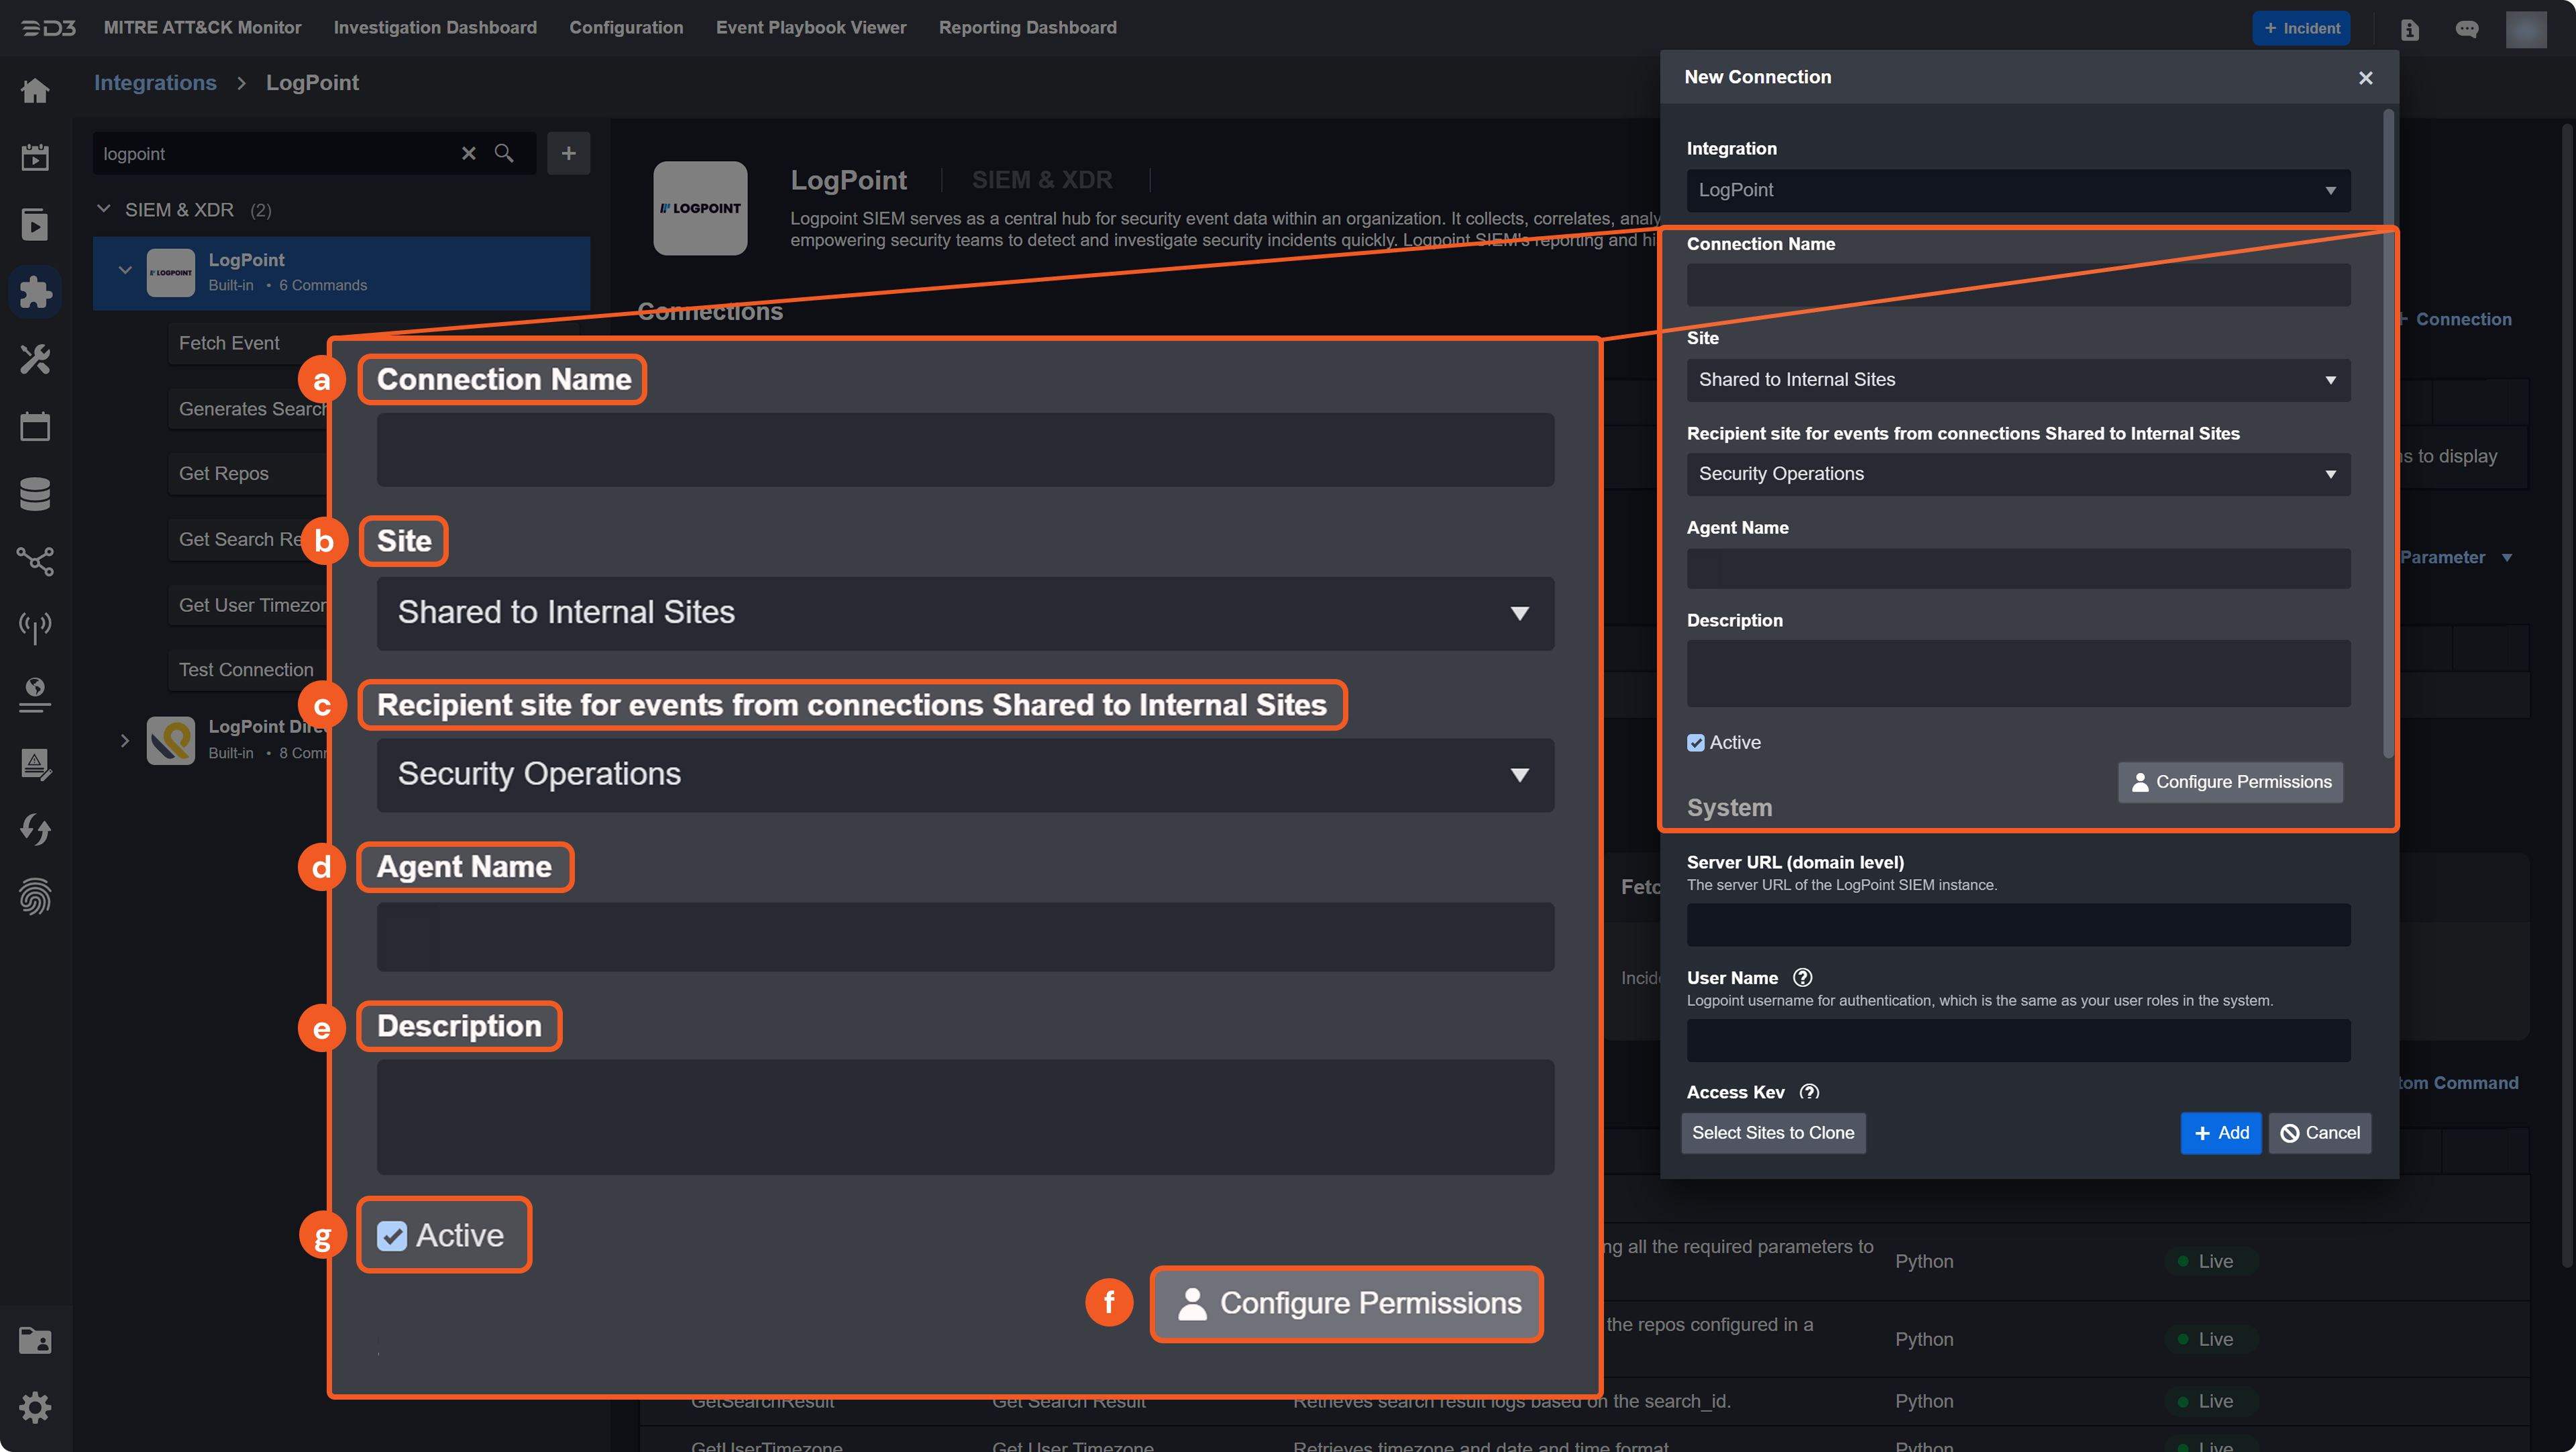
Connection Name: The desired name for the connection.
Site: Specifies the site to use the integration connection. Use the drop-down menu to select the site. The Share to Internal Sites option enables all sites defined as internal sites to use the connection. Selecting a specific site will only enable that site to use the connection.
Recipient site for events from connections Shared to Internal Sites: This field is displayed when Share to Internal Sites is selected for the Site field, allowing selection of the internal site for deploying the integration connection.
Agent Name (Optional): Specifies the proxy agent required to build the connection. Use the dropdown menu to select the proxy agent from a list of previously configured proxy agents.
Description (Optional): Add a description for the connection.
Configure User Permissions: Defines which users have access to the connection.
Active: Check the checkbox to ensure the connection is available for use.
System: This section contains the parameters defined specifically for the integration. These parameters must be configured to create the integration connection.
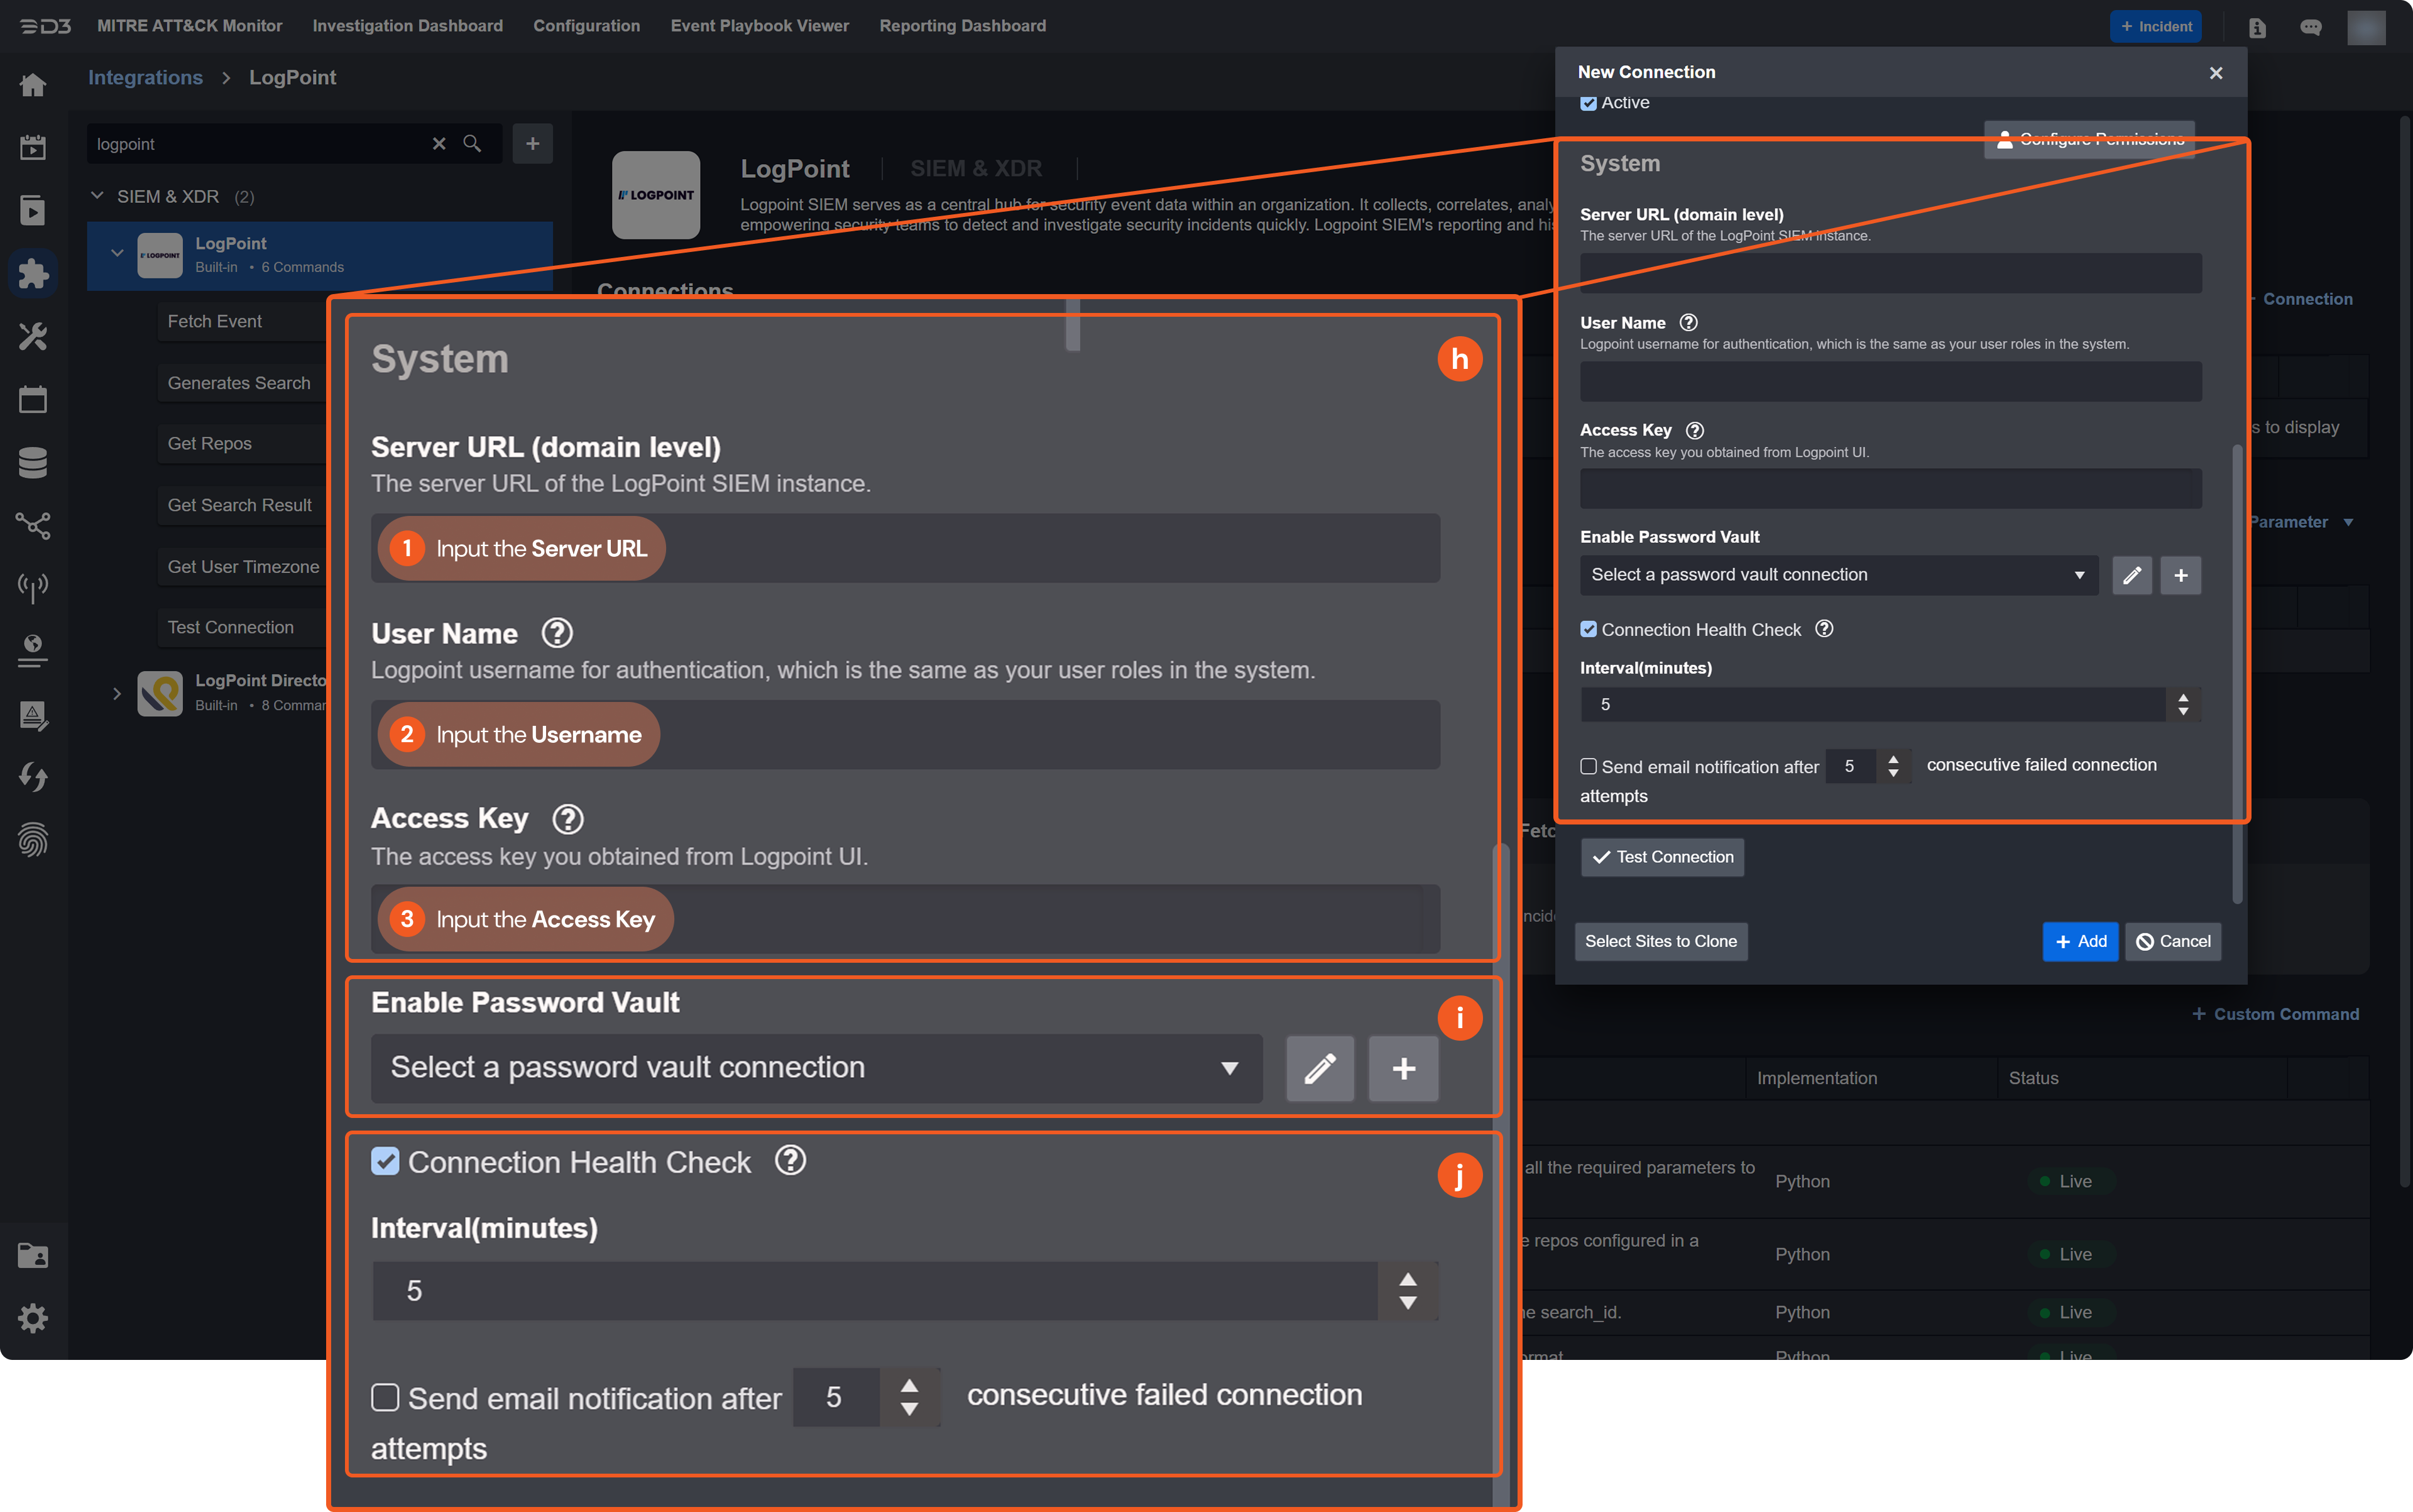
1. Input the Server URL.
2. Input the Username.
3. Copy the Access Key from the Logpoint platform. Refer to Configuring Logpoint to Work with D3 SOAR.Enable Password Vault: An optional feature that allows users to take the stored credentials from their own password vault. Refer to the password vault connection guide if needed.
Connection Health Check: Periodically checks the connection status by scheduling the Test Connection command at the specified interval (in minutes). Available only for active connections, this feature also allows configuring email notifications for failed attempts.
Test the connection.
Click on the Test Connection button to verify credentials and connectivity. A success alert displays Passed with a green checkmark. If the connection fails, review the parameters and retry.
Click OK to close the alert window.
Click + Add to create and add the configured connection.
Commands
Logpoint includes the following executable commands for users to set up schedules or create playbook workflows. With the Test Command function, users can execute these commands independently for playbook troubleshooting.
Integration API Note
For more information about the Logpoint API, refer to the Logpoint API reference.
Note for Time-related parameters
The input format of time-related parameters may vary based on user account settings, which may cause the sample data in commands to differ from what is displayed. To adjust the time format, follow these steps:
Navigate to Configuration Application Settings. Select Date/Time Format.
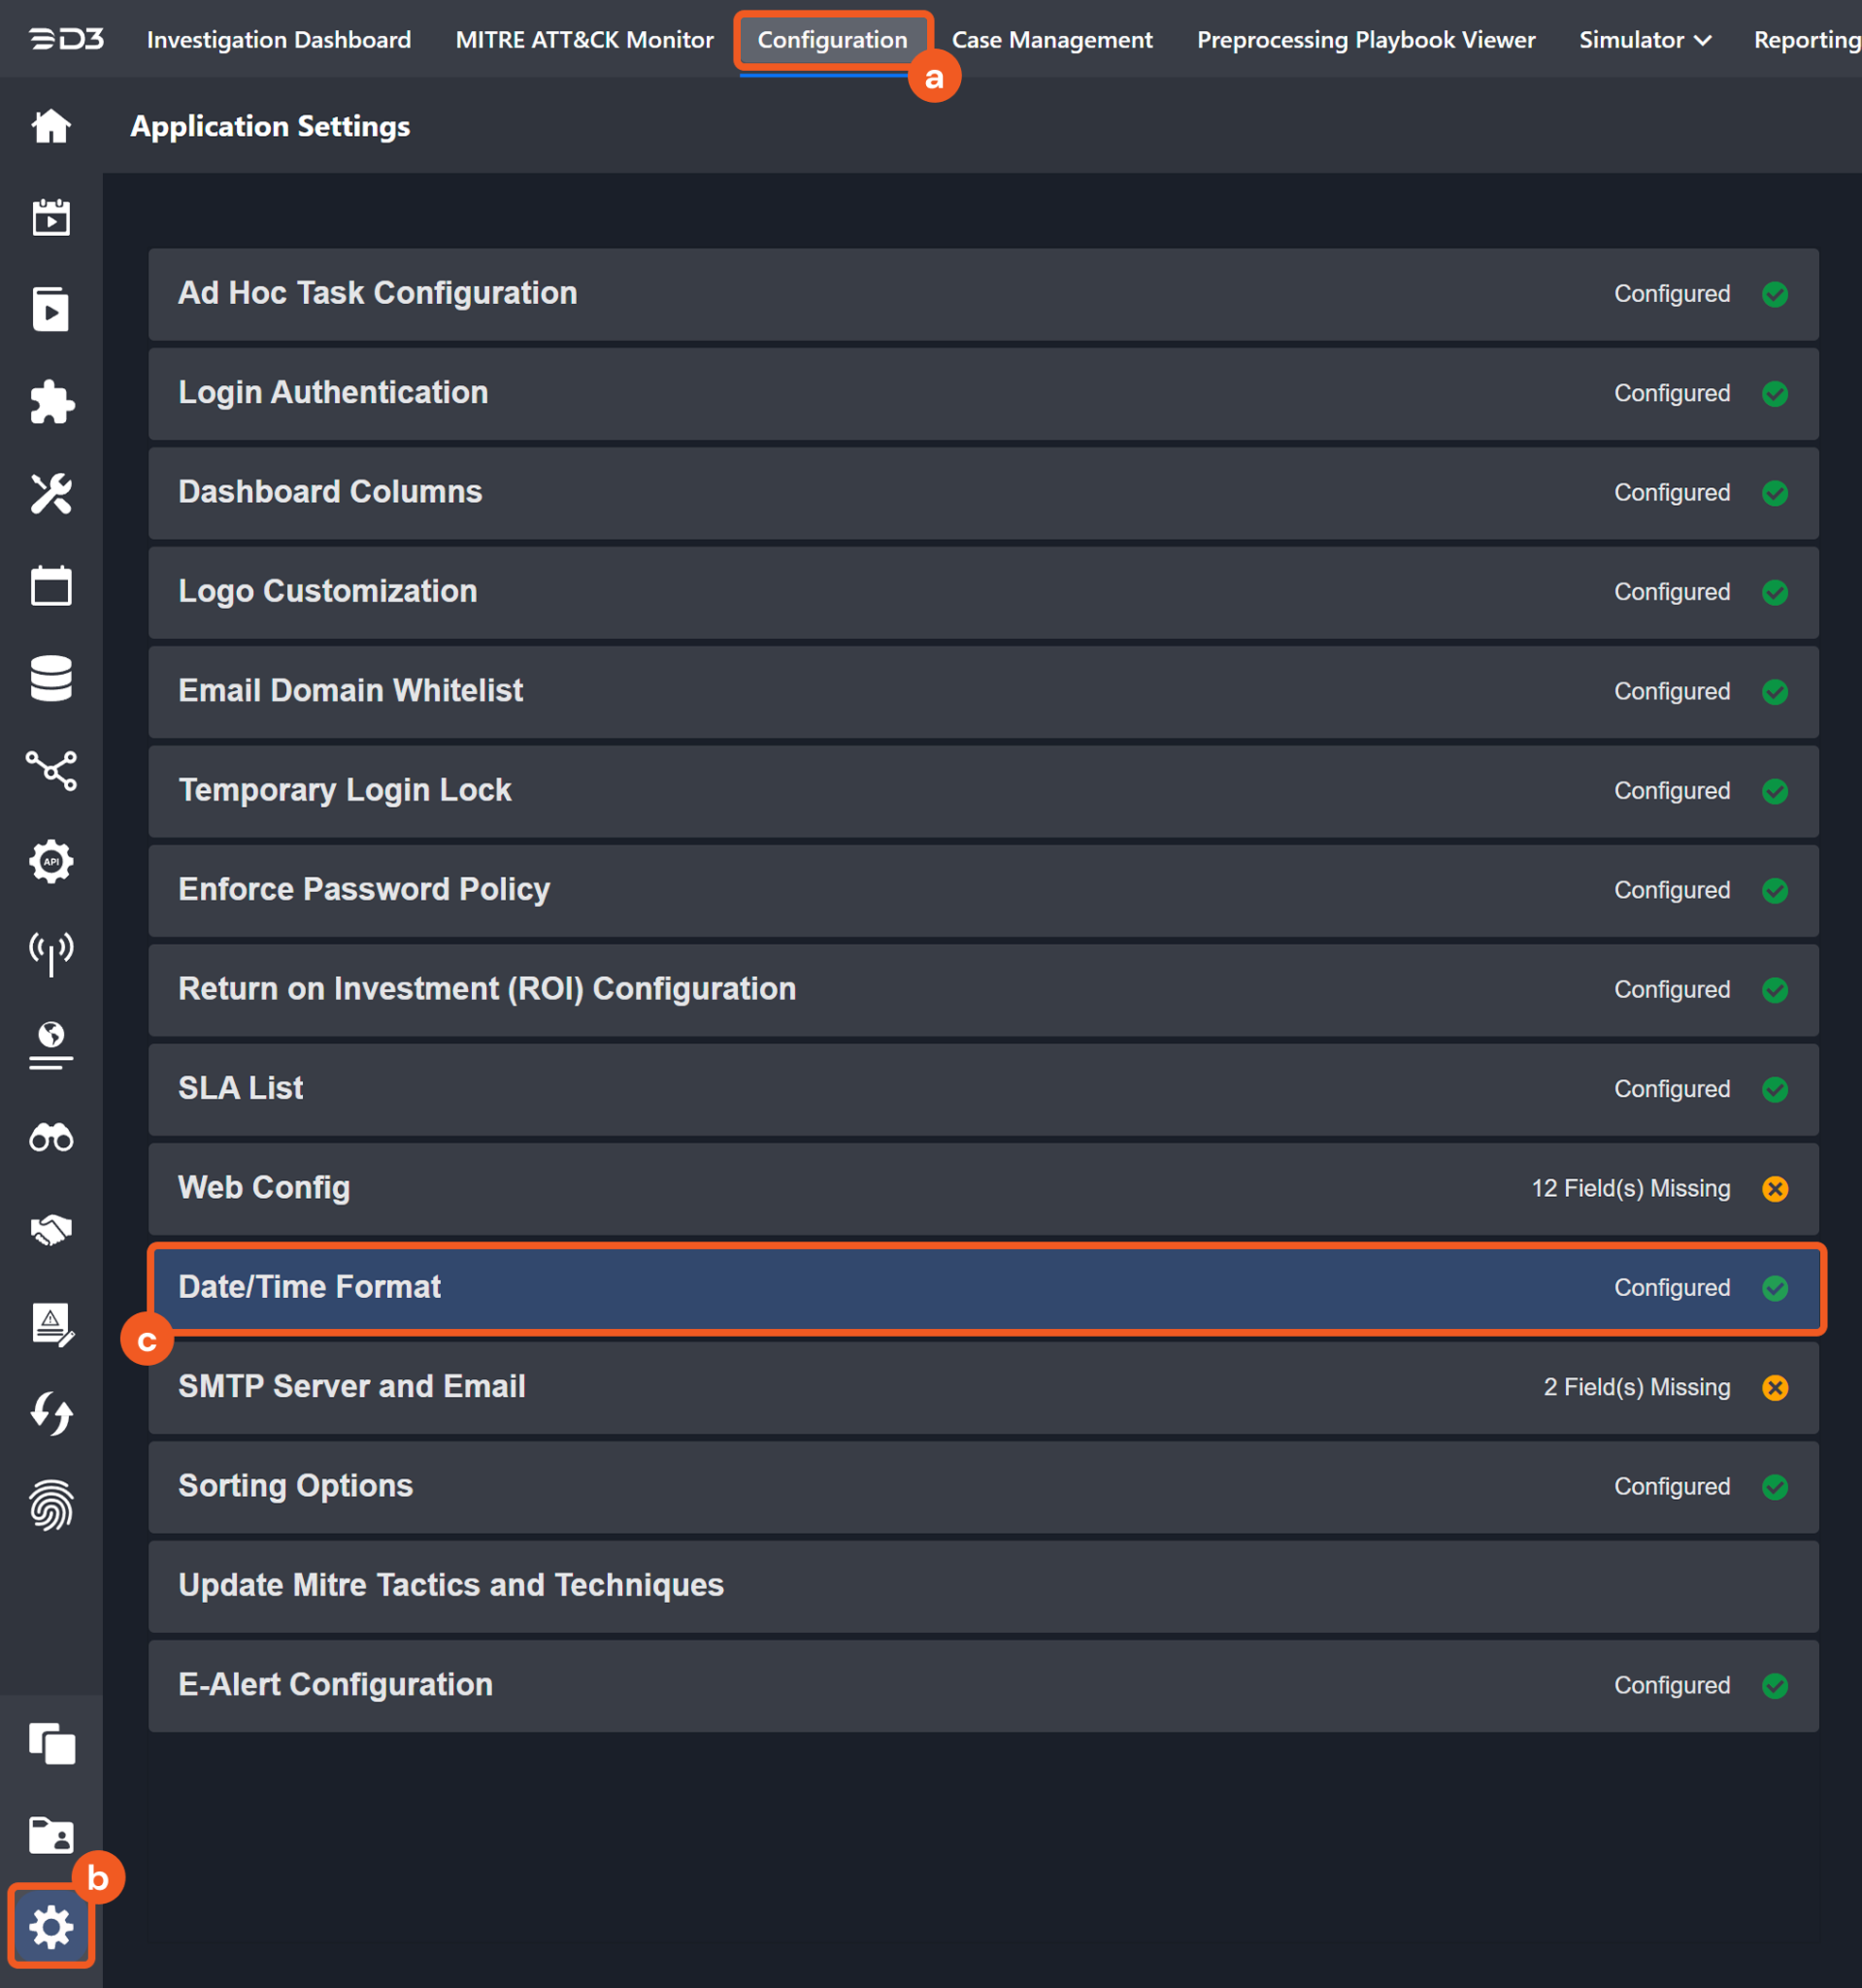
Choose the desired date and time format, then click on the Save button.
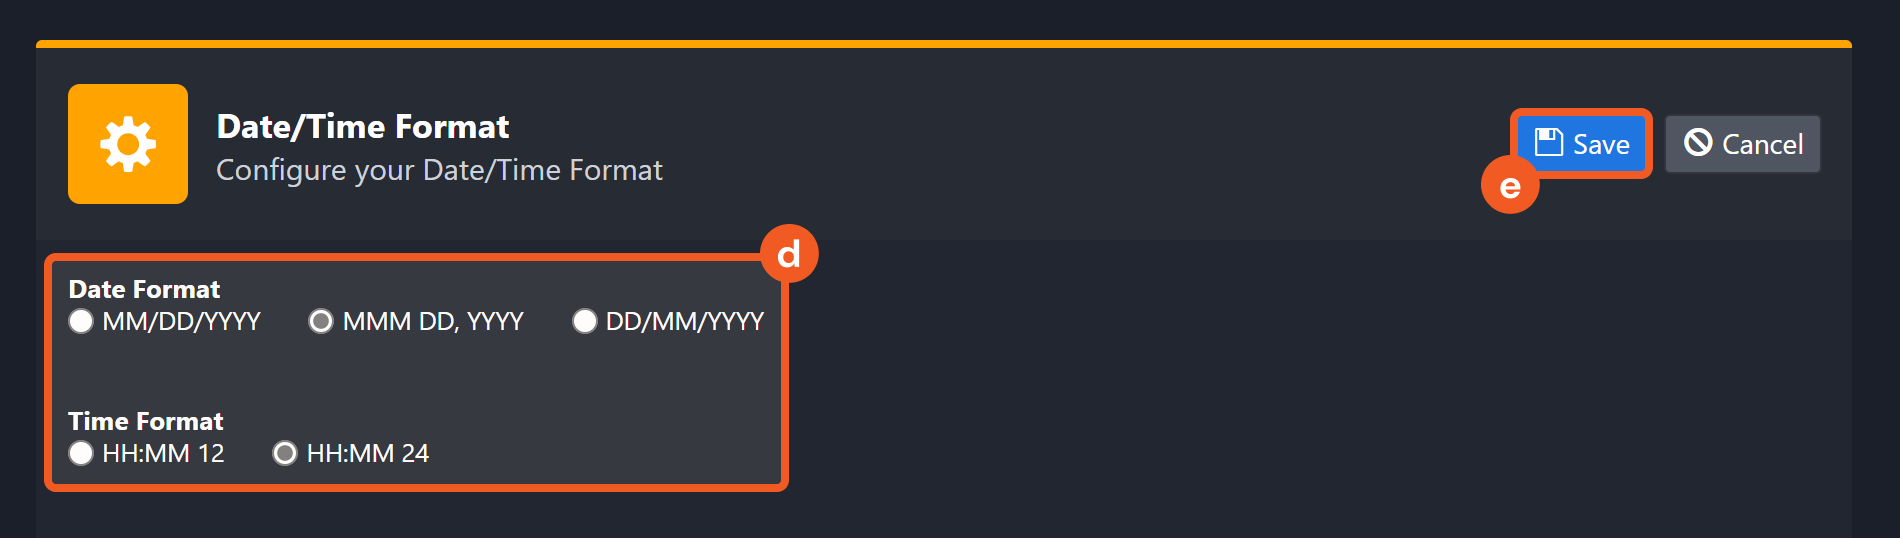
After that, users will be able to view their preferred time format when configuring the DateTime input parameters for commands.
Fetch Event
Returns incidents from the Logpoint SIEM platform based on specified criteria.
Input
Input Parameter | Required/Optional | Description | Example |
Start Time | Optional | The start of the time range for fetching events (in UTC). By default, Start Time is 24 hours before End Time. | 2024-01-10 00:00 |
End Time | Optional | The end of the time range for fetching events (in UTC). By default, End Time is the current time. | 2024-01-10 01:00 |
Name | Optional | Filters returned incidents by identification details. Supported values are: Name (incident name) Incident ID (unique incident identifier) AlertRule ID (unique identifier of the alert rule that generated the incidents) | Windows Registry Value Change |
Type | Optional | Filters returned incidents by the source that generated them. Available options are:
By default, all incidents regardless of their source are returned. | Alert |
Status | Optional | Filters incidents by resolution state. Available options are:
By default, all incidents regardless of their resolution state are returned. | Unresolved |
Risk | Optional | Filters incidents by severity level. Available options are:
By default, all incidents regardless of their severity level are returned. | Critical & High |
Attack Tag | Optional | Filters incidents by associated attack tags. |
JSON
|
Attack Category | Optional | Filters incidents by associated attack categories. |
JSON
|
Log Source | Optional | Filters incidents by associated log source information. By default, all incidents regardless of their log source information are returned. | Webserver |
Get Incident Data | Optional | Whether incident data is returned. By default, the value is set to False. | True |
Output
To view the sample output data for all commands, refer to this article.
Fetch Event Field Mapping
Fetch Event commands require event field mapping. Field mapping plays a key role for data normalization within the event pipeline. Field mapping converts the original data fields from the different providers to standardized D3 fields as defined by the D3 Model. Refer to Field Mappings for details.
To add a custom field, click on the + Add Field button. Users can also remove built-in field mappings by clicking x. Note that two underscore characters will automatically prefix the defined Field Name as the System Name for a custom field mapping. Additionally, if an input Field Name contains any spaces, they will automatically be replaced with underscores for the corresponding System Name.
As a system integration, the Logpoint integration has some pre-configured field mappings for default field mapping.
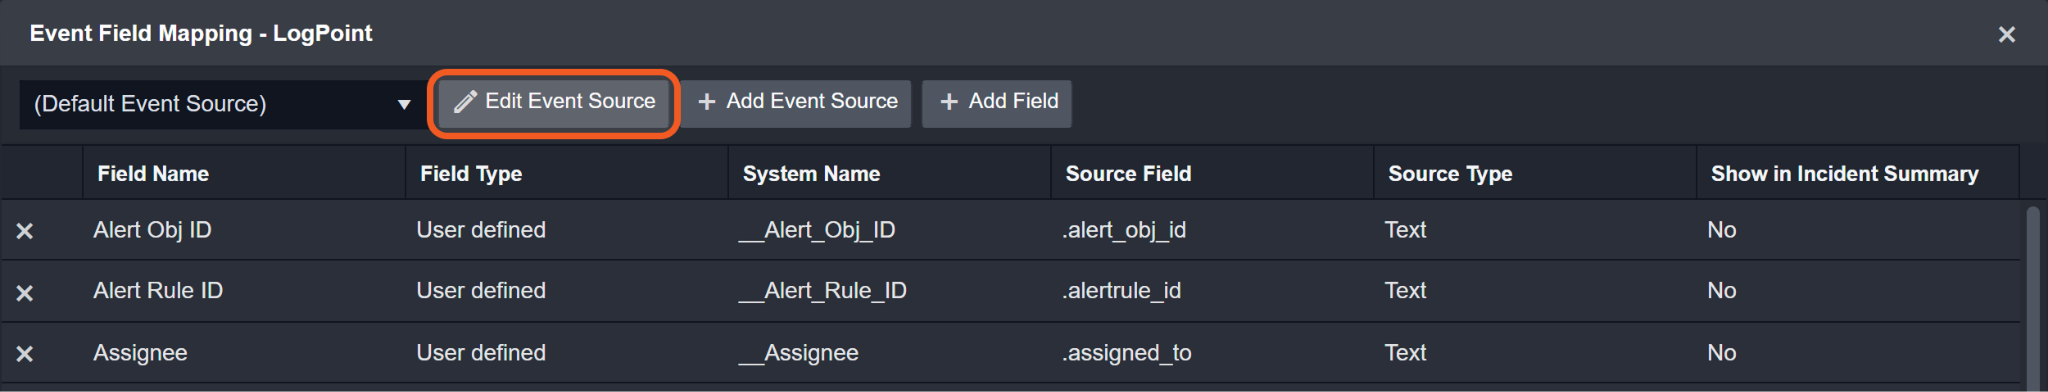
Default Event Source
The Default Event Source is the default set of field mappings that are applied when this fetch event command is executed. For out-of-the-box integrations, users will find a set of field mappings provided by the system. Default event source provides field mappings for common fields from the fetched data. The default event source has a "Main Event JSON Path" (i.e. $.incidents) that is used to extract a batch of events from the response raw data. View the "Main Event JSON Path" by clicking on the Edit Event Source button.
Main Event JSON Path: $.incidents
The Main Event JSON Path determines the root path where the system starts parsing raw response data into D3 event data. The JSON path begins with $, representing the root element. The path is formed by appending a sequence of child elements to $, each separated by a dot (.). Square brackets with nested quotation marks ([‘...’]) should be used to separate child elements in JSON arrays.
For example, the root node of a JSON Path is incidents. The child node denoting the Unique Event Key field would be id. Putting it together, the JSON Path expression to extract the Unique Event Key is $.incidents.id.
The pre-configured field mappings are detailed below:
Field Name | Source Field |
Alert Obj ID | .alert_obj_id |
Alert Rule ID | .alertrule_id |
Assignee | .assigned_to |
Attack Tags | .attack_tag |
Comments | .comments |
Incident ID | .incident_id |
Log Source | .log_source |
Loginspect IP DNS | .loginspect_ip_dns |
Query Statement | .query |
Repos | .repos |
Risk Level | .risk_level |
Time Range | .time_range |
Unique Event Key | .id |
Event name | .name |
Event Type | .type |
Start Time | .kvp_info[?(@.key.text=='json.timestamp')].value.text |
Description | .description |
Status | .status |
Tactics | .attack_category |
Techniques | .attack_id |
Username | .username |
Error Handling
If the Return Data displays Failed, an Error tab will appear in the Test Result window.
The error tab contains the details responded from D3 SOAR or third-party API calls, including Failure Indicator, Status Code, and Message. This can help locate the root cause of a command failure.
Parts in Error | Description | Example |
Failure Indicator | Indicates the command failure that happened at a specific input and/or API call. | Fetch Event failed. |
Status Code | The response code issued by the third-party API server or the D3 SOAR system that can be used to locate the corresponding error category. For example, if the returned status code is 401, the selected connection is unauthorized to run the command. The user or system support would need to check the permission setting in the Logpoint portal. Refer to the HTTP Status Code Registry for details. | Status Code: 400. |
Message | The raw data or captured key error message from the integration API server about the API request failure. | Message: Bad request. |
Error Sample Data Fetch Event failed. Status Code: 400. Message: Bad request. |
Generate Search
Generates a search request by sending the required parameters to retrieve a Search ID.
READER NOTE
Query is a required parameter to run this command.
Run the Fetch Event command to obtain the Query. Queries can be found in the raw data at the path $.incidents[*].query.
Repo Addresses is an optional parameter to run this command.
Run the Get Repos command to obtain the Repo Addresses. Repo Addresses can be found in the raw data at the path $.allowed_repos[*].address.
Run the Fetch Event command to obtain the Repo Addresses to search for incident-related logs. Repo Addresses can be found in the raw data at the path $.incidents[*].repos[*].
Input
Input Parameter | Required/Optional | Description | Example |
Query | Required | A valid search query in Logpoint. To search for Incident-related logs, Query can be obtained using the Fetch Event command. | |chart count() by device_ip |
Time Range | Optional | The time range for the search. By default, the value is set to Last 5 minutes. | Last 24 hours |
Limit | Optional | The maximum number of rows returned in a single request. By default, the value is 100. | 10 |
Repo Addresses | Optional | The addresses of the repositories where the logs reside. Repo Addresses can be obtained using the Get Repos command. To search for incident-related logs, Repo Addresses can be obtained using the Fetch Event command. |
JSON
|
Output
To view the sample output data for all commands, refer to this article.
Error Handling
If the Return Data displays Failed, an Error tab will appear in the Test Result window.
The error tab contains the details responded from D3 SOAR or third-party API calls, including Failure Indicator, Status Code, and Message. This can help locate the root cause of a command failure.
Parts in Error | Description | Example |
Failure Indicator | Indicates the command failure that happened at a specific input and/or API call. | Generate Search failed. |
Status Code | The response code issued by the third-party API server or the D3 SOAR system that can be used to locate the corresponding error category. For example, if the returned status code is 401, the selected connection is unauthorized to run the command. The user or system support would need to check the permission setting in the Logpoint portal. Refer to the HTTP Status Code Registry for details. | Status code: 400. |
Message | The raw data or captured key error message from the integration API server about the API request failure. | Bad request. |
Error Sample Data Generate Search failed. Status code: 400. Bad request. |
Get Repos
Retrieves the names and IP addresses of all repositories configured in Logpoint.
Input
N/A
Output
To view the sample output data for all commands, refer to this article.
Error Handling
If the Return Data displays Failed, an Error tab will appear in the Test Result window.
The error tab contains the details responded from D3 SOAR or third-party API calls, including Failure Indicator, Status Code, and Message. This can help locate the root cause of a command failure.
Parts in Error | Description | Example |
Failure Indicator | Indicates the command failure that happened at a specific input and/or API call. | Get Repos failed. |
Status Code | The response code issued by the third-party API server or the D3 SOAR system that can be used to locate the corresponding error category. For example, if the returned status code is 401, the selected connection is unauthorized to run the command. The user or system support would need to check the permission setting in the Logpoint portal. Refer to the HTTP Status Code Registry for details. | Status code: 400. |
Message | The raw data or captured key error message from the integration API server about the API request failure. | Bad request. |
Error Sample Data Get Repos failed. Status code: 400. Bad request. |
Get Search Result
Retrieves search result logs using the Search ID.
READER NOTE
Search ID is a required parameter to run this command.
Run the Generate Search command to obtain the Search ID. Search IDs can be found in the raw data at the path $.search_id.
Input
Input Parameter | Required/Optional | Description | Example |
Search ID | Required | Search ID can be obtained using the Generate Search command. | ***** |
Output
To view the sample output data for all commands, refer to this article.
Error Handling
If the Return Data displays Failed, an Error tab will appear in the Test Result window.
The error tab contains the details responded from D3 SOAR or third-party API calls, including Failure Indicator, Status Code, and Message. This can help locate the root cause of a command failure.
Parts in Error | Description | Example |
Failure Indicator | Indicates the command failure that happened at a specific input and/or API call. | Get Search Result failed. |
Status Code | The response code issued by the third-party API server or the D3 SOAR system that can be used to locate the corresponding error category. For example, if the returned status code is 401, the selected connection is unauthorized to run the command. The user or system support would need to check the permission setting in the Logpoint portal. Refer to the HTTP Status Code Registry for details. | Status code: 400. |
Message | The raw data or captured key error message from the integration API server about the API request failure. | Bad request. |
Error Sample Data Get Search Result failed. Status code: 400. Bad request. |
Get User Timezone
Retrieves the timezone and date and time format.
Input
N/A
Output
To view the sample output data for all commands, refer to this article.
Error Handling
If the Return Data displays Failed, an Error tab will appear in the Test Result window.
The error tab contains the details responded from D3 SOAR or third-party API calls, including Failure Indicator, Status Code, and Message. This can help locate the root cause of a command failure.
Parts in Error | Description | Example |
Failure Indicator | Indicates the command failure that happened at a specific input and/or API call. | Get User Timezone failed. |
Status Code | The response code issued by the third-party API server or the D3 SOAR system that can be used to locate the corresponding error category. For example, if the returned status code is 401, the selected connection is unauthorized to run the command. The user or system support would need to check the permission setting in the Logpoint portal. Refer to the HTTP Status Code Registry for details. | Status code: 400. |
Message | The raw data or captured key error message from the integration API server about the API request failure. | Bad request. |
Error Sample Data Get User Timezone failed. Status code: 400. Bad request. |
Test Connection
Allows users to perform a health check on an integration connection. Users can schedule a periodic health check by selecting Connection Health Check when editing an integration connection.
Input
N/A
Output
Output Type | Description | Return Data Type |
Return Data | Indicates one of the possible command execution states: Successful or Failed. The Failed state can be triggered by any of the following errors: A connection issue with the integration The API returned an error message No response from the API More details about an error can be viewed in the Error tab. | String |
Error Handling
If the Return Data displays Failed, an Error tab will appear in the Test Result window.
The error tab contains the details responded from D3 SOAR or third-party API calls, including Failure Indicator, Status Code, and Message. This can help locate the root cause of a command failure.
Parts in Error | Description | Example |
Failure Indicator | Indicates the command failure that happened at a specific input and/or API call. | Test Connection failed. Failed to check the connector. |
Status Code | The response code issued by the third-party API server or the D3 SOAR system that can be used to locate the corresponding error category. For example, if the returned status code is 401, the selected connection is unauthorized to run the command. The user or system support would need to check the permission setting in the Logpoint portal. Refer to the HTTP Status Code Registry for details. | Status code: 400. |
Message | The raw data or captured key error message from the integration API server about the API request failure. | Bad request. |
Error Sample Data Test Connection failed. Failed to check the connector. Status code: 400. Message: Bad request. |