
Grafana
LAST UPDATED: APR 11, 2025
Overview
Grafana is an open-source platform for monitoring, observability, and data visualization. It enables organizations to create dynamic, interactive dashboards that display metrics and logs from various sources. This integration enables clients to send Loki log messages and Metrics to Grafana.
D3 SOAR is providing REST operations to function with Grafana.
Grafana is available for use in:
Known Limitations
Grafana Cloud follows a pay-as-you-go policy, allowing users to be billed based on actual usage across logs and metrics.
Refer to Logs invoice | Grafana and Metrics invoice | Grafana for detailed information.
Connection
To connect to Grafana from D3 SOAR, follow this part to collect the required information below:
Parameter | Description | Example |
Loki Log URL | The Loki Log URL obtained from the Loki Logging Service. | https://logs-prod-021.grafana.net |
Loki Log Username | The Loki Log username (ID) obtained from the Loki Logging Service. | ***** |
Metrics URL | The Metrics URL obtained from the InfluxDB connection. This is only required when using the Send Metrics command. | https://influx-prod-36-prod-us-west-0.grafana.net |
Metrics Username | The Metrics username (ID) obtained from the InfluxDB connection. This is only required when using the Send Metrics command. | ***** |
API Token | The API Token generated within the specific Access Policy. | ***** |
Configuring Grafana to Work with D3 SOAR
Retrieving the Loki Log URL and Username
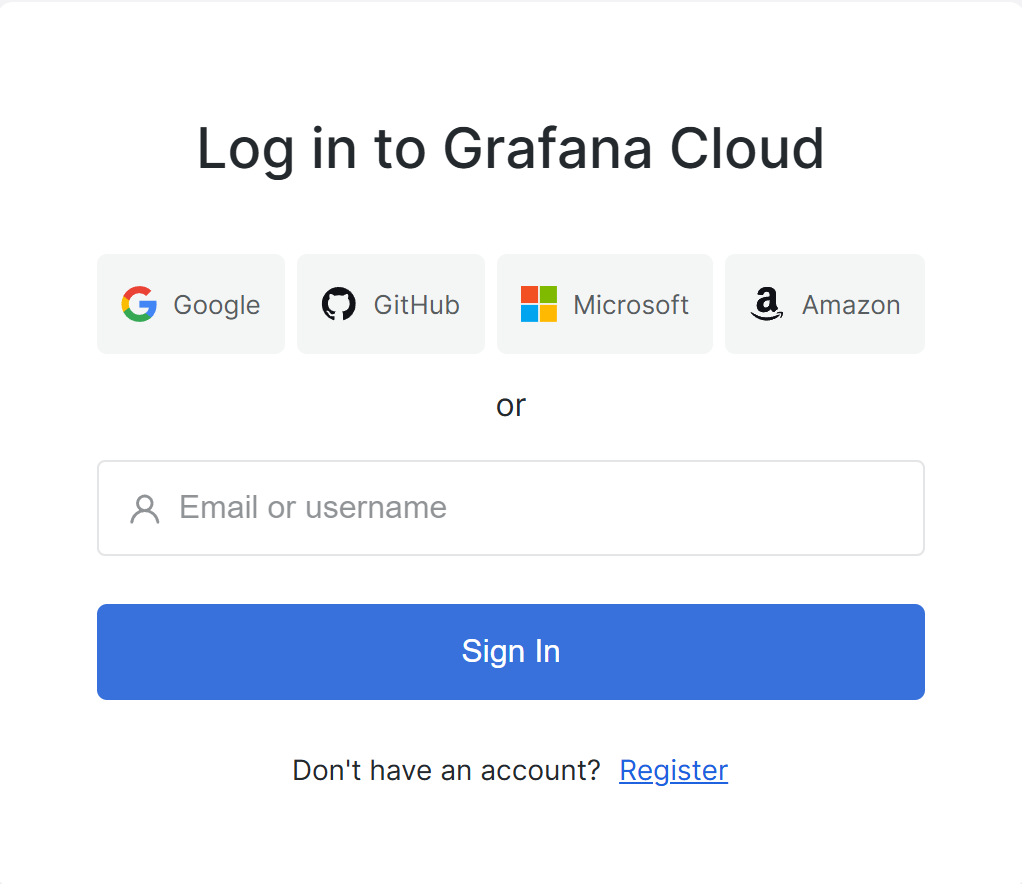
Log in to Grafana Cloud with an admin account.
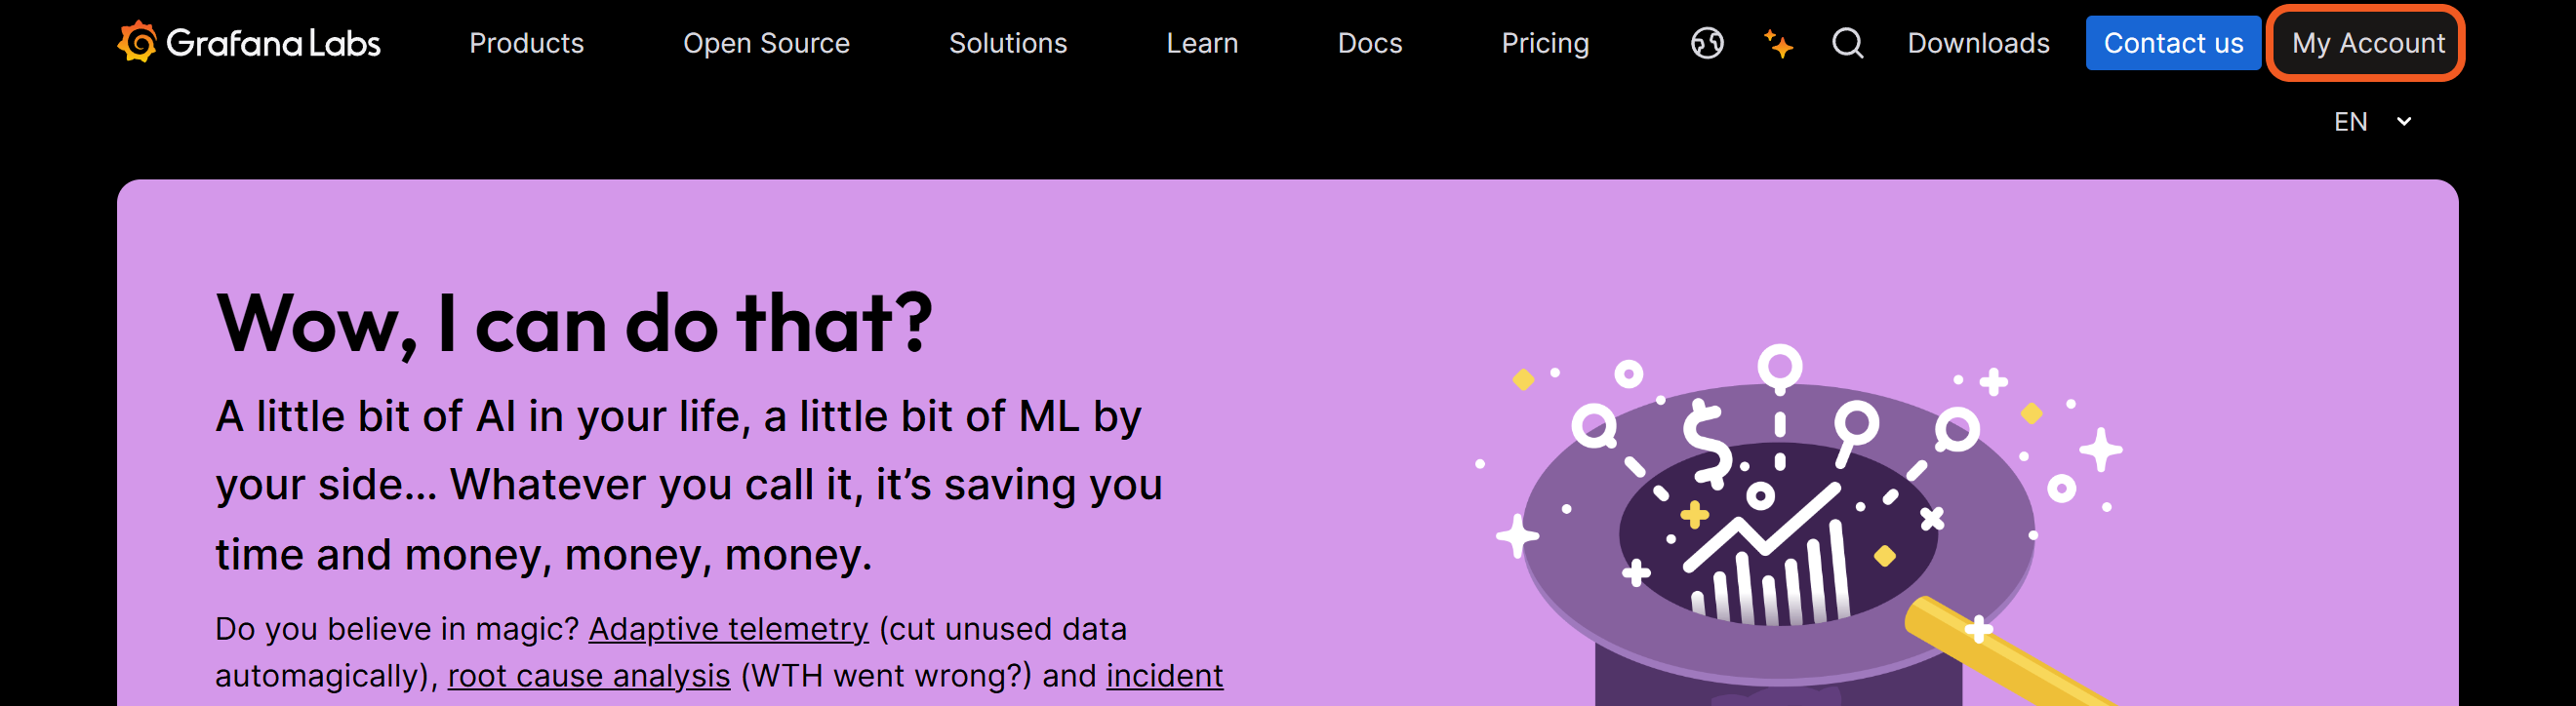
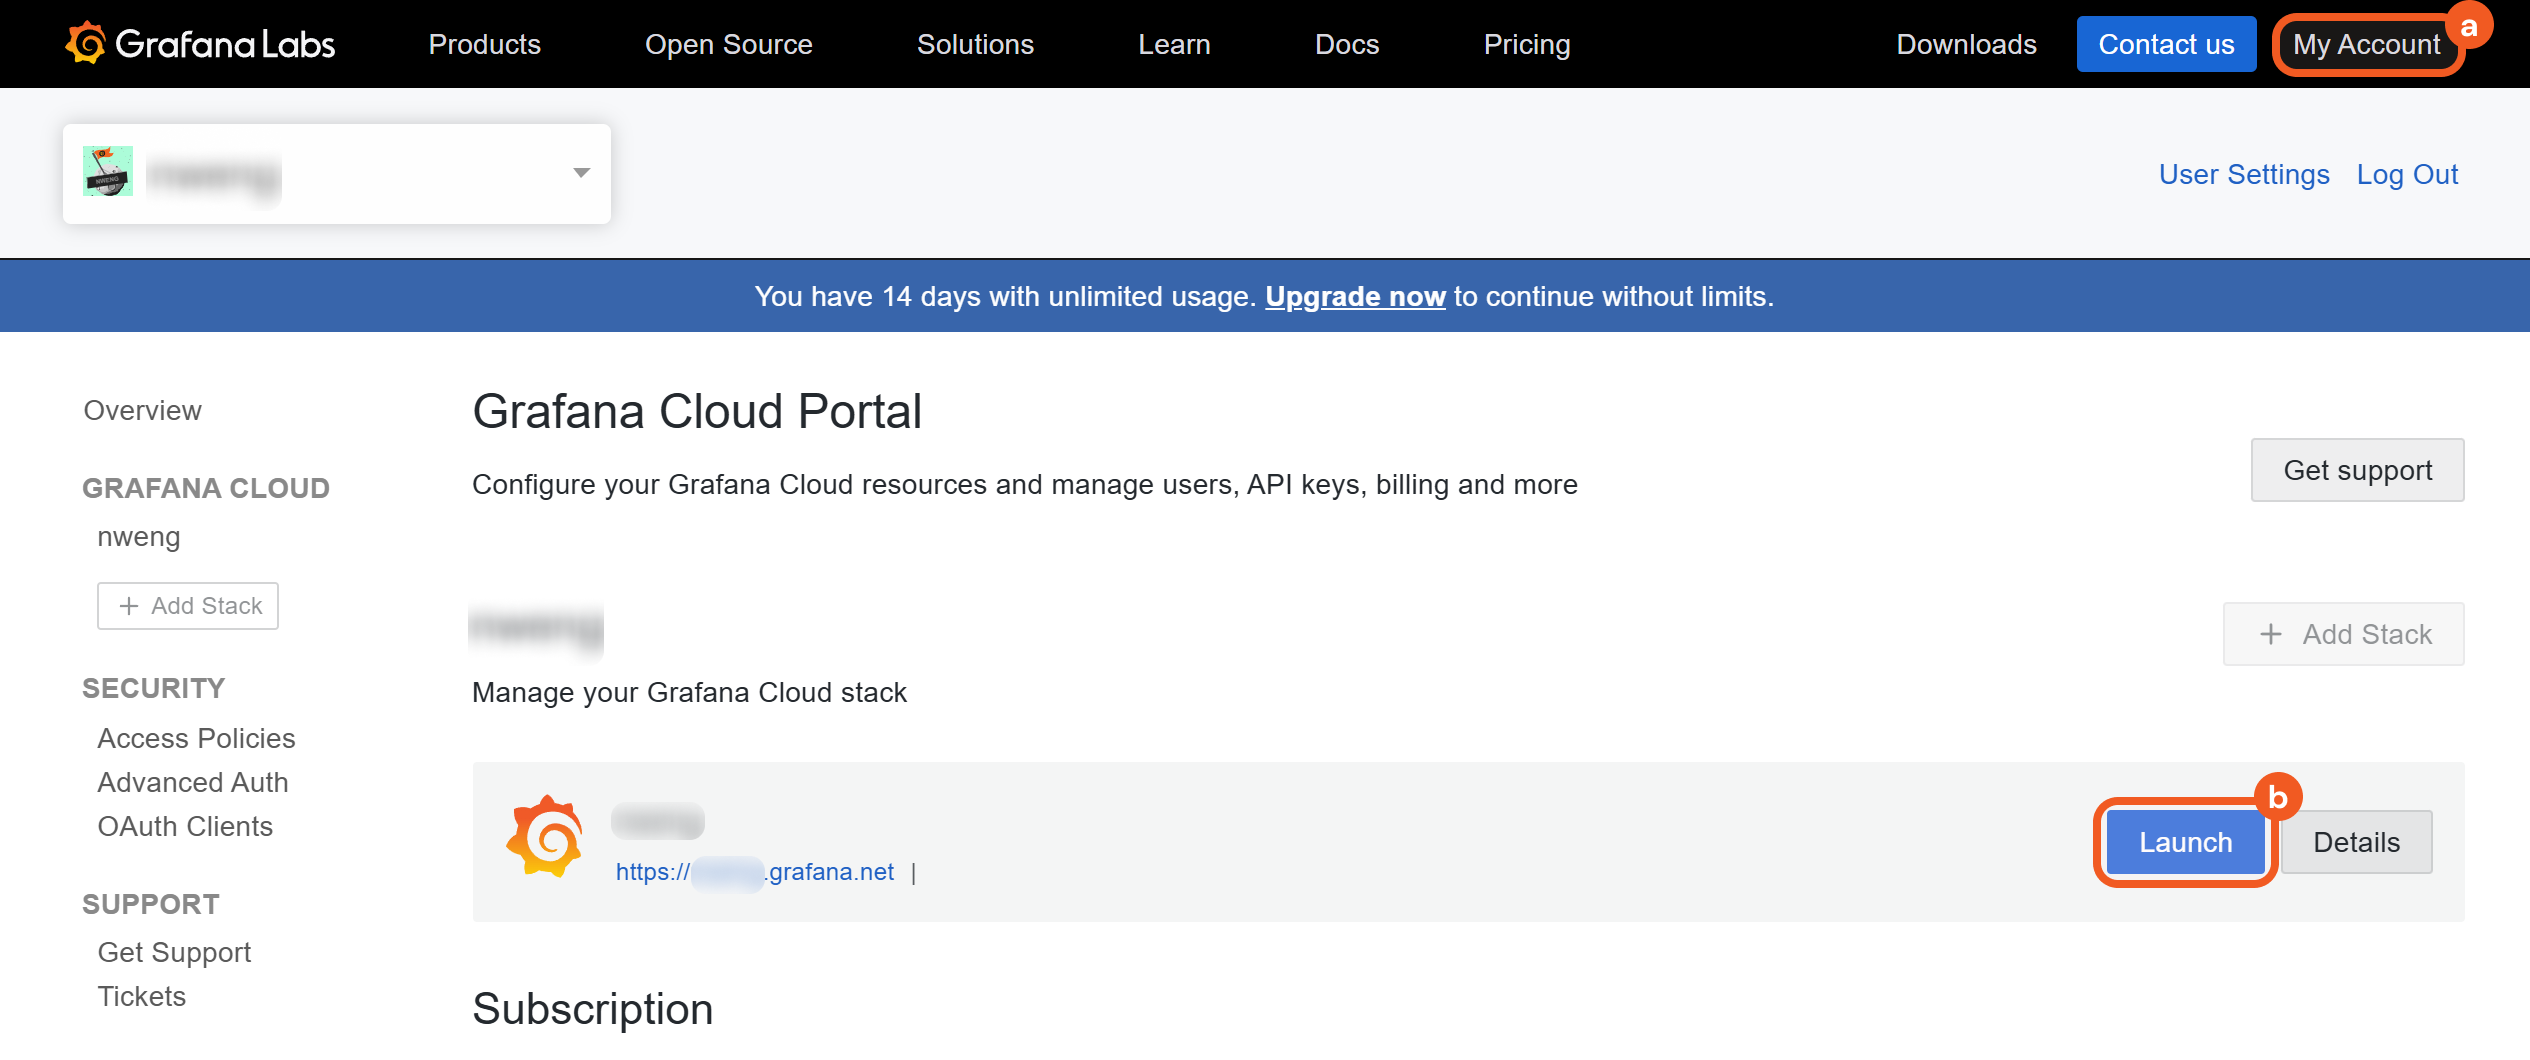
Click on the My Account link.
Click on the Launch button under the desired Grafana Cloud stack.
.png?inst-v=9d16beaf-952a-4ae4-8fe8-e35f7a3745da)
Locate the Loki stack, then click on the Details button.
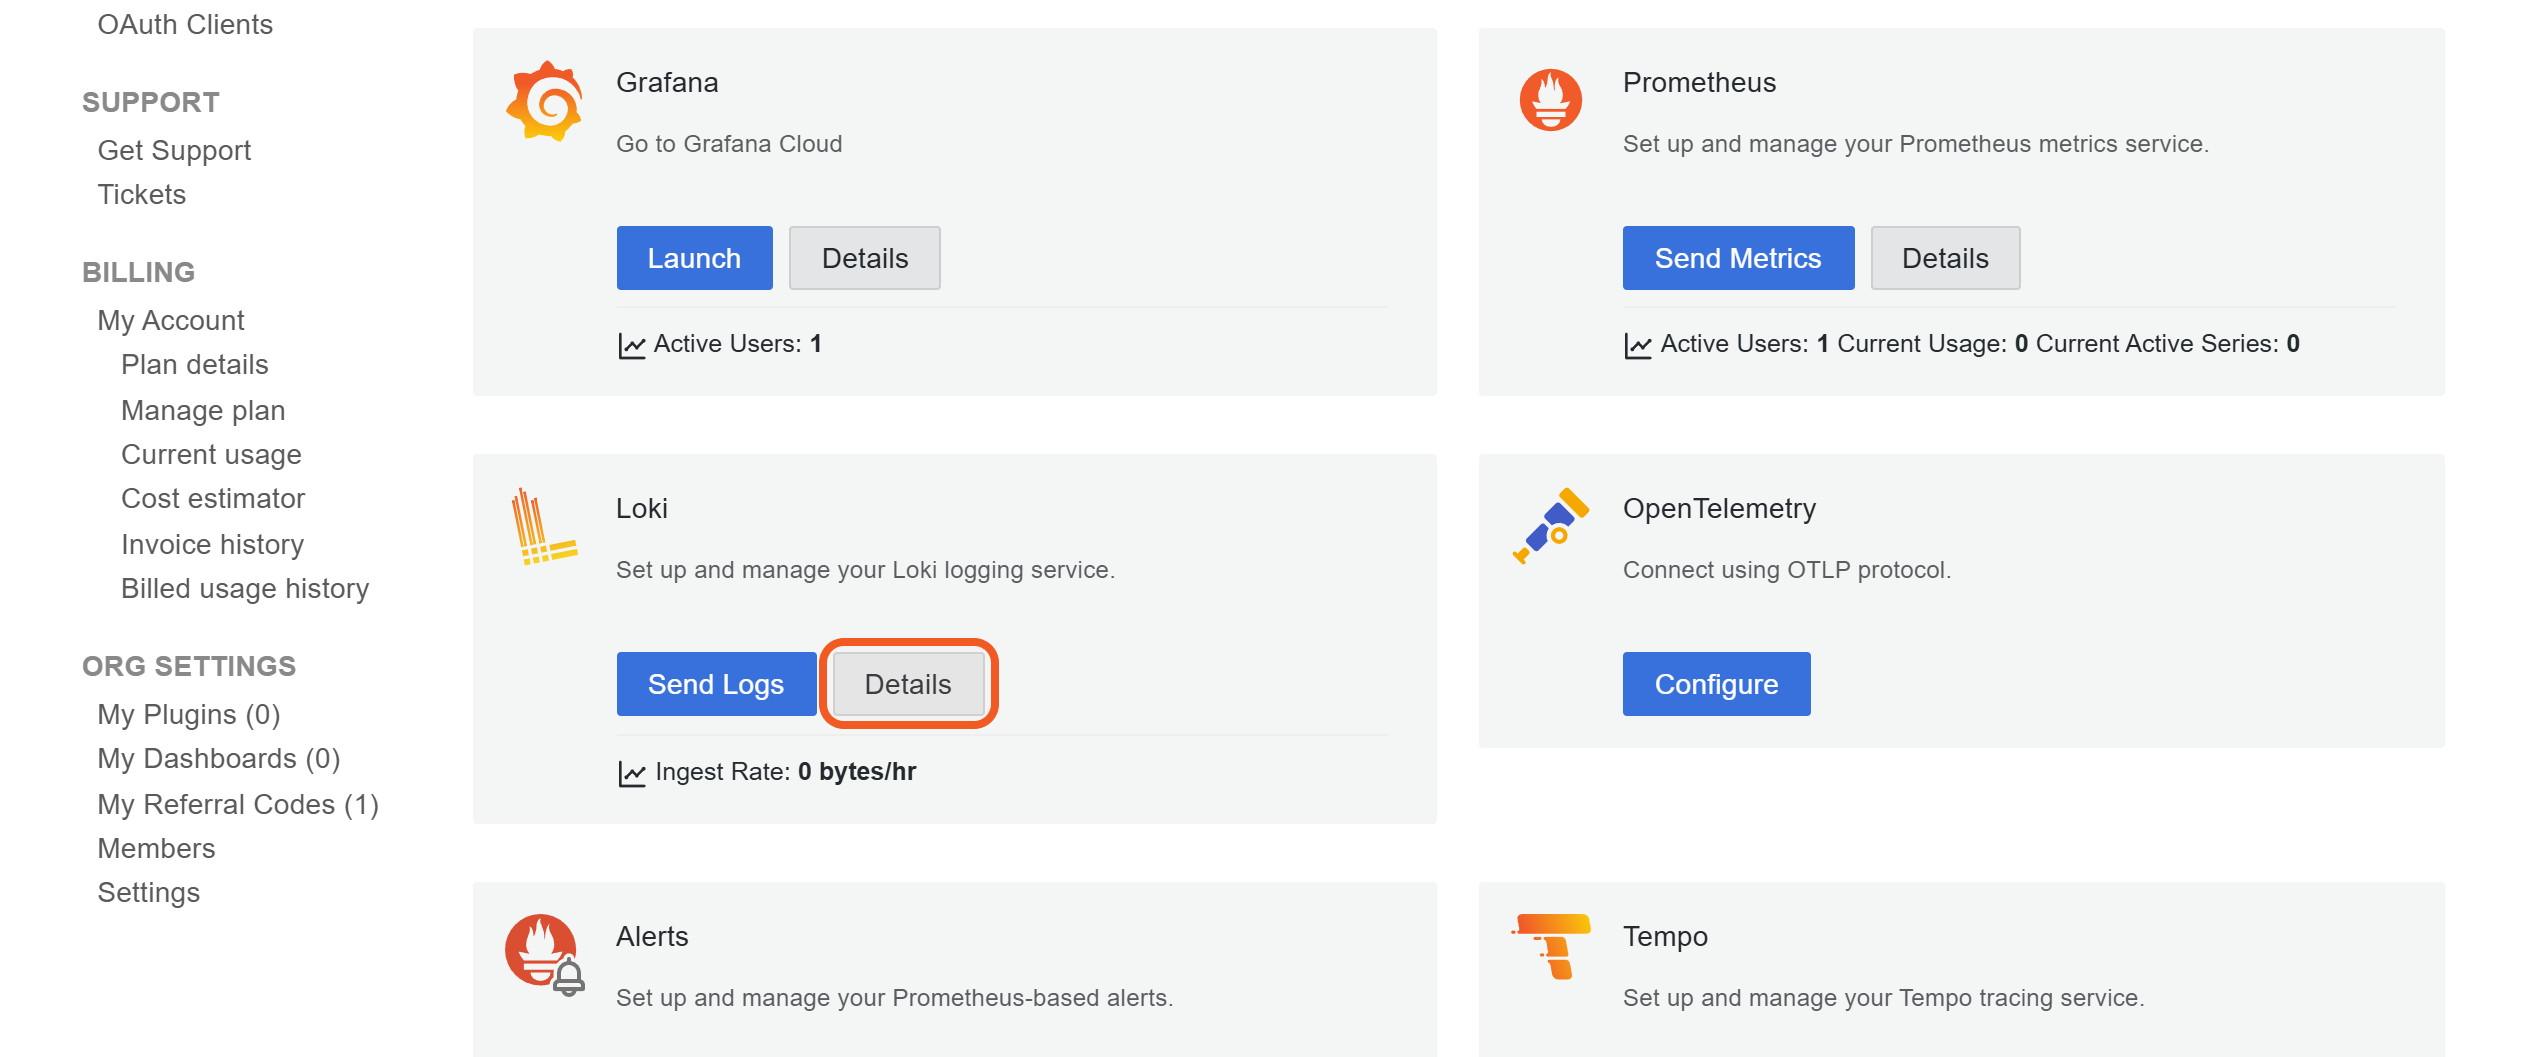
Copy and save the URL and user ID in a secure place. Refer to step 3i sub-steps 1 and 2 in Configuring D3 SOAR to Work with Grafana.
.png?inst-v=9d16beaf-952a-4ae4-8fe8-e35f7a3745da)
Creating the API Token
Click on the Generate now link.
.png?inst-v=9d16beaf-952a-4ae4-8fe8-e35f7a3745da)
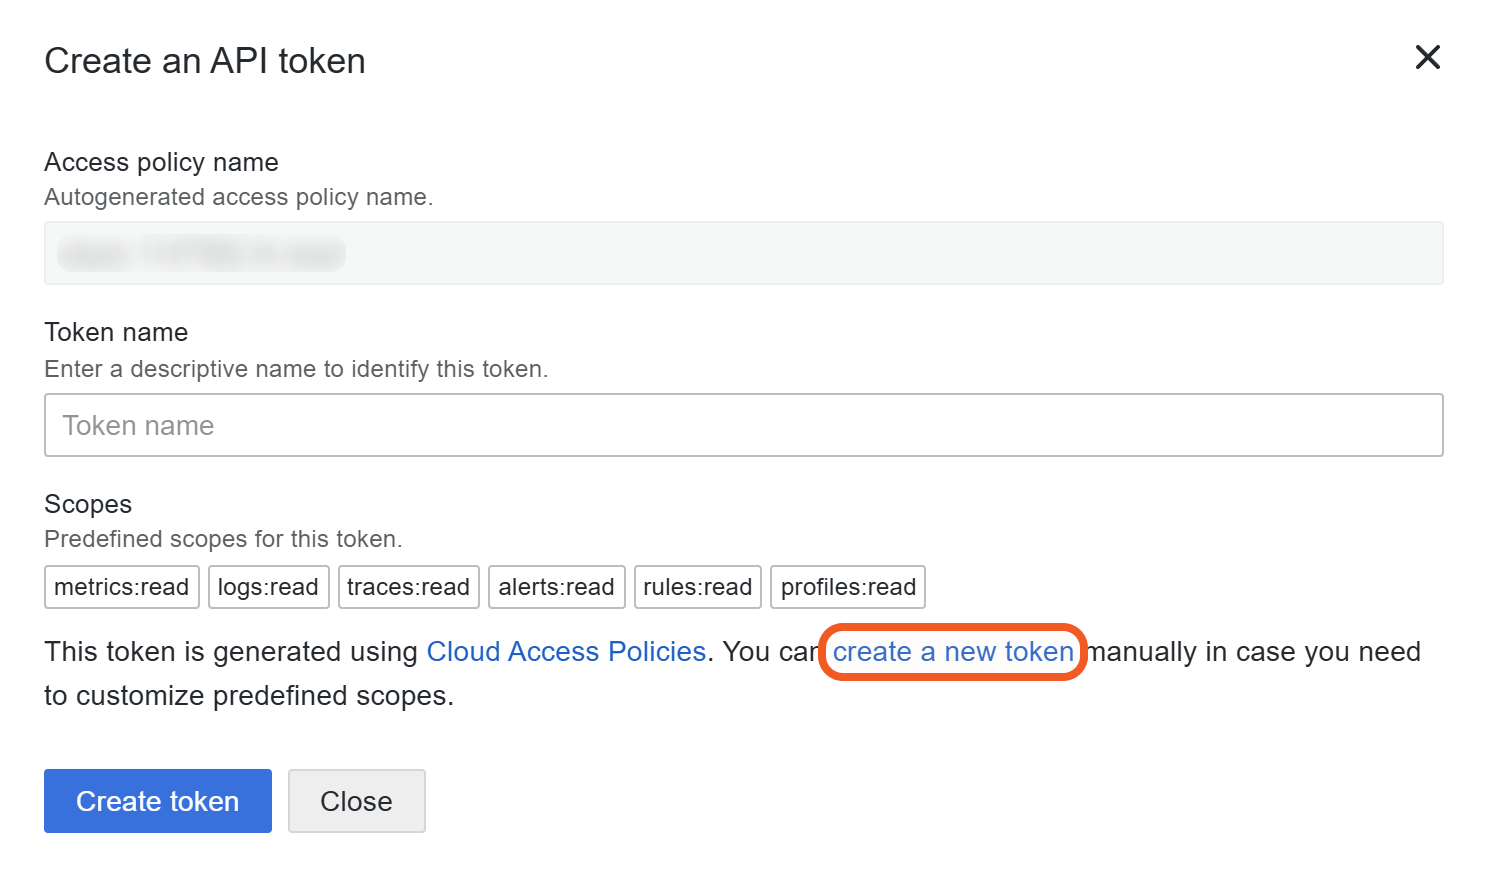
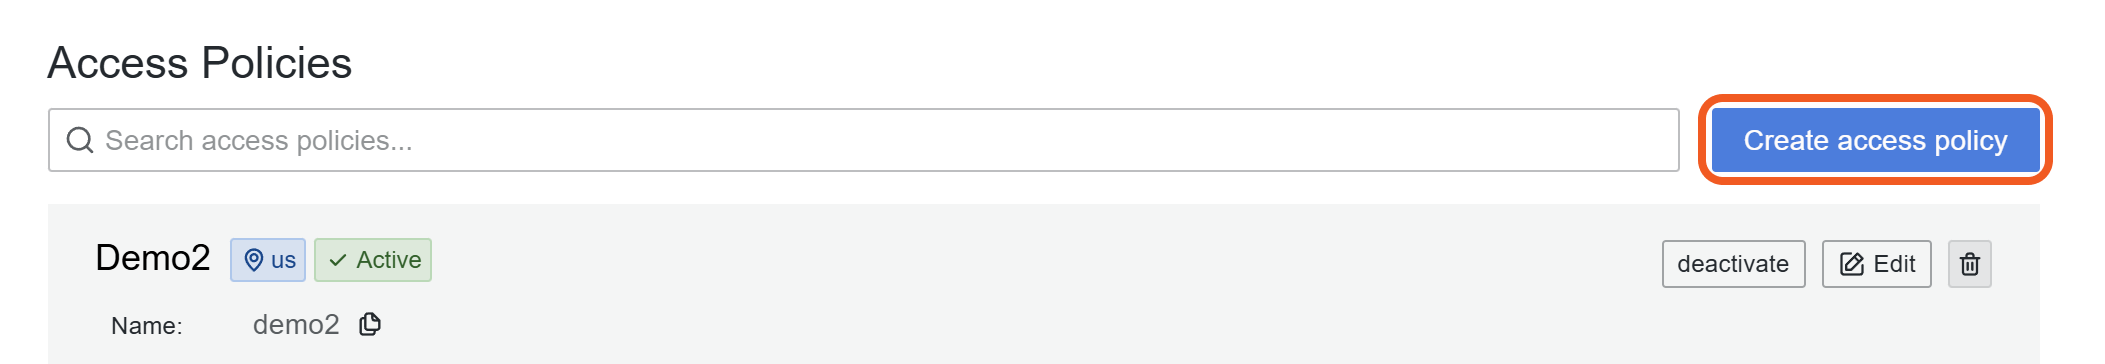
Click on the create a new token link.
Click on the Create access policy button.
Configure the access policy settings.
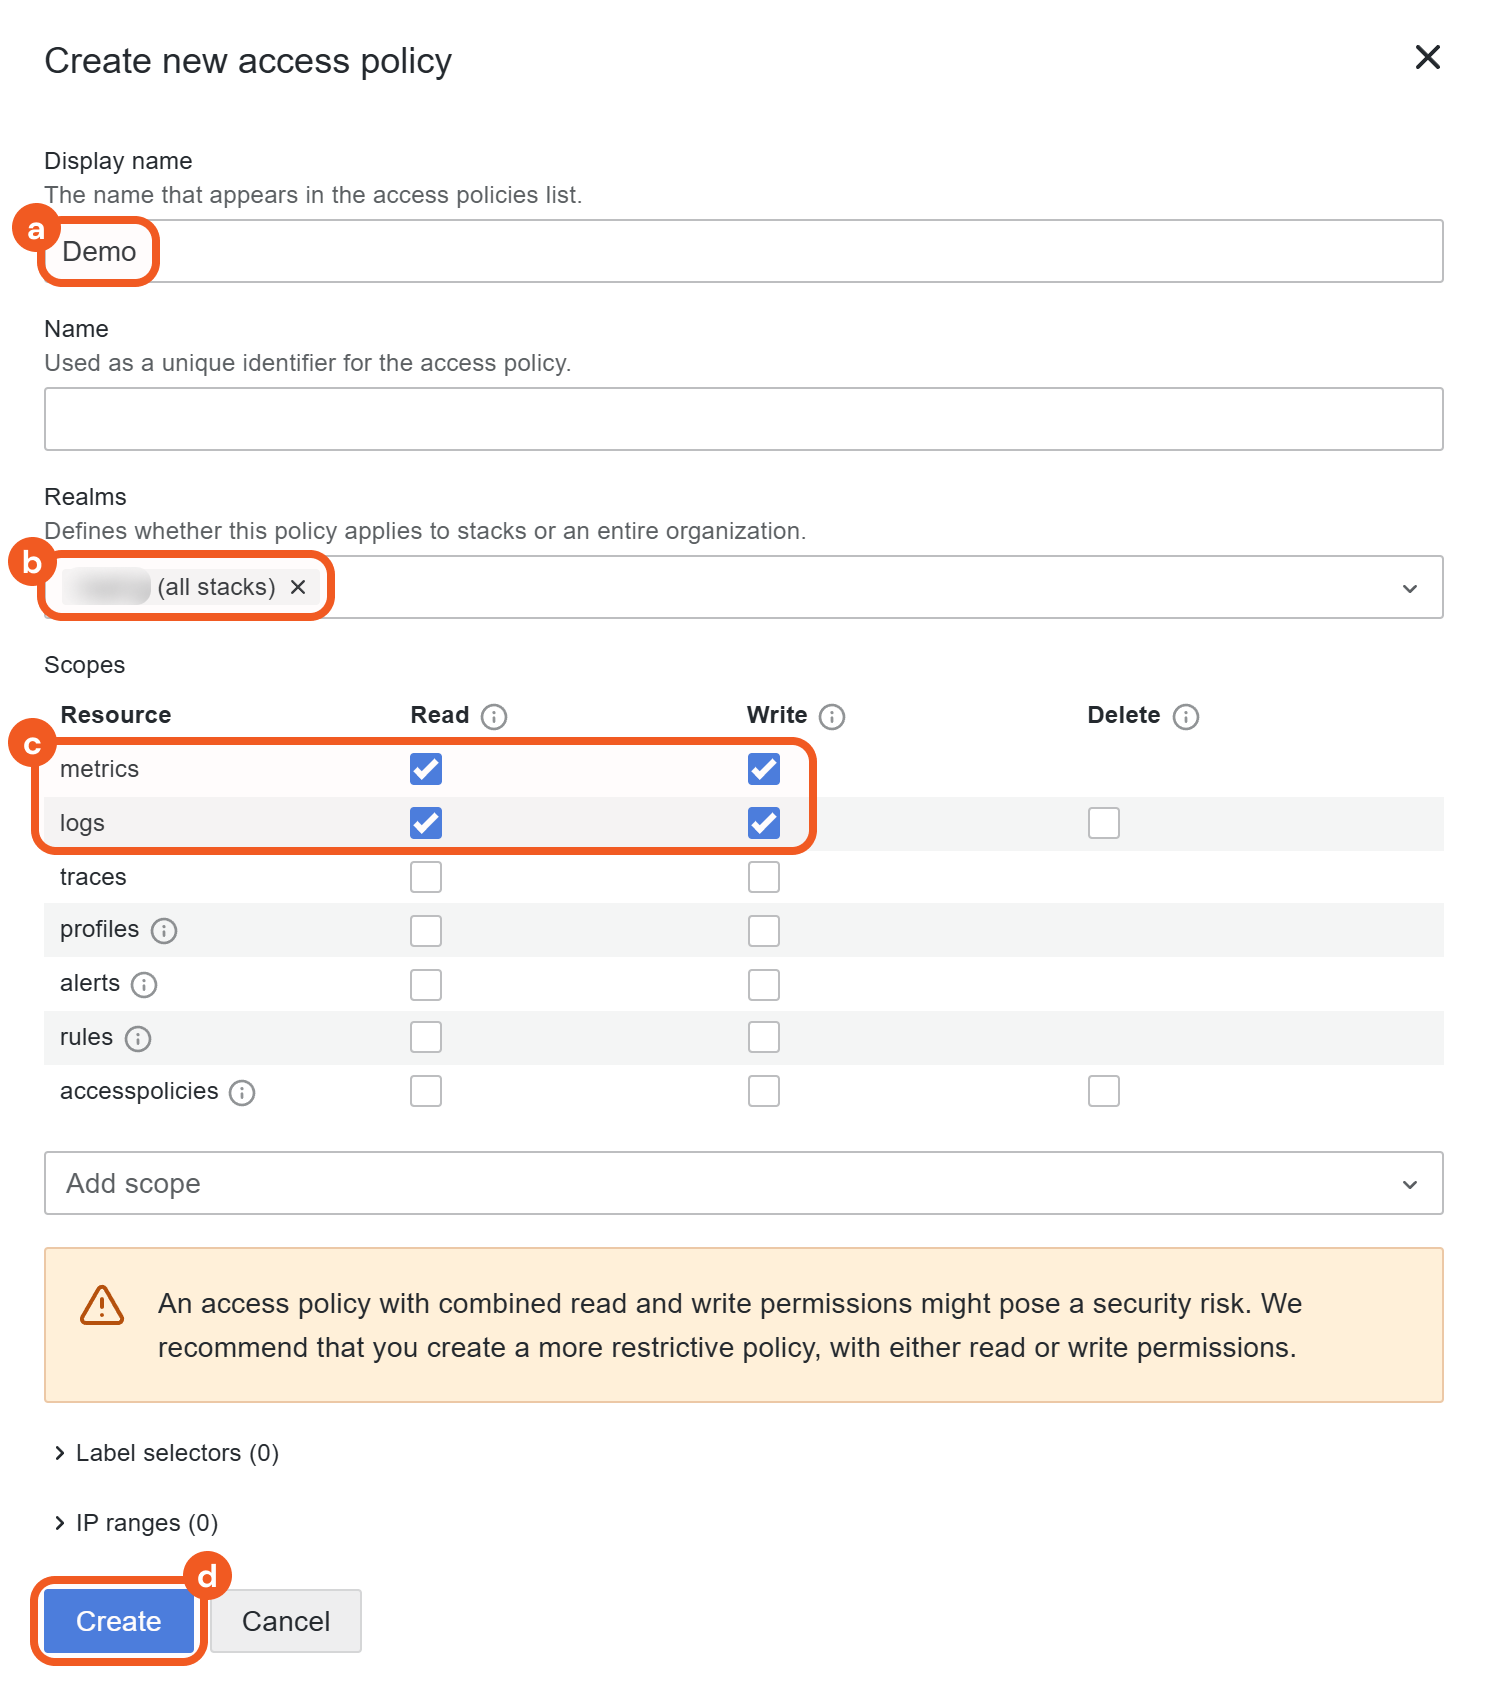
Enter the display name.
Select the realm in which this access policy will apply.
Select the Read and Write checkboxes for both the metrics and logs resources.
Click on the Create button.
Click on the Add token button.
.png?inst-v=9d16beaf-952a-4ae4-8fe8-e35f7a3745da)
Add a token to the policy.
.png?inst-v=9d16beaf-952a-4ae4-8fe8-e35f7a3745da)
Enter a name.
(Optional) Set an expiration date.
Click on the Create button.
Click on the Copy to clipboard button to copy the API token and save it in a secure place. Refer to step 3i sub-step 5 in Configuring D3 SOAR to Work with Grafana.
.png?inst-v=9d16beaf-952a-4ae4-8fe8-e35f7a3745da)
This token will no longer be visible after this step.
Retrieving the Metrics URL and Metrics Username
Click on the My Account link, then click on the Launch button under the desired Grafana Cloud stack.
Locate the InfluxDB connectivity stack, then click on the Configure button.
.png?inst-v=9d16beaf-952a-4ae4-8fe8-e35f7a3745da)
Copy the URL and username and save them in a secure place. Refer to step 3i sub-steps 3 and 4 in Configuring D3 SOAR to Work with Grafana.
.png?inst-v=9d16beaf-952a-4ae4-8fe8-e35f7a3745da)
Configuring D3 SOAR to Work with Grafana
Log in to D3 SOAR.
Find the Grafana integration.
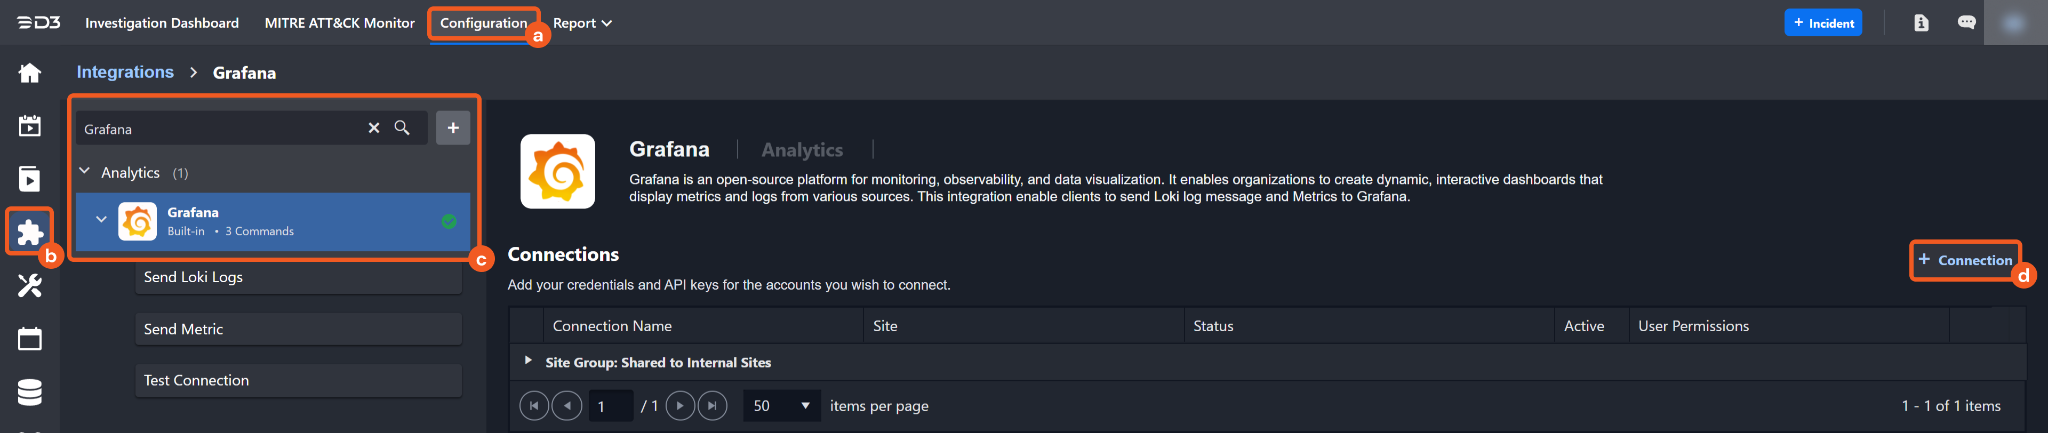
Navigate to Configuration on the top header menu.
Click on the Integration icon on the left sidebar.
Type Grafana in the search box to find the integration, then click it to select it.
Click on the + Connection button on the right side of the Connections section. A new connection window will appear.
Configure the following fields to create a connection to Grafana.
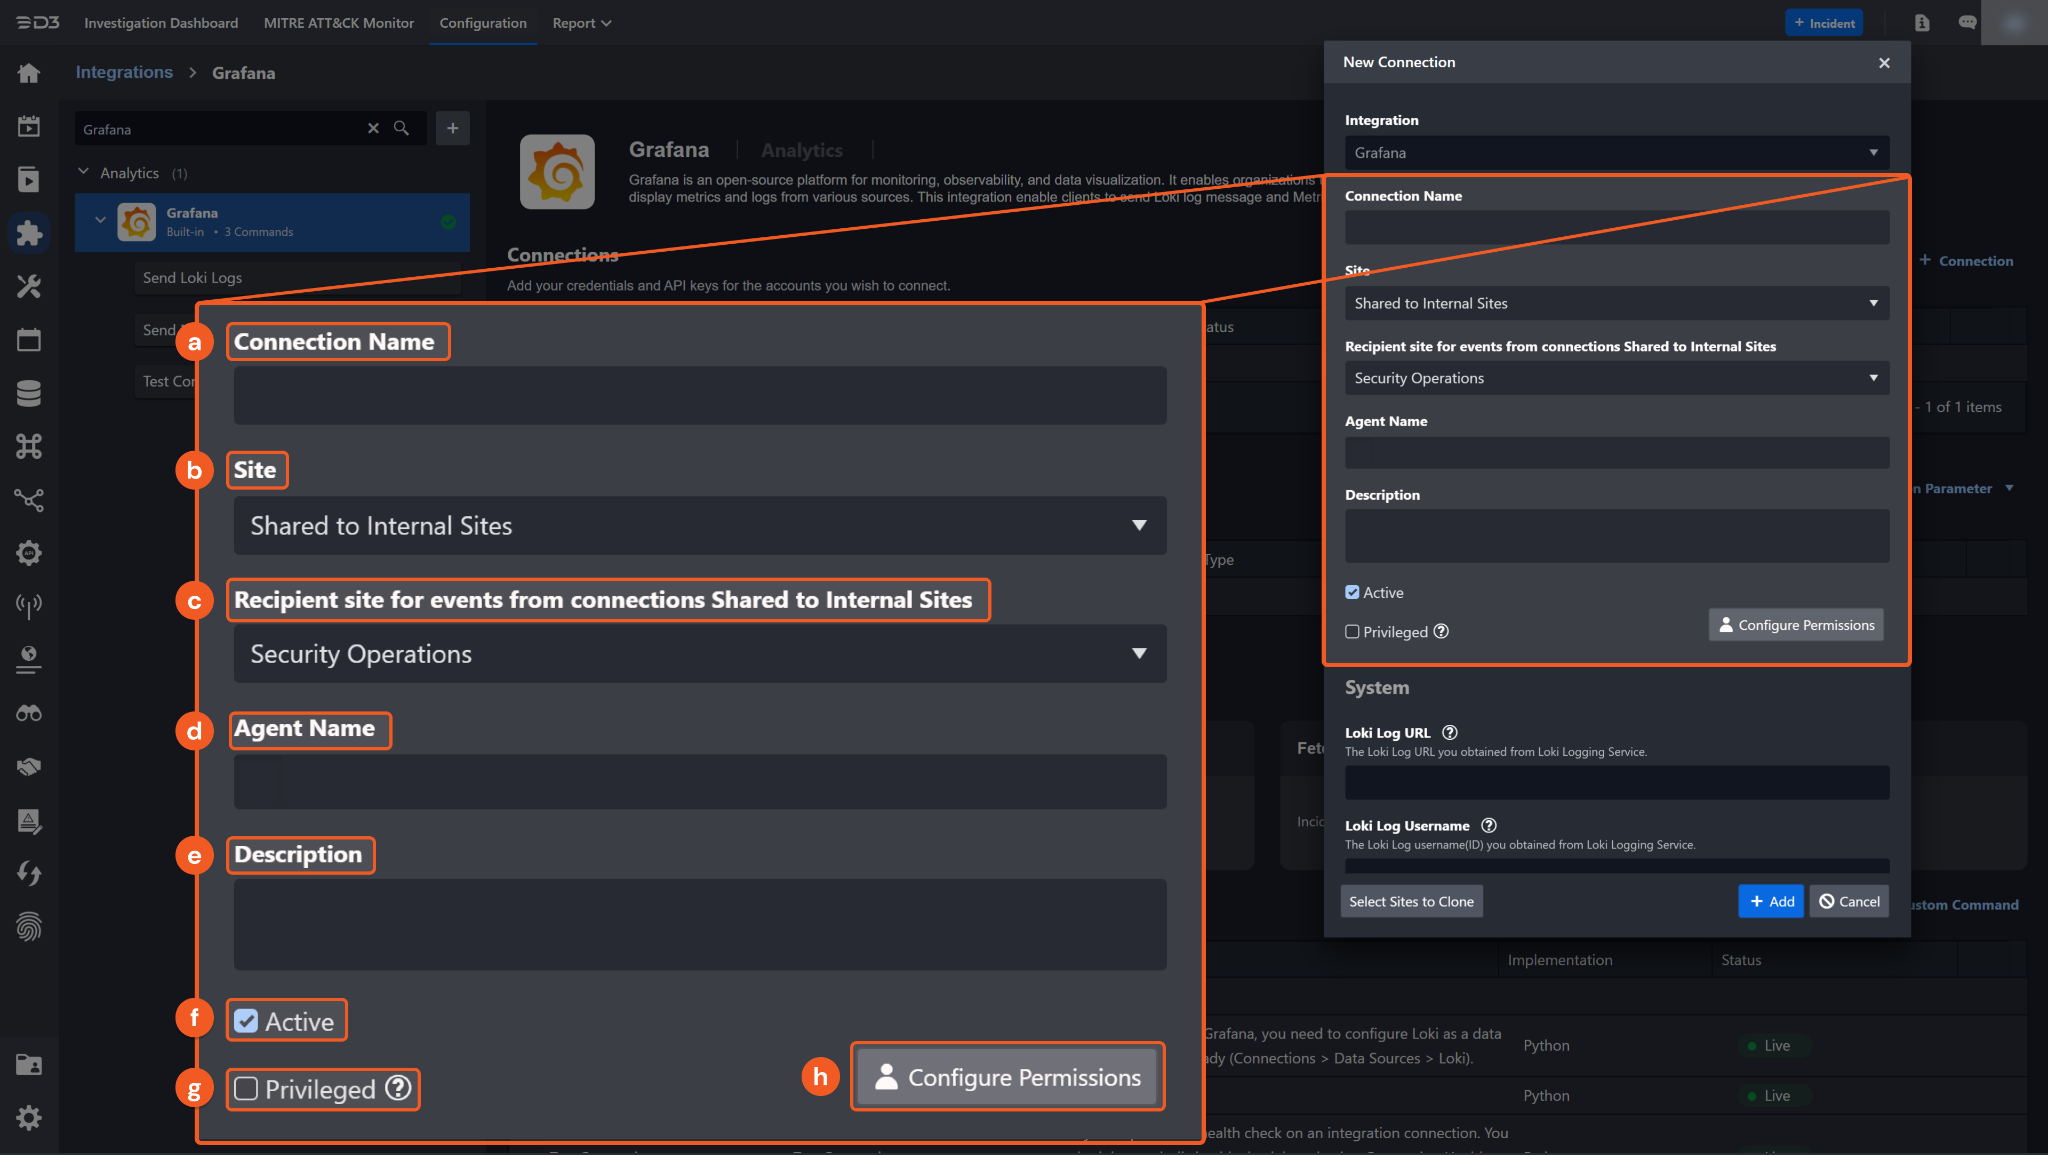
Connection Name: The desired name for the connection.
Site: Specifies the site to use the integration connection. Use the drop-down menu to select the site. The Share to Internal Sites option enables all sites defined as internal sites to use the connection. Selecting a specific site will only enable that site to use the connection.
Recipient site for events from connections Shared to Internal Sites: This field is displayed when Share to Internal Sites is selected for the Site field, allowing selection of the internal site for deploying the integration connection.
Agent Name (Optional): Specifies the proxy agent required to build the connection. Use the dropdown menu to select the proxy agent from a list of previously configured proxy agents.
Description (Optional): Add a description for the connection.
Active: Check the checkbox to ensure the connection is available for use.
Privileged: Chooses access level for the connection. Only roles with Privileged Connection settings can set and use privileged integration connections.
Configure User Permissions: Defines which users have access to the connection.
System: This section contains the parameters defined specifically for the integration. These parameters must be configured to create the integration connection.
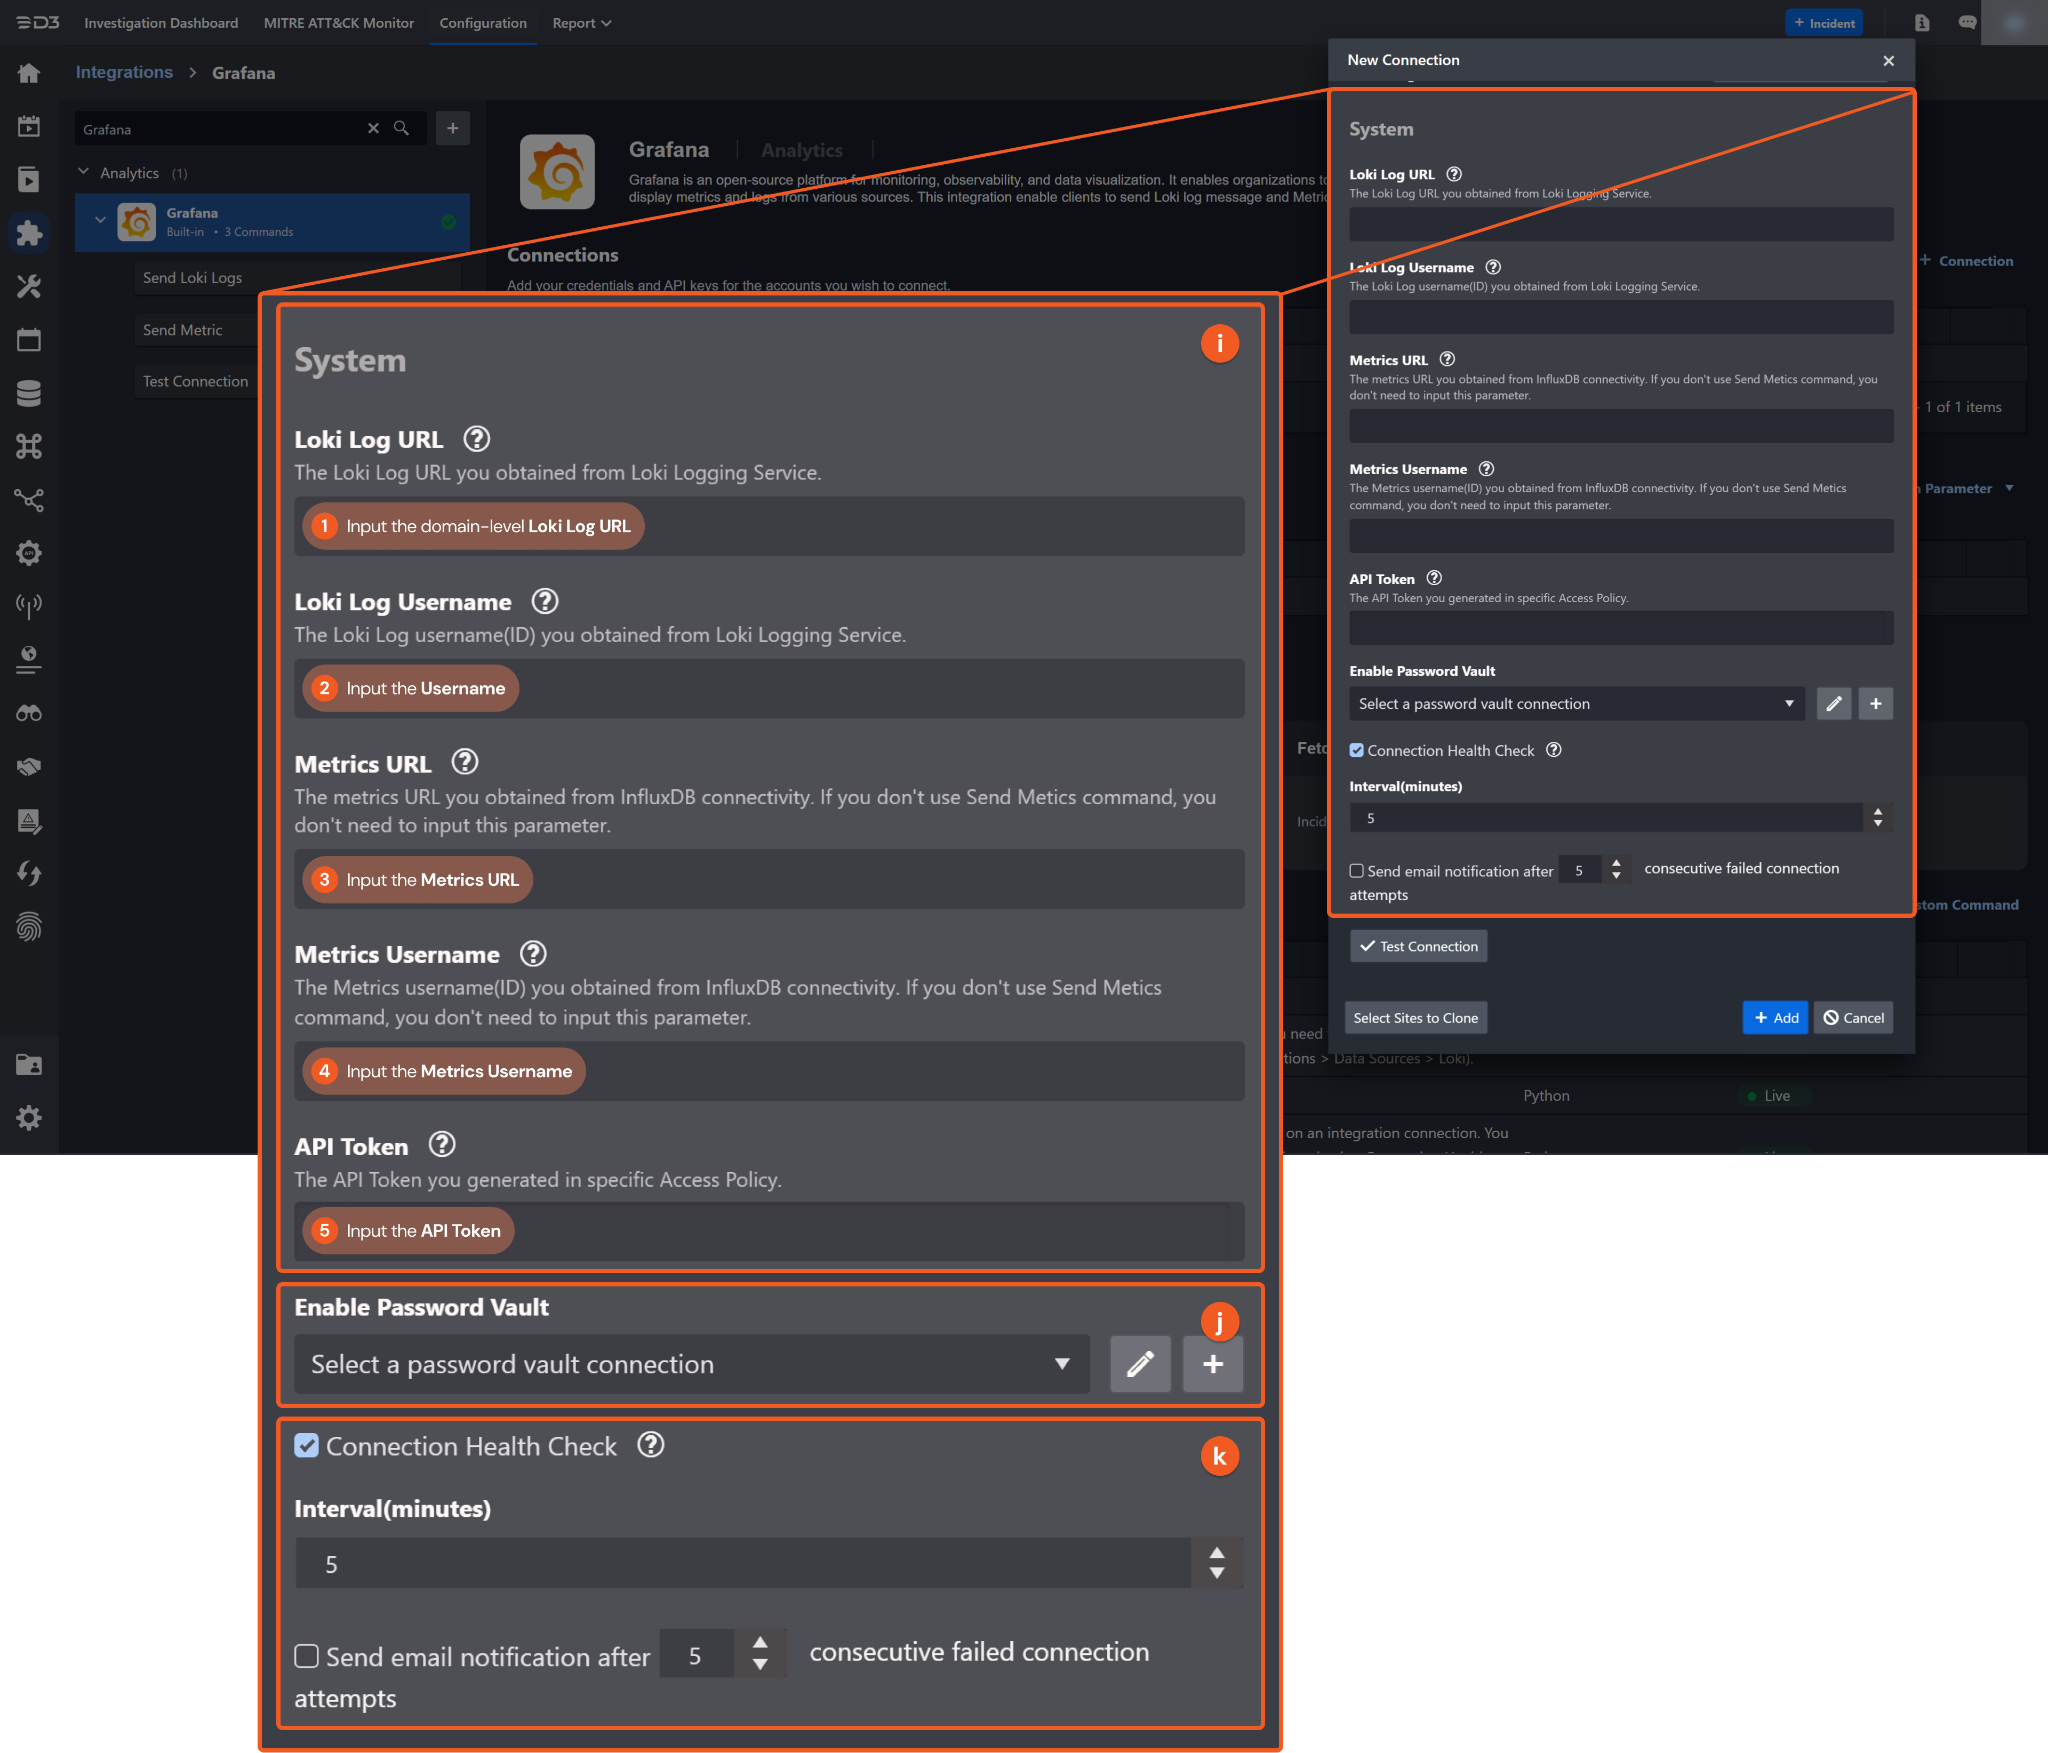
1. Input the domain-level Loki Log URL. Refer to step 5 in Retrieving the Loki Log URL and Username.
2. Input the Loki Log Username. Refer to step 5 in Retrieving the Loki Log URL and Username.3
3. Input the Metrics URL. Refer to step 3 in Retrieving the Metrics URL and Metrics Username.
4. Input the Metrics Username. Refer to step 3 in Retrieving the Metrics URL and Metrics Username.
5. Input the API Token. Refer to step 7 in Creating the API Token.
Enable Password Vault: An optional feature that allows users to take the stored credentials from their own password vault. Refer to the password vault connection guide if needed.
Connection Health Check: Updates the connection status you have created. A connection health check is done by scheduling the Test Connection command of this integration. This can only be done when the connection is active.
To set up a connection health check, check the Connection Health Check tick box. You can customize the interval (minutes) for scheduling the health check. An email notification can be set up after a specified number of failed connection attempts.
Test the connection.
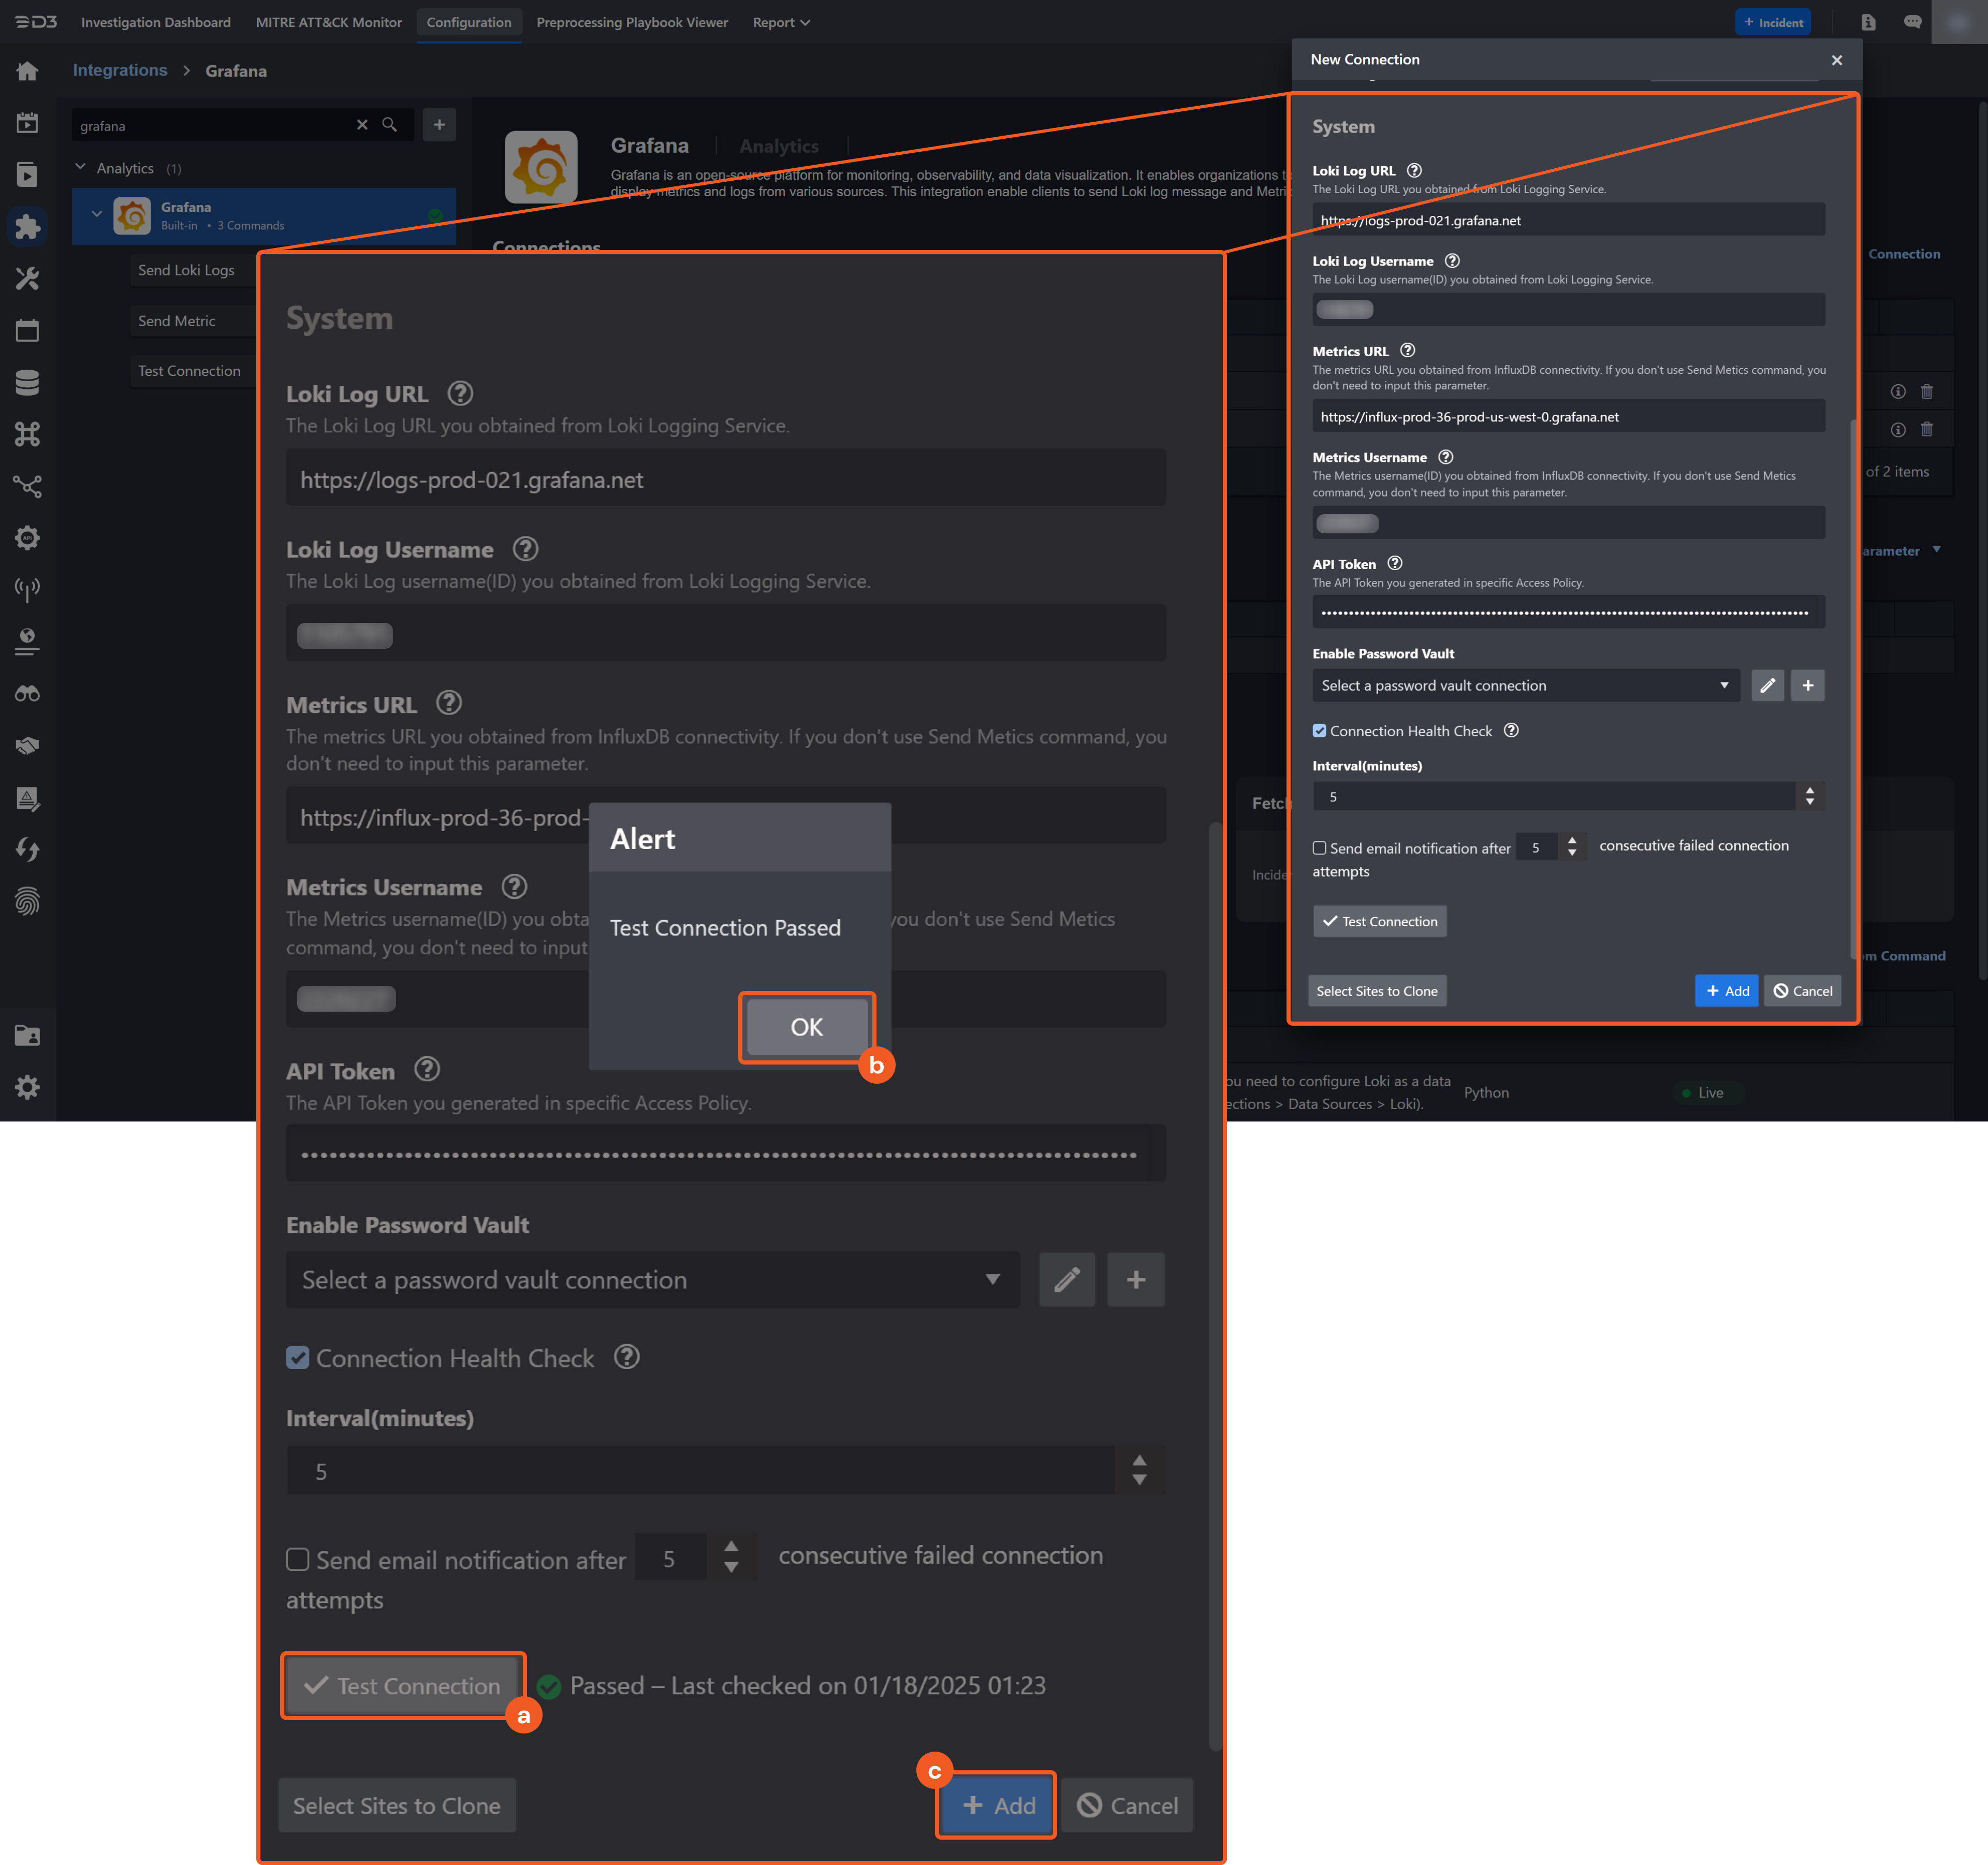
Click on the Test Connection button to verify credentials and connectivity. A success alert displays Passed with a green checkmark. If the connection fails, review the parameters and retry.
Click OK to close the alert window.
Click + Add to create and add the configured connection.
Commands
Grafana includes the following executable commands for users to set up schedules or create playbook workflows. With the Test Command function, users can execute these commands independently for playbook troubleshooting.
Integration API Note
For more information about the Grafana API, refer to the references below.
Note for Time-related parameters
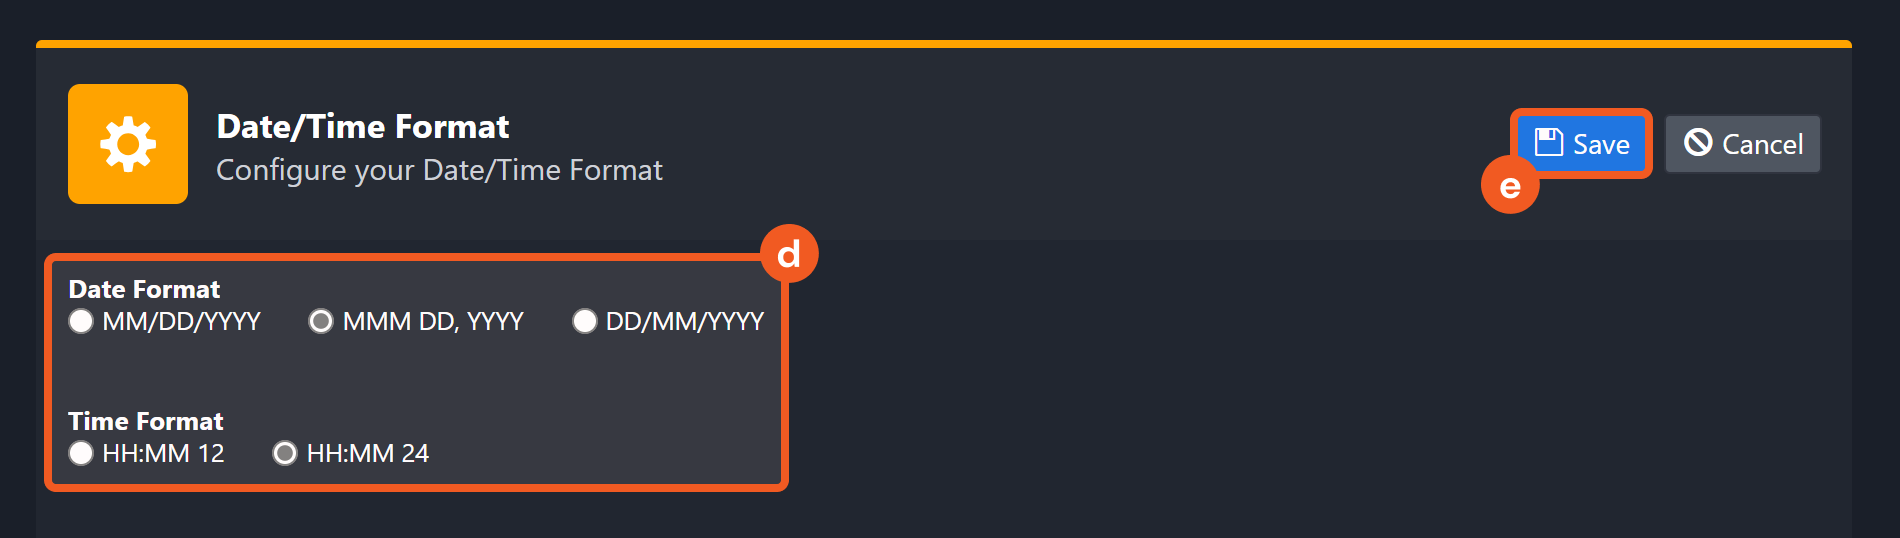
The input format of time-related parameters may vary based on user account settings, which may cause the sample data in commands to differ from what is displayed. To adjust the time format, follow these steps:
Navigate to Configuration > Application Settings. Select Date/Time Format.
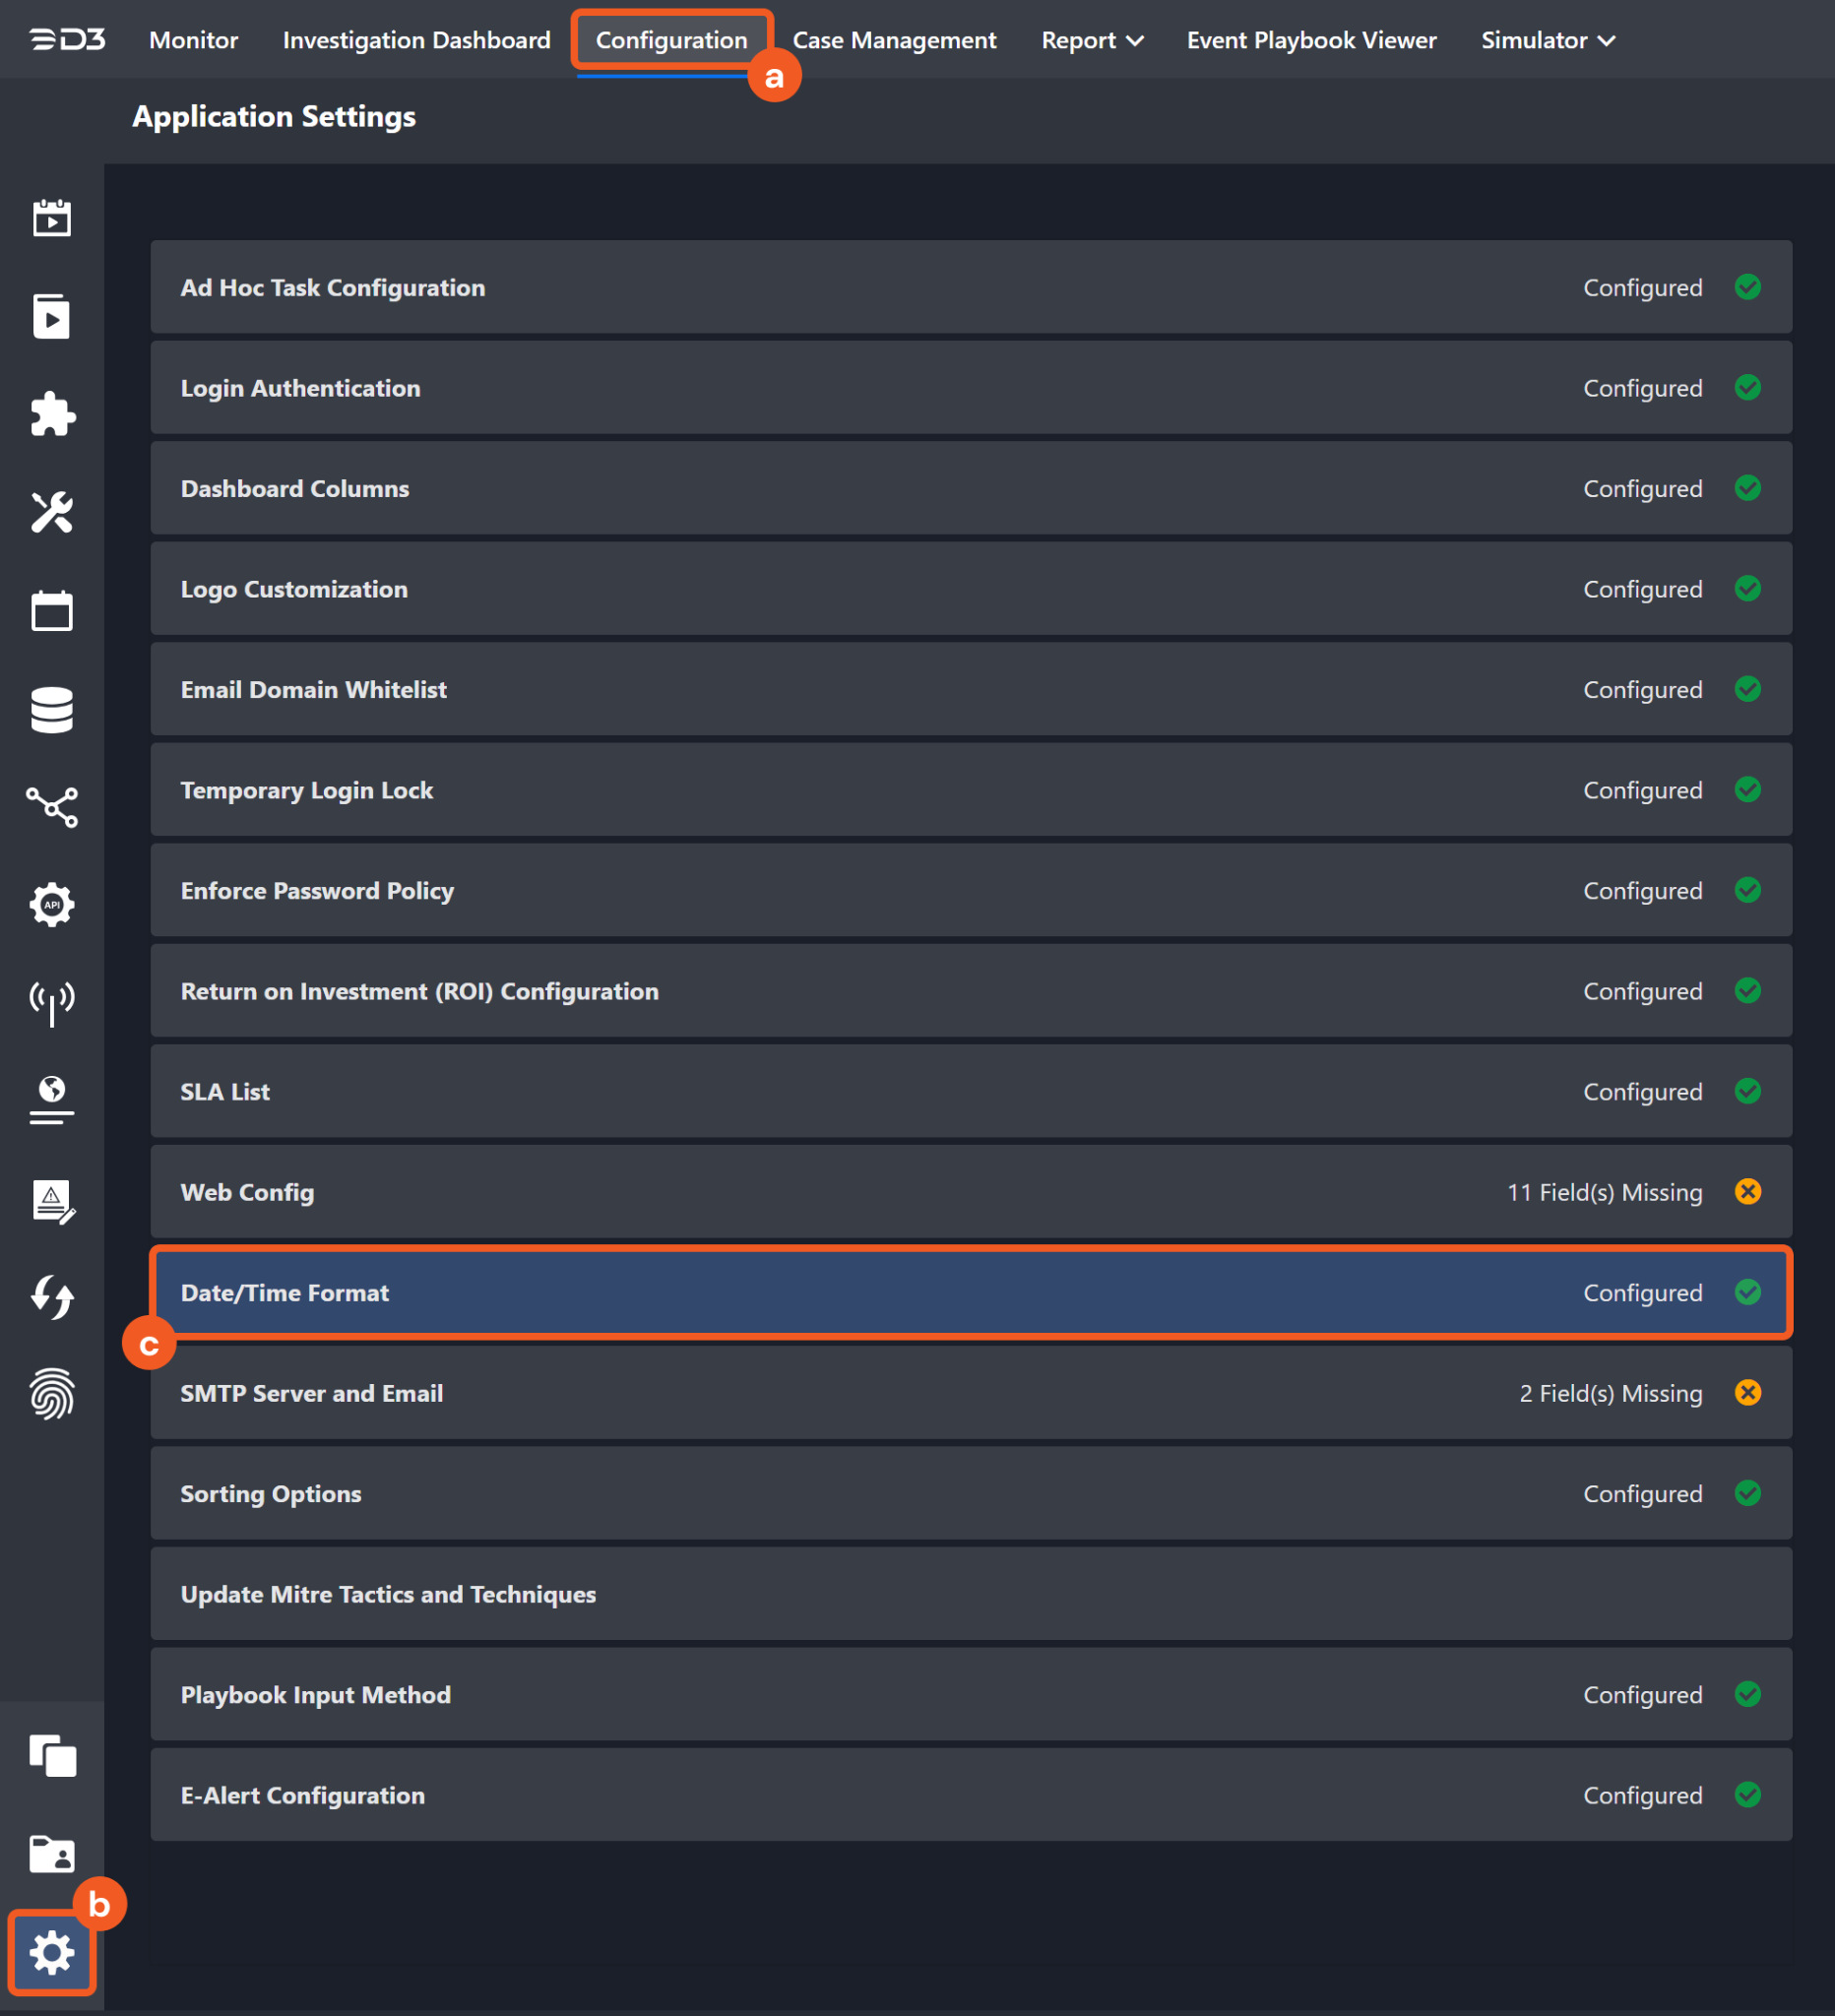
Choose the desired date and time format, then click on the Save button.
After that, users will be able to view their preferred time format when configuring the DateTime input parameters for commands.
Send Loki Logs
Sends Log entries to Loki.
Input
Input Parameter | Required/Optional | Description | Example |
Log Entries | Required | A list of timestamped log entries. Each entry is represented as [timestamp, log_message], where the timestamp is a 19-digit Unix epoch in nanoseconds, and the log_message is the corresponding log string. If any log entry is invalid, the command returns a 400 Bad Request error, but valid entries are still sent. |
JSON
|
Log Labels | Optional | Key-value pairs of log labels for categorizing logs. |
JSON
|
Output
To view the sample output data for all commands, refer to this article.
Error Handling
If the Return Data displays Failed, an Error tab will appear in the Test Result window.
The error tab contains the details responded from D3 SOAR or third-party API calls, including Failure Indicator, Status Code, and Message. This can help locate the root cause of a command failure.
Parts in Error | Description | Example |
Failure Indicator | Indicates the command failure that happened at a specific input and/or API call. | Send Loki Logs failed. |
Status Code | The response code issued by the third-party API server or the D3 SOAR system that can be used to locate the corresponding error category. For example, if the returned status code is 401, the selected connection is unauthorized to run the command. The user or system support would need to check the permission setting in the Grafana portal. Refer to the HTTP Status Code Registry for details. | Status Code: 400. |
Message | The raw data or captured key error message from the integration API server about the API request failure. | Message: Entry for stream '{app="*****", service_name="*****", source="*****"}' has timestamp too old: 2024-11-13T21:50:56Z, oldest acceptable timestamp is: 2025-01-10T19:48:57Z. |
Error Sample Data Send Loki Logs failed. Status Code: 400. Message: Entry for stream '{app="*****", service_name="*****", source="*****"}' has timestamp too old: 2024-11-13T21:50:56Z, oldest acceptable timestamp is: 2025-01-10T19:48:57Z. |
Send Metric
Sends a Metric to Grafana.
Input
Input Parameter | Required/Optional | Description | Example |
Metric Name | Required | The name of the metric to which the value is sent. Metric names are case-sensitive. | Test |
Metric Labels | Optional | Key-value pairs of metric labels for categorizing metrics. Keys and values must not contain spaces. |
JSON
|
Metric Key | Required | The key name of the metric field. | cpu_usage |
Metric Value | Required | The value of the metric to be sent. | 156 |
Time Stamp | Optional | The timestamp for the metric data. By default, the current time is used. | 2024-11-13 23:09:48 |
Output
To view the sample output data for all commands, refer to this article.
Error Handling
If the Return Data displays Failed, an Error tab will appear in the Test Result window.
The error tab contains the details responded from D3 SOAR or third-party API calls, including Failure Indicator, Status Code, and Message. This can help locate the root cause of a command failure.
Parts in Error | Description | Example |
Failure Indicator | Indicates the command failure that happened at a specific input and/or API call. | Send Metric failed. |
Status Code | The response code issued by the third-party API server or the D3 SOAR system that can be used to locate the corresponding error category. For example, if the returned status code is 401, the selected connection is unauthorized to run the command. The user or system support would need to check the permission setting in the Grafana portal. Refer to the HTTP Status Code Registry for details. | Status Code: 400. |
Message | The raw data or captured key error message from the integration API server about the API request failure. | Message: Bad metrics write request. |
Error Sample Data Send Metric failed. Status Code: 400. Message: Bad metrics write request. |
Test Connection
Allows users to perform a health check on an integration connection. Users can schedule a periodic health check by selecting Connection Health Check when editing an integration connection.
Input
N/A
Output
Output Type | Description | Return Data Type |
Return Data | Indicates one of the possible command execution states: Successful or Failed. The Failed state can be triggered by any of the following errors:
More details about an error can be viewed in the Error tab. | String |
Error Handling
If the Return Data displays Failed, an Error tab will appear in the Test Result window.
The error tab contains the details responded from D3 SOAR or third-party API calls, including Failure Indicator, Status Code, and Message. This can help locate the root cause of a command failure.
Parts in Error | Description | Example |
Failure Indicator | Indicates the command failure that happened at a specific input and/or API call. | Test Connection failed. Failed to check the connector. |
Status Code | The response code issued by the third-party API server or the D3 SOAR system that can be used to locate the corresponding error category. For example, if the returned status code is 401, the selected connection is unauthorized to run the command. The user or system support would need to check the permission setting in the Grafana portal. Refer to the HTTP Status Code Registry for details. | Status Code: 401. |
Message | The raw data or captured key error message from the integration API server about the API request failure. | Message: Authentication error: invalid token. |
Error Sample Data Test Connection failed. Failed to check the connector. Status Code: 401. Message: Authentication error: invalid token. |