
Google Chronicle
LAST UPDATED: AUG 13, 2025
Overview
The Google Chronicle integration retrieves Asset alerts and Indicator-of-Compromise (IOC) domain matches as incidents, returning a list of infected assets based on the accessed indicators. This integration also provides reputation and threat enrichment for indicators observed within the enterprise.
D3 SOAR is providing REST operations to function with Google Chronicle.
Google Chronicle is available for use in:
Known Limitations
The Search API enforces limits on the number of requests a customer can make to the Chronicle platform. When users reach or exceed this limit, the API server returns an HTTP 429 (RESOURCE_EXHAUSTED) error. Refer to Search API query limits for more information.
Connection
To connect to Google Chronicle from D3 SOAR, follow this part to collect the required information below:
Parameter | Description | Example |
Server URL | The server URL for connecting to the Google Chronicle instance. If left unspecified, the server URL defaults to https://backstory.googleapis.com. | https://europe-backstory.googleapis.com |
Service Account JSON | The service account JSON used for authentication. Refer to Creating Service Account and Obtaining the Service Account JSON or Using OAuth 2.0 for Server to Server Applications. The account must have the Chronicle API Viewer role. |
CODE
|
Chronicle API Version | The version of the Chronicle APIs to use for the connection. The default version is v1. | v1 |
Permission Requirements
Each endpoint in the Google Chronicle API requires a certain permission scope. The following are required scopes for the commands in this integration:
Grant the Chronicle API Viewer permission to the service account in use.
Under the Service Account Domain-wide Delegation section, assign the scope https://www.googleapis.com/auth/chronicle-backstory to the service account.
For detailed configuration steps, refer to Configuring Google Chronicle to Work with D3 SOAR.
Configuring Google Chronicle to Work with D3 SOAR
To proceed, contact the assigned Google Chronicle team to initiate a project. Once the project has been set up, use it to complete the remaining configurations. If necessary, switch between projects using the dropdown.
Creating Service Account and Obtaining the Service Account JSON
To connect Google Chronicle with D3 SOAR, obtain and configure the Service Account JSON file.
Log in to the Google Cloud Platform(GCP) console using administrator credentials.
Click the hamburger menu icon, then navigate to APIs and services > Credentials.
Click + CREATE CREDENTIALS, and select Service account.
Input the Service account name and description, and click CREATE AND CONTINUE.
Assign a role to the service account Chronicle API Viewer, then click CONTINUE.
Grant users access to this service account. Click DONE to confirm the configurations.
Click to open the newly created service account on the credentials page.
In the KEYS tab, click ADD KEY, then select Create new key.
Choose JSON as the key type, then click CREATE.
Wait for the Service Account JSON file (Private key) to finish downloading on the device.
Enabling the Chronicle API
This step is required for users who have not previously used the Chronicle API.
From the GCP portal Navigation menu, click API and services, then click Library.
Search for Chronicle API.
Click ENABLE.
A green check mark and notice showing "API Enabled" will appear to the right of the button upon successful enablement.
Configuring the Service Account Domain-wide Delegation
Enabling Google Workspace domain-wide delegation is also required for the created service account. Follow the steps below to complete the configuration.
Log in to the Google Workspace Admin Console with admin credentials. Click Security > Access and data control > API controls > MANAGE DOMAIN-WIDE DELEGATION.
Click Add new to add a new API client.
Find the Client ID in the newly created service account, then paste it into the Client ID field. Input the https://www.googleapis.com/auth/chronicle-backstory scope into the OAuth scopes field. Finally, click AUTHORISE.
The service account domain-wide delegation can now be found on the API controls page. The service account is now ready for use.
(Optional) Editing Service Account Permissions
To change the permissions for a service account in the Google Cloud Console, navigate to IAM and admin, then select IAM. Locate the specific service account to modify and edit its settings. For instance, to only provide read-only access to the Chronicle API, select the Chronicle API Viewer role.
READER NOTE
If no permissions were selected during service account setup, the account will not appear under IAM. As a result, its permissions cannot be updated.
Configuring D3 SOAR to Work with Google Chronicle
Log in to D3 SOAR.
Find the Google Chronicle integration.
.png?inst-v=9d16beaf-952a-4ae4-8fe8-e35f7a3745da)
Navigate to Configuration on the top header menu.
Click on the Integration icon on the left sidebar.
Type Google Chronicle in the search box to find the integration, then click it to select it.
Click + New Connection, on the right side of the Connections section. A new connection window will appear.
Configure the following fields to create a connection to Google Chronicle.
.png?inst-v=9d16beaf-952a-4ae4-8fe8-e35f7a3745da)
Connection Name: The desired name for the connection.
Site: The site on which to use the integration connection. Use the drop-down menu to select the site. The Share to Internal Sites option enables all internal sites to use the connection. Selecting a specific site will only enable that site to use the connection.
Recipient site for events from connections Shared to Internal Sites: This field is displayed when Share to Internal Sites is selected for the Site field, allowing selection of the internal site for deploying the integration connection.
Agent Name (Optional): The proxy agent required to build the connection. Use the dropdown menu to select the proxy agent from a list of previously configured proxy agents.
Description (Optional): The description for the connection.
Tenant (Optional): When configuring the connection from a master tenant site, users can choose the specific tenant sites with which to share the connection. Once this setting is enabled, users can filter and select the desired tenant sites from the dropdowns to share the connection.
Configure User Permissions: Defines which users have access to the connection.
Active: The checkbox that enables the connection to be used when selected.
System Reputation Check: Selecting one or more reputation checkboxes will run the corresponding check reputation commands under this integration connection to enrich the corresponding artifacts with reputation details.
For example, an integration connection named "ConnectionA" is configured with the "Sandbox" site. All URL artifacts from the "Sandbox" site will undergo a reputation check using the Check URL Reputation command from that integration. The return data output from this command will then be used to update the risk level of artifacts, which may affect the risk level of incoming events.
.png?inst-v=9d16beaf-952a-4ae4-8fe8-e35f7a3745da)
System: This section contains the parameters defined specifically for the integration. These parameters must be configured to create the integration connection.
.png?inst-v=9d16beaf-952a-4ae4-8fe8-e35f7a3745da)
1. Input the Server URL of the Google Chronicle instance.
2. Input the Service Account JSON. Refer to Creating Service Account and Obtaining the Service Account JSON for obtaining the JSON file.
3. Input the API Version. The default value is v1.Connection Health Check: Periodically checks the connection status by scheduling the Test Connection command at the specified interval (in minutes). Available only for active connections, this feature also allows configuring email notifications for failed attempts.
Enable Password Vault: An optional feature that allows users to take the stored credentials from their own password vault. Refer to the password vault connection guide if needed.
Test the connection.
Click on the Test Connection button to verify credentials and connectivity. A success alert displays Passed with a green checkmark. If the connection fails, review the parameters and retry.
Click OK to close the alert window.
Click + Add to create and add the configured connection.
Commands
Google Chronicle includes the following executable commands for users to set up schedules or create playbook workflows. With the Test Command, users can execute these commands independently for playbook troubleshooting.
Integration API Note
For more information about the Google Chronicle APIs, refer to the following API references:
READER NOTE
Certain permissions are required for each command. Refer to the Permission Requirements and Configuring Google Chronicle to Work with D3 SOAR for details.
Note for Time-related parameters
The input format of time-related parameters may vary based on user account settings, which may cause the sample data in commands to differ from what is displayed. To adjust the time format, follow these steps:
Navigate to Configuration > Application Settings. Select Date/Time Format.
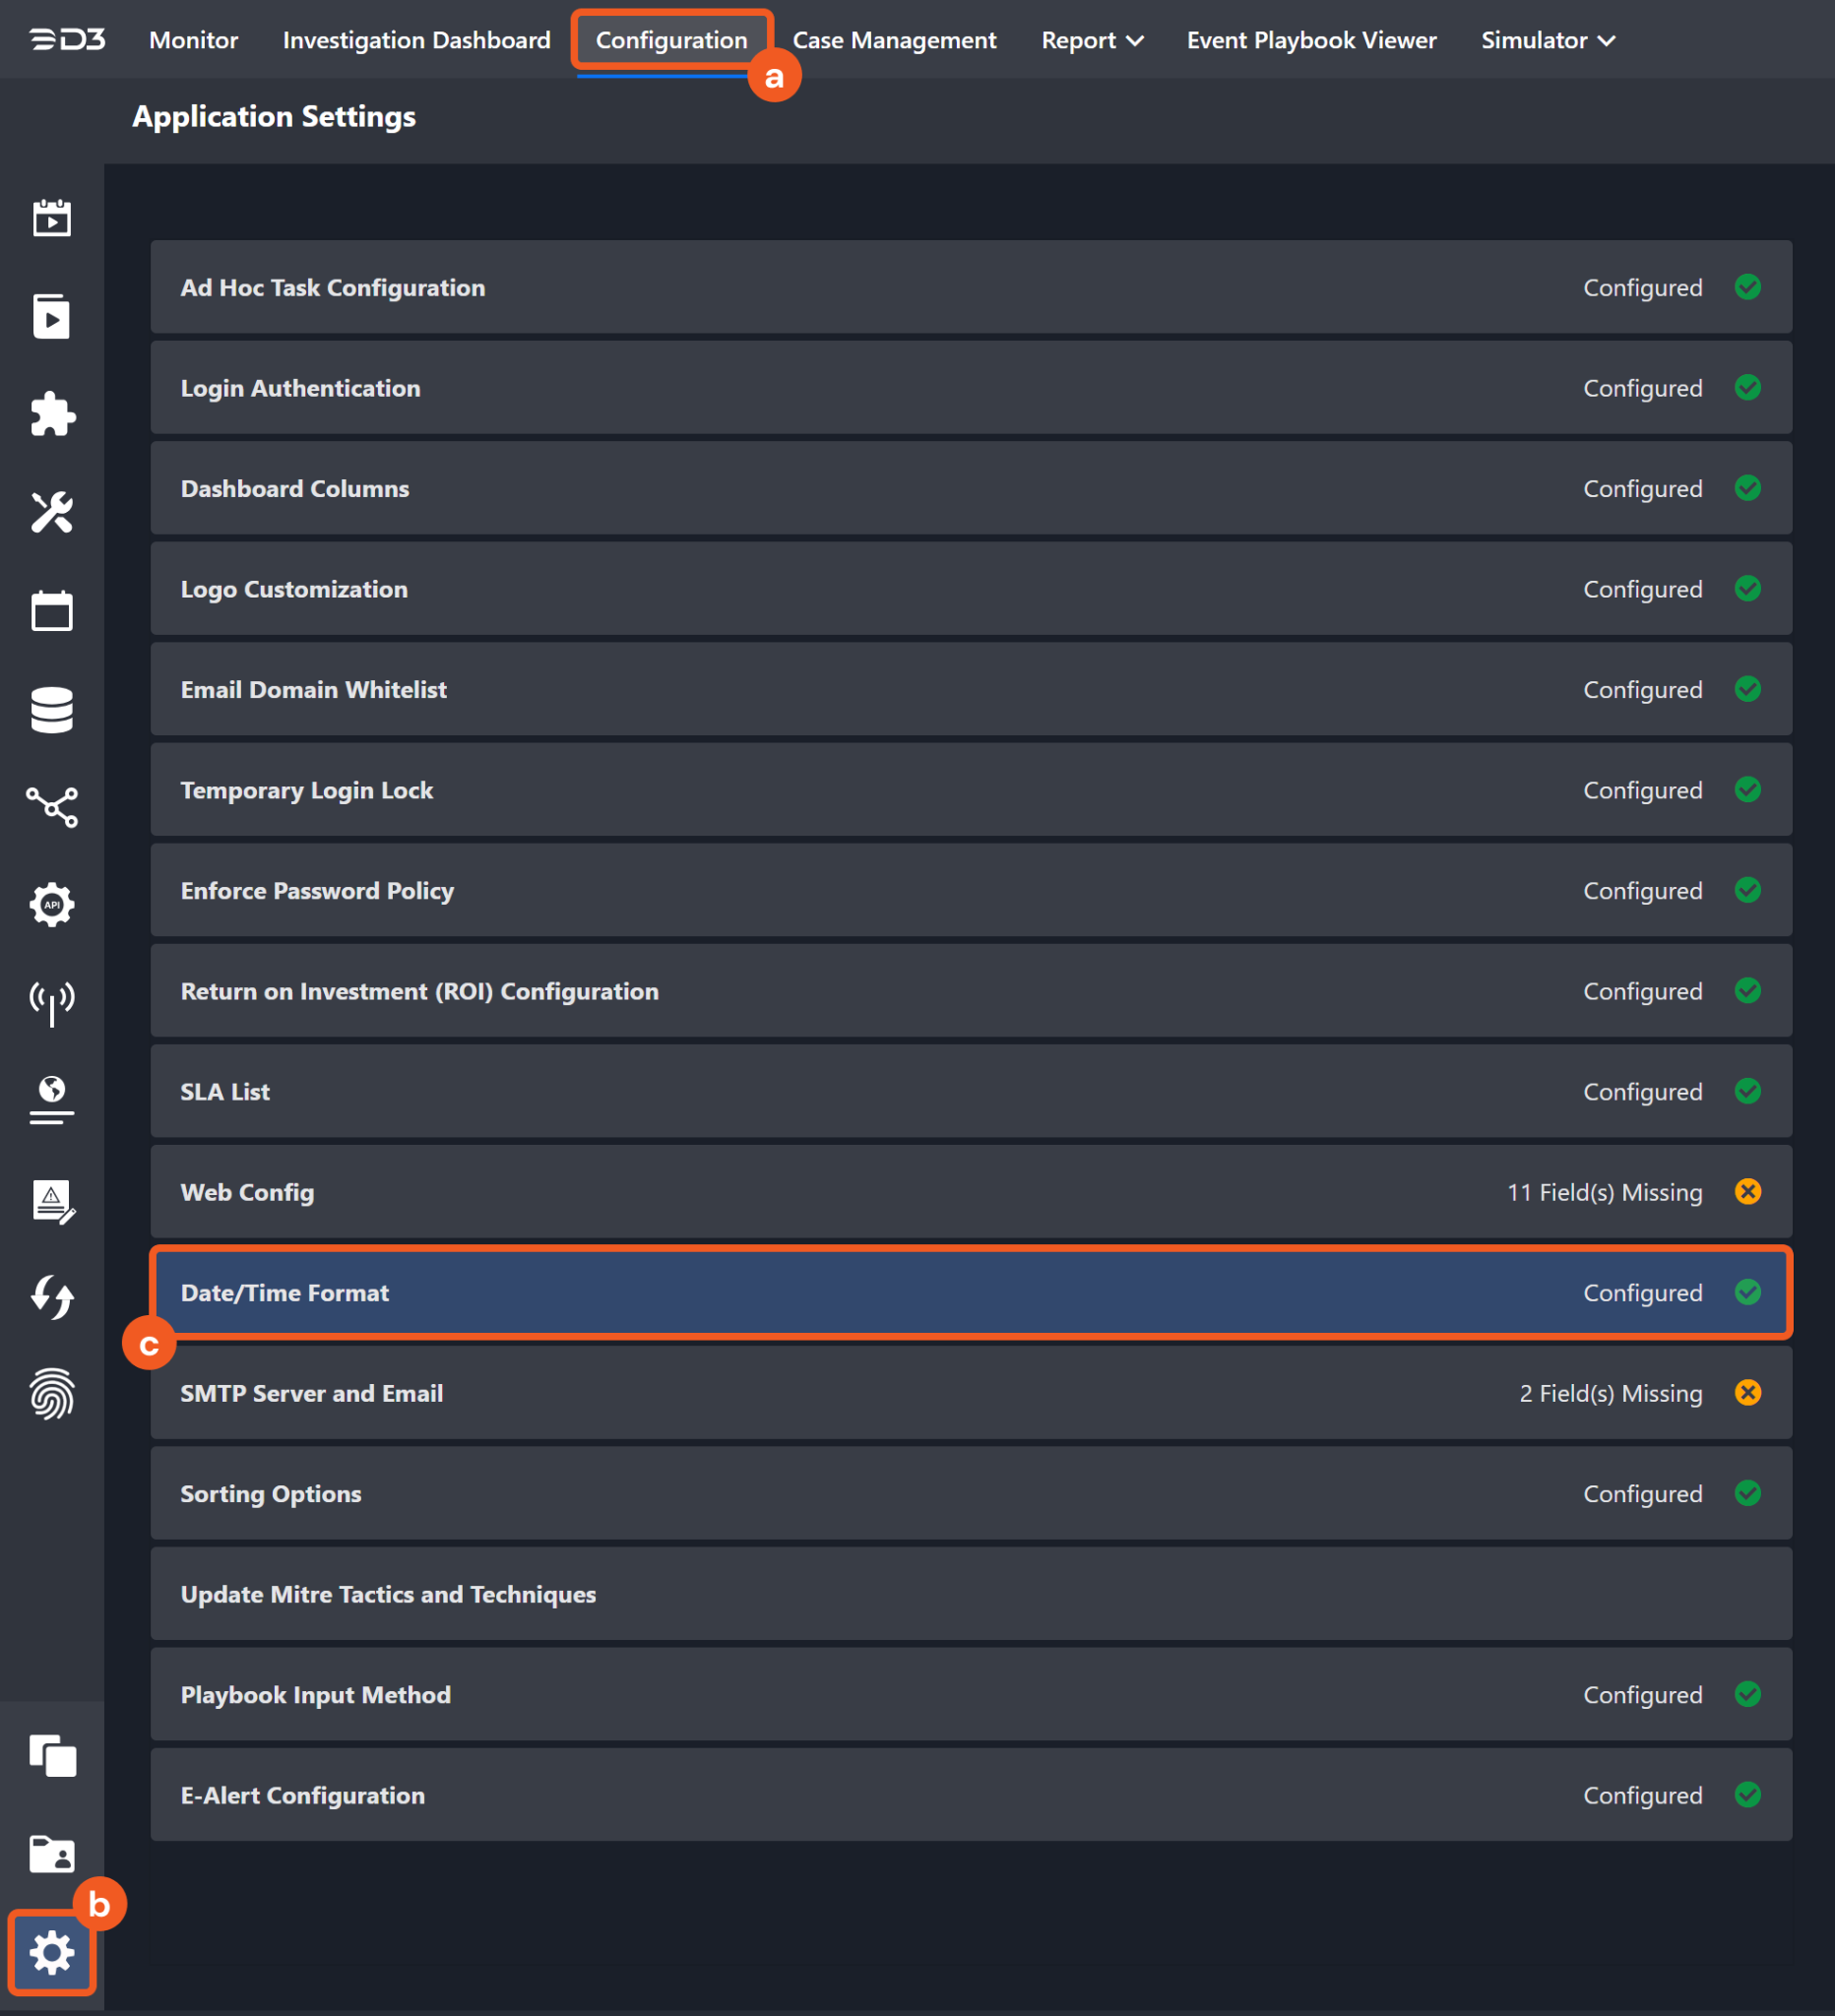
Choose the desired date and time format, then click on the Save button.
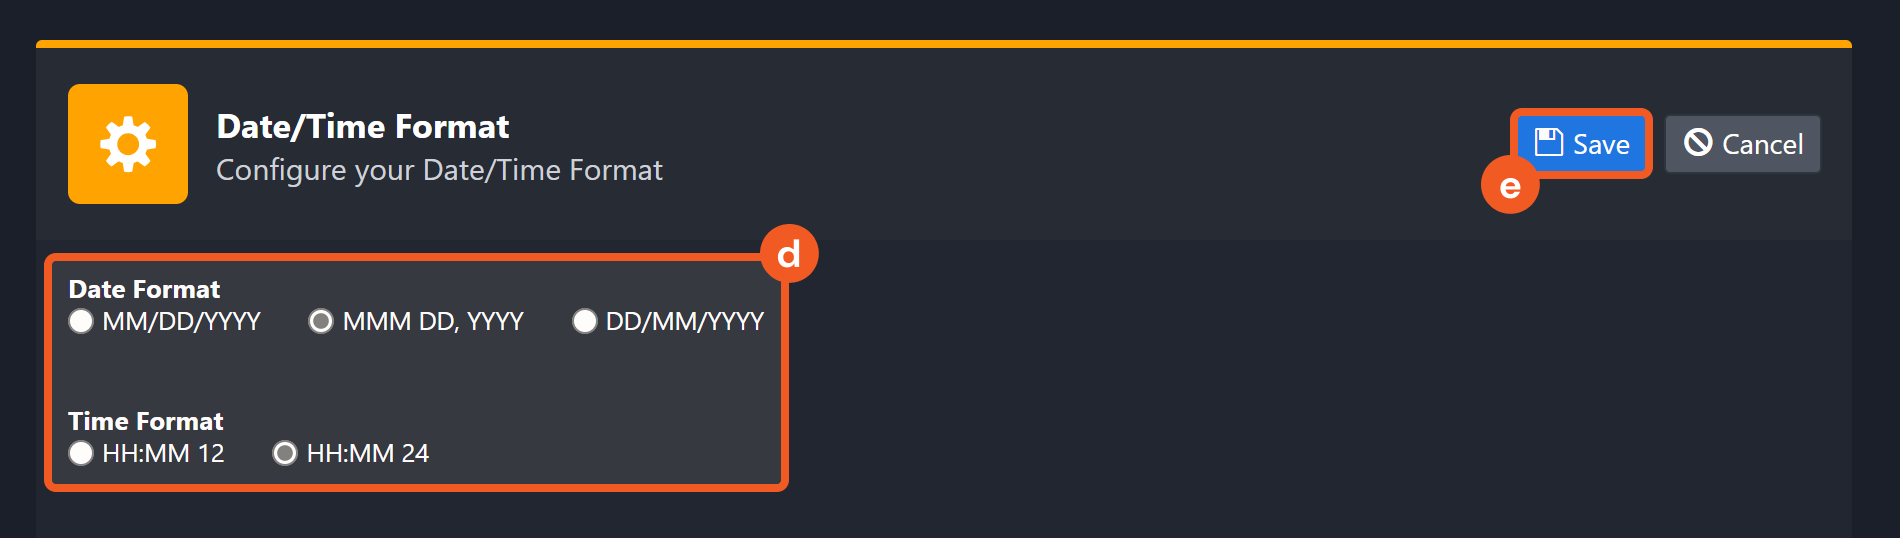
The selected time format will now be visible when configuring Date/Time command input parameters.
Check Domain Reputation
Retrieves reputation information on the given domains.
Input
Input Parameter | Required/Optional | Description | Example |
Domains | Required | The list of domains to retrieve reputation information. |
JSON
|
Output
To view the sample output data for all commands, refer to this article.
D3-defined Risk Levels and Risk Level Names
The table below lists the possible output risk levels and their corresponding risk level names:
Risk Levels | Risk Level Names |
1 | High |
2 | Medium |
3 | Low |
4 | Default |
5 | ZeroRisk |
Error Handling
The Error tab will appear in the Test Result window if the command failed to run.
The error tab contains the details responded from D3 SOAR or third-party API calls, including Failure Indicator, Status Code, and Message. This can help locate the root cause of a command failure.
Parts in Error | Description | Example |
Failure Indicator | Indicates the command failure that happened at a specific input and/or API call. | Check Domain Reputation failed. |
Status Code | The response code issued by the third-party API server or the D3 SOAR system that can be used to locate the corresponding error category. For example, if the returned status code is 401, the selected connection is unauthorized to run the command. The user or system support would need to check the permission setting in the Google Chronicle portal. Refer to the HTTP Status Code Registry for details. | Status Code: 400. |
Message | The raw data or captured key error message from the integration API server about the API request failure. | Message: Some domains are not valid domains: [xxx]. Please check D3Error object in RawData for more details. |
Error Sample Data Check Domain Reputation failed. Status Code: 400. Message: Some domains are not valid domains: [xxx]. Please check D3Error object in RawData for more details. |
Check IP Reputation
Retrieves reputation information on the given IP addresses.
Input
Input Parameter | Required/Optional | Description | Example |
IPs | Required | The list of IP addresses to retrieve reputation information. |
JSON
|
Output
To view the sample output data for all commands, refer to this article.
D3-defined Risk Levels and Risk Level Names
The table below lists the possible output risk levels and their corresponding risk level names:
Risk Levels | Risk Level Names |
1 | High |
2 | Medium |
3 | Low |
4 | Default |
5 | ZeroRisk |
Error Handling
The Error tab will appear in the Test Result window if the command failed to run.
The error tab contains the details responded from D3 SOAR or third-party API calls, including Failure Indicator, Status Code, and Message. This can help locate the root cause of a command failure.
Parts in Error | Description | Example |
Failure Indicator | Indicates the command failure that happened at a specific input and/or API call. | Check IP Reputation failed. |
Status Code | The response code issued by the third-party API server or the D3 SOAR system that can be used to locate the corresponding error category. For example, if the returned status code is 401, the selected connection is unauthorized to run the command. The user or system support would need to check the permission setting in the Google Chronicle portal. Refer to the HTTP Status Code Registry for details. | Status Code: 400. |
Message | The raw data or captured key error message from the integration API server about the API request failure. | Message: Some IPs are not valid IPs: [xxx]. Please check D3Error object in RawData for more details. |
Error Sample Data Check IP Reputation failed. Status Code: 400. Message: Some IPs are not valid IPs: [xxx]. Please check D3Error object in RawData for more details. |
Create Rule
Creates a new rule without setting the rule to live. You can enable the rule with the Update Live Rule Status command.
Input
Input Parameter | Required/Optional | Description | Example |
Rule Text | Required | The text of the new rule in YARA-L 2.0 format. Please refer to YARA-L 2.0 language syntax | Chronicle | Google Cloud for more information about YARA-L 2.0's syntax. | rule singleEventRule_test2023*** { meta: author = "***-***" description = "single event rule that should generate detections" events: $e.metadata.event_type = "NETWORK_DNS" condition: $e } |
Output
To view the sample output data for all commands, refer to this article.
Error Handling
If the Return Data is Failed, an Error tab will appear in the Test Result window.
The error tab contains the details responded from D3 SOAR or third-party API calls, including Failure Indicator, Status Code, and Message. This can help locate the root cause of a command failure.
Parts in Error | Description | Example |
Failure Indicator | Indicates the command failure that happened at a specific input and/or API call. | Create Rule failed. |
Status Code | The response code issued by the third-party API server or the D3 SOAR system that can be used to locate the corresponding error category. For example, if the returned status code is 401, the selected connection is unauthorized to run the command. The user or system support would need to check the permission setting in the Google Chronicle portal. Refer to the HTTP Status Code Registry for details. | Status Code: 400. |
Message | The raw data or captured key error message from the integration API server about the API request failure. | Message: generic::invalid_argument: compiling rule: parsing: did not reach end of tokens. |
Error Sample Data Create Rule failed. Status Code: 400. Message: generic::invalid_argument: compiling rule: parsing: did not reach end of tokens. |
Create Rule Version
Creates a new version of an existing rule. The new version of the rule does not have to be based on the latest version.
READER NOTE
Rule ID is a required parameter to run this command.
Run the List Rules command to obtain the Rule ID. Rule IDs can be find in the returned raw data at the path $.rules[*].ruleId.
Input
Input Parameter | Required/Optional | Description | Example |
Rule ID | Required | The ID of the rule to create a new version. Rule IDs can be obtained using the List Rules command. | ru_***-***-***-***-** |
Rule Text | Required | Text of the new rule in YARA-L 2.0 format. Please refer to YARA-L 2.0 language syntax | Chronicle | Google Cloud for more information about YARA-L 2.0's syntax. | rule singleEventRule_test2023*** { meta: author = "vsoc-admin" description = "single event rule that should generate detections" events: $e.metadata.event_type = "NETWORK_DNS" condition: $e } |
Output
To view the sample output data for all commands, refer to this article.
Error Handling
If the Return Data is Failed, an Error tab will appear in the Test Result window.
The error tab contains the details responded from D3 SOAR or third-party API calls, including Failure Indicator, Status Code, and Message. This can help locate the root cause of a command failure.
Parts in Error | Description | Example |
Failure Indicator | Indicates the command failure that happened at a specific input and/or API call. | Create Rule Version failed. |
Status Code | The response code issued by the third-party API server or the D3 SOAR system that can be used to locate the corresponding error category. For example, if the returned status code is 401, the selected connection is unauthorized to run the command. The user or system support would need to check the permission setting in the Google Chronicle portal. Refer to the HTTP Status Code Registry for details. | Status Code: 400. |
Message | The raw data or captured key error message from the integration API server about the API request failure. | Message: generic::invalid_argument: compiling rule: parsing: did not reach end of tokens. |
Error Sample Data Create Rule Version failed. Status Code: 400. Message: generic::invalid_argument: compiling rule: parsing: did not reach end of tokens. |
Delete Rules
Deletes the specified rule(s). This method is not automatically available to all customers. Please contact your Chronicle representative for more information.
READER NOTE
Rule IDs is a required parameter to run this command.
Run the List Rules command to obtain the Rule IDs. Rule IDs can be find in the returned raw data at the path $.rules[*].ruleId.
If users encounter the error message "'status code 403, Forbidden. generic::permission_denied: customer not allowed access to method'/RulesEngineServiceV2.DeleteRule," reach out to the assigned Chronicle representative for further details and assistance. Visit Chronicle Detection Engine API | Google Cloud for more information.
Input
Input Parameter | Required/Optional | Description | Example |
Rule IDs | Required | The IDs of the rules to delete. Rule IDs can be obtained using the List Rules command. |
JSON
|
Output
To view the sample output data for all commands, refer to this article.
Error Handling
If the Return Data is Partially Successful or Failed, an Error tab will appear in the Test Result window.
The error tab contains the details responded from D3 SOAR or third-party API calls, including Failure Indicator, Status Code, and Message. This can help locate the root cause of a command failure.
Parts in Error | Description | Example |
Failure Indicator | Indicates the command failure that happened at a specific input and/or API call. | Delete Rules failed. |
Status Code | The response code issued by the third-party API server or the D3 SOAR system that can be used to locate the corresponding error category. For example, if the returned status code is 401, the selected connection is unauthorized to run the command. The user or system support would need to check the permission setting in the Google Chronicle portal. Refer to the HTTP Status Code Registry for details. | Status Code: 403. |
Message | The raw data or captured key error message from the integration API server about the API request failure. | Message: generic::permission_denied: customer not allowed access to method\"/RulesEngineServiceV2.DeleteRule\". please contact support for access. |
Error Sample Data Delete Rules failed. Status Code: 403. Message: generic::permission_denied: customer not allowed access to method\"/RulesEngineServiceV2.DeleteRule\". please contact support for access. |
Fetch Event
Retrieves Google Chronicle alerts based on the specified criteria.
Input
Input Parameter | Required/Optional | Description | Example |
Start Time | Required | The start of the time range (in UTC) for retrieving Enterprise Insights alerts or alert detections.
| 2023-01-01 00:00 |
End Time | Required | The end of the time range (in UTC) for retrieving Enterprise Insights alerts or alert detections.
| 2023-03-01 00:00 |
Number of Event(s) Fetched | Optional | The maximum number of events to return. For Enterprise Insights Alerts, valid values range from 1 to 100,000, with a default of 10,000. For Alert Detections, valid values range from 1 to 1,000, with a default of 100. To return all matching Alert Detections, enter -1. | 100 |
Alert Type | Optional | The type of alerts to return. This parameter only applies to the Enterprise Insights event source. Available options are:
By default, all alerts regardless of their type are returned. | Asset Alerts |
Event Key Paths | Optional | The key paths for events to display as columns in the command results. If no paths are specified, default D3 columns are displayed. |
JSON
|
Tolerance Scope | Optional | The tolerance range in minutes between the start and end time (in UTC) to avoid missing events. The default is 0. Events are fetched between {Start Time - Tolerance Scope, End Time}. | 0 |
Event Source | Optional | The event source from which to ingest events. Available options are:
By default, the value is set to Enterprise Insights Alerts. | Alert Detections |
Rule IDs | Optional | The IDs of the rules for filtering returned Alert Detections. This parameter only applies to the Alert Detections event source. Rule IDs can be obtained using the List Rules command.
|
JSON
|
Version IDs | Optional | The IDs of the rule versions for filtering returned Alert Detections. This parameter only applies to the Alert Detections event source. Version IDs can be obtained using the List Rules command.
|
JSON
|
Version | Optional | The rule version to use for filtering Alert Detections. This parameter only applies to the Alert Detections event source. Available options are:
By default, only detections from the latest version are returned. | All Versions |
Alert State | Optional | Filters detections based on their state.This parameter only applies to the Alert Detections event source. By default, all detections regardless of their state are returned. | ALERTING |
Output
To view the sample output data for all commands, refer to this article.
Fetch Event Field Mapping
Fetch Event commands require event field mapping. Field mapping plays a key role for data normalization within the event pipeline. Field mapping converts the original data fields from the different providers to standardized D3 fields as defined by the D3 Model. Refer to Event and Incident Intake Field Mapping for details.
To add a custom field, click on the + Add Field button. Users can also remove built-in field mappings by clicking x. Note that two underscore characters will automatically prefix the defined Field Name as the System Name for a custom field mapping. Additionally, if an input Field Name contains any spaces, they will automatically be replaced with underscores for the corresponding System Name.
As a system integration, the Google Chronicle integration has some pre-configured field mappings for default field mapping.
Default Event Source
The Default Event Source is the default set of field mappings that are applied when this fetch event command is executed. For out-of-the-box integrations, users will find a set of field mappings provided by the system. Default event source provides field mappings for common fields from the fetched data. The default event source has a "Main Event JSON Path" (i.e., $) that is used to extract a batch of alerts from the response raw data. Click Edit Main JSON Path to view the “Main Event JSON Path”.
.png?inst-v=9d16beaf-952a-4ae4-8fe8-e35f7a3745da)
Main Event JSON Path: $
The Main Event JSON Path determines the root path where the system starts parsing raw response data into D3 event data. The JSON path begins with $, representing the root element. The path is formed by appending a sequence of child elements to $, each separated by a dot (.). Square brackets with nested quotation marks ([‘...’]) should be used to separate child elements in JSON arrays.
For example, the root node of a JSON Path is $. The child node denoting the Event name field would be name. Putting it together, the JSON Path expression to extract the Event name is $.name.
Event Source for Alert Detections
.png?inst-v=9d16beaf-952a-4ae4-8fe8-e35f7a3745da)
The D3 system configures the field mappings which are specific to the Alert Detection-related events (e.g., Alert State and Country). If a source field in the field mapping is not found, the corresponding field mapping will be ignored. Because the EventSource field in the raw data for Alert Detections consistently has the value AlertDetections, these events can be identified by the Search String: {$.EventSource}=AlertDetections. Click Edit Event Source to view the Search String.
The pre-configured field mappings are detailed below:
Field Name | Source Field |
Default Event Source (Main Event JSON Path: $) | |
Event name | .name |
Start Time | .timestamp |
Event Type | .udmEvent.metadata.eventType |
Severity | .severity |
Device | .asset.hostname |
Device IP address | .asset.assetIpAddress |
Source Product | .sourceProduct |
Principal IP | .udmEvent.principal.ip |
IP | .udmEvent..userid |
Destination hostname | .target.hostname |
Destination | .target.url.application |
Event category | .securityResult..categoryDetails |
Action taken | .securityResult..action |
Alert type | .alertType |
Description | .uri |
Recipient | .network.email.to |
Confidence Level | .securityResult.confidence |
Sender | .network.email.from |
Email subject | .network.email.subject |
Product Event Type | .udmEvent.metadata.productEventType |
Source IP address | .udmEvent.src.ip |
Destination IP address | .udmEvent.target.ip |
Source port | .udmEvent.src.port |
Destination port | .udmEvent.target.port |
Rule name | .udmEvent.securityResult.ruleName |
Document ID | {SourceProduct}-{EventName}-{LocalTime} |
Event Source for Alert Detections (Search String: {$.EventSource}=AlertDetections) The search string format is {$.EventSource}=AlertDetections. If the value of the EventSource key is AlertDetections in the event object under raw data, then the Alert Detection-related events will use the field mapping below. | |
Unique Event Key | .id |
Start Time | .detectionTime |
Event Type | .type |
Description | .detection[*].description |
Rule name | .detection[*].ruleName |
Rule Version | .detection[*].ruleVersion |
Rule ID | .detection[*].ruleId |
Alert State | .detection[*].alertState |
Rule Type | .detection[*].ruleType |
Sub Event | .collectionElements[*].references[*].event |
Sub Event | .collectionElements[*].references[*].event |
Process ID | .collectionElements[*].references[*].event.target.process.pid |
File Hash MD5 | .collectionElements[*].references[*].event.target.file.md5 |
Process command line | .collectionElements[*].references[*].event.target.process.commandLine |
Parent process commandline | .collectionElements[*].references[*].event.target.process.parentProcess.commandLine |
Parent process ID | .collectionElements[*].references[*].event.target.process.parentProcess.pid |
Parent Process Hash MD5 | .collectionElements[*].references[*].event.target.process.parentProcess.file.md5 |
Parent Process Hash SHA256 | .collectionElements[*].references[*].event.target.process.parentProcess.file.sha256 |
File Hash SHA1 | .collectionElements[*].references[*].event.target.file.sha1 |
File Hash SHA256 | .collectionElements[*].references[*].event.target.file.sha256 |
Filepath | .collectionElements[*].references[*].event.target.file.fullPath |
Hostname | .collectionElements[*].references[*].event.principal.hostname |
Username | .collectionElements[*].references[*].event.principal.user.userDisplayName |
User ID | .collectionElements[*].references[*].event.principal.user.userid |
Device IP address | .collectionElements[*].references[*].event.principal.ip |
Device MAC address | .collectionElements[*].references[*].event.principal.mac |
Public IP Address | .collectionElements[*].references[*].event.principal.natIp |
Operating system | .collectionElements[*].references[*].event.principal.asset.platformSoftware.platformVersion |
Threat name | .collectionElements[*].references[*].event.securityResult[*].threatName |
Threat action taken | .collectionElements[*].references[*].event.securityResult[*].action |
Threat severity | .collectionElements[*].references[*].event.securityResult[*].severity |
Threat Status | .collectionElements[*].references[*].event.securityResult[*].threatStatus |
Source vendor name | .collectionElements[*].references[*].event.metadata.vendorName |
Source vendor product name | .collectionElements[*].references[*].event.metadata.productName |
Original event ID | .collectionElements[*].references[*].event.metadata.productLogId |
First Seen Time | .timeWindow.startTime |
Last Seen Time | .timeWindow.endTime |
Email Addresses | .collectionElements[*].references[*].event.principal.user.emailAddresses |
URL | .collectionElements[*].references[*].event.target.url |
Threat Summary | .collectionElements[*].references[*].event.securityResult[*].summary |
Original Event Type | .collectionElements[*].references[*].event.metadata.eventType |
Country | .collectionElements[*].references[*].event.principal.location.countryOrRegion |
Region | .collectionElements[*].references[*].event.principal.location.state |
Latitude | .collectionElements[*].references[*].event.principal.location.regionLatitude |
Longitude | .collectionElements[*].references[*].event.principal.location.regionLongitude |
Destination IP address | .collectionElements[*].references[*].event.target.ip |
READER NOTE
The Unique Event Key field mapping is used to prevent duplicate event ingestions. D3 will check if the value of a selected JSON path matches any Unique Event Key of previously ingested events. If a match is found, the event will be dismissed. If no match is found, an event will be created. However, if no Unique Event Key is mapped, then the hash value from the event pending ingestion will be used to check for any matches with existing events. If no match is found, the event will be created.
Unlike most other D3 SOAR integrations, the Google Chronicle integration’s Fetch Event command’s Default Event Source mapping does not include Unique Event Key to fetch the same fetched alert with multiple updates.
READER NOTE
*{SourceProduct}-{EventName}-{LocalTime}
In D3, the events from Google Chronicle will be predefined with {SourceProduct}-{EventName}-{LocalTime} as the Document ID. In this case, Document ID will be auto-generated from those fields' paths.
The source type for Document ID is defined as Placeholder. {SourceProduct}-{EventName}-{LocalTime} is a default mapping value provided by D3.
See Source Field Type from Event and Incident Intake Field Mapping for more details on event field mapping field types.
Error Handling
If the Return Data is Failed, an Error tab will appear in the Test Result window.
The error tab contains the details responded from D3 SOAR or third-party API calls, including Failure Indicator, Status Code, and Message. This can help locate the root cause of a command failure.
Parts in Error | Description | Example |
Failure Indicator | Indicates the command failure that happened at a specific input and/or API call. | Fetch Event failed. |
Status Code | The response code issued by the third-party API server or the D3 SOAR system that can be used to locate the corresponding error category. For example, if the returned status code is 401, the selected connection is unauthorized to run the command. The user or system support would need to check the permission setting in the Google Chronicle portal. Refer to the HTTP Status Code Registry for details. | Status Code: 400. |
Message | The raw data or captured key error message from the integration API server about the API request failure. | Message: Errors in Test Connection function. Please check D3Error object in RawData for more details. |
Error Sample Data Fetch Event failed. Status Code: 400. Message: Errors in Test Connection function. Please check D3Error object in RawData for more details. |
Get Rules
Retrieves details about the most recent version of specific rules, or obtains details about particular versions of specified rules.
READER NOTE
Rule IDs or Version IDs is a required parameter to run this command.
Run the List Rules command to obtain the Rule IDs or Version IDs. Rule IDs can be find in the returned raw data at the path $.rules[*].ruleId. Version IDs can be found in the returned raw data at the path $.rules[*].versionId.
Input
Input Parameter | Required/Optional | Description | Example |
Rule IDs or Version IDs | Required | The IDs of the rules or versions to retrieve details. Rule IDs and Rule Version IDs can be obtained using the List Rules command. |
JSON
|
Output
To view the sample output data for all commands, refer to this article.
Error Handling
If the Return Data is Partially Successful or Failed, an Error tab will appear in the Test Result window.
The error tab contains the details responded from D3 SOAR or third-party API calls, including Failure Indicator, Status Code, and Message. This can help locate the root cause of a command failure.
Parts in Error | Description | Example |
Failure Indicator | Indicates the command failure that happened at a specific input and/or API call. | Get Rules failed. |
Status Code | The response code issued by the third-party API server or the D3 SOAR system that can be used to locate the corresponding error category. For example, if the returned status code is 401, the selected connection is unauthorized to run the command. The user or system support would need to check the permission setting in the Google Chronicle portal. Refer to the HTTP Status Code Registry for details. | Status Code: 400. |
Message | The raw data or captured key error message from the integration API server about the API request failure. | Message: generic::invalid_argument: version ID must be in format {rule_id} or {rule_id}@v_{version_timestamp.seconds}_{version_timestamp.nanos}. |
Error Sample Data Get Rules failed. Status Code: 400. Message: generic::invalid_argument: version ID must be in format {rule_id} or {rule_id}@v_{version_timestamp.seconds}_{version_timestamp.nanos}. |
List Assets
Lists all the assets that accessed the specified artifact(s) in your enterprise within the specified time period. This command provides details about each asset, including the initial and final time they accessed the artifact. It limits the output to a maximum of 100 assets for each artifact. You can specify a narrower time period to reduce the number of assets returned.
Input
Input Parameter | Required/Optional | Description | Example |
Artifact Indicators | Required | The artifact indicators associated with the assets to return. Valid values for the artifact indicator include domain names, IP addresses and MD5, SHA1, or SHA256 hashes. |
JSON
|
Start Time | Required | The start time of the time range to filter assets that accessed the specified artifacts, in UTC time. | 2020-09-07 00:00 |
End Time | Required | The end time of the time range to filter assets that accessed the specified artifacts, in UTC time. | 2020-12-07 00:00 |
Output
To view the sample output data for all commands, refer to this article.
Error Handling
If the Return Data is Partially Successful or Failed, an Error tab will appear in the Test Result window.
The error tab contains the details responded from D3 SOAR or third-party API calls, including Failure Indicator, Status Code, and Message. This can help locate the root cause of a command failure.
Parts in Error | Description | Example |
Failure Indicator | Indicates the command failure that happened at a specific input and/or API call. | List Assets failed. |
Status Code | The response code issued by the third-party API server or the D3 SOAR system that can be used to locate the corresponding error category. For example, if the returned status code is 401, the selected connection is unauthorized to run the command. The user or system support would need to check the permission setting in the Google Chronicle portal. Refer to the HTTP Status Code Registry for details. | Status Code: 400. |
Message | The raw data or captured key error message from the integration API server about the API request failure. | Message: Some artifacts are not valid artifacts. |
Error Sample Data List Assets failed. Status Code: 400. Message: Some artifacts are not valid artifacts. |
List Detections
Retrieves the detections for the specified version of a rule, the latest version of a rule, all versions of a rule, or all versions of all rules.
READER NOTE
A max detection count of 100 will be returned if the returned detections based on the search criteria is greater than 100.
Version IDs and Rule IDs are required parameters to run this command.
Run the List Rules command to obtain the Version IDs and Rule IDs.
Version IDs can be found in the returned raw data at the path $.rules[*].versionId.
Rule IDs can be find in the returned raw data at the path $.rules[*].ruleId.
There are several options for retrieving detections:
Specific Rule Versions: Input Version IDs for detections of those versions.
Latest Version of Rules: Enter Rule IDs and set Version to Latest Version.
All Versions of Rules: Enter Rule IDs and set Version to All Versions.
All Versions of All Rules: Leave Version IDs and Rule IDs empty.
Combining Version and Rule IDs: Input both to get detections for each specified version and rule.
Input
Input Parameter | Required/Optional | Description | Example |
Start Time | Optional | The start time (in UTC time) of the time range to filter detections, as determined by the Query Time Field. If this parameter is not defined, the start time is treated as open-ended. | 2023-04-26 00:00 |
End Time | Required | The endtime (in UTC time) of the time range to filter detections, as determined by the Query Time Field. If this parameter is not defined, the end time is treated as open-ended. | 2023-04-27 00:00 |
Query Time Field | Optional | The time field (i.e., Detection Time or Created Time) by which the Start Time and End Timer parameters are defined. If this parameter is not defined, the default option is Detection Time.Detections are returned in descending order based on the selected query time field. | Detection Time
|
Alert State | Optional | The alert state (i.e., Alerting or Not Alerting) to filter returned detections. If this parameter is not defined, detections of both alert states will be returned. | Alerting |
Version IDs | Optional | The IDs of the rule versions to filter returned detections. Rule Version IDs can be obtained using the List Rules command. |
JSON
|
Rule IDs | Optional | The IDs of the rules to filter returned detections. Rule IDs can be obtained using the List Rules command. |
JSON
|
Version | Optional | The rule version (i.e., All Versions or Latest Version) to filter returned detections. If this parameter is not defined, only detections from the latest rule version will be returned. | All Versions |
Output
To view the sample output data for all commands, refer to this article.
Error Handling
If the Return Data is Partially Successful or Failed, an Error tab will appear in the Test Result window.
The error tab contains the details responded from D3 SOAR or third-party API calls, including Failure Indicator, Status Code, and Message. This can help locate the root cause of a command failure.
Parts in Error | Description | Example |
Failure Indicator | Indicates the command failure that happened at a specific input and/or API call. | List Detections failed. |
Status Code | The response code issued by the third-party API server or the D3 SOAR system that can be used to locate the corresponding error category. For example, if the returned status code is 401, the selected connection is unauthorized to run the command. The user or system support would need to check the permission setting in the Google Chronicle portal. Refer to the HTTP Status Code Registry for details. | Status Code: 400. |
Message | The raw data or captured key error message from the integration API server about the API request failure. | Message: generic::invalid_argument: invalid wildcard version ID: invalid rule_id: invalid user rule_id \"xxx\", must be in the form ru_xxxxxxxx-xxxx-xxxx-xxxx-xxxxxxxxxxxx. |
Error Sample Data List Detections failed. Status Code: 400. Message: generic::invalid_argument: invalid wildcard version ID: invalid rule_id: invalid user rule_id \"xxx\", must be in the form ru_xxxxxxxx-xxxx-xxxx-xxxx-xxxxxxxxxxxx. |
List Events
Lists all the events discovered within your enterprise on a particular device within the specified time range. If you receive 10,000 events, there might still be more events within your Chronicle account. You can narrow the time range and issue the call again to ensure you have visibility into all possible events.
READER NOTE
Asset Indicators is a required parameter to run this command.
Run the Fetch Event or List Assets command to obtain the Asset Indicators.
Input
Input Parameter | Required/Optional | Description | Example |
Asset Indicators | Required | The asset indicators to filter returned events. Acceptable indicators include hostname, asset IP address, MAC address, or a composite product ID (such as 'CS:1234-5678', combining product ID type and value). Asset indicators can be obtained using the Fetch Event or List Assets commands. |
JSON
|
Start Time | Required | The start time (in UTC time) of the time range from which the events occurred to filter returned events. | 2020-12-04 00:00 |
End Time | Required | The end time (in UTC time) of the time range from which the events occurred to filter returned events. | 2020-12-05 00:00 |
Reference Time | Optional | The reference time (in UTC time) for the asset to investigate. If this parameter is not defined, the default reference time is the specified end time. | 2020-12-04 00:00 |
Output
To view the sample output data for all commands, refer to this article.
Error Handling
If the Return Data is Partially Successful or Failed, an Error tab will appear in the Test Result window.
The error tab contains the details responded from D3 SOAR or third-party API calls, including Failure Indicator, Status Code, and Message. This can help locate the root cause of a command failure.
Parts in Error | Description | Example |
Failure Indicator | Indicates the command failure that happened at a specific input and/or API call. | List Events failed. |
Status Code | The response code issued by the third-party API server or the D3 SOAR system that can be used to locate the corresponding error category. For example, if the returned status code is 401, the selected connection is unauthorized to run the command. The user or system support would need to check the permission setting in the Google Chronicle portal. Refer to the HTTP Status Code Registry for details. | Status Code: 400. |
Message | The raw data or captured key error message from the integration API server about the API request failure. | Message: Errors in Test Connection function. Please check D3Error object in RawData for more details. |
Error Sample Data List Events failed. Status Code: 400. Message: Errors in Test Connection function. Please check D3Error object in RawData for more details. |
List IoC Details
Returns the threat intelligence associated with an artifact. Artifact indicators can be obtained from List IoCs command or from IoC partners of Google (for example, the DHS threat feed).
READER NOTE
Artifact IoCs is a required parameter to run this command.
Run the List IoCs command to obtain the Artifact IoCs. Artifact IoCs can be found in the returned raw data at the path $.response.matches.artifact.
For Domain Names, use $.response.matches.artifact.domainName.
For IP Addresses, use $.response.matches.artifact.destinationIpAddress.
Input
Input Parameter | Required/Optional | Description | Example |
Artifact IoCs | Required | The artifact IoCs to retrieve details. Artifact IoCs can be obtained using the List IoCs command. Valid IoC types include IP addresses and domain names. |
JSON
|
Output
To view the sample output data for all commands, refer to this article.
Error Handling
If the Return Data is Partially Successful or Failed, an Error tab will appear in the Test Result window.
The error tab contains the details responded from D3 SOAR or third-party API calls, including Failure Indicator, Status Code, and Message. This can help locate the root cause of a command failure.
Parts in Error | Description | Example |
Failure Indicator | Indicates the command failure that happened at a specific input and/or API call. | List IoC Details failed. |
Status Code | The response code issued by the third-party API server or the D3 SOAR system that can be used to locate the corresponding error category. For example, if the returned status code is 401, the selected connection is unauthorized to run the command. The user or system support would need to check the permission setting in the Google Chronicle portal. Refer to the HTTP Status Code Registry for details. | Status Code: 400. |
Message | The raw data or captured key error message from the integration API server about the API request failure. | Message: Some artifacts are not valid artifacts. |
Error Sample Data List IoC Details failed. Status Code: 400. Message: Some artifacts are not valid artifacts. |
List IoCs
Lists all the IoCs discovered within your enterprise within the specified time range. If you receive 10,000 IoCs, there might still be more IoCs discovered in your Chronicle account. You might want to narrow the time range and issue the call again to ensure you have visibility on all possible IoCs.
Input
Input Parameter | Required/Optional | Description | Example |
Start Time | Required | The last seen time from which to return IoCs. | 2023-04-27 00:00 |
Output
To view the sample output data for all commands, refer to this article.
Error Handling
If the Return Data is Failed, an Error tab will appear in the Test Result window.
The error tab contains the details responded from D3 SOAR or third-party API calls, including Failure Indicator, Status Code, and Message. This can help locate the root cause of a command failure.
Parts in Error | Description | Example |
Failure Indicator | Indicates the command failure that happened at a specific input and/or API call. | List IoCs failed. |
Status Code | The response code issued by the third-party API server or the D3 SOAR system that can be used to locate the corresponding error category. For example, if the returned status code is 401, the selected connection is unauthorized to run the command. The user or system support would need to check the permission setting in the Google Chronicle portal. Refer to the HTTP Status Code Registry for details. | Status Code: 400. |
Message | The raw data or captured key error message from the integration API server about the API request failure. | Message: Errors in Test Connection function. Please check D3Error object in RawData for more details. |
Error Sample Data List IoCs failed. Status Code: 400. Message: Errors in Test Connection function. Please check D3Error object in RawData for more details. |
List Rules
Lists the latest versions of all rules.
Input
Input Parameter | Required/Optional | Description | Example |
Rule State | Optional | The rule state (i.e., Active, Archived or All) to filter returned rules. If this parameter is not defined, the default value is Active. | All |
Output
To view the sample output data for all commands, refer to this article.
Error Handling
If the Return Data is Failed, an Error tab will appear in the Test Result window.
The error tab contains the details responded from D3 SOAR or third-party API calls, including Failure Indicator, Status Code, and Message. This can help locate the root cause of a command failure.
Parts in Error | Description | Example |
Failure Indicator | Indicates the command failure that happened at a specific input and/or API call. | List Rules failed. |
Status Code | The response code issued by the third-party API server or the D3 SOAR system that can be used to locate the corresponding error category. For example, if the returned status code is 401, the selected connection is unauthorized to run the command. The user or system support would need to check the permission setting in the Google Chronicle portal. Refer to the HTTP Status Code Registry for details. | Status Code: 400. |
Message | The raw data or captured key error message from the integration API server about the API request failure. | Message: Errors in Test Connection function. Please check D3Error object in RawData for more details. |
Error Sample Data List Rules failed. Status Code: 400. Message: Errors in Test Connection function. Please check D3Error object in RawData for more details. |
List Rule Versions
Retrieves all versions of the specific rule(s). The versions are listed in descending order by the rule version creation time.
READER NOTE
Rule IDs is a required parameter to run this command.
Run the List Rules command to obtain the Rule IDs. Rule IDs can be find in the returned raw data at the path $.rules[*].ruleId.
Input
Input Parameter | Required/Optional | Description | Example |
Rule IDs | Required | The IDs of the rules to retrieve all versions. Rule IDs can be obtained using the List Rules command. |
JSON
|
Output
To view the sample output data for all commands, refer to this article.
Error Handling
If the Return Data is Partially Successful or Failed, an Error tab will appear in the Test Result window.
The error tab contains the details responded from D3 SOAR or third-party API calls, including Failure Indicator, Status Code, and Message. This can help locate the root cause of a command failure.
Parts in Error | Description | Example |
Failure Indicator | Indicates the command failure that happened at a specific input and/or API call. | List Rule Versions failed. |
Status Code | The response code issued by the third-party API server or the D3 SOAR system that can be used to locate the corresponding error category. For example, if the returned status code is 401, the selected connection is unauthorized to run the command. The user or system support would need to check the permission setting in the Google Chronicle portal. Refer to the HTTP Status Code Registry for details. | Status Code: 400. |
Message | The raw data or captured key error message from the integration API server about the API request failure. | Message: generic::invalid_argument: provided rule ID xxxis not valid. |
Error Sample Data List Rule Versions failed. Status Code: 400. Message: generic::invalid_argument: provided rule ID xxxis not valid. |
UDM Search
Initiates a UDM search query and retrieves matches.
Input
Input Parameter | Required/Optional | Description | Example |
Start Time | Required | The start time (in UTC time) of the time range to filter results. Events that have been created on or following this specified time will be included in the results. Note: The duration between the Start Time and End Time parameters cannot exceed 90 days. | 2020-09-10 00:00 |
End Time | Required | The end time (in UTC time) of the time range to filter results. Events that have been created before this specified time will be included in the results. Note: The duration between the Start Time and End Time parameters cannot exceed 90 days. | 2020-09-11 00:00 |
Query Statement | Required | The UDM search query statement. Please refer to Unified Data Model usage guide | Chronicle | Google Cloud for more information on UDM usage. | metadata.event_type="NETWORK_CONNECTION" and target.hostname="xn--***.com" |
Limit | Optional | The maximum number of matching events to return. This value must be equal to or less than 10,000. If this parameter is not defined, the default value is 100. | 10 |
Output
To view the sample output data for all commands, refer to this article.
Error Handling
If the Return Data is Failed, an Error tab will appear in the Test Result window.
The error tab contains the details responded from D3 SOAR or third-party API calls, including Failure Indicator, Status Code, and Message. This can help locate the root cause of a command failure.
Parts in Error | Description | Example |
Failure Indicator | Indicates the command failure that happened at a specific input and/or API call. | UDM Search failed. |
Status Code | The response code issued by the third-party API server or the D3 SOAR system that can be used to locate the corresponding error category. For example, if the returned status code is 401, the selected connection is unauthorized to run the command. The user or system support would need to check the permission setting in the Google Chronicle portal. Refer to the HTTP Status Code Registry for details. | Status Code: 400. |
Message | The raw data or captured key error message from the integration API server about the API request failure. | Message: generic::invalid_argument: The request query is invalid. |
Error Sample Data UDM Search failed. Status Code: 400. Message: generic::invalid_argument: The request query is invalid. |
Update Alerts
Updates the specified alerts using Method: legacy.legacyUpdateAlert. The API version is v1alpha. This command can be used to resolve detection alerts.
READER NOTE
Alert IDs is a required parameter to run this command.
Run the List Detections command to obtain the Alert IDs. Alert IDs can be find in the returned raw data at the path $.detections[*].id.
Input
Input Parameter | Required/Optional | Description | Example |
Customer ID | Required | The customer ID for the Google SecOps instance. Obtainable from Google SecOps under Settings > Profile. | 3593*****9c02 |
Alert IDs | Required | The IDs of the alerts to update. Alert IDs can be obtained using the List Detections command, where they are returned as Detection IDs. |
JSON
|
Severity | Optional | The severity score of the finding. Valid values range from 1 to 100. Severity scores are categorized as follows:
| 75 |
Priority | Optional | The priority level assigned to the alert. Available options are:
| Medium |
Verdict | Optional | A verdict on whether the finding reflects a security incident. Available options are:
| True Positive |
Reputation | Optional | A classification of the finding as useful or not useful. Available options are:
| Unspecified |
Status | Optional | The current status of the alert. Available options are:
| Closed |
Reason | Optional | The reason for updating the alert. Available options are:
| Malicious |
Root Cause | Optional | The identified root cause of the alert. | true positive detect |
Comment | Optional | A comment regarding the alert. | test comment2 |
Output
To view the sample output data for all commands, refer to this article.
Error Handling
If the Return Data is Partially Successful or Failed, an Error tab will appear in the Test Result window.
The error tab contains the details responded from D3 SOAR or third-party API calls, including Failure Indicator, Status Code, and Message. This can help locate the root cause of a command failure.
Parts in Error | Description | Example |
Failure Indicator | Indicates the command failure that happened at a specific input and/or API call. | Update Alerts failed. |
Status Code | The response code issued by the third-party API server or the D3 SOAR system that can be used to locate the corresponding error category. For example, if the returned status code is 401, the selected connection is unauthorized to run the command. The user or system support would need to check the permission setting in the Google Chronicle portal. Refer to the HTTP Status Code Registry for details. | Status Code: 403. |
Message | The raw data or captured key error message from the integration API server about the API request failure. | Message: Forbidden. |
Error Sample Data Update Alerts failed. Status Code: 403. Message: Forbidden. |
Update Live Rule Status
Enables or disables the latest version of the rule.
READER NOTE
Rule IDs is a required parameter to run this command.
Run the List Rules command to obtain the Rule IDs. Rule IDs can be find in the returned raw data at the path $.rules[*].ruleId.
If a specified rule is already enabled or disabled, the same operation cannot be performed again. To re-enable or disable the rule, its current setting must first be changed to the opposite state.
Input
Input Parameter | Required/Optional | Description | Example |
Rule IDs | Required | The IDs of the rules to update their live rule status. Rule IDs can be obtained using the List Rules command. |
JSON
|
Live Rule Status | Required | The option to enable or disable the live rules. | Enable |
Output
To view the sample output data for all commands, refer to this article.
Error Handling
If the Return Data is Partially Successful or Failed, an Error tab will appear in the Test Result window.
The error tab contains the details responded from D3 SOAR or third-party API calls, including Failure Indicator, Status Code, and Message. This can help locate the root cause of a command failure.
Parts in Error | Description | Example |
Failure Indicator | Indicates the command failure that happened at a specific input and/or API call. | Update Live Rule Status failed. |
Status Code | The response code issued by the third-party API server or the D3 SOAR system that can be used to locate the corresponding error category. For example, if the returned status code is 401, the selected connection is unauthorized to run the command. The user or system support would need to check the permission setting in the Google Chronicle portal. Refer to the HTTP Status Code Registry for details. | Status Code: 400. |
Message | The raw data or captured key error message from the integration API server about the API request failure. | Message: generic::invalid_argument: provided rule ID xxx is not valid. |
Error Sample Data Update Live Rule Status failed. Status Code: 400. Message: generic::invalid_argument: provided rule ID xxx is not valid. |
Update Rule Alert Status
Enables or disables alerts for the specified rule(s).
READER NOTE
Rule IDs is a required parameter to run this command.
Run the List Rules command to obtain the Rule IDs. Rule IDs can be find in the returned raw data at the path $.rules[*].ruleId.
Input
Input Parameter | Required/Optional | Description | Example |
Rule IDs | Required | The IDs of the rules to update. Rule IDs can be obtained using the List Rules command. |
JSON
|
Alert Status | Required | The option to enable or disable rule alerts. | Enable |
Output
To view the sample output data for all commands, refer to this article.
Error Handling
If the Return Data is Partially Successful or Failed, an Error tab will appear in the Test Result window.
The error tab contains the details responded from D3 SOAR or third-party API calls, including Failure Indicator, Status Code, and Message. This can help locate the root cause of a command failure.
Parts in Error | Description | Example |
Failure Indicator | Indicates the command failure that happened at a specific input and/or API call. | Update Rule Alert Status failed. |
Status Code | The response code issued by the third-party API server or the D3 SOAR system that can be used to locate the corresponding error category. For example, if the returned status code is 401, the selected connection is unauthorized to run the command. The user or system support would need to check the permission setting in the Google Chronicle portal. Refer to the HTTP Status Code Registry for details. | Status Code: 400. |
Message | The raw data or captured key error message from the integration API server about the API request failure. | Message: generic::invalid_argument: provided rule ID xxx is not valid. |
Error Sample Data Update Rule Alert Status failed. Status Code: 400. Message: generic::invalid_argument: provided rule ID xxx is not valid. |
Test Connection
Allows users to perform a health check on an integration connection. Users can schedule a periodic health check by selecting Connection Health Check when editing an integration connection.
Input
N/A
Output
Output Type | Description | Return Data Type |
Return Data | Indicates one of the possible command execution states: Successful or Failed. The Failed state can be triggered by any of the following errors:
More details about an error can be viewed in the Error tab. | String |
Error Handling
If the Return Data is Failed, an Error tab will appear in the Test Result window.
The error tab contains the details responded from D3 SOAR or third-party API calls, including Failure Indicator, Status Code, and Message. This can help locate the root cause of a command failure.
Parts in Error | Description | Example |
Failure Indicator | Indicates the command failure that happened at a specific input and/or API call. | Test Connection failed. Failed to check the connector. |
Status Code | The response code issued by the third-party API server or the D3 SOAR system that can be used to locate the corresponding error category. For example, if the returned status code is 401, the selected connection is unauthorized to run the command. The user or system support would need to check the permission setting in the Google Chronicle portal. Refer to the HTTP Status Code Registry for details. | Status Code: 400. |
Message | The raw data or captured key error message from the integration API server about the API request failure. | Message: Errors in Test Connection function. Please check D3Error object in RawData for more details. |
Error Sample Data Test Connection failed. Failed to check the connector. Status Code: 400. Message: Errors in Test Connection function. Please check D3Error object in RawData for more details. |
FAQ
Question 1: Why isn't the Delete Rules command working?
This API method is not available by default for all Google Chronicle customers. Additional information is available through the assigned Chronicle representative.