
FortiEDR
LAST UPDATED: JULY 30, 2025
Overview
FortiEDR is an Endpoint Detection and Response (EDR) solution developed by Fortinet that provides real-time threat prevention, detection, and automated response on endpoints such as desktops, laptops, and servers.
D3 SOAR is providing REST operations to function with FortiEDR.
FortiEDR is available for use in:
Connection
To connect to FortiEDR from D3 SOAR, follow this part to collect the required information below:
Parameter | Description | Example |
Server URL | The server name or IP address of the FortiEDR management interface. | https://example.ensilo.com |
Username | The login username used to authenticate the API connection. | orgnizationName\username |
Password | The password used to authenticate the API connection. | ***** |
Permission Requirements
Users must be assigned the Rest API role to execute the commands in this integration.
READER NOTE
After creating a FortiEDR Central Manager user with the REST API role, the newly created user must log into the console and change their password before use in REST API calls.
Configuring D3 SOAR to Work with FortiEDR
Log in to D3 SOAR.
Find the FortiEDR integration.
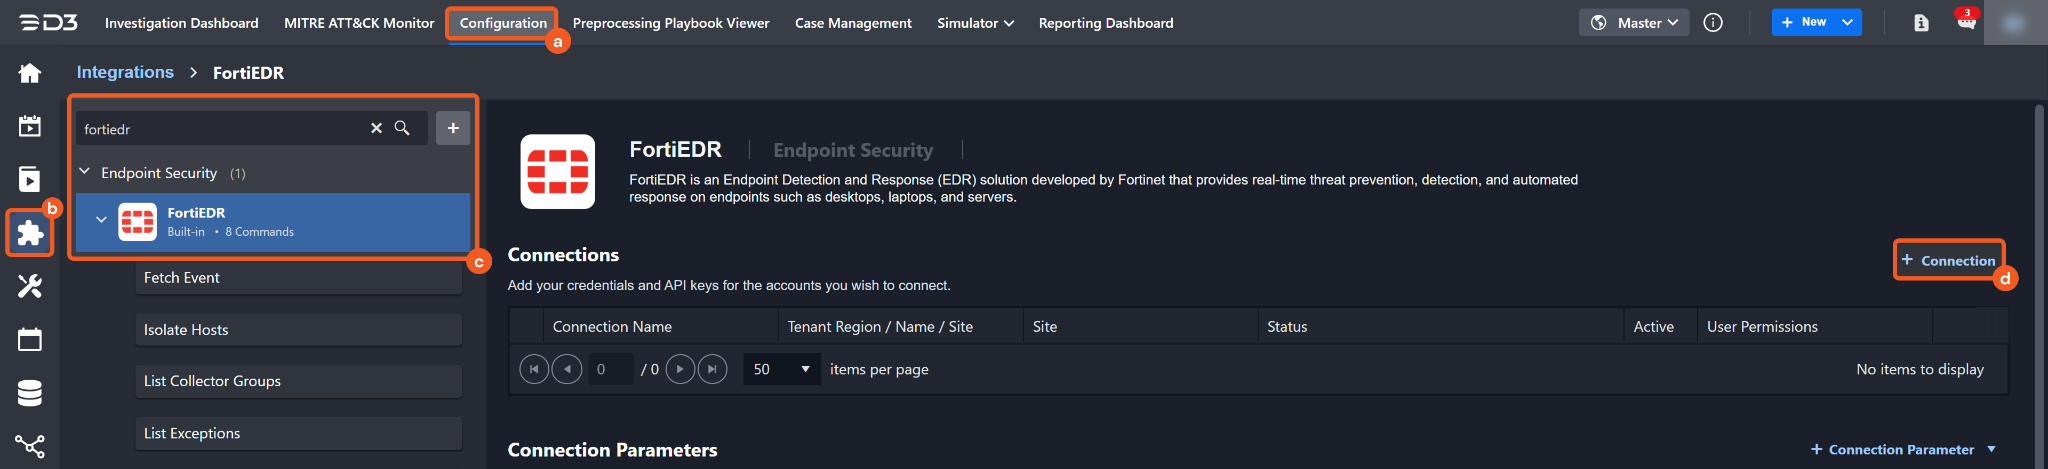
Navigate to Configuration on the top header menu.
Click on the Integration icon on the left sidebar.
Type FortiEDR in the search box to find the integration, then click it to select it.
Click on the + Connection button on the right side of the Connections section. A new connection window will appear.
Configure the following fields to create a connection to FortiEDR.
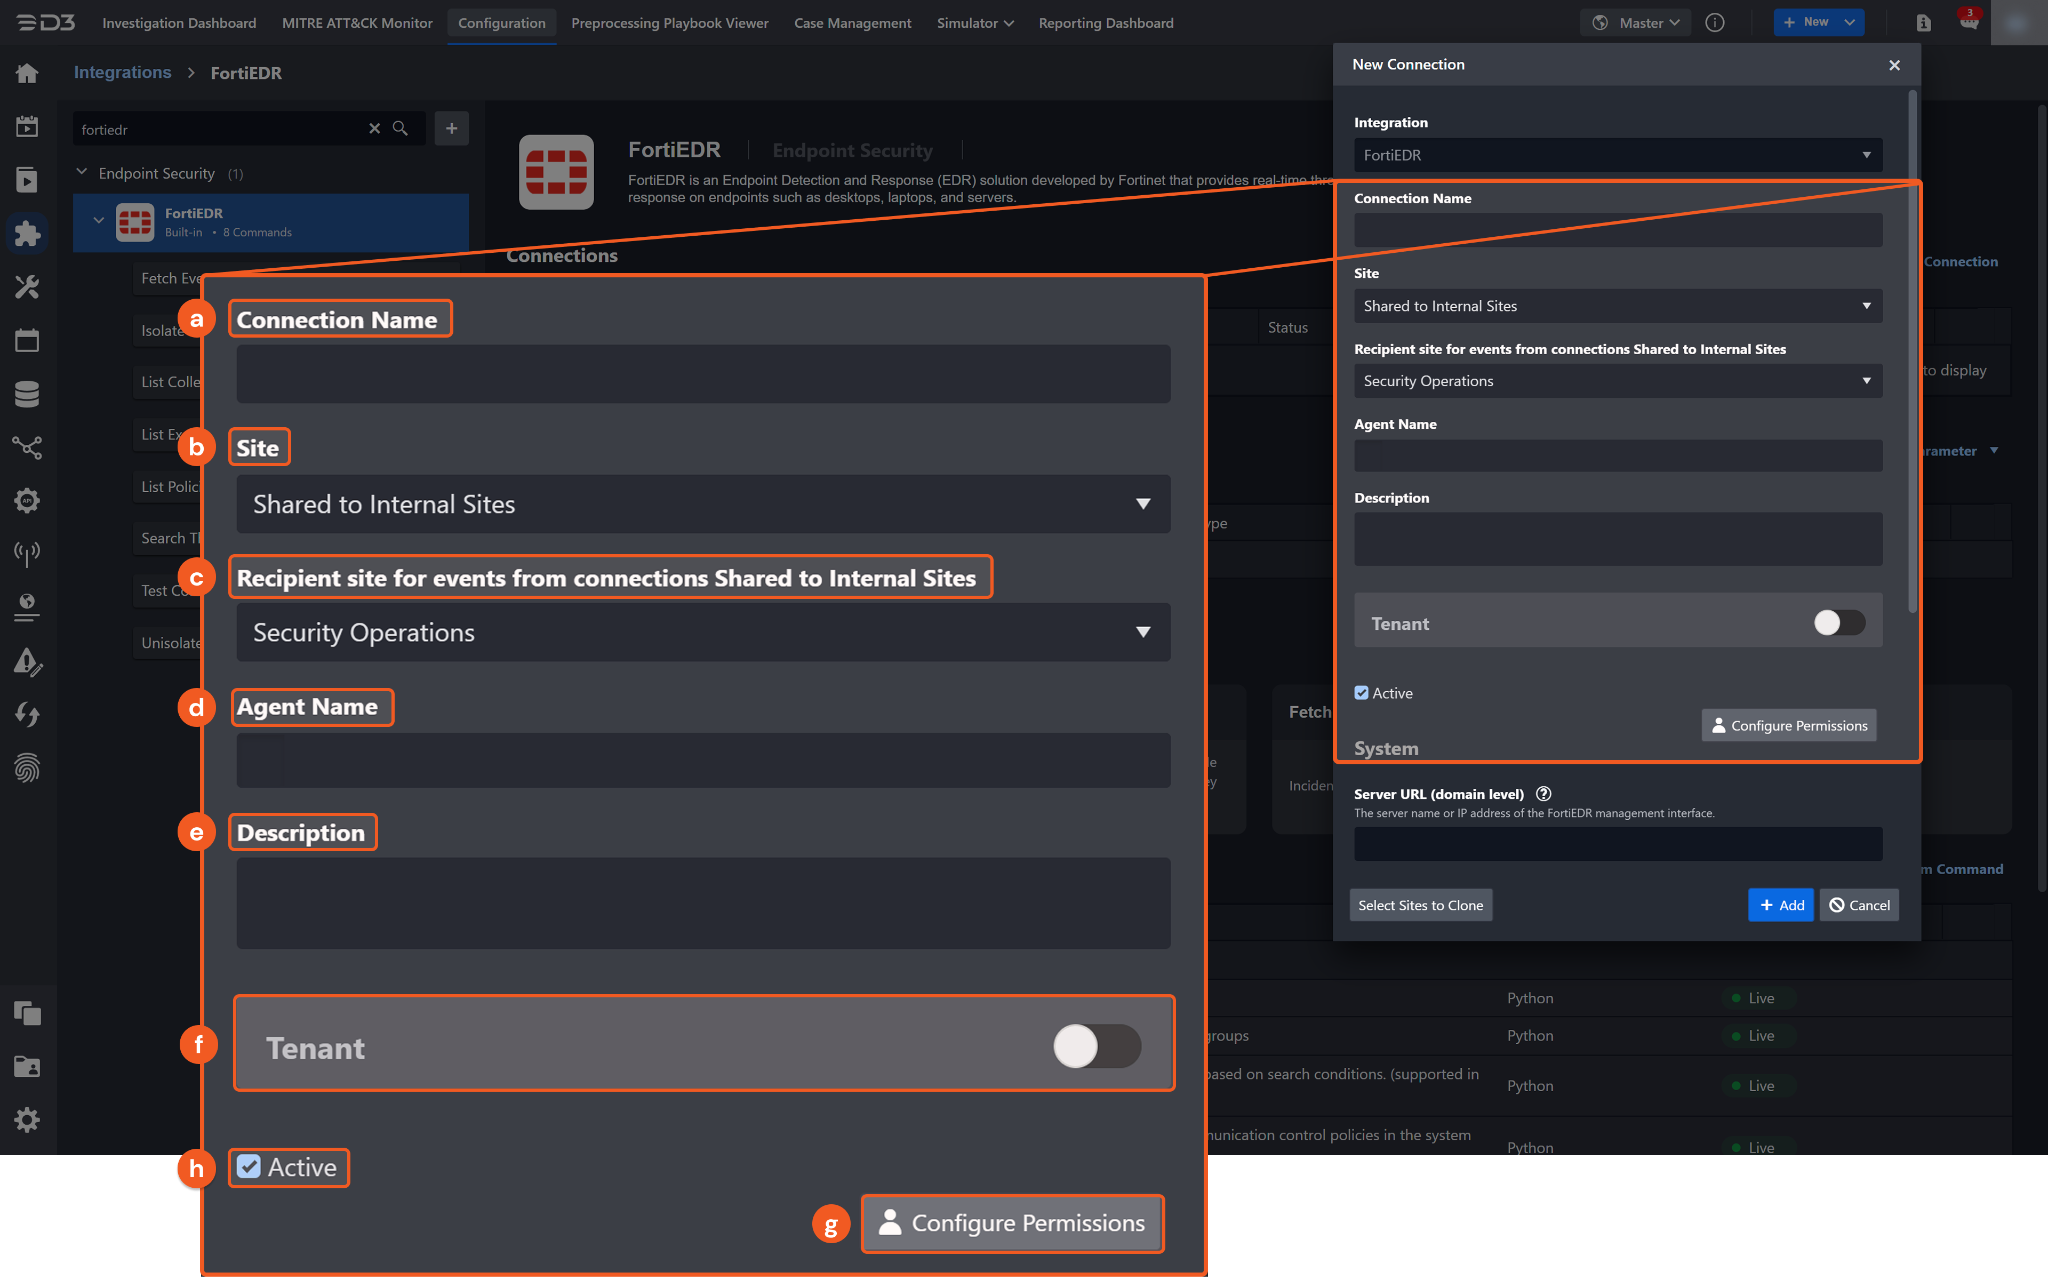
Connection Name: The desired name for the connection.
Site: The site on which to use the integration connection. Use the drop-down menu to select the site. The Share to Internal Sites option enables all internal sites to use the connection. Selecting a specific site will only enable that site to use the connection.
Recipient site for events from connections Shared to Internal Sites: This field is displayed when Share to Internal Sites is selected for the Site field, allowing selection of the internal site for deploying the integration connection.
Agent Name (Optional): The proxy agent required to build the connection. Use the dropdown menu to select the proxy agent from a list of previously configured proxy agents.
Description (Optional): The description for the connection.
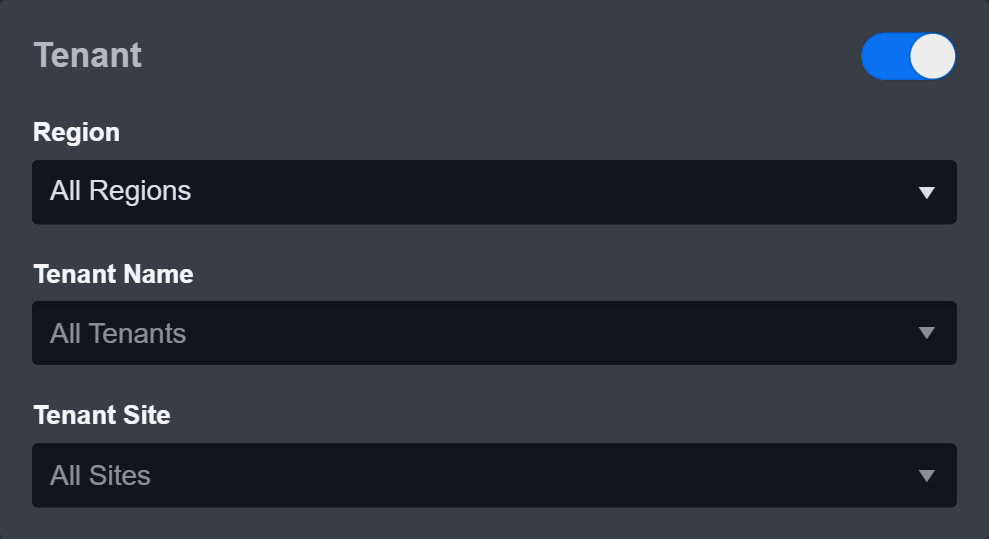
Tenant (Optional): When configuring the connection from a master tenant site, users can choose the specific tenant sites with which to share the connection. Once this setting is enabled, users can filter and select the desired tenant sites from the dropdowns to share the connection.
Active: The checkbox that enables the connection to be used when selected.
Configure User Permissions: Defines which users have access to the connection.
System: This section contains the parameters defined specifically for the integration. These parameters must be configured to create the integration connection.

1. Input the Server URL.
2. Input the Username.
3. Input the Password.
Enable Password Vault: An optional feature that allows users to take the stored credentials from their own password vault. Refer to the password vault connection guide if needed.
Connection Health Check: Periodically checks the connection status by scheduling the Test Connection command at the specified interval (in minutes). Available only for active connections, this feature also allows configuring email notifications for failed attempts.
Test the connection.
Click on the Test Connection button to verify credentials and connectivity. A success alert displays Passed with a green checkmark. If the connection fails, review the parameters and retry.
Click OK to close the alert window.
Click + Add to create and add the configured connection.
Commands
FortiEDR includes the following executable commands for users to set up schedules or create playbook workflows. With the Test Command function, users can execute these commands independently for playbook troubleshooting.
Integration API Note
For more information about the FortiEDR API, refer to the FortiEDR API reference within the user interface of the Central Manager console.
READER NOTE
Certain permissions are required for each command. Refer to the Permission Requirements section for details.
Note for Time-related parameters
The input format of time-related parameters may vary based on user account settings, which may cause the sample data in commands to differ from what is displayed. To adjust the time format, follow these steps:
Navigate to Configuration > Application Settings. Select Date/Time Format.
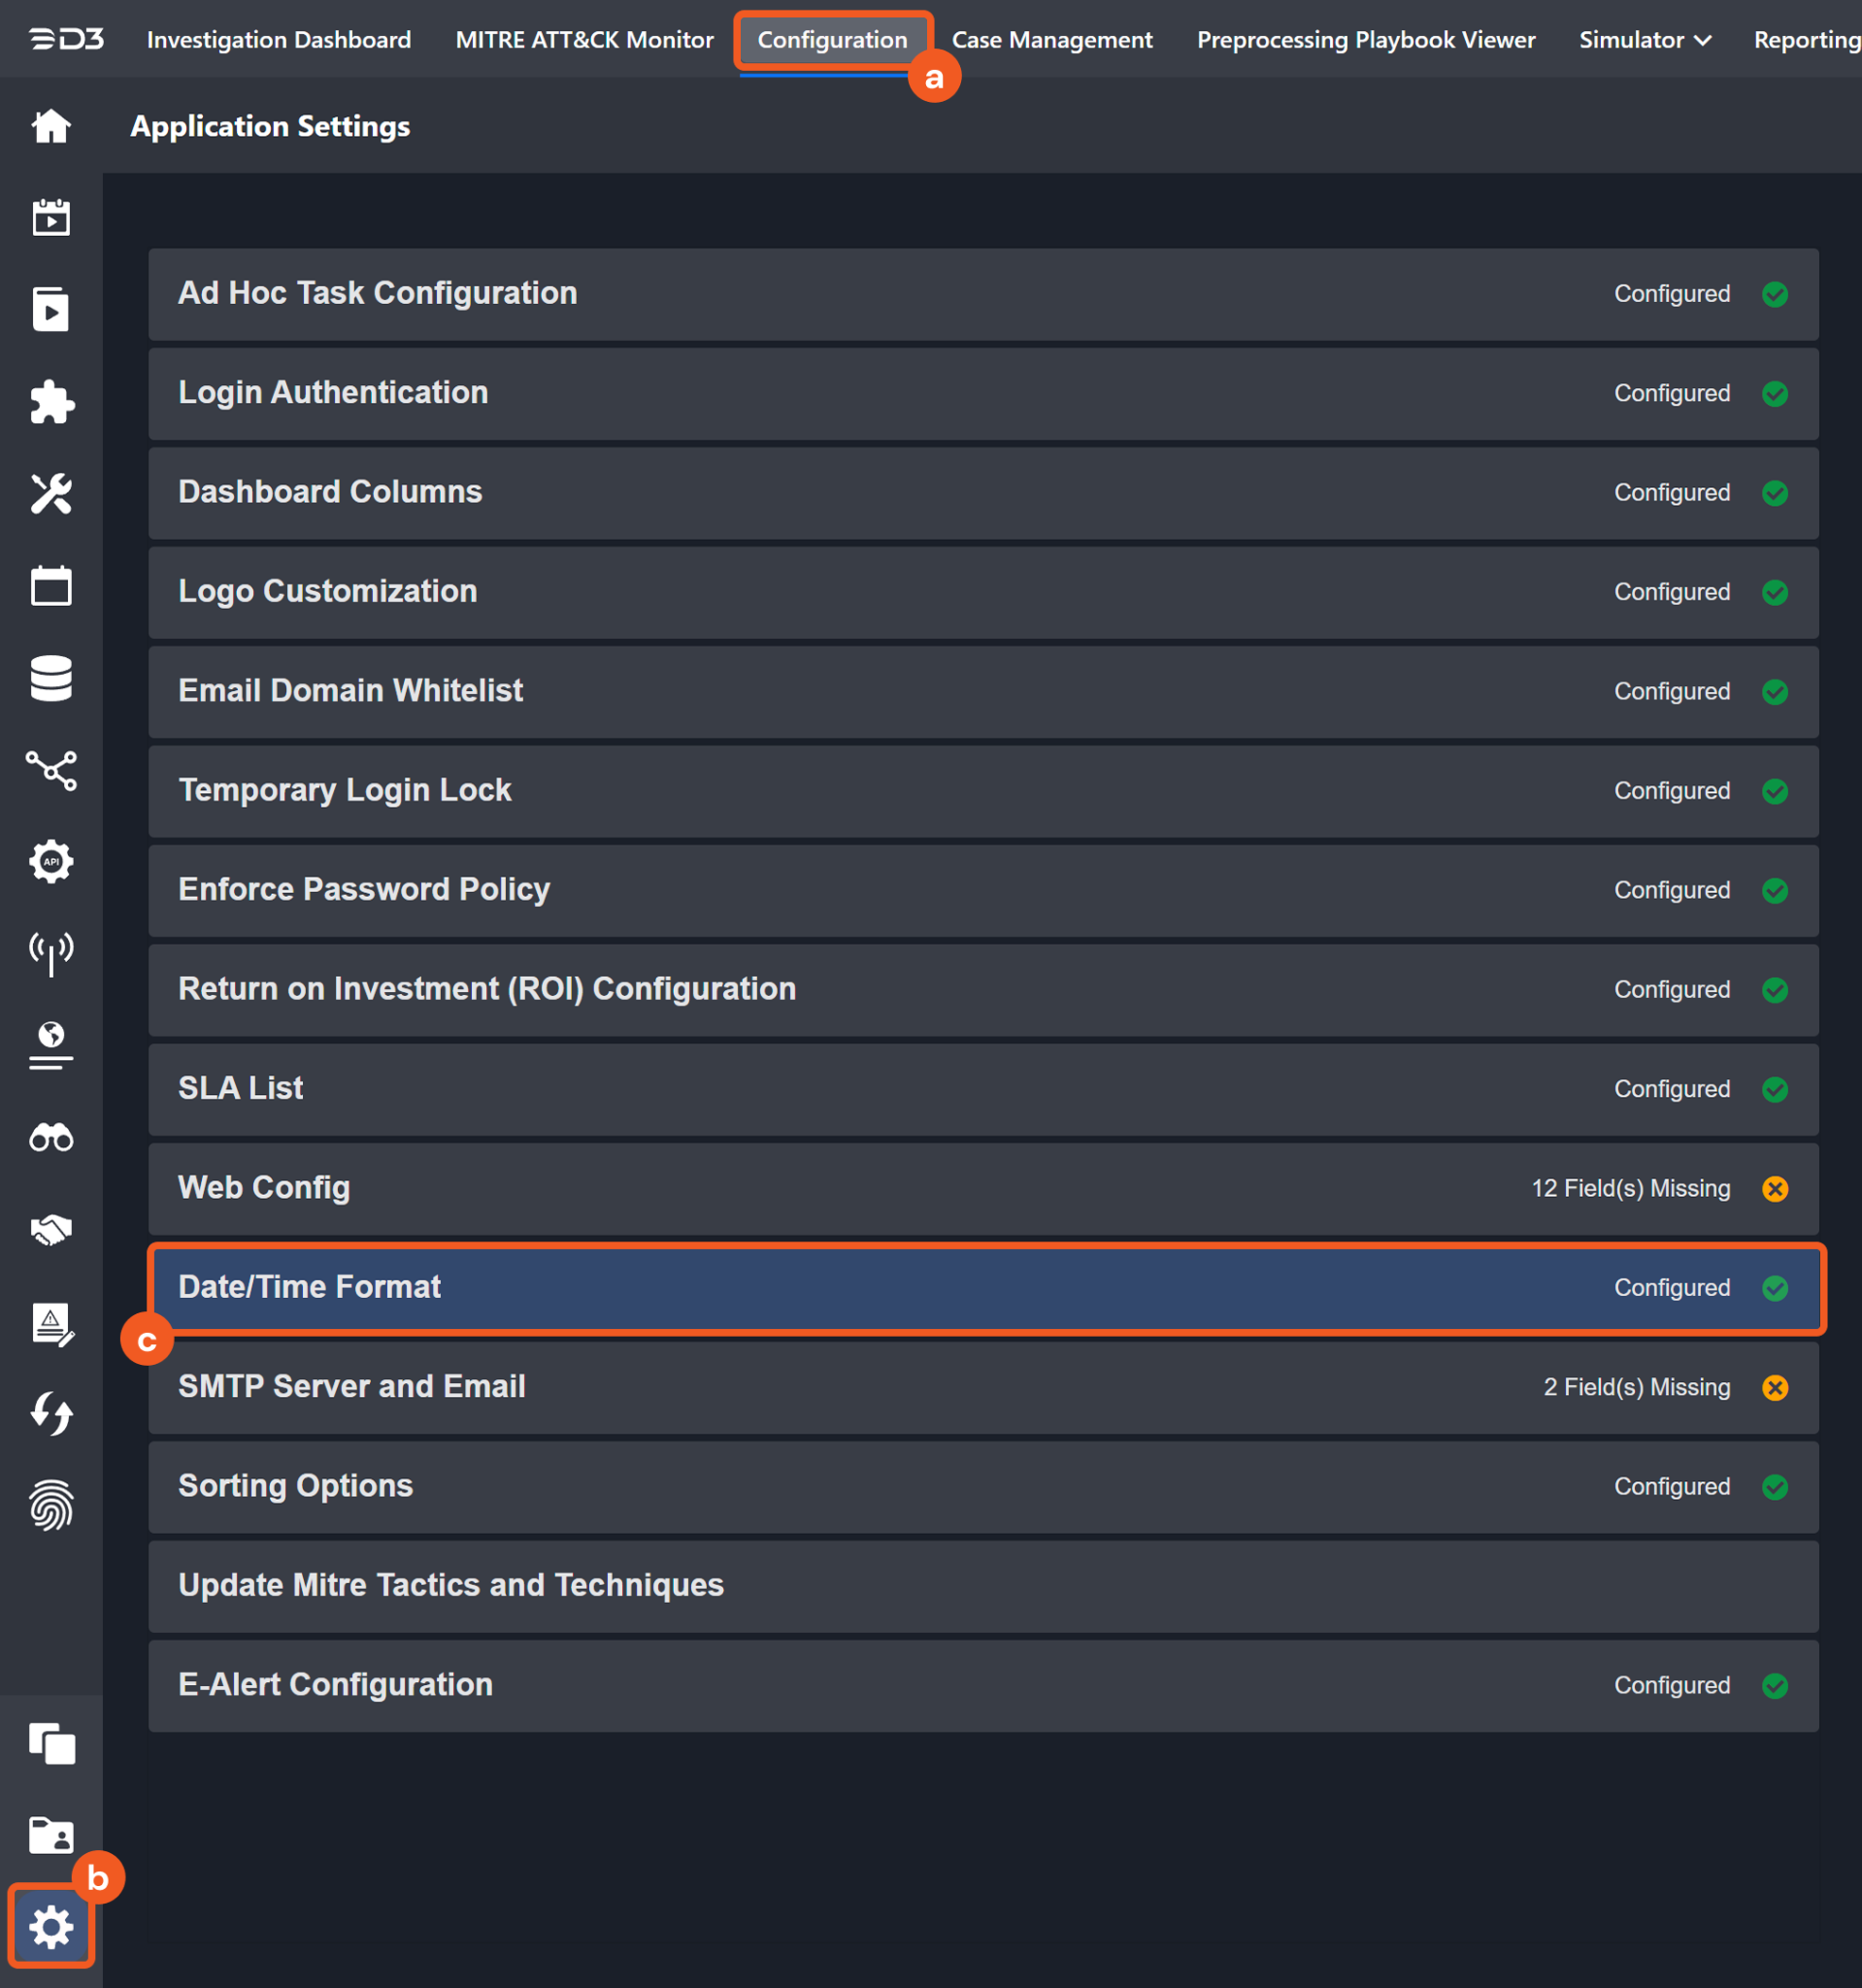
Choose the desired date and time format, then click on the Save button.
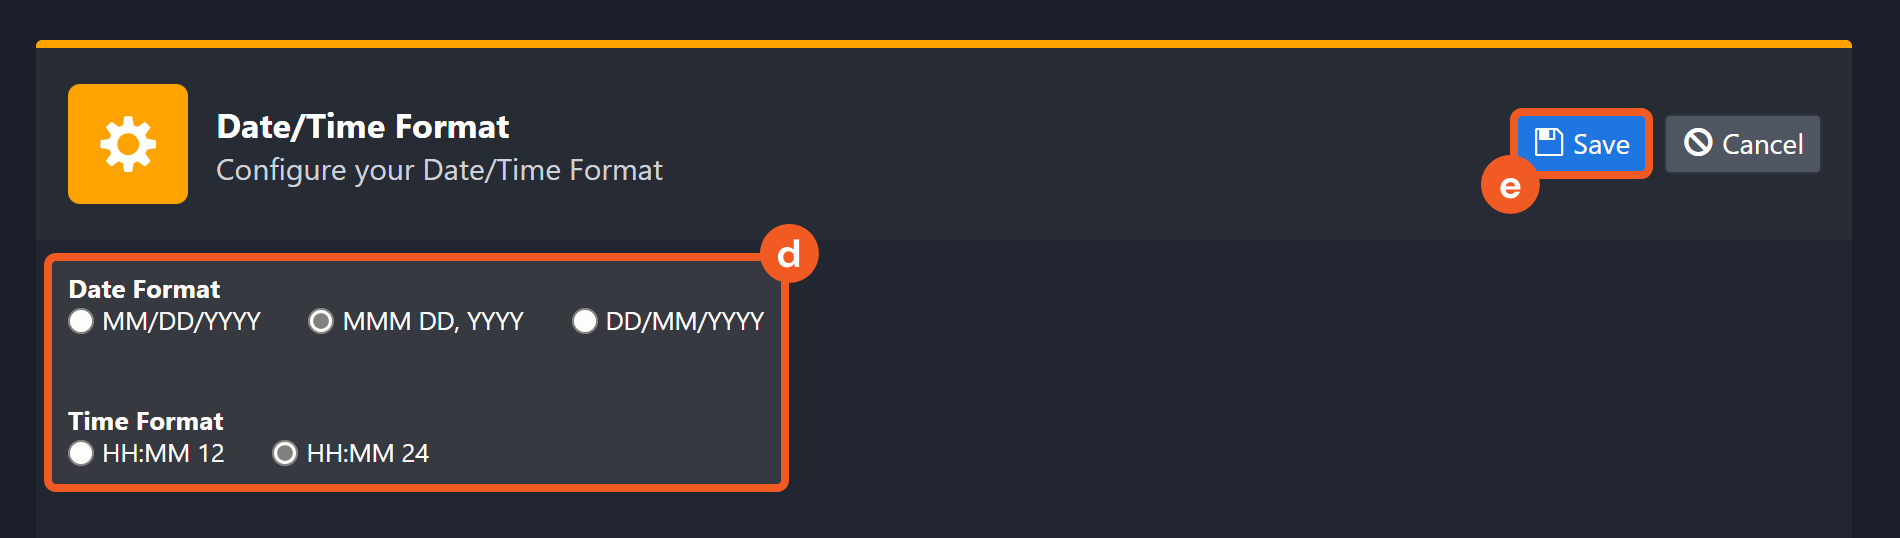
The selected time format will now be visible when configuring Date/Time command input parameters.
Fetch Event
Retrieves all events matching the criteria. Events are sorted in descending order based on the Query Time Type.
Input
Input Parameter | Required/Optional | Description | Example |
Start Time | Optional | The start of the time range to retrieve events in the server time zone based on the specified Query Time Type. | 2022-10-01 00:00 |
End Time | Optional | The end of the time range to retrieve events in the server time zone based on the specified Query Time Type. | 2022-10-01 00:00 |
Query Time Type | Optional | The time field used to filter retrieved events. Available options are:
By default, the value is First Seen Time. | Last Seen Time |
Number of Event(s) Fetched | Optional | The maximum number of recent events to retrieve. Valid values range from 1 to 1000. If the input value is outside of this range or unspecified, the value is set to 100. Use -1 to retrieve all matching events. | 10 |
Severities | Optional | Filters events by severity level. Available options are:
By default, all events are returned regardless of their severity level. | Critical and High |
Actions | Optional | Filters events by actions. Available options are:
By default, all events are returned regardless of their action. | Block and Simulation Block |
Classifications | Optional | Filters events by classification. Available values are:
By default, all events are returned regardless of their classification. |
JSON
|
Rule Name | Optional | Filters events by the short rule name that triggered them. | Fake Critical Program |
Additional Filters | Optional | Filters events using additional parameters not listed above. Parameters with duplicate names are omitted. |
JSON
|
Output
To view the sample output data for all commands, refer to this article.
Fetch Event Field Mapping
Fetch Event commands require event field mapping. Field mapping plays a key role for data normalization within the event pipeline. Field mapping converts the original data fields from the different providers to standardized D3 fields as defined by the D3 Model. Refer to Event and Incident Intake Field Mapping for details.
To add a custom field, click on the + Add Field button. Users can also remove built-in field mappings by clicking x. Note that two underscore characters will automatically prefix the defined Field Name as the System Name for a custom field mapping. Additionally, if an input Field Name contains any spaces, they will automatically be replaced with underscores for the corresponding System Name.
As a system integration, the FortiEDR integration has some pre-configured field mappings for default field mapping.
Default Event Source
The Default Event Source is the default set of field mappings that are applied when this fetch event command is executed. For out-of-the-box integrations, users will find a set of field mappings provided by the system. Default event source provides field mappings for common fields from the fetched data. The default event source has a "Main Event JSON Path" (i.e. $.Results) that is used to extract a batch of events from the response raw data. View the "Main Event JSON Path" by clicking on the Edit Event Source button.
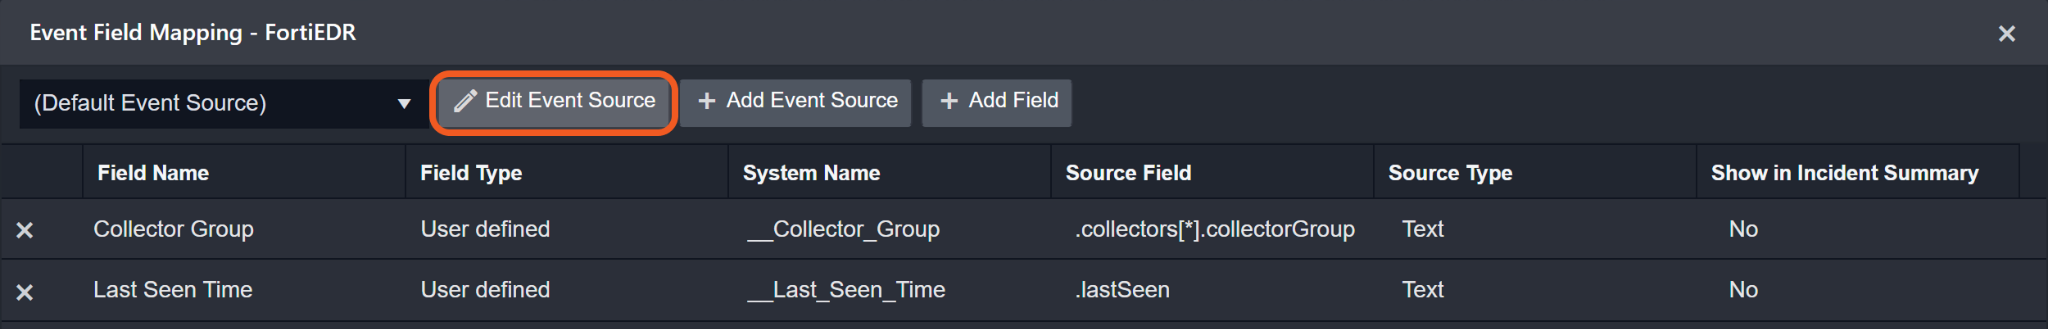
Main Event JSON Path: $.Results
The Main Event JSON Path determines the root path where the system starts parsing raw response data into D3 event data. The JSON path begins with $, representing the root element. The path is formed by appending a sequence of child elements to $, each separated by a dot (.). Square brackets with nested quotation marks ([‘...’]) should be used to separate child elements in JSON arrays.
For example, the root node of a JSON Path is Results. The child node denoting the Event Type field would be classification. Putting it together, the JSON Path expression to extract the Event Type is $.Results.classification.
The pre-configured field mappings are detailed below:
Field Name | Source Field |
Event code | .eventId |
Device | .collectors[*].device |
Start Time | .firstSeen |
Severity | .severity |
Device IP address | .collectors[*].ip |
Operating system | .collectors[*].operatingSystem |
Collector Group | .collectors[*].collectorGroup |
Process Name | .process |
Process file path | .processPath |
Process Type | .processType |
Last Seen Time | .lastSeen |
Destination | ['destination','destinations'] |
Action taken | .action |
Rule name | .rules |
Process Owner | .processOwner |
Event Type | .classification |
Username | .loggedUsers |
Error Handling
If the Return Data displays Failed, an Error tab will appear in the Test Result window.
The error tab contains the details responded from D3 SOAR or third-party API calls, including Failure Indicator, Status Code, and Message. This can help locate the root cause of a command failure.
Parts in Error | Description | Example |
Failure Indicator | Indicates the command failure that happened at a specific input and/or API call. | Fetch Event failed. |
Status Code | The response code issued by the third-party API server or the D3 SOAR system that can be used to locate the corresponding error category. For example, if the returned status code is 401, the selected connection is unauthorized to run the command. The user or system support would need to check the permission setting in the FortiEDR portal. Refer to the HTTP Status Code Registry for details. | Status Code: 401. |
Message | The raw data or captured key error message from the integration API server about the API request failure. | Message: Unauthorized. |
Error Sample Data Fetch Event failed. Status Code: 401. Message: Unauthorized. |
Isolate Hosts
Isolates specified collectors.
READER NOTE
Device Names is a required parameter to run this command.
Run the Fetch Event command to obtain the Device Names. Device Names can be found in the raw data at the path $.Results[*].collectors[*].device.
Input
Input Parameter | Required/Optional | Description | Example |
Organization | Optional | The name of the organization in which the collector is located in multi-tenant environments. The specified value must be an exact match. | Organization-1 |
Device Names | Required | The names of collectors to isolate. Device Names can be obtained using the Fetch Event command. |
JSON
|
Output
To view the sample output data for all commands, refer to this article.
Error Handling
If the Return Data displays Failed, an Error tab will appear in the Test Result window.
The error tab contains the details responded from D3 SOAR or third-party API calls, including Failure Indicator, Status Code, and Message. This can help locate the root cause of a command failure.
Parts in Error | Description | Example |
Failure Indicator | Indicates the command failure that happened at a specific input and/or API call. | Isolate Hosts failed. |
Status Code | The response code issued by the third-party API server or the D3 SOAR system that can be used to locate the corresponding error category. For example, if the returned status code is 401, the selected connection is unauthorized to run the command. The user or system support would need to check the permission setting in the FortiEDR portal. Refer to the HTTP Status Code Registry for details. | Status Code: 401. |
Message | The raw data or captured key error message from the integration API server about the API request failure. | Message: Unauthorized. |
Error Sample Data Isolate Hosts failed. Status Code: 401. Message: Unauthorized. |
List Collector Groups
Returns a list of collector groups.
Input
Input Parameter | Required/Optional | Description | Example |
Organization | Optional | Filters collector groups by organization name in multi-tenant environments. The specified value must be an exact match. | Organization-1 |
Output
To view the sample output data for all commands, refer to this article.
Error Handling
If the Return Data displays Failed, an Error tab will appear in the Test Result window.
The error tab contains the details responded from D3 SOAR or third-party API calls, including Failure Indicator, Status Code, and Message. This can help locate the root cause of a command failure.
Parts in Error | Description | Example |
Failure Indicator | Indicates the command failure that happened at a specific input and/or API call. | List Collector Groups failed. |
Status Code | The response code issued by the third-party API server or the D3 SOAR system that can be used to locate the corresponding error category. For example, if the returned status code is 401, the selected connection is unauthorized to run the command. The user or system support would need to check the permission setting in the FortiEDR portal. Refer to the HTTP Status Code Registry for details. | Status Code: 401. |
Message | The raw data or captured key error message from the integration API server about the API request failure. | Message: Unauthorized. |
Error Sample Data List Collector Groups failed. Status Code: 401. Message: Unauthorized. |
List Exceptions
Returns a list of exceptions based on the specified search conditions. This command is supported from version 2.7.3 and above.
Input
Input Parameter | Required/Optional | Description | Example |
Organization | Optional | Filters exceptions by organization name in multi-tenant environments. The specified value must be an exact match. | Organization-1 |
Rule Names | Optional | Filters exceptions by rule names. |
JSON
|
Process | Optional | Filters exceptions by process. | EvilProcessTests.exe |
Path | Optional | Filters exceptions by path. | \Users\root\Desktop\malwareSimulation |
Comment | Optional | Filters exceptions by attached comment. | Test Comment |
Updated After | Optional | Filters exceptions last updated after the specified time in the local server time zone. | 2022-10-01 00:00 |
Updated Before | Optional | Filters exceptions last updated before the specified time in the local server time zone. | 2022-10-02 00:00 |
Output
To view the sample output data for all commands, refer to this article.
Error Handling
If the Return Data displays Failed, an Error tab will appear in the Test Result window.
The error tab contains the details responded from D3 SOAR or third-party API calls, including Failure Indicator, Status Code, and Message. This can help locate the root cause of a command failure.
Parts in Error | Description | Example |
Failure Indicator | Indicates the command failure that happened at a specific input and/or API call. | List Exceptions failed. |
Status Code | The response code issued by the third-party API server or the D3 SOAR system that can be used to locate the corresponding error category. For example, if the returned status code is 401, the selected connection is unauthorized to run the command. The user or system support would need to check the permission setting in the FortiEDR portal. Refer to the HTTP Status Code Registry for details. | Status Code: 401. |
Message | The raw data or captured key error message from the integration API server about the API request failure. | Message: Unauthorized. |
Error Sample Data List Exceptions failed. Status Code: 401. Message: Unauthorized. |
List Policies
Returns a list of communication control policies based on the specified search conditions.
Input
Input Parameter | Required/Optional | Description | Example |
Organization | Optional | Filters policies by organization name in multi-tenant environments. The specified value must be an exact match. | Organization-1 |
Policy Names | Optional | Filters policies by policy names. |
JSON
|
Rule Names | Optional | Filters policies by rule names. |
JSON
|
Decision | Optional | Filters policies by decision. Available options are:
By default, all policies are returned regardless of their decision. | Deny |
State | Optional | Filters policies by rule state. Available options are:
By default, all policies are returned regardless of their rule state. | Enabled |
Output
To view the sample output data for all commands, refer to this article.
Error Handling
If the Return Data displays Failed, an Error tab will appear in the Test Result window.
The error tab contains the details responded from D3 SOAR or third-party API calls, including Failure Indicator, Status Code, and Message. This can help locate the root cause of a command failure.
Parts in Error | Description | Example |
Failure Indicator | Indicates the command failure that happened at a specific input and/or API call. | List Policies failed. |
Status Code | The response code issued by the third-party API server or the D3 SOAR system that can be used to locate the corresponding error category. For example, if the returned status code is 401, the selected connection is unauthorized to run the command. The user or system support would need to check the permission setting in the FortiEDR portal. Refer to the HTTP Status Code Registry for details. | Status Code: 401. |
Message | The raw data or captured key error message from the integration API server about the API request failure. | Message: Unauthorized. |
Error Sample Data List Policies failed. Status Code: 401. Message: Unauthorized. |
Search Threat Hunting Data
Searches for Indicators of Compromise (IOCs) and malware within activity data collected and stored on the Repository server. Searches are based on various attributes of files, registry keys or values, networks, processes, event logs, and activity event types. This command is supported from version 5.0 and above.
Input
Input Parameter | Required/Optional | Description | Example |
Organization | Optional | Filters results by organization name in multi-tenant environments. | Organization-1 |
Category | Optional | Filters results by category name. Available options are:
By default, all results are returned regardless of their Category. | File |
Device Names | Optional | Filters results by device names where the events occurred. |
JSON
|
Time Range | Optional | Filters results by the time period during which the events occurred. Available options are:
If set to Custom, Start Time and End Time are applied. By default, the value is Last Hour. | Custom |
Start Time | Optional | Filters results by the earliest creation time of events in the server time zone. This is applicable only when the Time Range is set to Custom. By default, the value is 1 hour before the End Time. | 2022-10-01 00:00 |
End Time | Optional | Filters results by the latest creation time of events in the server time zone. This is applicable only when the Time Range is set to Custom. By default, the value is the current time. | 2022-10-01 00:00 |
Filters | Optional | Filters results using additional filters not included in the predefined options. |
JSON
|
Query | Optional | Filters results using a query constructed with Lucene syntax. | Type:(File Create) AND Source.Process.Name:(avp.exe) |
Limit | Optional | The maximum number of activity events to retrieve. Valid values range from 1 to 100. If the input value is outside of this range or unspecified, the value is set to 100. Use -1 to retrieve all matching results. | 10 |
Output
To view the sample output data for all commands, refer to this article.
Error Handling
If the Return Data displays Failed, an Error tab will appear in the Test Result window.
The error tab contains the details responded from D3 SOAR or third-party API calls, including Failure Indicator, Status Code, and Message. This can help locate the root cause of a command failure.
Parts in Error | Description | Example |
Failure Indicator | Indicates the command failure that happened at a specific input and/or API call. | Search Threat Hunting Data failed. |
Status Code | The response code issued by the third-party API server or the D3 SOAR system that can be used to locate the corresponding error category. For example, if the returned status code is 401, the selected connection is unauthorized to run the command. The user or system support would need to check the permission setting in the FortiEDR portal. Refer to the HTTP Status Code Registry for details. | Status Code: 401. |
Message | The raw data or captured key error message from the integration API server about the API request failure. | Message: Unauthorized. |
Error Sample Data Search Threat Hunting Data failed. Status Code: 401. Message: Unauthorized. |
Unisolate Hosts
Removes specified collectors from isolation.
READER NOTE
Device Names is a required parameter to run this command.
Run the Fetch Event command to obtain the Device Names. Device Names can be found in the raw data at the path $.Results[*].collectors[*].device.
Input
Input Parameter | Required/Optional | Description | Example |
Organization | Optional | The name of the organization in which the collectors are located in multi-tenant environments. The specified value must be an exact match. | Organization-1 |
Device Names | Required | The names of collectors to remove from isolation. Device Names can be obtained using the Fetch Event command. |
JSON
|
Output
To view the sample output data for all commands, refer to this article.
Error Handling
If the Return Data displays Failed, an Error tab will appear in the Test Result window.
The error tab contains the details responded from D3 SOAR or third-party API calls, including Failure Indicator, Status Code, and Message. This can help locate the root cause of a command failure.
Parts in Error | Description | Example |
Failure Indicator | Indicates the command failure that happened at a specific input and/or API call. | Unisolate Hosts failed. |
Status Code | The response code issued by the third-party API server or the D3 SOAR system that can be used to locate the corresponding error category. For example, if the returned status code is 401, the selected connection is unauthorized to run the command. The user or system support would need to check the permission setting in the FortiEDR portal. Refer to the HTTP Status Code Registry for details. | Status Code: 401. |
Message | The raw data or captured key error message from the integration API server about the API request failure. | Message: Unauthorized. |
Error Sample Data Unisolate Hosts failed. Status Code: 401. Message: Unauthorized. |
Test Connection
Allows users to perform a health check on an integration connection. Users can schedule a periodic health check by selecting Connection Health Check when editing an integration connection.
Input
N/A
Output
Output Type | Description | Return Data Type |
Return Data | Indicates one of the possible command execution states: Successful or Failed. The Failed state can be triggered by any of the following errors:
More details about an error can be viewed in the Error tab. | String |
Error Handling
If the Return Data displays Failed, an Error tab will appear in the Test Result window.
The error tab contains the details responded from D3 SOAR or third-party API calls, including Failure Indicator, Status Code, and Message. This can help locate the root cause of a command failure.
Parts in Error | Description | Example |
Failure Indicator | Indicates the command failure that happened at a specific input and/or API call. | Test Connection failed. Failed to check the connector. |
Status Code | The response code issued by the third-party API server or the D3 SOAR system that can be used to locate the corresponding error category. For example, if the returned status code is 401, the selected connection is unauthorized to run the command. The user or system support would need to check the permission setting in the FortiEDR portal. Refer to the HTTP Status Code Registry for details. | Status Code: 401. |
Message | The raw data or captured key error message from the integration API server about the API request failure. | Message: Unauthorized. |
Error Sample Data Test Connection failed. Failed to check the connector. Status Code: 401. Message: Unauthorized. |