Skip table of contents

Exabeam V2

(LAST UPDATED: 10/08/2024)

Overview

Exabeam is a user and entity behavior analytics (UEBA) solution that uses innovative analytics technology, such as machine learning and deep learning, to detect threats and anomalies on a corporate network. The analytics platform allows security analysts access to the most relevant threat intelligence and other contextual data and helps them prioritize remediation tasks. D3's integration with Exabeam Advanced Analytics' latest REST API enables event ingestion, user management, and asset retrieval.

D3 SOAR is providing REST operations to function with Exabeam.

Exabeam is available for use in:

D3 SOAR

V15.3+

Category

SIEM & XDR

Deployment Options

Option II, Option IV

Connection

To connect to Exabeam from D3 SOAR, please follow this part to collect the required information below:

Parameter

Description

Example

Server URL

The server URL of the Exabeam environment.

https://sample.exabeam.com

Authentication Type

The authentication method for the connection. If Basic Authentication (Username & Password) is selected, then the Username and Password parameters are required.

Cluster Authentication Token (API Token)

Basic Authentication (Username & Password)

Username

The Exabeam username used for basic authentication.

*****

Password

The Exabeam password used for basic authentication.

*****

Cluster Authentication Token (API Token)

API Token

The API token used to authenticate the connection.

*****

READER NOTE

Exabeam no longer supports API authentication via basic authentication (using username and password). D3 SOAR still retains the basic authentication option for on-premise users that may still use it. Please use the Cluster Authentication Token authentication type to build any new integration connections with Exabeam. For more information, see Exambeam's notice regarding their API support.

Configuring Exabeam to Work with D3 SOAR

  1. Go to Settings > Core > Admin Operations > Cluster Authentication Token.

    Group 7 (2).png

    The Cluster Authorization Token page appears.
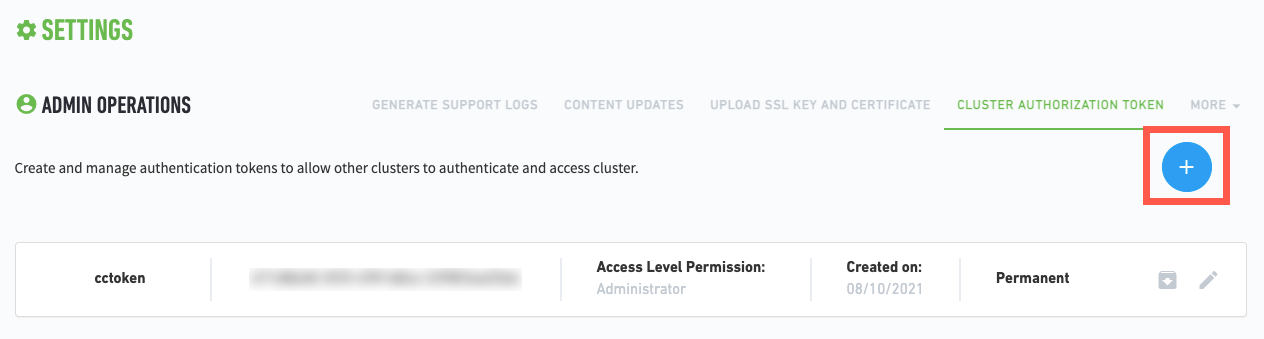
    uuid-c7570c05-9853-22e2-0173-6e375cb3c4fc 1.png
  2. Click on the A blue circle with a white plus sign. button.

    The Setup Token dialog box appears.

    uuid-acea1d66-ed40-5703-cc5e-d9f210419a62 1.png
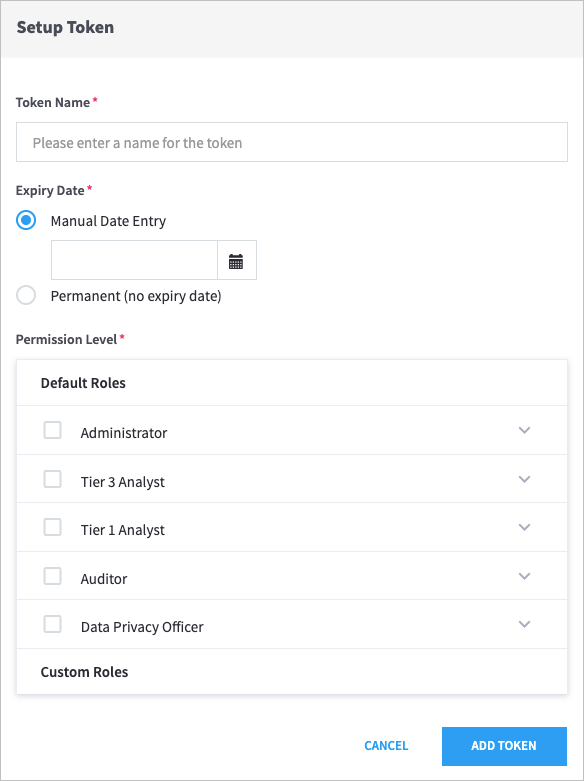
  3. Enter a Token Name, and then select an Expiry Date.

READER NOTE

Token names can contain only letters, numbers, and spaces.

  1. Select the Default Roles for the token.

  2. Click on the Add Token button.

  3. Use this generated file to allow your API(s) to authenticate by token. Ensure that your API uses ExaAuthToken in its requests. For curl clients, the request structure resembles the following:

    POWERSHELL
    curl -H "ExaAuthToken:<generated_token>" https://<external_host>:<api_port>/<api_request_path>

Refer to the Exabeam Cluster Operations documentation for detailed information.

Configuring D3 SOAR to Work with Exabeam

  1. Log in to D3 SOAR.

  2. Find the Exabeam integration.

    Group 2 (1).png
    1. Navigate to Configuration on the top header menu.

    2. Click on the Integration icon on the left sidebar.

    3. Type Exabeam in the search box to find the integration, then click it to select it.

    4. Click + New Connection, on the right side of the Connections section. A new connection window will appear.

  3. Configure the following fields to create a connection to Exabeam.

    Group 8.png
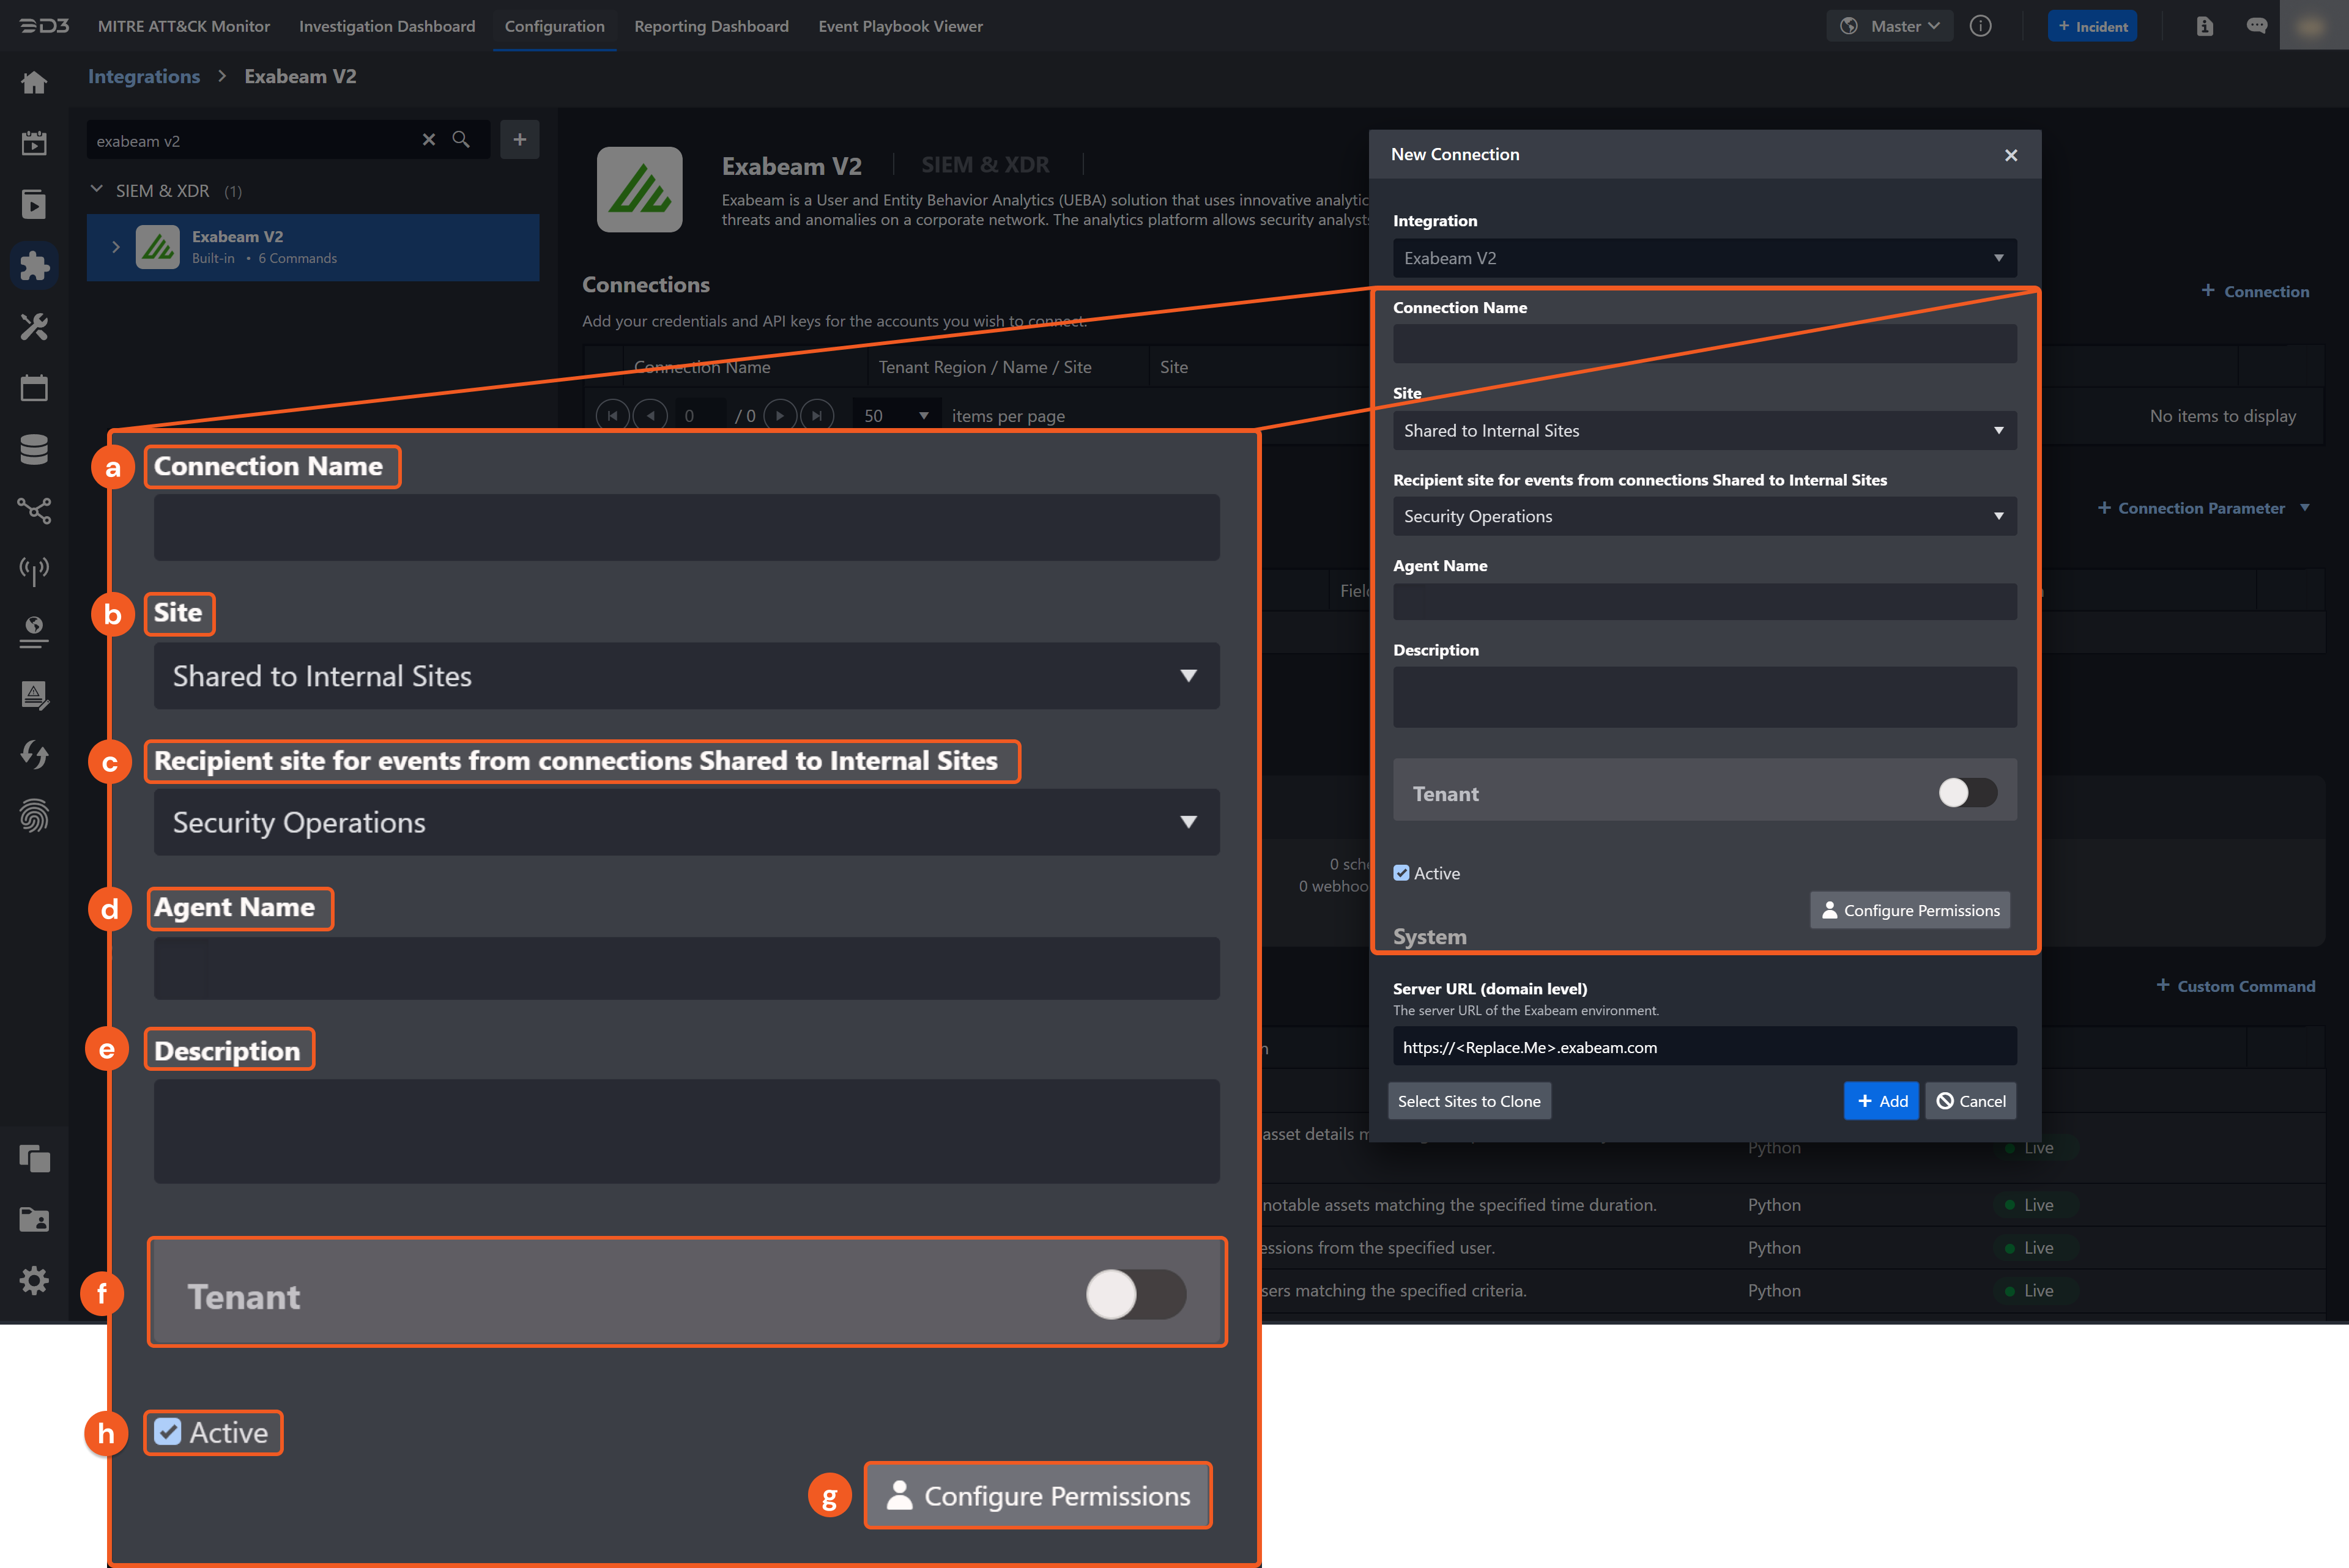
    1. Connection Name: The desired name for the connection.

    2. Site: Specifies the site to use the integration connection. Use the drop-down menu to select the site. The Share to Internal Sites option enables all sites defined as internal sites to use the connection. Selecting a specific site will only enable that site to use the connection.

    3. Recipient site for events from connections Shared to Internal Sites: This field appears if you selected Share to Internal Sites for Site to let you select the internal site to deploy the integration connection.

    4. Agent Name (Optional): Specifies the proxy agent required to build the connection. Use the dropdown menu to select the proxy agent from a list of previously configured proxy agents.

    5. Description (Optional): Add your desired description for the connection.

    6. Tenant (Optional): When configuring the connection from a master tenant site, you have the option to choose the specific tenant sites you want to share the connection with. Once you enable this setting, you can filter and select the desired tenant sites from the dropdowns to share the connection.

    7. Configure User Permissions: Defines which users have access to the connection.

    8. Active: Check the tick box to ensure the connection is available for use.

      Group 6.png

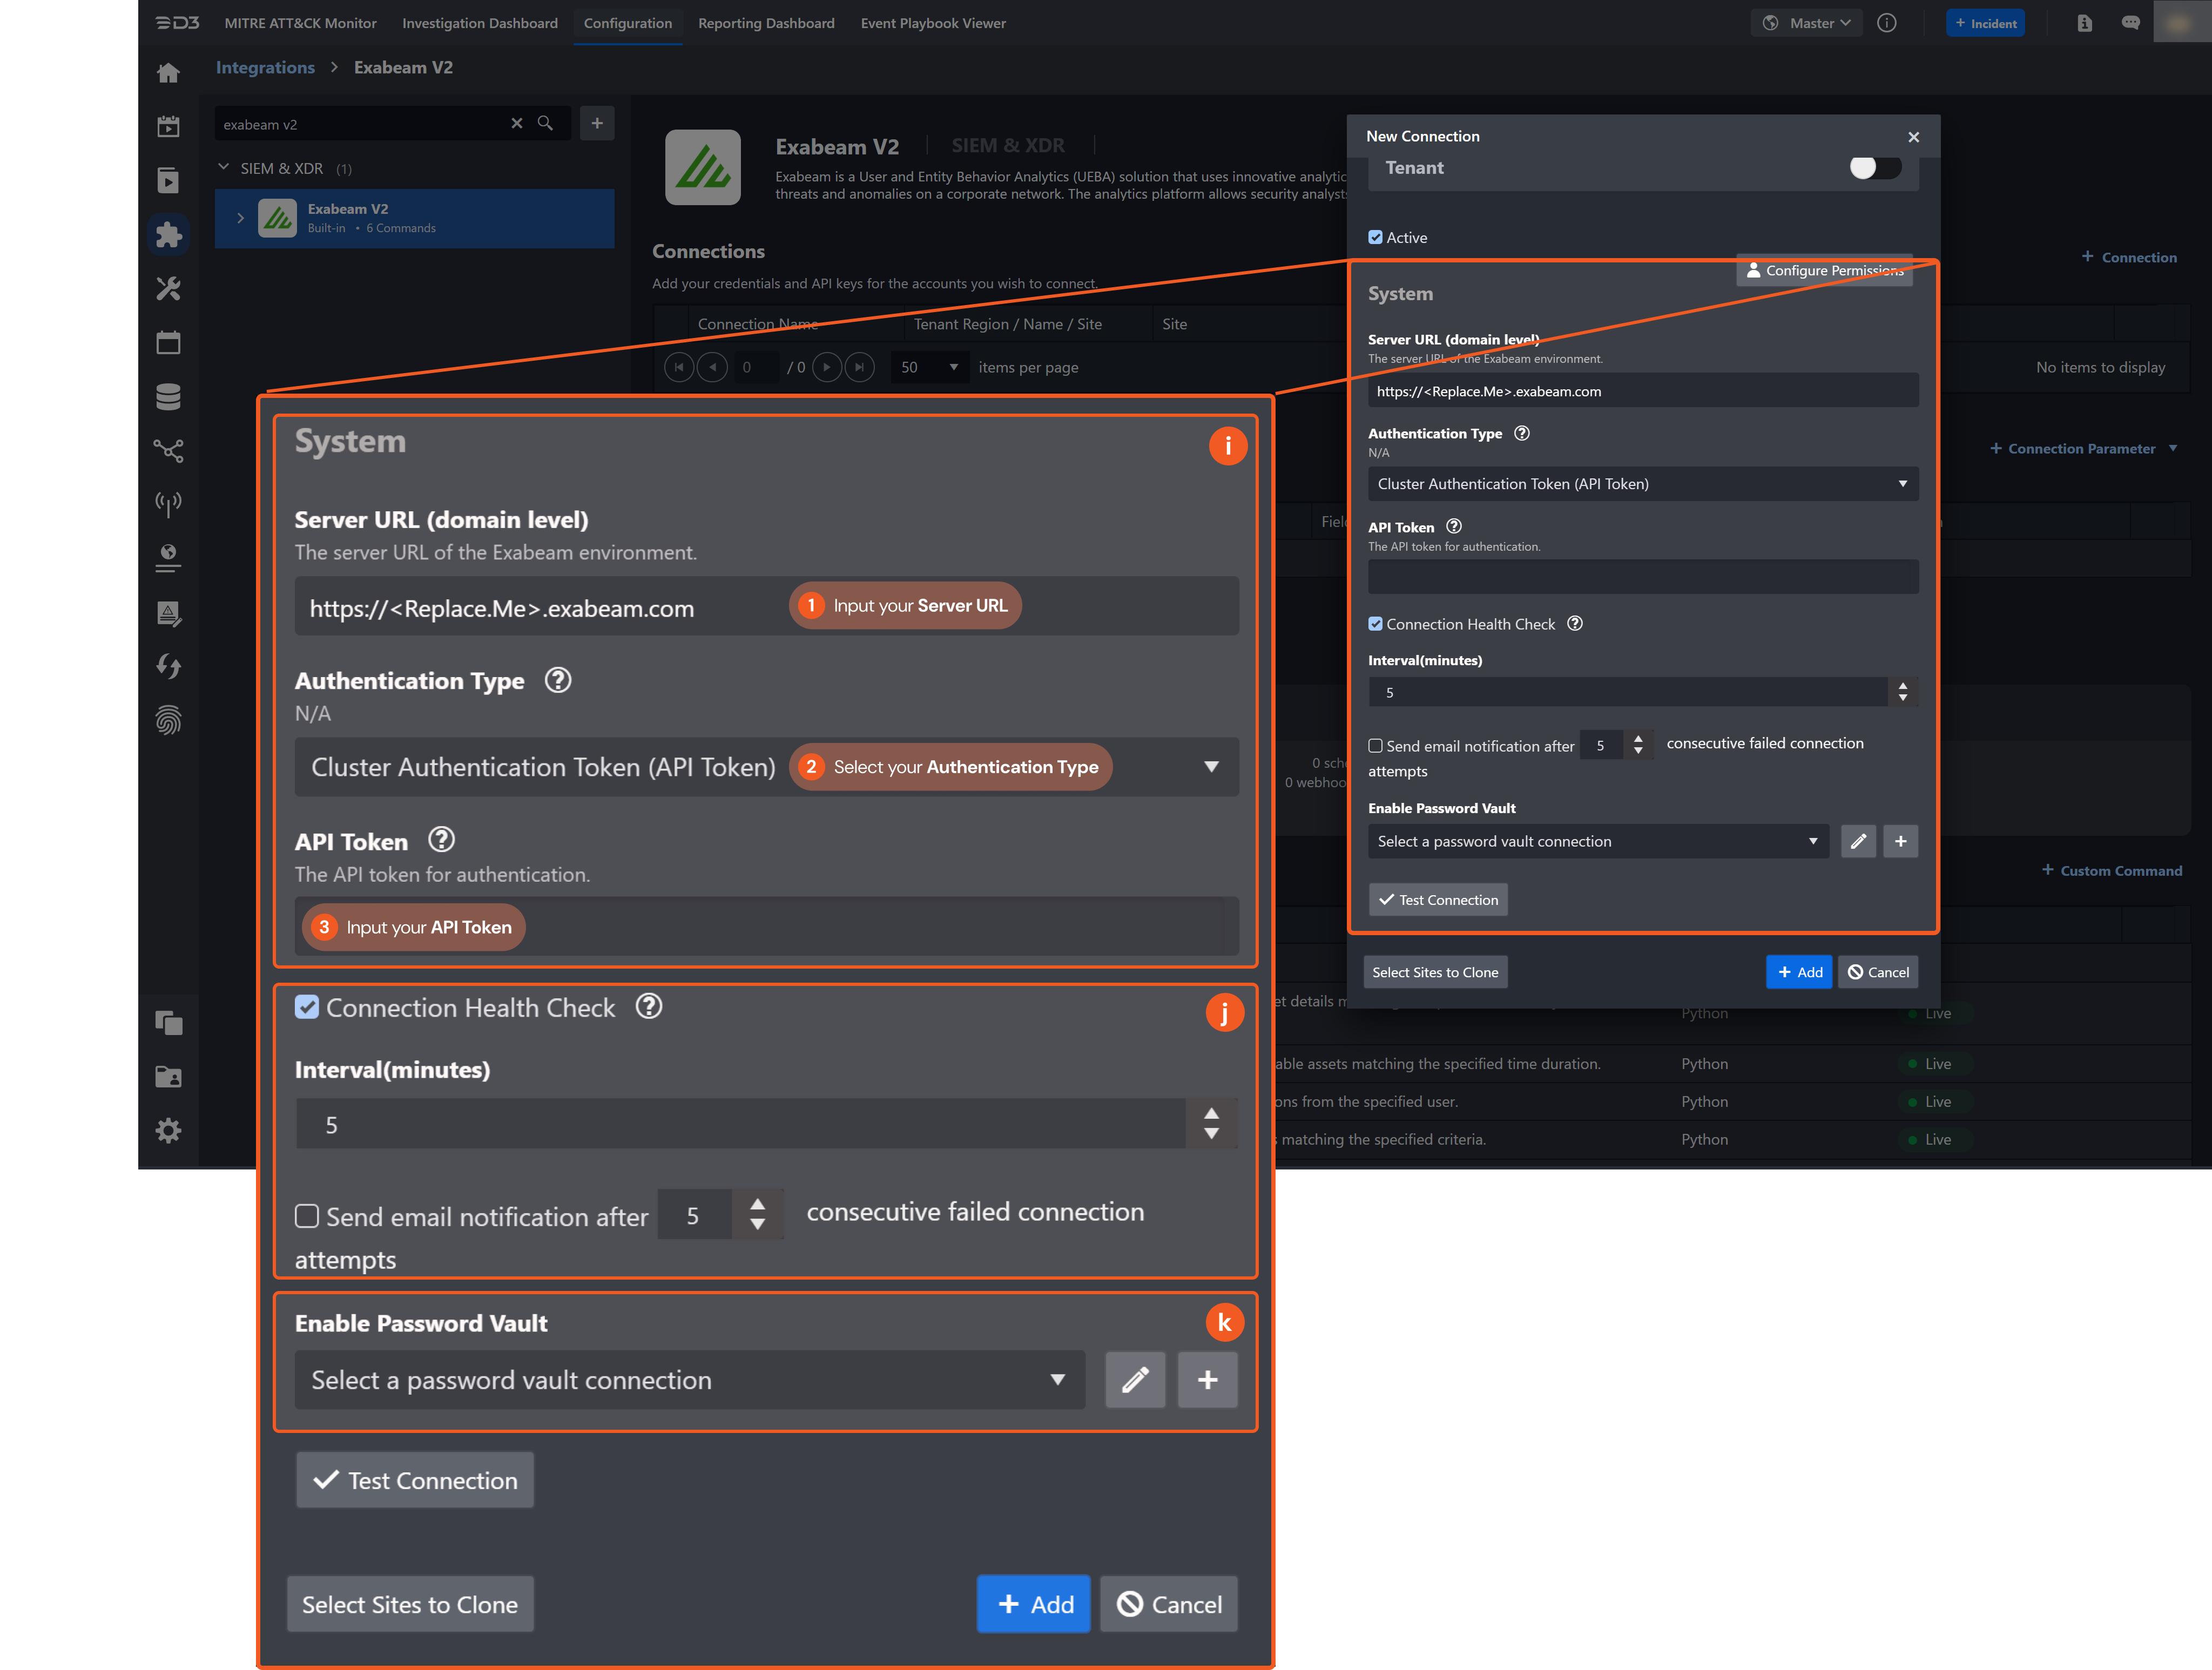
    9. System: This section contains the parameters defined specifically for the integration. These parameters must be configured to create the integration connection.
      1. Input your Server URL.
      2. Select your Authentication Type. Select the Cluster Authentication Token (API Token) for Authentication Type.
      3. Input your API Token. See Configuring Exabeam to Work with D3 SOAR.

    10. Connection Health Check: Updates the connection status you have created. A connection health check is done by scheduling the Test Connection command of this integration. This can only be done when the connection is active.

      To set up a connection health check, check the Connection Health Check tickbox. You can customize the interval (minutes) for scheduling the health check. An email notification can be set up after a specified number of failed connection attempts.

    11. Enable Password Vault: An optional feature that allows users to take the stored credentials from their own password vault. Please refer to the password vault connection guide if needed.

  4. Test the connection.

    1. Click Test Connection to verify the account credentials and network connection. If the Test Connection Passed alert window appears, the test connection is successful. You will see Passed with a green checkmark appear beside the Test Connection button. If the test connection fails, please check your connection parameters and try again.

    2. Click OK to close the alert window.

    3. Click + Add to create and add the configured connection.

Commands

Exabeam includes the following executable commands for users to set up schedules or create playbook workflows. With the Test Command, you can execute these commands independently for playbook troubleshooting.

Integration API Note

For more information about the Exabeam API, please refer to the Exabeam API reference.

Note for Time-related parameters

The input format of time-related parameters may vary based on your account settings. As a result, the sample data provided in our commands is different from what you see. To set your preferred time format, follow these steps:

  1. Navigate to Configuration Application Settings. Select Date/Time Format.

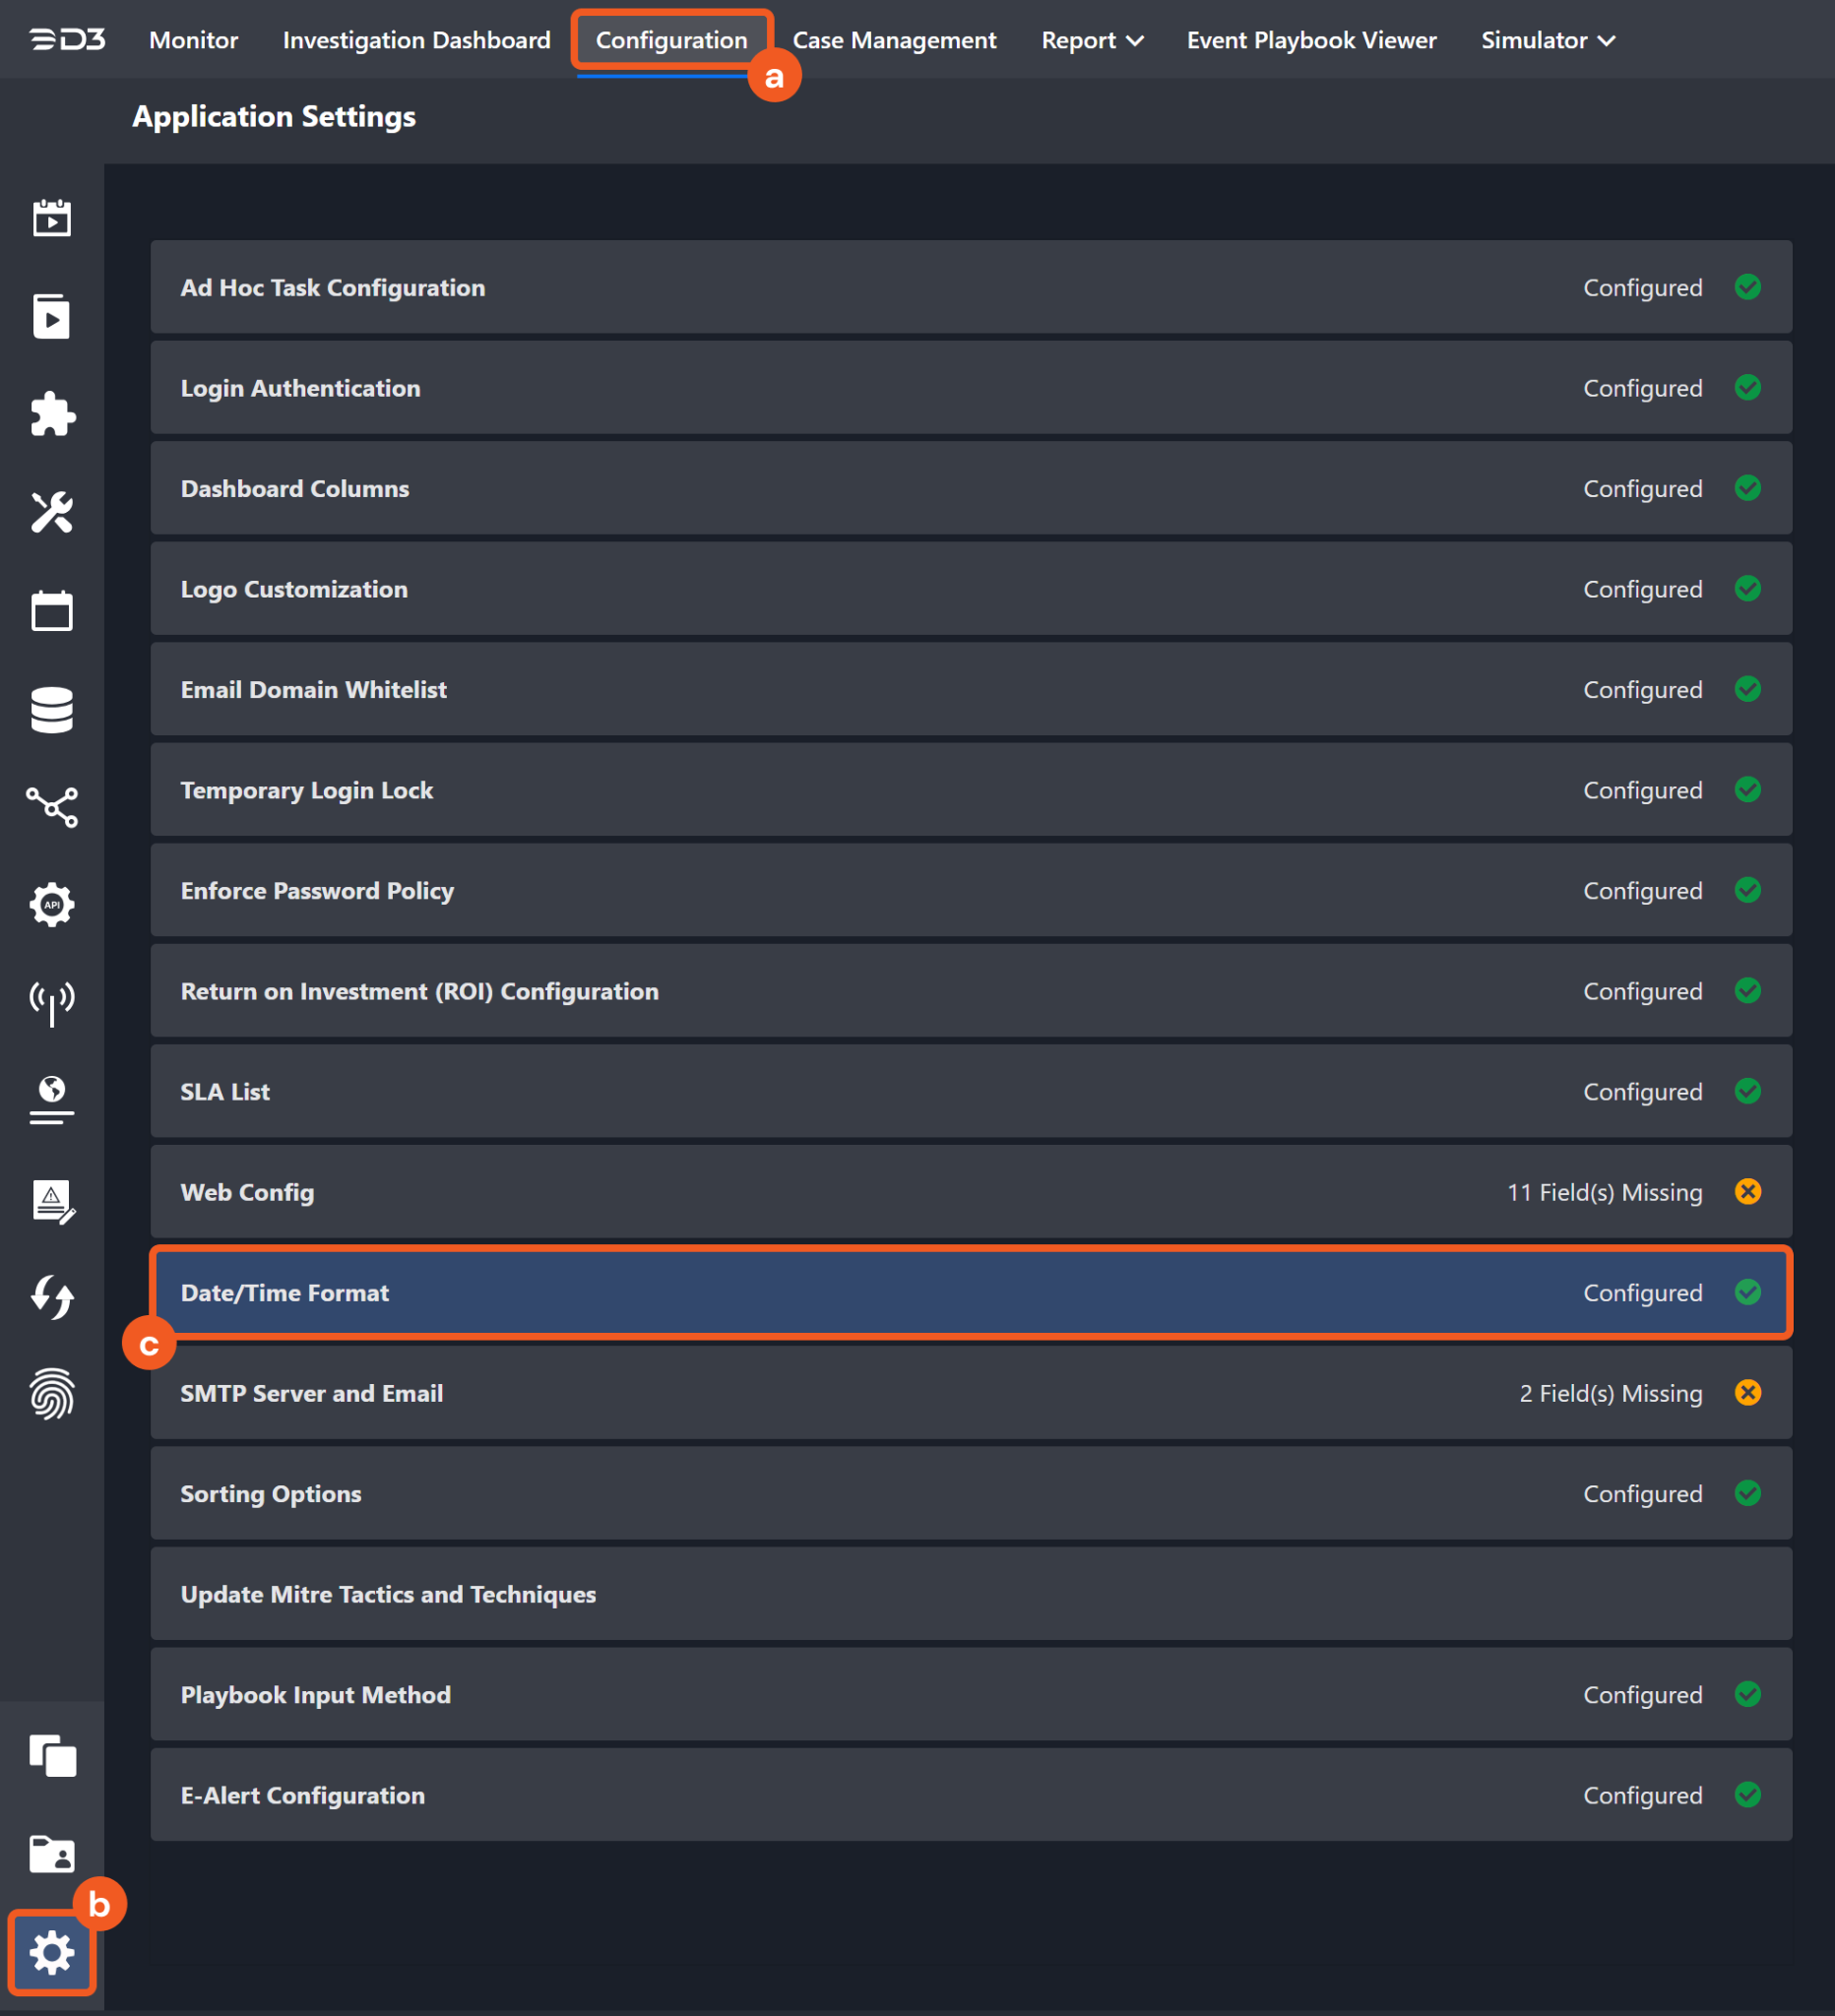
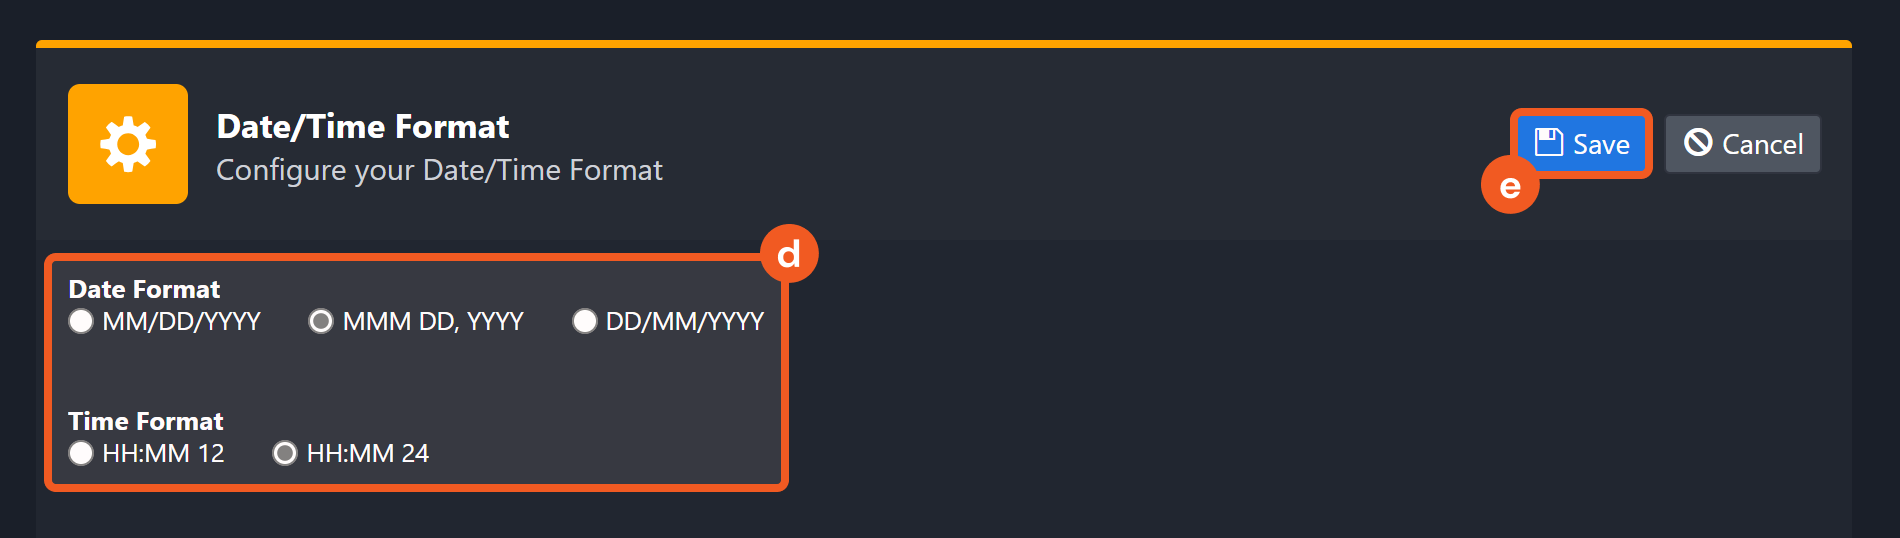
  2. Choose your desired date and time format, then click on the Save button.

After that, you will be able to view your preferred time format when configuring the DateTime input parameters for commands.

Fetch Event

Retrieves incidents based on the search condition. Incidents are sorted by created time in descending order.

READER NOTE

Use Basic Authentication (username/password) in connection with this command.

Input

Input Parameter

Required/Optional

Description

Example

Start Time

Required

The start time of the time range (in UTC) to fetch incidents and events.

04/01/2022 08:00 PM

End Time

Required

The end time of the time range (in UTC) to fetch incidents and events.

05/01/2022 08:00 PM

Number of Event(s) Fetched

Optional

The maximum number of incidents to return. By default, all incidents matching the search criteria will be returned.

10

Statuses

Optional

The statuses of the incidents that will be returned. Possible values include a combination of the following statuses: "closed", "closedFalsePositive", "inprogress", "pending" and "resolved."

JSON
[ "new", "closed", "closedFalsePositive", "inprogress",  "pending",  "resolved"] 

Additional Query Map

Optional

Additional query map fields to add to the search condition.

JSON
{ "priority": [ "medium" ] } 

Tolerance Scope (minute)

Optional

The tolerance scope (in minutes) of the query to fetch events between Start Time and End Time to prevent the loss of events. Events will be fetched between {Start Time - Tolerance Scope, End Time}. By default, the Tolerance Scope is 10.

10

Output

Return Data

Indicates one of the possible command execution states: Successful, Successful with No Event Data, or Failed.

The Failed state can be triggered by any of the following errors:

  • A connection issue with the integration

  • The API returned an error message

  • No response from the API

You can view more details about an error in the Error tab.

Return Data can be passed down directly to a subsequent command or used to create conditional tasks in playbooks.

SAMPLE DATA

JSON
Successful
Raw Data

The primary response data from the API request. For check reputation commands, D3-defined risk levels and risk level names are also included.

SAMPLE DATA

JSON
[
    {
        "incidentId": "*****",
        "name": "lokrer: Notable AA Session",
        "fields": {
            "uebaLocationCount": 2,
            "updatedAt": *****,
            "employeeManagerEmail": "*****",
            "priority": "medium",
            "source": "Exabeam AA",
            "uebaRiskReasons": "Risk transfer from past sessions.\nExabeam has detected some type of login or authentication from an IP that has been blacklisted.",
            "queue": 1,
            "uebaSequenceType": "session",
            "fullName": "Ram Lokre",
            "uebaRiskReasonsCount": 4,
            "uebaEventCount": 24,
            "userTitle": "qa technical team lead",
            "sourceUrl": "*****",
            "startedDate": 1681881960447,
            "uebaSequenceId": "*****",
            "employeePersonalEmail": "*****",
            "uebaUserId": "*****",
            "incidentType": [
                "malware",
                "ueba",
                "generic"
            ],
            "uebaSessionRiskScore": 170,
            "status": "new",
            "createdAt": *****,
            "createdBy": "admin",
            "uebaSessionLink": "*****",
            "timeToResolution": 11689324,
            "uebaAssetCount": 10,
            "owner": "unassigned",
            "uebaAlertCount": 0,
            "vendor": "Exabeam",
            "updatedBy": "system",
            "restrictTo": null,
            "employeePersonalLocation": "*****",
            "employeeManagerFullName": "*****",
            "sourceId": "*****"
        },
        "layout": [
            {
                "incidentTypeId": "generic",
                "rows": [
                    [
                        "description"
                    ],
                    [
                        "vendor",
                        "createdBy"
                    ],
                    [
                        "source",
                        "createdAt"
                    ],
                    [
                        "sourceSeverity",
                        "updatedBy"
                    ],
                    [
                        "sourceId",
                        "updatedAt"
                    ],
                    [
                        "sourceUrl",
                        "endTime"
                    ],
                    [
                        "startedDate",
                        "closedDate"
                    ],
                    [
                        "endedDate",
                        "closedReason"
                    ],
                    [
                        "sourceInfo"
                    ],
                    [
                        "exa_mitre_techniques",
                        "exa_mitre_tactics"
                    ]
                ]
            },
            {
                "incidentTypeId": "malware",
                "rows": [
                    [
                        "malwareName",
                        "malwareCategory"
                    ],
                    [
                        "method_of_intrusion"
                    ],
                    [
                        "process_name",
                        "pid"
                    ],
                    [
                        "process_path"
                    ],
                    [
                        "malwareVictimHost",
                        "malwareAttackerFile"
                    ],
                    [
                        "malwareAttackerIp",
                        "malwareAttackerUrl"
                    ],
                    [
                        "alert_name",
                        "alert_id"
                    ],
                    [
                        "alert_type",
                        "alert_severity"
                    ],
                    [
                        "alert_urls"
                    ],
                    [
                        "malwareKbUrl"
                    ]
                ]
            },
            {
                "incidentTypeId": "ueba",
                "rows": [
                    [
                        "uebaSequenceType",
                        "uebaSequenceId"
                    ],
                    [
                        "uebaUserId",
                        "uebaAssetId"
                    ],
                    [
                        "uebaUserLink",
                        "uebaAssetLink"
                    ],
                    [
                        "uebaSessionLink",
                        "uebaSessionRiskScore"
                    ],
                    [
                        "uebaRiskReasonsCount",
                        "uebaEventCount"
                    ],
                    [
                        "uebaAlertCount",
                        "uebaAssetCount"
                    ],
                    [
                        "uebaNetworkZones",
                        "uebaLocationCount"
                    ],
                    [
                        "uebaRiskReasons"
                    ]
                ]
            }
        ]
    }
]
Key Fields

Common cyber security indicators such as risk levels, risk level names, unique IDs, file hash values, CVE numbers and IP addresses will be extracted from Raw Data as Key Fields.

The system stores these key fields in the path $.[playbookTask].outputData. You can use these key-value pairs as data points for playbook task inputs.

SAMPLE DATA

JSON
{
    "IncidentIDs": ["*****"],
    "IncidentNames": ["lokrer: Notable AA Session"]
}
Result

Provides a brief summary of outputs in an HTML formatted table.

SAMPLE DATA

incidentId

*****

name

lokrer: Notable AA Session

fields

{'uebaLocationCount': 2, 'updatedAt': 1681893658087, 'employeeManagerEmail': '*****@*****.com', 'priority': 'medium', 'source': 'Exabeam AA', 'uebaRiskReasons': 'Risk transfer from past sessions.\nExabeam has detected some type of login or authentication from an IP that has been blacklisted.', 'queue': 1, 'uebaSequenceType': 'session', 'fullName': 'Ram Lokre', 'uebaRiskReasonsCount': 4, 'uebaEventCount': 24, 'userTitle': 'qa technical team lead', 'sourceUrl': 'https://*****', 'startedDate': 1681881960447, 'uebaSequenceId': 'lokrer-20230419052600', 'employeePersonalEmail': '*****@*****.com', 'uebaUserId': 'lokrer', 'incidentType': ['malware', 'ueba', 'generic'], 'uebaSessionRiskScore': 170.0, 'status': 'new', 'createdAt': 1681893649771, 'createdBy': 'admin', 'uebaSessionLink': 'https://*****', 'timeToResolution': 11689324, 'uebaAssetCount': 10, 'owner': 'unassigned', 'uebaAlertCount': 0, 'vendor': 'Exabeam', 'updatedBy': 'system', 'restrictTo': None, 'employeePersonalLocation': '*****', 'employeeManagerFullName': '*****', 'sourceId': '*****'}

layout

[{'incidentTypeId': 'generic', 'rows': [['description'], ['vendor', 'createdBy'], ['source', 'createdAt'], ['sourceSeverity', 'updatedBy'], ['sourceId', 'updatedAt'], ['sourceUrl', 'endTime'], ['startedDate', 'closedDate'], ['endedDate', 'closedReason'], ['sourceInfo'], ['exa_mitre_techniques', 'exa_mitre_tactics']]}, {'incidentTypeId': 'malware', 'rows': [['malwareName', 'malwareCategory'], ['method_of_intrusion'], ['process_name', 'pid'], ['process_path'], ['malwareVictimHost', 'malwareAttackerFile'], ['malwareAttackerIp', 'malwareAttackerUrl'], ['alert_name', 'alert_id'], ['alert_type', 'alert_severity'], ['alert_urls'], ['malwareKbUrl']]}, {'incidentTypeId': 'ueba', 'rows': [['uebaSequenceType', 'uebaSequenceId'], ['uebaUserId', 'uebaAssetId'], ['uebaUserLink', 'uebaAssetLink'], ['uebaSessionLink', 'uebaSessionRiskScore'], ['uebaRiskReasonsCount', 'uebaEventCount'], ['uebaAlertCount', 'uebaAssetCount'], ['uebaNetworkZones', 'uebaLocationCount'], ['uebaRiskReasons']]}]

Fetch Event Field Mapping

Fetch Event commands require event field mapping. Field mapping plays a key role for data normalization within the event pipeline. Field mapping converts the original data fields from the different providers to standardized D3 fields as defined by the D3 Model. Please refer to Event and Incident Intake Field Mapping for details.

To customize field mapping, click + Add Field and add the custom field of your choice. You can also remove built-in field mappings by clicking x. Please note that two underscore characters will automatically prefix the defined Field Name as the System Name for a custom field mapping. Additionally, if an input Field Name contains any spaces, they will automatically be replaced with underscores for the corresponding System Name.

As a system integration, the Exabeam integration has some pre-configured field mappings for default field mapping.

  • Default Event Source

    The Default Event Source is the default set of field mappings that are applied when this fetch event command is executed. For out-of-the-box integrations, you will find a set of field mapping provided by the system. Default event source provides field mappings for common fields from fetched events (e.g. name and incidientId). The default event source has a "Main Event JSON Path" (i.e. $) that is used to extract a batch of events from the response raw data. Click Edit Main JSON Path to view the "Main Event JSON Path".

    Group 1 (2).png
  • Main Event JSON Path: $

    The Main Event JSON Path determines the root path where the system starts parsing raw response data into D3 event data. The JSON path begins with $, representing the root element. The path is formed by appending a sequence of child elements to $, each separated by a dot (.). Square brackets with nested quotation marks ([‘...’]) should be used to separate child elements in JSON arrays.

    For example, the root node of a JSON Path is $. The child node denoting the Unique Event Key field would be incidentId. Putting it together, the JSON Path expression to extract the Unique Event Key is $.incidentId.

The pre-configured field mappings are detailed below:

Field Name

Source Field

Alert Name

.fields.alert_name

Alert Type

.fields.alert_type

Alert URI

.fields.alert_urls

End Time

.fields.endedDate

Aggregated / Correlated Event count

.fields.uebaEventCount

Unique Event Key

.incidentId

Event name

.name

Event Type

.fields.incidentType

Start Time

.fields.startedDate

Description

.fields.description

Original source

.fields.sourceInfo

Process ID

.fields.pid

Process Name

.fields.process_name

Source

.fields.source

Tactics

.fields.exa_mitre_tactics

Techniques

.fields.exa_mitre_techniques

Username

.fields.fullName

Error Handling

If the Return Data displays Failed, an Error tab will appear in the Test Result window.

The error tab contains the details responded from D3 SOAR or third-party API calls, including Failure Indicator, Status Code, and Message. This can help you locate the root cause of a command failure.

Parts in Error

Description

Example

Failure Indicator

Indicates the command failure that happened at a specific input and/or API call.

Fetch Event failed.

Status Code

The response code issued by the third-party API server or the D3 SOAR system that can be used to locate the corresponding error category. For example, if the returned status code is 401, the selected connection is unauthorized to run the command. The user or system support would need to check the permission setting in the Exabeam portal. Refer to the HTTP Status Code Registry for details.

Status Code: 400.

Message

The raw data or captured key error message from the integration API server about the API request failure.

Message: Bad request.

Error Sample Data

Fetch Event failed.

Status Code: 400.

Message: Bad request.

List Asset Data

Lists asset details matching the search criteria using the hostname or IP address.

READER NOTE

Assets is a required parameter to run this command.

  • Run the List Notable Assets command to obtain the Assets. Assets can be found in the raw data at the paths $.assets[*].asset.hostName and $.assets[*].asset.ipAddress.

Input

Input Parameter

Required/Optional

Description

Example

Assets

Required

A list of hostnames or IP addresses used to retrieve the corresponding asset details. Assets can be obtained using the List Notable Assets command.

JSON
[ "1.2.3.4", "xyz" ] 

Output

Return Data

Indicates one of the possible command execution states: Successful, Partially Successful, or Failed.

The Partially Successful state only occurs when a command’s input accepts an array of items (e.g. an array of IP addresses) and one or more items within the array return an error from the API request.

The Failed state can be triggered by any of the following errors:

  • A connection issue with the integration

  • The API returned an error message

  • No response from the API

You can view more details about an error in the Error tab.

Return Data can be passed down directly to a subsequent command or used to create conditional tasks in playbooks.

SAMPLE DATA

JSON
Successful
Raw Data

The primary response data from the API request. For check reputation commands, D3-defined risk levels and risk level names are also included.

SAMPLE DATA

JSON
[
    {
        "asset": {
            "hostName": "*****",
            "ipAddress": "*****",
            "assetGroup": "*****",
            "assetType": "Windows",
            "firstSeen": *****,
            "lastSeen": *****
        },
        "labels": [
            "Workstation",
            "LdifFile"
        ],
        "commentCount": 0
    },
    {
        "asset": {
            "hostName": "*****",
            "assetType": "Windows",
            "firstSeen": *****,
            "lastSeen": *****
        },
        "labels": [
            "Workstation",
            "LdifFile"
        ],
        "topUsers": {
            "key": "*****",
            "modelName": "ASSET_PAGE_USER_LOGONS",
            "groupingFeatureValue": "xyz",
            "histSpan": "t",
            "histogramDate": "NA",
            "histClassName": "CategoricalHist",
            "confidenceFactor": 0,
            "totalBinCount": 1,
            "totalCount": 1,
            "lastUpdate": *****,
            "hist": {},
            "usersInBinList": {
                "millerd": {
                    "username": "*****",
                    "fullName": "*****",
                    "photo": "",
                    "title": "*****",
                    "riskScore": 0.33
                }
            },
            "peerGroupsInBinList": {},
            "disabled": false
        },
        "topGroups": {
            "key": "*****",
            "modelName": "ASSET_PAGE_GROUP_ACTIVITY",
            "groupingFeatureValue": "xyz",
            "histSpan": "t",
            "histogramDate": "NA",
            "histClassName": "CategoricalHist",
            "confidenceFactor": 0,
            "totalBinCount": 3,
            "totalCount": 3,
            "lastUpdate": *****,
            "hist": {
                "binList": [
                    [
                        "_other",
                        2
                    ]
                ],
                "minX": "data-project-lon-itprod-it admin-projects-webscale-modify",
                "maxX": "_other",
                "minY": 1,
                "maxY": 2,
                "histogramType": "CATEGORICAL",
                "topTalkers": []
            },
            "usersInBinList": {},
            "peerGroupsInBinList": {
                "_other": {
                    "name": "_other",
                    "memberCount": 0,
                    "groupType": "",
                    "isMultiPeerGroup": true
                },
                "data-project-lon-itprod-it admin-projects-webscale-modify": {
                    "name": "xyz-modify",
                    "memberCount": 7,
                    "groupType": "Group",
                    "isMultiPeerGroup": true
                }
            },
            "disabled": false
        },
        "commentCount": 0
    }
]
Key Fields

Common cyber security indicators such as risk levels, risk level names, unique IDs, file hash values, CVE numbers and IP addresses will be extracted from Raw Data as Key Fields.

The system stores these key fields in the path $.[playbookTask].outputData. You can use these key-value pairs as data points for playbook task inputs.

SAMPLE DATA

JSON
{
  "HostNames": [ "*****","*****" ],
  "IPAddresses" : [ "*****.*****.*****.*****", """ ]
}
Result

Provides a brief summary of outputs in an HTML formatted table.

SAMPLE DATA

asset

{'hostName': '*****', 'ipAddress': '*****.*****.*****.*****', 'assetGroup': 'Asset Group VDI PCs', 'assetType': 'Windows', 'firstSeen': 1652807023898, 'lastSeen': 1658433132888}

{'hostName': '*****', 'assetType': 'Windows', 'firstSeen': 1652859807923, 'lastSeen': 1661273395258}

labels

['Workstation', 'LdifFile']

['Workstation', 'LdifFile']

commentCount

0

0

topUsers

{'key': 'ASSET_PAGE_USER_LOGONS#hsot2#t#NA', 'modelName': 'ASSET_PAGE_USER_LOGONS', 'groupingFeatureValue': 'xyz', 'histSpan': 't', 'histogramDate': 'NA', 'histClassName': 'CategoricalHist', 'confidenceFactor': 0, 'totalBinCount': 1, 'totalCount': 1, 'lastUpdate': 1660035792718, 'hist': {}, 'usersInBinList': {'millerd': {'username': 'sample2', 'fullName': 'Sample2 D3security', 'photo': '', 'title': 'principal network engineer', 'riskScore': 0.33}}, 'peerGroupsInBinList': {}, 'disabled': False}

topGroups

{'key': 'ASSET_PAGE_GROUP_ACTIVITY#host3#t#NA', 'modelName': 'ASSET_PAGE_GROUP_ACTIVITY', 'groupingFeatureValue': 'xyz', 'histSpan': 't', 'histogramDate': 'NA', 'histClassName': 'CategoricalHist', 'confidenceFactor': 0, 'totalBinCount': 3, 'totalCount': 3, 'lastUpdate': 1660035792718, 'hist': {'binList': [['_other', 2]], 'minX': 'data-project-lon-itprod-it admin-projects-webscale-modify', 'maxX': '_other', 'minY': 1, 'maxY': 2, 'histogramType': 'CATEGORICAL', 'topTalkers': []}, 'usersInBinList': {}, 'peerGroupsInBinList': {'_other': {'name': '_other', 'memberCount': 0, 'groupType': '', 'isMultiPeerGroup': True}, 'data-project-lon-itprod-it admin-projects-webscale-modify': {'name': 'xyz-modify', 'memberCount': 7, 'groupType': 'Group', 'isMultiPeerGroup': True}}, 'disabled': False}

Error Handling

If the Return Data displays Partially Successful or Failed, an Error tab will appear in the Test Result window.

The error tab contains the details responded from D3 SOAR or third-party API calls, including Failure Indicator, Status Code, and Message. This can help you locate the root cause of a command failure.

Parts in Error

Description

Example

Failure Indicator

Indicates the command failure that happened at a specific input and/or API call.

List Asset Data failed.

Status Code

The response code issued by the third-party API server or the D3 SOAR system that can be used to locate the corresponding error category. For example, if the returned status code is 401, the selected connection is unauthorized to run the command. The user or system support would need to check the permission setting in the Exabeam portal. Refer to the HTTP Status Code Registry for details.

Status Code: 400

Message

The raw data or captured key error message from the integration API server about the API request failure.

Message: Bad request.

Error Sample Data

List Asset Data failed.

Status Code: 400.

Message: Bad request.

List Notable Assets

Lists notable assets matching the specified time duration.

Input

Input Parameter

Required/Optional

Description

Example

Time Duration Unit

Optional

The unit of measurement for the specified time duration, with the options: Hours | Days | Months | Years. By default, the value is Hours.

Hours

Time Duration

Optional

The value of the time duration. If the input value is 0, a negative number, or undefined, a value of 1 will be used.

2

Limit

Optional

The maximum number of results to return on each page. The maximum value is 10,000. By default, the value is 20.

20

Output

Return Data

Indicates one of the possible command execution states: Successful or Failed.

The Failed state can be triggered by any of the following errors:

  • A connection issue with the integration

  • The API returned an error message

  • No response from the API

You can view more details about an error in the Error tab.

Return Data can be passed down directly to a subsequent command or used to create conditional tasks in playbooks.

SAMPLE DATA

JSON
Successful
Raw Data

The primary response data from the API request. For check reputation commands, D3-defined risk levels and risk level names are also included.

SAMPLE DATA

JSON
{
    "assets": [
        {
            "asset": {
                "hostName": "*****",
                "assetType": "Windows",
                "firstSeen": *****,
                "lastSeen": *****
            },
            "highestRiskScore": 257,
            "highestRiskSequence": {
                "id": "*****",
                "entityName": "asset",
                "entityValue": "*****",
                "day": 1660694400000,
                "triggeredRuleCountOpt": 61,
                "riskScoreOpt": 257
            },
            "incidentIds": []
        },
        {
            "asset": {
                "hostName": "*****",
                "ipAddress": "*****",
                "assetType": "Windows",
                "firstSeen": 1655395983667,
                "lastSeen": 1661212618921
            },
            "highestRiskScore": 139,
            "highestRiskSequence": {
                "id": "*****",
                "entityName": "asset",
                "entityValue": "*****",
                "day": 1661126400000,
                "triggeredRuleCountOpt": 35,
                "riskScoreOpt": 139
            },
            "incidentIds": []
        }
    ]
}
Key Fields

Common cyber security indicators such as risk levels, risk level names, unique IDs, file hash values, CVE numbers and IP addresses will be extracted from Raw Data as Key Fields.

The system stores these key fields in the path $.[playbookTask].outputData. You can use these key-value pairs as data points for playbook task inputs.

SAMPLE DATA

JSON
{
    "HostNames": [ "*****","*****" ],
    "IPAddresses": [ "", "*****.*****.*****.*****" ]
}
Result

Provides a brief summary of outputs in an HTML formatted table.

SAMPLE DATA

assets

{'asset': {'hostName': '*****', 'assetType': 'Windows', 'firstSeen': 1655996697924, 'lastSeen': 1661211667084}, 'highestRiskScore': 257, 'highestRiskSequence': {'id': '*****', 'entityName': 'asset', 'entityValue': 'host3', 'day': 1660694400000, 'triggeredRuleCountOpt': 61, 'riskScoreOpt': 257.0}, 'incidentIds': []}
{'asset': {'hostName': '*****', 'ipAddress': '*****.*****.*****.*****', 'assetType': 'Windows', 'firstSeen': 1655395983667, 'lastSeen': 1661212618921}, 'highestRiskScore': 139, 'highestRiskSequence': {'id': '*****', 'entityName': 'asset', 'entityValue': 'host01', 'day': 1661126400000, 'triggeredRuleCountOpt': 35, 'riskScoreOpt': 139.0}, 'incidentIds': []}

Error Handling

If the Return Data displays Failed, an Error tab will appear in the Test Result window.

The error tab contains the details responded from D3 SOAR or third-party API calls, including Failure Indicator, Status Code, and Message. This can help you locate the root cause of a command failure.

Parts in Error

Description

Example

Failure Indicator

Indicates the command failure that happened at a specific input and/or API call.

List Notable Assets failed.

Status Code

The response code issued by the third-party API server or the D3 SOAR system that can be used to locate the corresponding error category. For example, if the returned status code is 401, the selected connection is unauthorized to run the command. The user or system support would need to check the permission setting in the Exabeam portal. Refer to the HTTP Status Code Registry for details.

Status Code: 400.

Message

The raw data or captured key error message from the integration API server about the API request failure.

Message: Bad request.

Error Sample Data

List Notable Assets failed.

Status Code: 400.

Message: Bad request.

List Sessions By User

Returns sessions for the specified user.

READER NOTE

Username is a required parameter to run this command.

  • Run the List Users command to obtain the Username. Usernames can be found in the raw data at the path $.users[*].username.

Input

Input Parameter

Required/Optional

Description

Example

Start Time

Required

The start time of the time range to retrieve user sessions (in UTC).

04/01/2022 08:00 PM

End Time

Required

The end time of the time range to retrieve user sessions (in UTC).

04/03/2022 08:00 PM

Username

Required

The username for which to retrieve sessions. Username can be obtained using the List Users command.

sample1

Output

Return Data

Indicates one of the possible command execution states: Successful or Failed.

The Failed state can be triggered by any of the following errors:

  • A connection issue with the integration

  • The API returned an error message

  • No response from the API

You can view more details about an error in the Error tab.

Return Data can be passed down directly to a subsequent command or used to create conditional tasks in playbooks.

SAMPLE DATA

JSON
Successful
Raw Data

The primary response data from the API request. For check reputation commands, D3-defined risk levels and risk level names are also included.

SAMPLE DATA

JSON
{
    "sessions": [
        {
            "sessionId": "*****",
            "username": "*****",
            "startTime": 1656534146370,
            "endTime": 1656552746369,
            "initialRiskScore": 0,
            "riskScore": 13,
            "numOfReasons": 2,
            "loginHost": "NA",
            "label": "",
            "accounts": [
            "*****"
            ],
            "numOfAccounts": 1,
            "zones": [],
            "numOfZones": 0,
            "numOfAssets": 2,
            "numOfEvents": 4,
            "numOfSecurityEvents": 0
        },
        {
            "sessionId": "*****",
            "username": "*****",
            "startTime": 1657822027799,
            "endTime": 1657848727742,
            "initialRiskScore": 0,
            "riskScore": 3,
            "numOfReasons": 1,
            "loginHost": "NA",
            "label": "",
            "accounts": [
            "*****"
            ],
            "numOfAccounts": 1,
            "zones": [],
            "numOfZones": 0,
            "numOfAssets": 2,
            "numOfEvents": 4,
            "numOfSecurityEvents": 0
        }
    ],
      "sessionCommentCounts": {},
      "whiteListedSessions": [],
      "sessionsRulesAllWhitelisted": [],
      "lockouts": [],
      "lockoutCommentCounts": {},
      "whiteListedLockouts": [],
      "lockoutsRulesAllWhitelisted": [],
      "dataFeeds": {},
      "sessionsRulesPartialWhitelisted": [],
      "lockoutsRulesPartialWhitelisted": []
  }
Key Fields

Common cyber security indicators such as risk levels, risk level names, unique IDs, file hash values, CVE numbers and IP addresses will be extracted from Raw Data as Key Fields.

The system stores these key fields in the path $.[playbookTask].outputData. You can use these key-value pairs as data points for playbook task inputs.

SAMPLE DATA

JSON
{
    "SessionIDs": [ "*****","*****" ],
    "RiskScores": [ 13, 3 ],
    "NumberOfEvents": [4, 2]
}
Result

Provides a brief summary of outputs in an HTML formatted table.

SAMPLE DATA

SessionCount

2

Error Handling

If the Return Data displays Failed, an Error tab will appear in the Test Result window.

The error tab contains the details responded from D3 SOAR or third-party API calls, including Failure Indicator, Status Code, and Message. This can help you locate the root cause of a command failure.

Parts in Error

Description

Example

Failure Indicator

Indicates the command failure that happened at a specific input and/or API call.

List Sessions By User failed.

Status Code

The response code issued by the third-party API server or the D3 SOAR system that can be used to locate the corresponding error category. For example, if the returned status code is 401, the selected connection is unauthorized to run the command. The user or system support would need to check the permission setting in the Exabeam portal. Refer to the HTTP Status Code Registry for details.

Status Code: 400.

Message

The raw data or captured key error message from the integration API server about the API request failure.

Message: Bad request.

Error Sample Data

List Sessions By User failed.

Status Code: 400.

Message: Bad request.

List Users

Returns users matching the search criteria.

Input

Input Parameter

Required/Optional

Description

Example

Username

Optional

The usernames or keywords used to filter the returned users.

ampl

Limit

Optional

The maximum number of results to return on each page. The maximum value is 10,000. By default, the value is 10.

20

Include User Photo

Optional

Whether user photos will be returned with the corresponding list of users. By default, the value is False.

True

Output

Return Data

Indicates one of the possible command execution states: Successful or Failed.

The Failed state can be triggered by any of the following errors:

  • A connection issue with the integration

  • The API returned an error message

  • No response from the API

You can view more details about an error in the Error tab.

Return Data can be passed down directly to a subsequent command or used to create conditional tasks in playbooks.

SAMPLE DATA

CODE
Successful
Raw Data

The primary response data from the API request. For check reputation commands, D3-defined risk levels and risk level names are also included.

SAMPLE DATA

JSON
{
    "users": [
        {
            "username": "*****",
            "riskScore": 96.02,
            "averageRiskScore": 45.72,
            "pastScores": [
                96.0283181177369,
                0,
                0
            ],
            "lastSessionId": "*****",
            "firstSeen": 1652858877683,
            "lastSeen": 1661287998794,
            "lastActivityType": "Account is active",
            "lastActivityTime": 1661237880307,
            "info": {
                "location": "*****",
                "photo": "*****",
                "email": "*****",
                "fullName": "*****",
                "dn": "*****",
                "country": "South Africa",
                "department": "marketing",
                "manager": "*****",
                "phoneOffice": "*****",
                "title": "*****",
                "group": "*****",
                "sid": "*****"
            },
            "labels": [],
            "pendingRiskTransfers": []
        },
        {
            "username": "*****",
            "riskScore": 83.28,
            "averageRiskScore": 39.66,
            "pastScores": [
                83.28988513838559,
                0,
                0
            ],
            "lastSessionId": "*****",
            "firstSeen": 1652789114787,
            "lastSeen": 1661297299110,
            "lastActivityType": "Account is active",
            "lastActivityTime": 1661210899110,
            "info": {
                "location": "*****",
                "photo": "*****",
                "email": "*****",
                "fullName": "*****",
                "dn": "*****",
                "country": "South Africa",
                "department": "marketing",
                "manager": "*****",
                "phoneOffice": "*****",
                "title": "*****",
                "group": "*****",
                "sid": "*****"
            },
            "labels": [],
            "pendingRiskTransfers": []
        }
    ]
}
Key Fields

Common cyber security indicators such as risk levels, risk level names, unique IDs, file hash values, CVE numbers and IP addresses will be extracted from Raw Data as Key Fields.

The system stores these key fields in the path $.[playbookTask].outputData. You can use these key-value pairs as data points for playbook task inputs.

SAMPLE DATA

JSON
{
    "Usernames": [ "*****","*****" ],
    "FullNames": [ "*****","*****" ]
}
Result

Provides a brief summary of outputs in an HTML formatted table.

SAMPLE DATA

users

{'username': 'sample1', 'riskScore': 96.02, 'averageRiskScore': 45.72, 'pastScores': [96.0283181177369, 0.0, 0.0], 'lastSessionId': 'sample1-20220823065800', 'firstSeen': 1652858877683, 'lastSeen': 1661287998794, 'lastActivityType': 'Account is active', 'lastActivityTime': 1661237880307, 'info': {'location': 'Johannesburg', 'photo': '/9j/4A==', 'email': '*****', 'fullName': '*****', 'dn': 'cn=sample1 Security,ou=d3southafrica,ou=d3group,ou=d3 users,dc=d3i,dc=d3,dc=local', 'country': 'South Africa', 'department': 'marketing', 'manager': '*****', 'phoneOffice': '*****', 'title': '*****', 'group': '*****', 'sid': '*****'}, 'labels': [], 'pendingRiskTransfers': []}

{'username': 'sample2', 'riskScore': 83.28, 'averageRiskScore': 39.66, 'pastScores': [83.28988513838559, 0.0, 0.0], 'lastSessionId': '*****', 'firstSeen': 1652789114787, 'lastSeen': 1661297299110, 'lastActivityType': 'Account is active', 'lastActivityTime': 1661210899110, 'info': {'location': 'Johannesburg', 'photo': '/9j/4A==', 'email': '*****', 'fullName': 'sample2 Security', 'dn': 'cn=sample2 Security,ou=d3southafrica,ou=d3group,ou=d3 users,dc=d3i,dc=d3,dc=local', 'country': 'South Africa', 'department': 'marketing', 'manager': '*****', 'phoneOffice': '*****', 'title': '*****, 'group': '*****', 'sid': '*****'}, 'labels': [], 'pendingRiskTransfers': []}

Error Handling

If the Return Data displays Failed, an Error tab will appear in the Test Result window.

The error tab contains the details responded from D3 SOAR or third-party API calls, including Failure Indicator, Status Code, and Message. This can help you locate the root cause of a command failure.

Parts in Error

Description

Example

Failure Indicator

Indicates the command failure that happened at a specific input and/or API call.

List Users failed.

Status Code

The response code issued by the third-party API server or the D3 SOAR system that can be used to locate the corresponding error category. For example, if the returned status code is 401, the selected connection is unauthorized to run the command. The user or system support would need to check the permission setting in the Exabeam portal. Refer to the HTTP Status Code Registry for details.

Status Code: 400.

Message

The raw data or captured key error message from the integration API server about the API request failure.

Message: Bad request.

Error Sample Data

List Users failed.

Status Code: 400.

Message: Bad request.

Test Connection

Performs a health check on an integration connection. Users can schedule a periodic health check by selecting Connection Health Check when editing an integration connection.

Input

N/A

Output

Return Data

Indicates one of the possible command execution states: Successful or Failed.

The Failed state can be triggered by any of the following errors:

  • A connection issue with the integration

  • The API returned an error message

  • No response from the API

You can view more details about an error in the Error tab.

SAMPLE DATA

JSON
Successful

Error Handling

If the Return Data displays Failed, an Error tab will appear in the Test Result window.

The error tab contains the details responded from D3 SOAR or third-party API calls, including Failure Indicator, Status Code, and Message. This can help you locate the root cause of a command failure.

Parts in Error

Description

Example

Failure Indicator

Indicates the command failure that happened at a specific input and/or API call.

Test Connection failed. Failed to check the connector.

Status Code

The response code issued by the third-party API server or the D3 SOAR system that can be used to locate the corresponding error category. For example, if the returned status code is 401, the selected connection is unauthorized to run the command. The user or system support would need to check the permission setting in the Exabeam portal. Refer to the HTTP Status Code Registry for details.

Status Code: 400.

Message

The raw data or captured key error message from the integration API server about the API request failure.

Message: Bad request.

Error Sample Data

Test Connection failed. Failed to check the connector.

Status Code: 400.

Message: Bad request.

JavaScript errors detected

Please note, these errors can depend on your browser setup.

If this problem persists, please contact our support.