
Exabeam Security Operations Platform
LAST UPDATED: JULY 30, 2025
Overview
The Exabeam Security Operations Platform provides advanced SIEM capabilities powered by scalable security log management, behavioral analytics, and automated threat detection, investigation, and response (TDIR).
D3 SOAR is providing REST operations to function with Exabeam Security Operations Platform.
Exabeam Security Operations Platform is available for use in:
Known Limitations
Observe the following rate limits when using the Exabeam API.
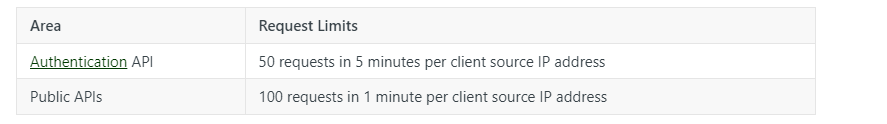
Refer to Exabeam Security Operations Platform API Rate Limits for details.
Connection
READER NOTE
Up to 50 API keys can be created per subscription.
To connect to Exabeam Security Operations Platform from D3 SOAR, please follow this part to collect the required information below:
Parameter | Description | Example |
Server URL | The API server URL used to authenticate the API connection on the domain level. | https://api.ca.exabeam.cloud |
Key ID | The Key ID used to authenticate the API connection. | ***** |
Key Secret | The Key Secret used to authenticate the API connection. | ***** |
Access Token | The system generated access token. | ***** |
Expire Time | The UTC timestamp of the stored access token's expiry time. | 1713931673 |
Permission Requirements
Each endpoint in the Exabeam Security Operations Platform API requires a certain permission scope. The following are required scopes for the commands in this integration:
Command | Required Permissions |
Fetch Event | Search, Analyze and Export (Read) |
Get Alert Details | Threat Center alerts (Read) |
Get Case Details | Threat Center cases (Read) |
Search Alerts | Threat Center alerts (Read) |
Search Cases | Threat Center cases (Read) |
Test Connection | Search, Analyze and Export (Read) |
Exabeam uses role-based access control to manage user permissions and access to Secured Resources. A variety of preconfigured default roles are included in the Exabeam Security Operations Platform for its different features. The roles are designed for common user types such as analysts, administrators, and auditors. However, if the default roles do not meet all your needs, you can Create a Custom User Role with specific permission sets tailored to your security needs.
Each user is assigned one or more User Roles. Users who are assigned multiple roles receive the aggregate of all permissions across their assigned roles.
Configuring Exabeam Security Operations Platform to Work with D3 SOAR
Open the Exabeam Security Operations Platform and on the lower-left side of the page, click Settings, and then click API Keys.
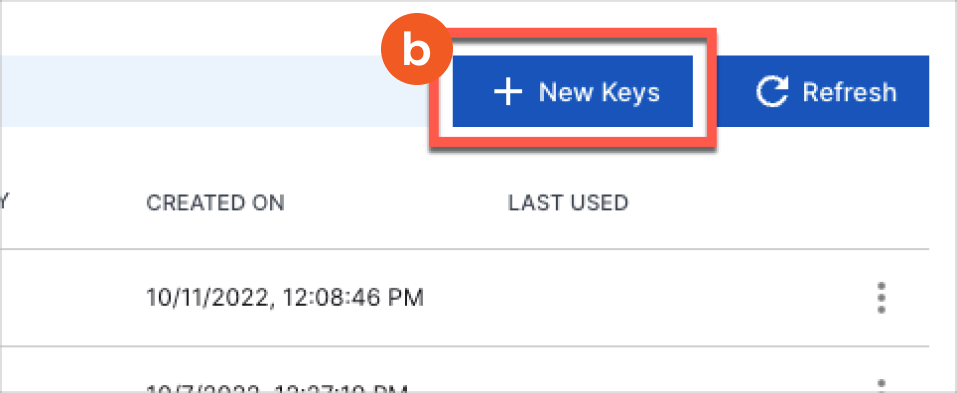
Do one of the following depending on whether there are existing API keys:
If there are no existing API keys, in the center of the page, click New API Keys.
If there are existing API keys, click New Keys.
In the New API Key dialog box, do the following:
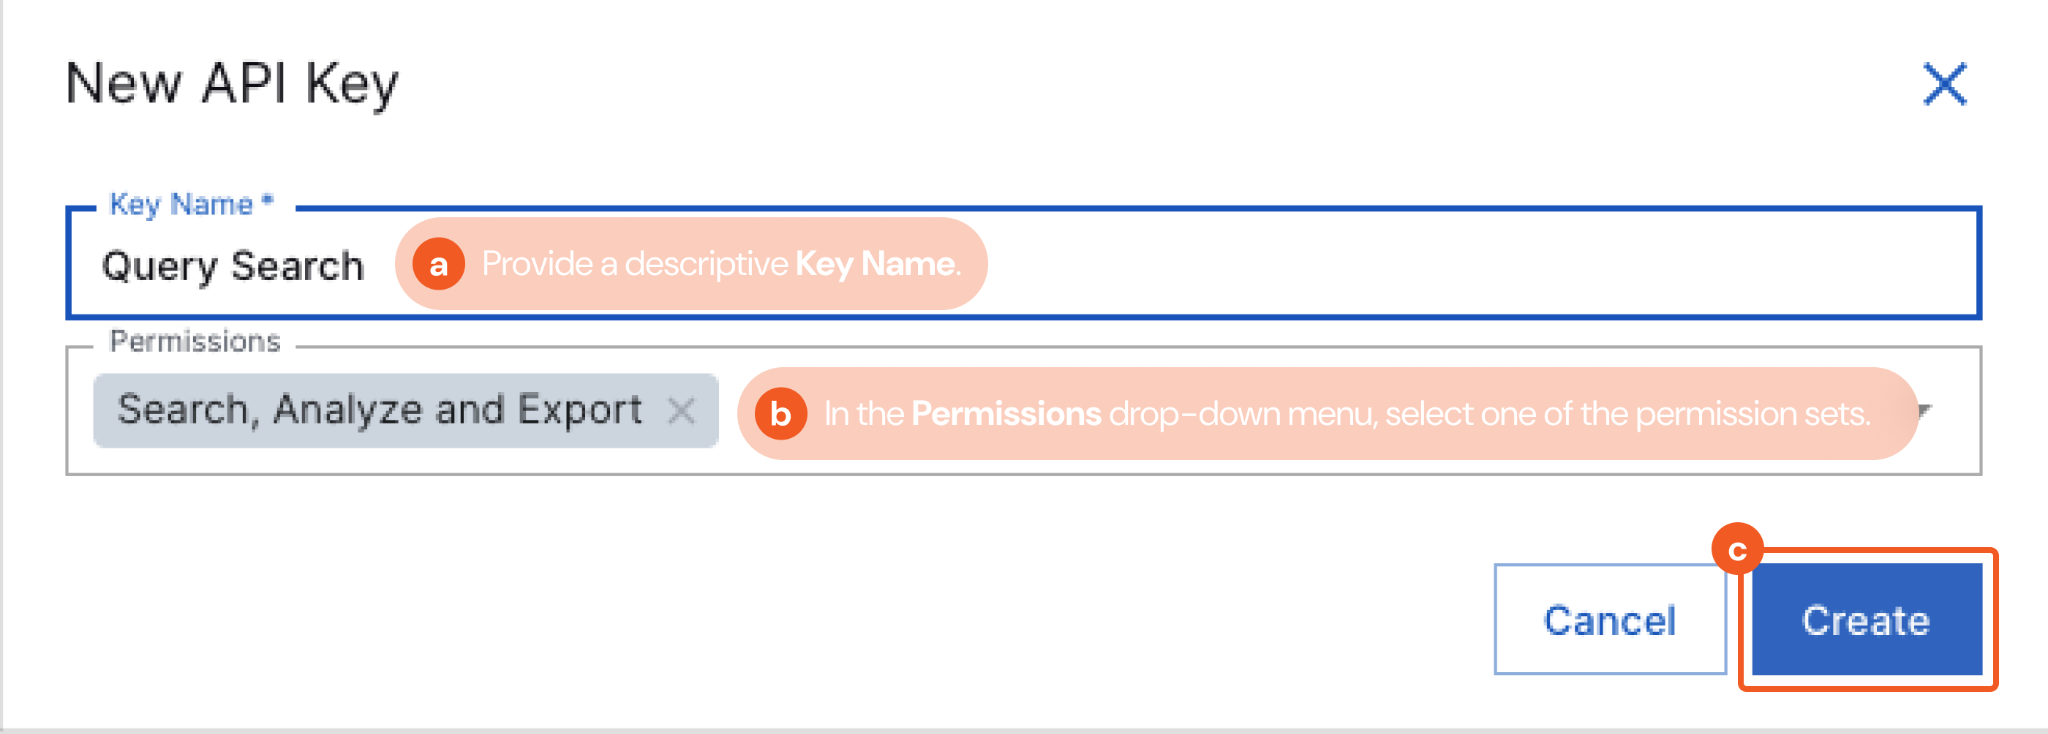
Provide a descriptive Key Name.
In the Permissions drop-down menu, select one of the permission sets.
Click Create.
A message displays to indicate that your API key has been successfully created.
Included in the message are the auto-generated Key and Secret strings, which you can copy by clicking their respective copy icons.
Click Ok, great!.
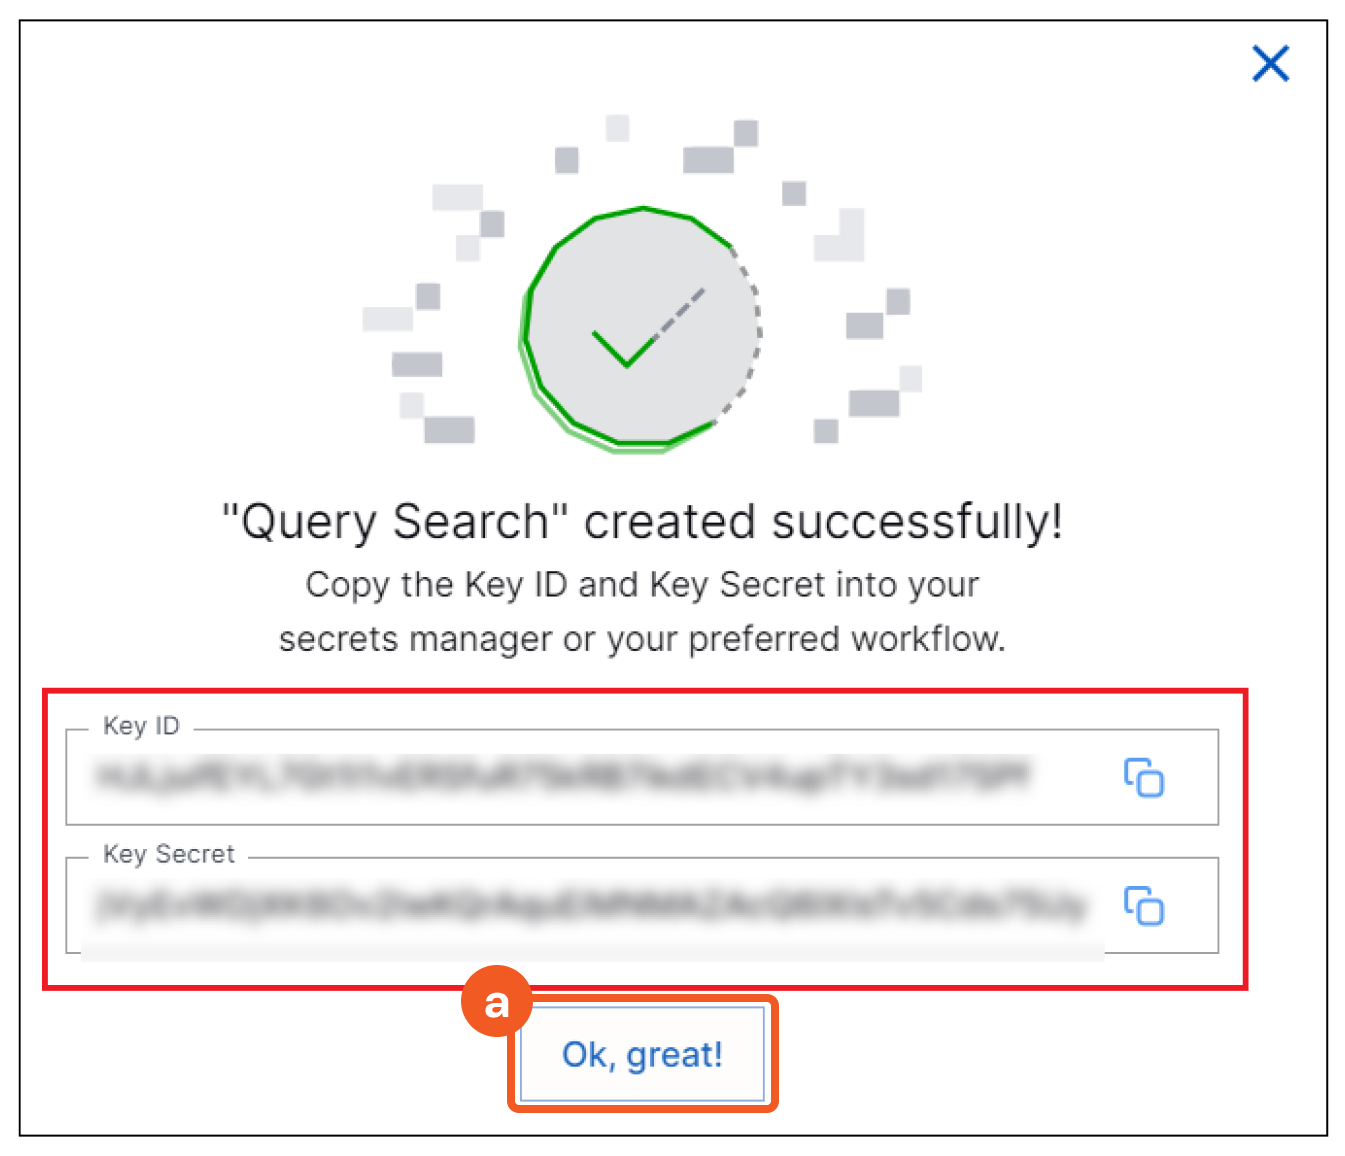
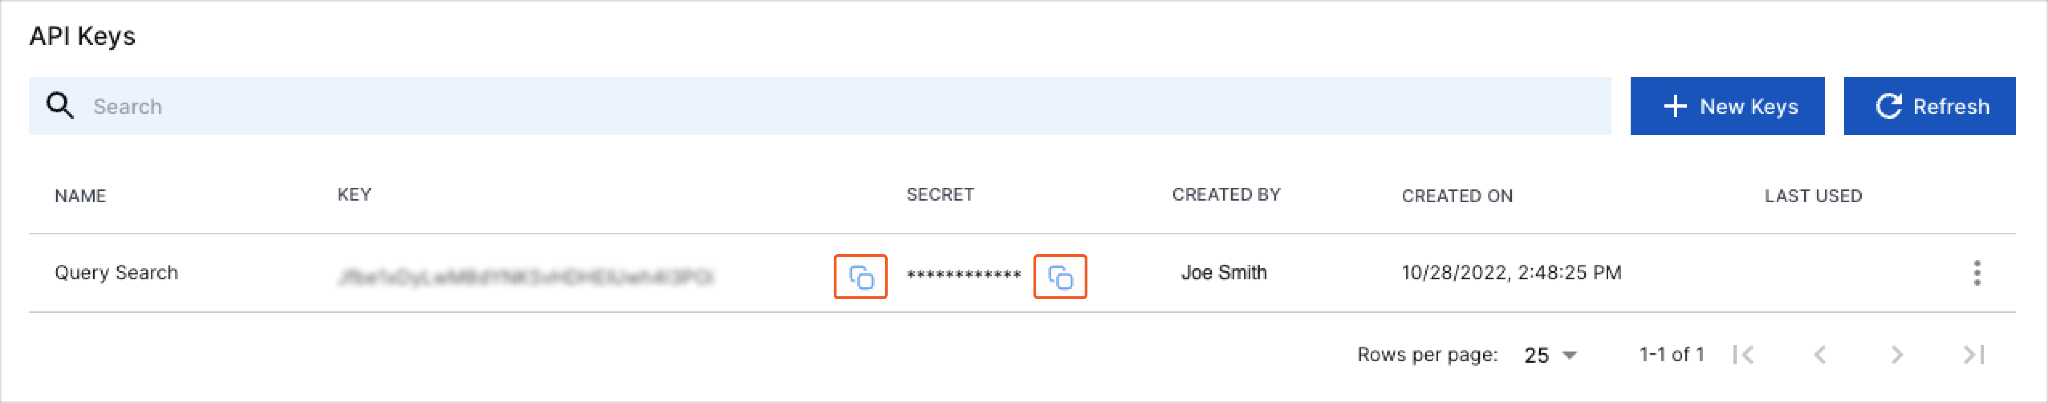
The API Keys page refreshes to show your new API key.
READER NOTE
This is the only instance in which the Secret string is displayed in plain text and not obfuscated to the user.
Click the respective copy icons to copy the Key and Secret strings.
Configuring D3 SOAR to Work with Exabeam Security Operations Platform
Log in to D3 SOAR.
Find the Exabeam Security Operations Platform integration.
Navigate to Configuration on the top header menu.
Click on the Integration icon on the left sidebar.
Type Exabeam Security Operations Platform in the search box to find the integration, then click it to select it.
Click + Connection, on the right side of the Connections section. A new connection window will appear.
Configure the following fields to create a connection to Exabeam Security Operations Platform.
Connection Name: The desired name for the connection.
Site: Specifies the site to use the integration connection. Use the drop-down menu to select the site. The Share to Internal Sites option enables all sites defined as internal sites to use the connection. Selecting a specific site will only enable that site to use the connection.
Recipient site for events from connections Shared to Internal Sites: This field appears if you selected Share to Internal Sites for Site to let you select the internal site to deploy the integration connection.
Agent Name (Optional): Specifies the proxy agent required to build the connection. Use the dropdown menu to select the proxy agent from a list of previously configured proxy agents.
Description (Optional): Add your desired description for the connection.
Tenant (Optional): When configuring the connection from a master tenant site, you have the option to choose the specific tenant sites you want to share the connection with. Once you enable this setting, you can filter and select the desired tenant sites from the dropdowns to share the connection.
Configure User Permissions: Defines which users have access to the connection.
Active: Check the checkbox to ensure the connection is available for use.
System: This section contains the parameters defined specifically for the integration. These parameters must be configured to create the integration connection.
1. Input the Server URL.
2. Copy the Key ID from the Exabeam Security Operations Platform platform. Refer to step 4 of Configuring Exabeam Security Operations Platform to Work with D3 SOAR.
3. Input the Key Secret. Refer to step 4 of Configuring Exabeam Security Operations Platform to Work with D3 SOAR.Enable Password Vault: An optional feature that allows users to take the stored credentials from their own password vault. Refer to the password vault connection guide if needed.
Connection Health Check: Updates the connection status you have created. A connection health check is done by scheduling the Test Connection command of this integration. This can only be done when the connection is active.
To set up a connection health check, check the Connection Health Check tick box. You can customize the interval (minutes) for scheduling the health check. An email notification can be set up after a specified number of failed connection attempts.
Test the connection.
Click Test Connection to verify the account credentials and network connection. If the Test Connection Passed alert window appears, the test connection is successful. You will see Passed with a green check mark appear beside the Test Connection button. If the test connection fails, please check your connection parameters and try again.
Click OK to close the alert window.
Click +Add to create and add the configured connection.
Commands
Exabeam Security Operations Platform includes the following executable commands for users to set up schedules or create playbook workflows. With the Test Command, you can execute these commands independently for playbook troubleshooting.
Integration API Note
For more information about the Exabeam Security Operations Platform API, please refer to the Exabeam Security Operations Platform API reference.
READER NOTE
Certain permissions are required for each command. Refer to the Permission Requirements section for details.
Note for Time-related parameters
The input format of time-related parameters may vary based on your account settings. As a result, the sample data provided in our commands is different from what you see. To set your preferred time format, follow these steps:
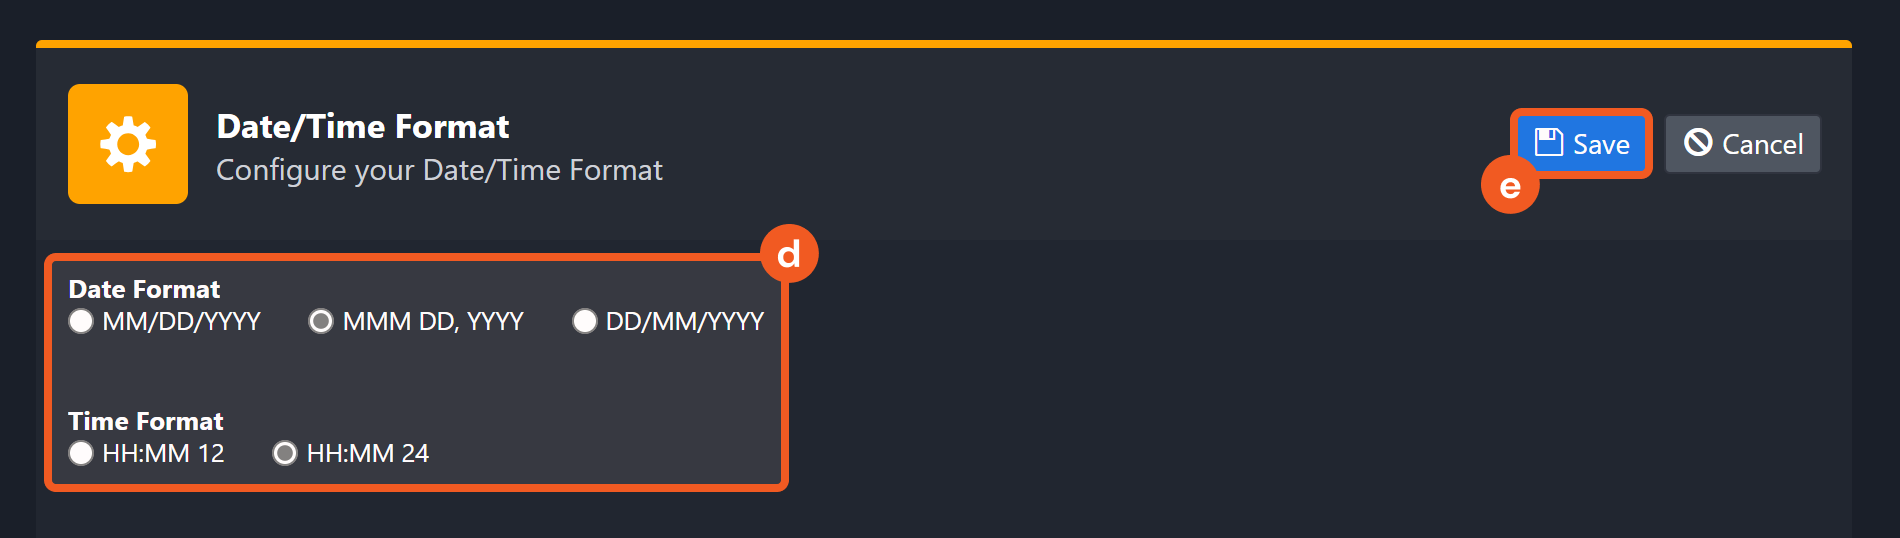
Navigate to Configuration Application Settings. Select Date/Time Format.
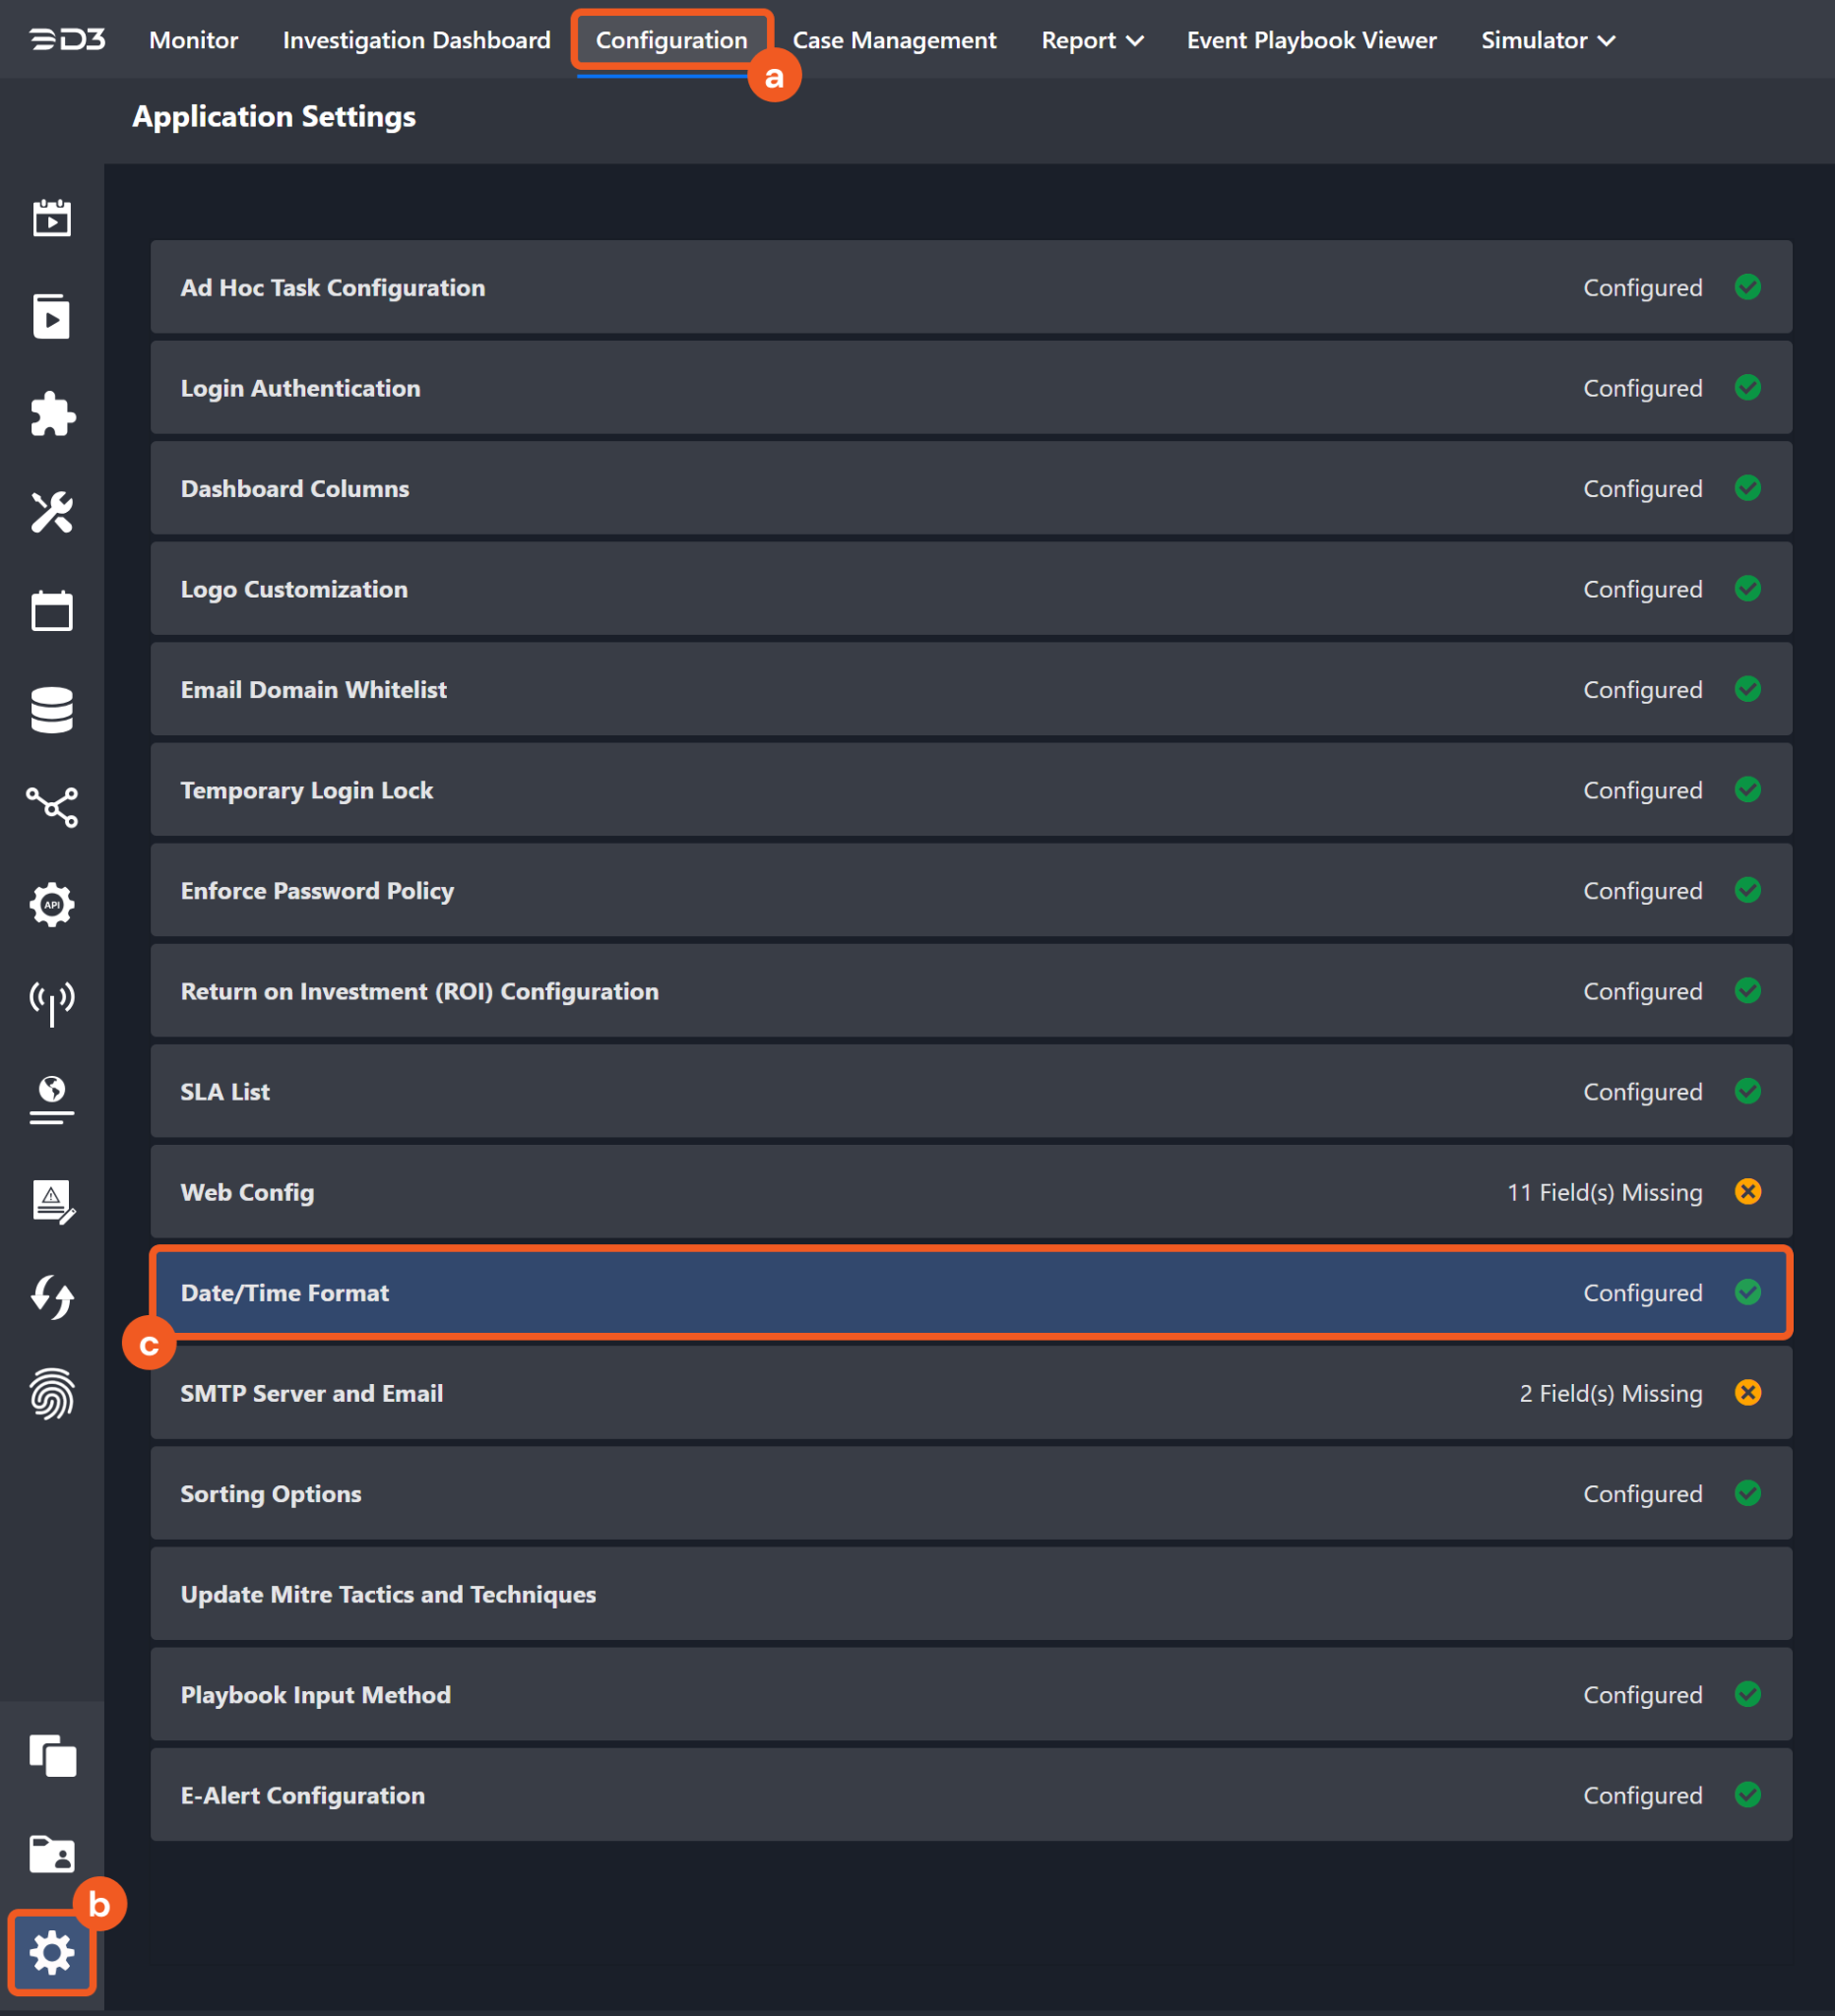
Choose your desired date and time format, then click on the Save button.
After that, you will be able to view your preferred time format when configuring the DateTime input parameters for commands.
Fetch Event
Performs queries to search for logs and events spanning multiple years.
Input
Input Parameter | Required/Optional | Description | Example |
Start Time | Optional | The start time (in UTC) of the duration during which events are retrieved. By default, the value is 1 day before End Time. | 2024-08-06 18:00:00 |
End Time | Optional | The end time (in UTC) of the duration during which events are retrieved. By default, the value is the current time. | 2024-08-06 18:59:59 |
Number of Event(s) Fetched | Optional | The maximum number of incidents to return, between 1 to 3000. If this parameter is not defined, all 3000 events will be returned. | 10 |
Filter | Required | Searches for specific events using filters. Refer to Exabeam Search Guide for how to build a search. | product:"Audit Log" |
Fields | Optional | The list of fields to be returned from the search. By default, all fields of the event will be returned. |
JSON
|
Group By | Optional | The list of fields to group by. |
JSON
|
Output
Fetch Event Field Mapping
Fetch Event commands require event field mapping. Field mapping plays a key role for data normalization within the event pipeline. Field mapping converts the original data fields from the different providers to standardized D3 fields as defined by the D3 Model. Please refer to Event and Incident Intake Field Mapping for details.
To customize field mapping, click + Add Field and add the custom field of your choice. You can also remove built-in field mappings by clicking x. Please note that two underscore characters will automatically prefix the defined Field Name as the System Name for a custom field mapping. Additionally, if an input Field Name contains any spaces, they will automatically be replaced with underscores for the corresponding System Name.
As a system integration, the Exabeam Security Operations Platform integration has some pre-configured field mappings for default field mapping.
Default Event Source
The Default Event Source is the default set of field mappings that are applied when this fetch event command is executed. For out-of-the-box integrations, you will find a set of field mapping provided by the system. Default event source provides field mappings for common fields from fetched events (e.g. event_id and file_name). The default event source has a "Main Event JSON Path" (i.e. $.rows) that is used to extract a batch of events from the response raw data. Click Edit Main JSON Path to view the "Main Event JSON Path".
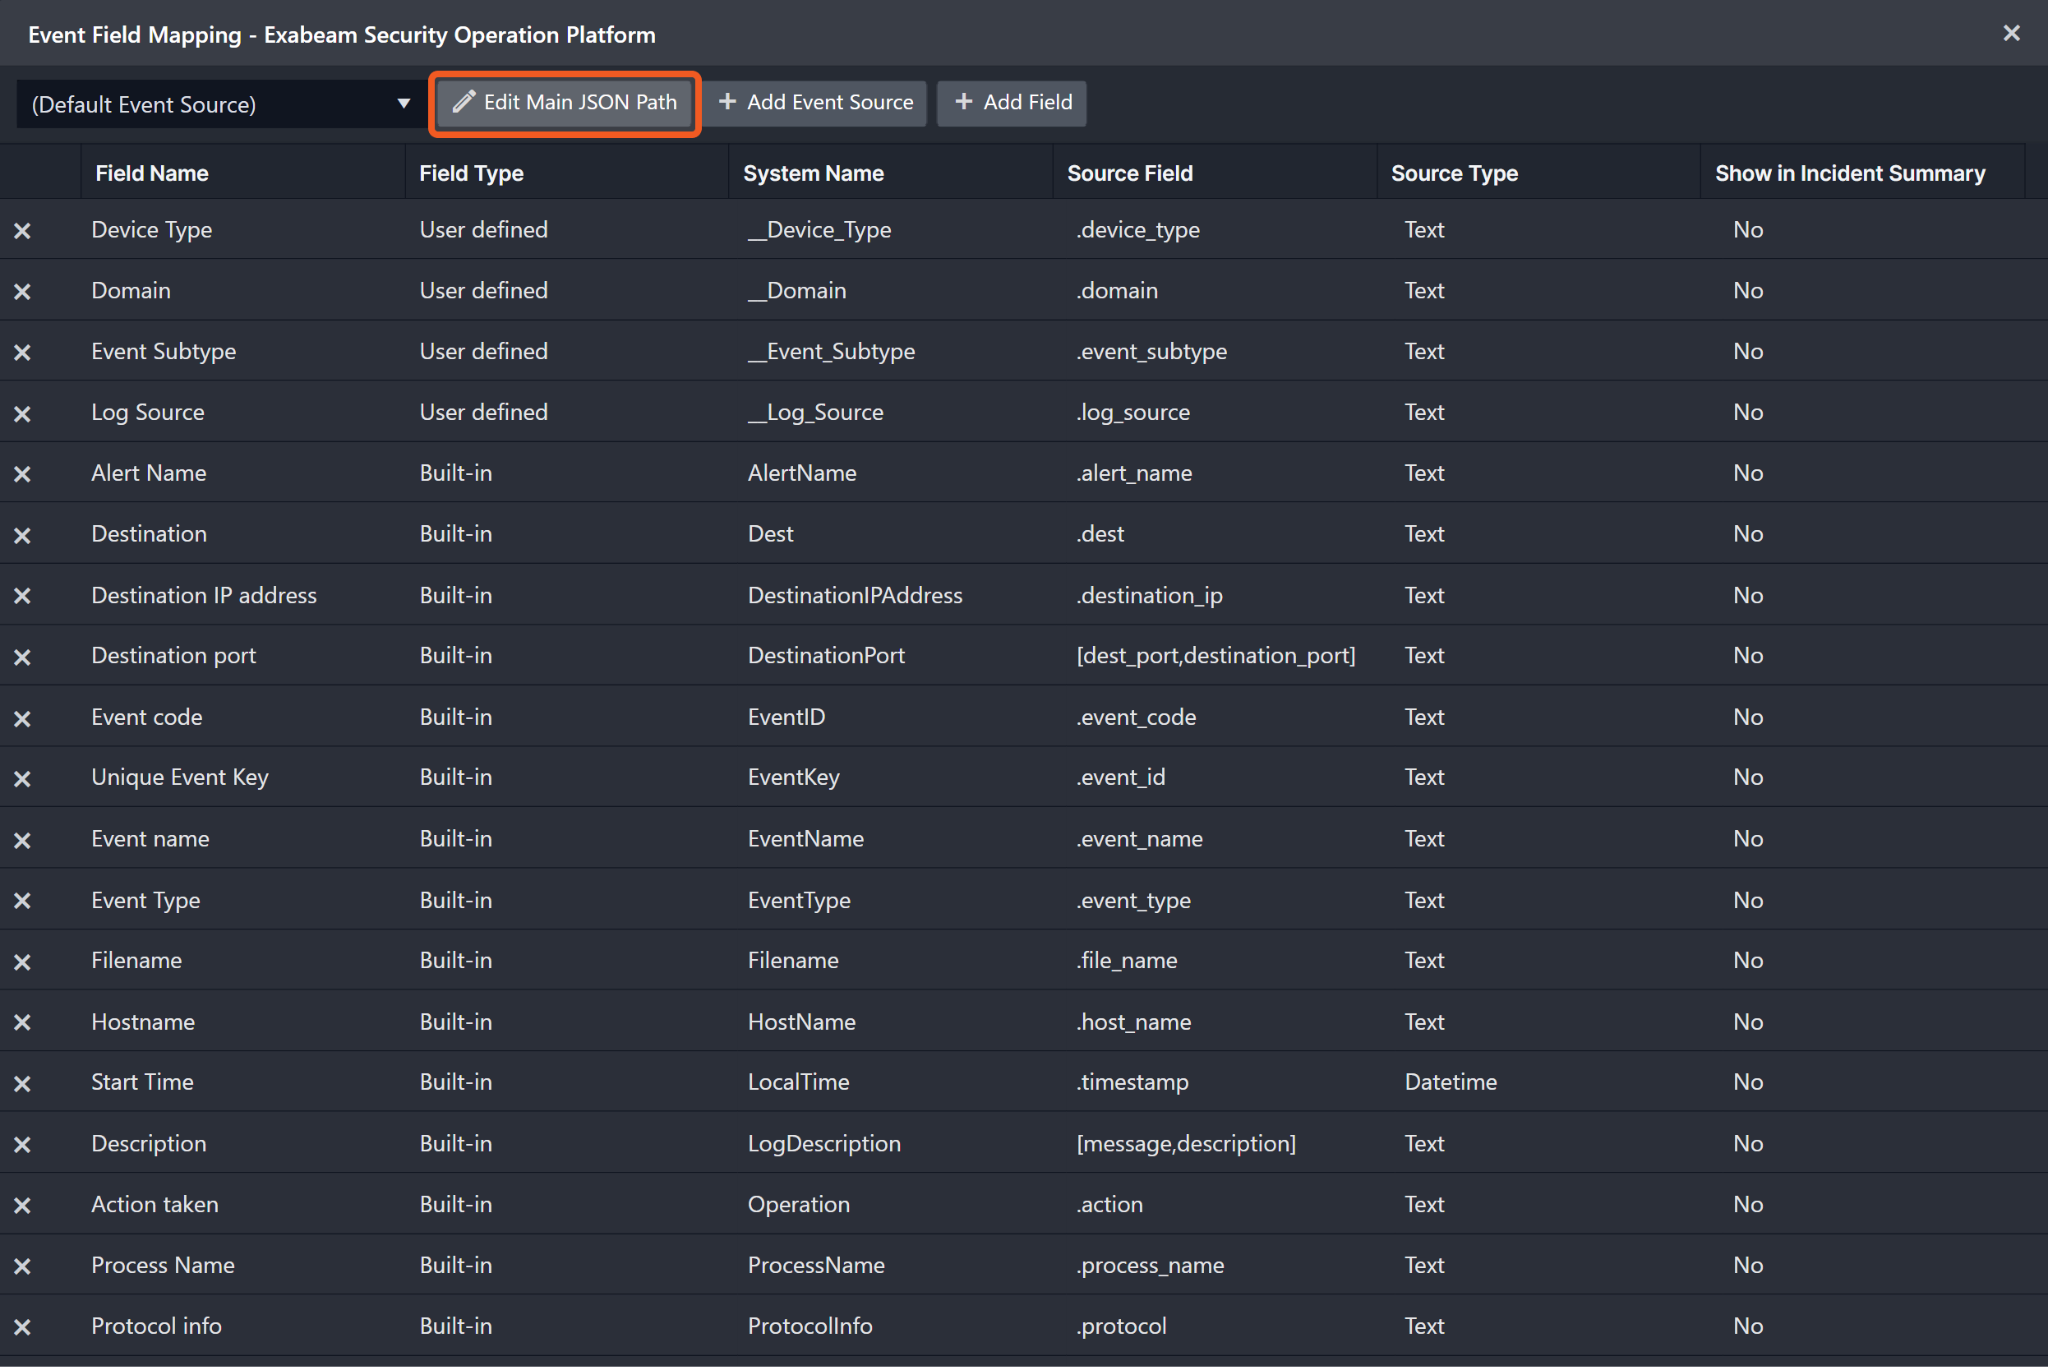
Main Event JSON Path: $.rows
The Main Event JSON Path determines the root path where the system starts parsing raw response data into D3 event data. The JSON path begins with $, representing the root element. The path is formed by appending a sequence of child elements to $, each separated by a dot (.). Square brackets with nested quotation marks ([‘...’]) should be used to separate child elements in JSON arrays.
For example, the root node of a JSON Path is $.rows. The child node denoting the Unique Event Key field would be event_id. Putting it together, the JSON Path expression to extract the Unique Event Key is $.rows.event_id.
The pre-configured field mappings are detailed below:
Field Name | Source Field |
Alert Name | .alert_name |
Destination | .dest |
Destination IP address | .destination_ip |
Destination port | [dest_port,destination_port] |
Event code | .event_code |
Unique Event Key | .event_id |
Event name | .event_name |
Event Type | .event_type |
Filename | .file_name |
Hostname | .host_name |
Start Time | .timestamp |
Description | [message,description] |
Action taken | .action |
Process Name | .process_name |
Protocol info | .protocol |
Severity | .severity |
Source vendor name | .vendor |
Source IP address | .source_ip |
Source port | [src_port.source_port] |
Source Product | .product |
Source | .src |
Username | .user_name |
Error Handling
If the Return Data displays Failed, an Error tab will appear in the Test Result window.
The error tab contains the details responded from D3 SOAR or third-party API calls, including Failure Indicator, Status Code, and Message. This can help you locate the root cause of a command failure.
Parts in Error | Description | Example |
Failure Indicator | Indicates the command failure that happened at a specific input and/or API call. | Fetch Event failed. |
Status Code | The response code issued by the third-party API server or the D3 SOAR system that can be used to locate the corresponding error category. For example, if the returned status code is 401, the selected connection is unauthorized to run the command. The user or system support would need to check the permission setting in the Exabeam Security Operations Platform portal. Refer to the HTTP Status Code Registry for details. | Status Code: 400. |
Message | The raw data or captured key error message from the integration API server about the API request failure. | Message: Bad request. |
Error Sample Data Fetch Event failed. Status Code: 400. Message: Bad request. |
Get Alert Details
Retrieves details for the specified alert(s) by alert ID(s).
READER NOTE
Alert IDs is a required parameter to run this command.
Run the Search Alerts command to obtain the Alert IDs. Alert IDs can be found in the raw data at the paths $.rows[*].alertId.
Input
Input Parameter | Required/Optional | Description | Example |
Alert IDs | Required | The unique ID(s) of the alert(s) from which to retrieve details. Alert IDs can be obtained with the Search Alerts command. Considering the public API rate limits (100 requests in 1 minute per client source IP address), do not put more than one hundred Alert IDs in one command. |
JSON
|
Output
Error Handling
If the Return Data displays Partially Successful or Failed, an Error tab will appear in the Test Result window.
The error tab contains the details responded from D3 SOAR or third-party API calls, including Failure Indicator, Status Code, and Message. This can help you locate the root cause of a command failure.
Parts in Error | Description | Example |
Failure Indicator | Indicates the command failure that happened at a specific input and/or API call. | Get Alert Details failed. |
Status Code | The response code issued by the third-party API server or the D3 SOAR system that can be used to locate the corresponding error category. For example, if the returned status code is 401, the selected connection is unauthorized to run the command. The user or system support would need to check the permission setting in the Exabeam Security Operations Platform portal. Refer to the HTTP Status Code Registry for details. | Status Code: 400 |
Message | The raw data or captured key error message from the integration API server about the API request failure. | Message: Bad request. |
Error Sample Data Get Alert Details failed. Status Code: 400. Message: Bad request. |
Get Case Details
Retrieves details for the specified case(s) by case ID(s).
READER NOTE
Case IDs is a required parameter to run this command.
Run the Search Cases command to obtain the Case IDs. Case IDs can be found in the raw data at the paths $.rows[*].caseId.
Input
Input Parameter | Required/Optional | Description | Example |
Case IDs | Required | The unique ID(s) of the case(s) from which to retrieve details. Case IDs can be obtained using the Search Cases command. Considering public API rate limits (100 requests in 1 minute per client source IP address), do not put more than 100 Case IDs in one command. |
JSON
|
Output
Error Handling
If the Return Data displays Partially Successful or Failed, an Error tab will appear in the Test Result window.
The error tab contains the details responded from D3 SOAR or third-party API calls, including Failure Indicator, Status Code, and Message. This can help you locate the root cause of a command failure.
Parts in Error | Description | Example |
Failure Indicator | Indicates the command failure that happened at a specific input and/or API call. | Get Case Details failed. |
Status Code | The response code issued by the third-party API server or the D3 SOAR system that can be used to locate the corresponding error category. For example, if the returned status code is 401, the selected connection is unauthorized to run the command. The user or system support would need to check the permission setting in the Exabeam Security Operations Platform portal. Refer to the HTTP Status Code Registry for details. | Status Code: 400. |
Message | The raw data or captured key error message from the integration API server about the API request failure. | Message: Bad request. |
Error Sample Data Get Case Details failed. Status Code: 400. Message: Bad request. |
Search Alerts
Searches for alerts matching one or more search criteria. For example, users can search for alerts associated with a specific caseId and alerts that reference specific rules.
Input
Input Parameter | Required/Optional | Description | Example |
Start Time | Optional | The start time (in UTC) of the duration to search for alerts. By default, the value is 1 day before End Time. | 2024-05-01 00:00:00 |
End Time | Optional | The end time (in UTC) of the duration to search for alerts. By default, the value is the current time. | 2024-06-01 00:00:00 |
Limit | Optional | The maximum number of alerts to return, between 1 to 3000. If this parameter is not defined, all 3000 alerts will be returned. Use Filter and time range (Start Time/End Time) parameters to narrow down returned alerts. | 10 |
Filter | Required | Searches for specific alerts using filters. Refer to Exabeam Search Guide for how to build a search. | caseId:null |
Fields | Optional | The list of fields to be returned from the search. By default, all fields of the alerts will be returned. |
JSON
|
Output
Error Handling
If the Return Data displays Partially Successful or Failed, an Error tab will appear in the Test Result window.
The error tab contains the details responded from D3 SOAR or third-party API calls, including Failure Indicator, Status Code, and Message. This can help you locate the root cause of a command failure.
Parts in Error | Description | Example |
Failure Indicator | Indicates the command failure that happened at a specific input and/or API call. | Search Alerts failed. |
Status Code | The response code issued by the third-party API server or the D3 SOAR system that can be used to locate the corresponding error category. For example, if the returned status code is 401, the selected connection is unauthorized to run the command. The user or system support would need to check the permission setting in the Exabeam Security Operations Platform portal. Refer to the HTTP Status Code Registry for details. | Status Code: 400. |
Message | The raw data or captured key error message from the integration API server about the API request failure. | Message: Bad request. |
Error Sample Data Search Alerts failed. Status Code: 400. Message: Bad request. |
Search Cases
Searches for cases matching one or more search criteria. For example, users can search for cases associated with a specific caseId and cases that reference specific rules.
Input
Input Parameter | Required/Optional | Description | Example |
Start Time | Optional | The start time (in UTC) of the duration to search for cases. By default, the value is 1 day before End Time. | 2024-05-01 00:00:00 |
End Time | Optional | The end time (in UTC) of the duration to search for cases. By default, the value is the current time. | 2024-06-01 00:00:00 |
Limit | Optional | The maximum number of cases to return, between 1 and 3000. If this parameter is not defined, all 3000 cases will be returned. Use Filter and time range (Start Time/End Time) parameters to narrow down returned cases. | 10 |
Filter | Required | Searches for specific cases using filters. Refer to Exabeam Search Guide for how to build a search. | priority: "HIGH" |
Fields | Optional | The list of fields to be returned from the search. By default, all fields of the cases will be returned. |
JSON
|
Output
Error Handling
If the Return Data displays Failed, an Error tab will appear in the Test Result window.
The error tab contains the details responded from D3 SOAR or third-party API calls, including Failure Indicator, Status Code, and Message. This can help you locate the root cause of a command failure.
Parts in Error | Description | Example |
Failure Indicator | Indicates the command failure that happened at a specific input and/or API call. | Search Cases failed. |
Status Code | The response code issued by the third-party API server or the D3 SOAR system that can be used to locate the corresponding error category. For example, if the returned status code is 401, the selected connection is unauthorized to run the command. The user or system support would need to check the permission setting in the Exabeam Security Operations Platform portal. Refer to the HTTP Status Code Registry for details. | Status Code: 400. |
Message | The raw data or captured key error message from the integration API server about the API request failure. | Message: Bad request. |
Error Sample Data Search Cases failed. Status Code: 400. Message: Bad request. |
Test Connection
Performs a health check on an integration connection. Schedule a periodic health check by selecting Connection Health Check when editing an integration connection.
Input
N/A
Output
Error Handling
If the Return Data displays Failed, an Error tab will appear in the Test Result window.
The error tab contains the details responded from D3 SOAR or third-party API calls, including Failure Indicator, Status Code, and Message. This can help you locate the root cause of a command failure.
Parts in Error | Description | Example |
Failure Indicator | Indicates the command failure that happened at a specific input and/or API call. | Test Connection failed. Failed to check the connector. |
Status Code | The response code issued by the third-party API server or the D3 SOAR system that can be used to locate the corresponding error category. For example, if the returned status code is 401, the selected connection is unauthorized to run the command. The user or system support would need to check the permission setting in the Exabeam Security Operations Platform portal. Refer to the HTTP Status Code Registry for details. | Status Code: 400. |
Message | The raw data or captured key error message from the integration API server about the API request failure. | Message: Bad request. |
Error Sample Data Test Connection failed. Failed to check the connector. Status Code: 400. Message: Bad request. |