
Elasticsearch
LAST UPDATED: JULY 30, 2025
Overview
Elasticsearch aggregates and stores data/logs for monitoring and analysis. Predefined queries in Elasticsearch can escalate generated alerts to D3 for investigation of possible security concerns.
D3 SOAR is providing REST operations to function with Elasticsearch.
Elasticsearch is available for use in:
D3 SOAR | V12.7.83.0+ |
Category | SIEM |
Deployment Options |
Known limitations
For performance and historical reasons, App Search has default limitations on some objects and API calls. Please see the table below about query level limits: limitations on API request building.
Standard | Defaults |
Queries Per Request | 10 queries per request |
Query Length | 128 characters [configurable in 7.7+] |
Result Pages | 100 pages |
Results Per Page | 1000 results |
Results Per Query | 10,000 results |
Snippet Result Text Field Size | 1000 characters |
Raw Result Text Field Size | 1000 characters |
Facets | 250 facets [configurable in 7.7+] |
Filters | 32 filters |
Filter Array Items | 1024 array items |
Filter Nesting Levels | 5 levels |
Sorting Fields | 10 fields |
Grouping Fields | 10 fields |
Analytics Tags Per Request | 16 per request [configurable in 7.7+] |
Analytics Tag Length | 64 characters |
App Search hosted on swiftype.com has additional limitations.
Please refer to Limits from Elastic’s documentation for more details.
Connection
To connect to Elasticsearch from D3 SOAR, please follow this part to collect the required information below:
Parameter | Description | Example |
Server URL | The URL of the ElasticSearch server | http://192.***.**.**:**** |
User Name | The user name for authentication | ki********n |
Password | The password for authentication | D3******* |
Permission Requirements
Each endpoint in the Elasticsearch API requires a certain permission scope. The following scopes are required scopes for each command in this integration:
READER NOTE
If you want to indicate a user API key, you will need to grant the manage_api_key cluster privilege. D3 does not currently require an API key input, but you can still enable that option as needed.
The authenticated user will always be the owner of newly created API keys.
With the manage_api_key cluster privilege, you can invalidate your own API keys and those owned by other users.
Command | Required Permission |
Create Event | Index privileges: create_index + create_doc |
Create Index | Index privileges: create_index |
Fetch Event | Build-in Role: viewer |
Get Index Mapping | Build-in Role: viewer |
List Indices | Cluster privileges: monitor + Index privileges: monitor |
Query | Build-in Role: viewer |
Simple Query | Build-in Role: viewer |
Test Connection | Build-in Role: viewer |
Configuring Elasticsearch to Work with D3 SOAR
Log in to the Elasticsearch platform.
READER NOTE
Please refer to Elasticsearch’s Quick Start Guide for more on managing your service.
Click on the hamburger menu in the top left corner to reveal the sidebar menu, then select Stack Management under Management.
Select Users under Security, then click Create user.
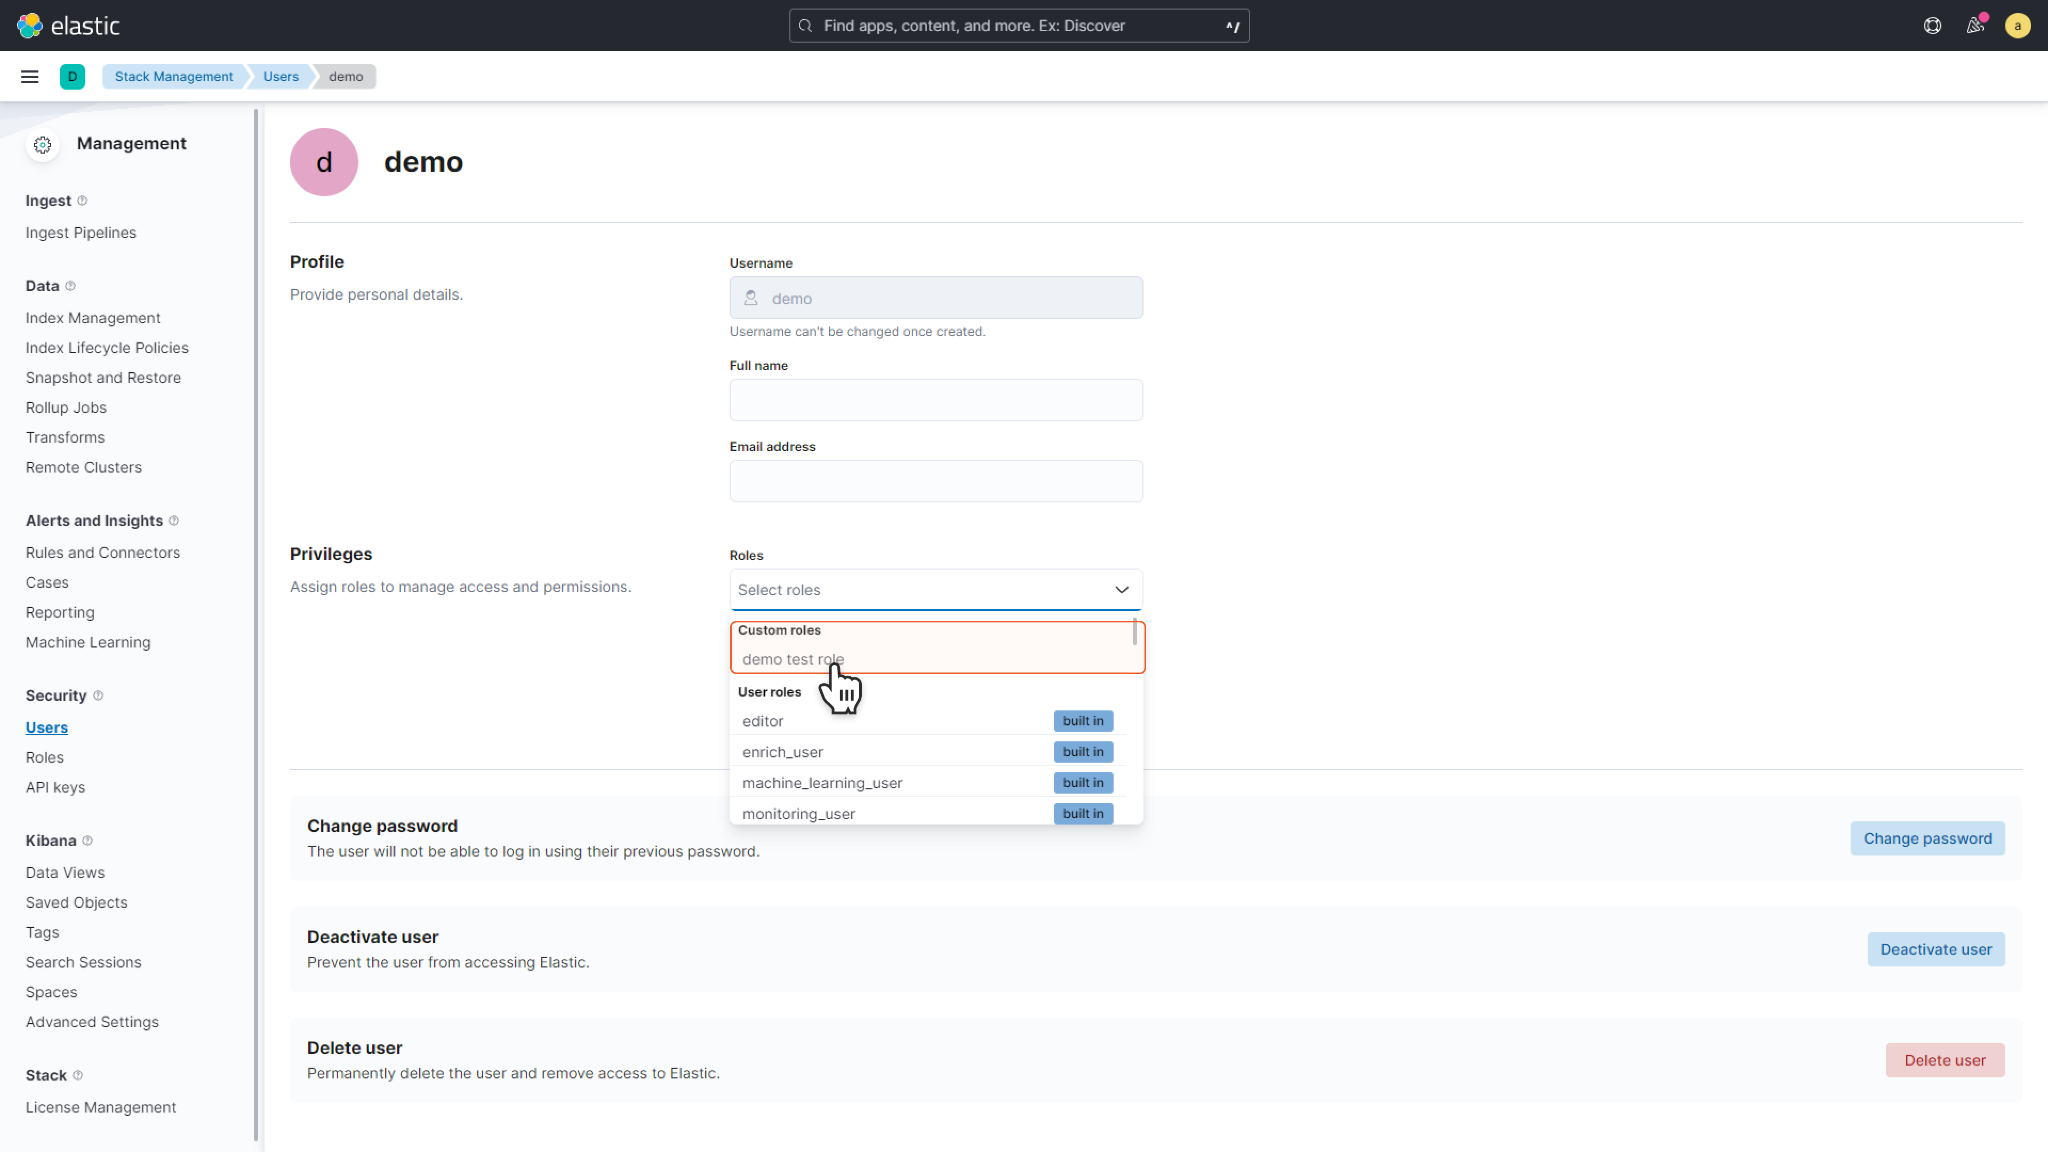
Input the Username and Password. Choose the Roles you want to grant to the user. Click Create User to confirm you configurations.
If the role you want to grant is not found in the built-in role list, follow the steps below to create custom roles.
Select Roles under Security, then click Create role.
Name your customized roles. Use the drop-down menu to select Cluster privileges and Index privileges as desired. Click Create role to confirm your configurations.
READER NOTE
If you want to use index privileges, input * in the indices section.
c. Return to Users and find the user you have created. You can grant the custom role to the user using the Roles dropdown menu. Click Update user to confirm your configurations.
Configuring D3 SOAR to Work with Elasticsearch
Log in to D3 SOAR.
Find the Elasticsearch integration.
.png?inst-v=9d16beaf-952a-4ae4-8fe8-e35f7a3745da)
Navigate to Configuration on the top header menu.
Click on the Integration icon on the left sidebar.
Type Elasticsearch in the search box to find the integration, then click it to select it.
Click New Connection, on the right side of the Connections section. A new connection window will appear.
Configure the following fields to create a connection to Elasticsearch.
.png?inst-v=9d16beaf-952a-4ae4-8fe8-e35f7a3745da)
Connection Name: The desired name for the connection.
Site: Specifies the site to use the integration connection. Use the drop-down menu to select the site. The Share to Internal Sites option enables all sites defined as internal sites to use the connection. Selecting a specific site will only enable that site to use the connection.
Recipient site for events from connections Shared to Internal Sites: This field appears if you selected Share to Internal Sites for Site to let you select the internal site to deploy the integration connection.
Agent Name (Optional): Specifies the proxy agent required to build the connection. Use the dropdown menu to select the proxy agent from a list of previously configured proxy agents.
Description (Optional): Add your desired description for the connection.
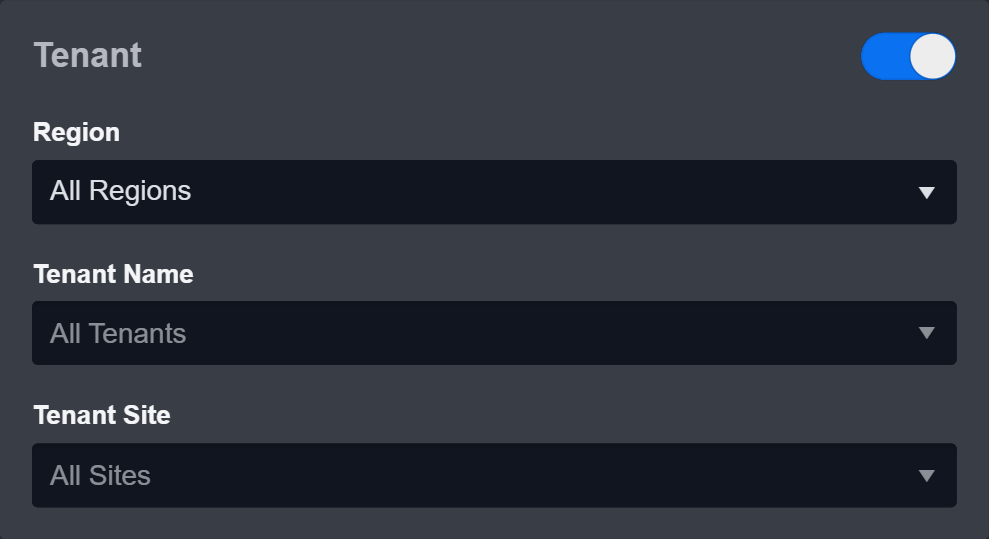
Tenant (Optional): When configuring the connection from a master tenant site, you have the option to choose the specific tenant sites you want to share the connection with. Once you enable this setting, you can filter and select the desired tenant sites from the drop-downs to share the connection.
Configure User Permissions: Defines which users have access to the connection.
Active: Check the tick box to ensure the connection is available for use.
System: This section contains the parameters defined specifically for the integration. These parameters must be configured to create the integration connection.
.png?inst-v=9d16beaf-952a-4ae4-8fe8-e35f7a3745da)
1. Input your domain level Server URL.
2. Input your User Name.
3. Input your Password.Connection Health Check: Updates the connection status you have created. A connection health check is done by scheduling the Test Connection command of this integration. This can only be done when the connection is active.
To set up a connection health check, check the Connection Health Check tickbox. You can customize the interval (minutes) for scheduling the health check. An email notification can be set up after a specified number of failed connection attempts.
Enable Password Vault: An optional feature that allows users to take the stored credentials from their own password vault. Please refer to the password vault connection guide if needed.
Test the connection.
Click Test Connection to verify the account credentials and network connection. If the Test Connection Passed alert window appears, the test connection is successful. You will see Passed with a green checkmark appear beside the Test Connection button. If the test connection fails, please check your connection parameters and try again.
Click OK to close the alert window.
Click + Add to create and add the configured connection.
Configuring D3 Webhook with Elasticsearch
D3 SOAR Webhook Configuration
In the following example, we will walk you through the process of creating a new Webhook in D3 and Elasticsearch.
The example below demonstrates the process of creating a new Webhook in D3 SOAR and Elasticsearch.
.png?inst-v=9d16beaf-952a-4ae4-8fe8-e35f7a3745da)
Log in to your D3 SOAR environment.
Navigate to Configuration.
Navigate to Integration > Search for “Elasticsearch”. Click “Fetch Event”.
Click Set up Webhook Keys.
Under Event Ingestion, Click +. Select the site for the webhook integration, then click Generate.
READER NOTE
Please note that if you choose Shared to All Internal Sites, D3 will ask you to select a more specific site when generating the Request URL, since a specific site destination is needed when generating links. Use the drop-down to select your desired site.
Copy the Request URL, Request Header Key and Value for configuring Elasticsearch in later steps.
Elasticsearch Setup
Log in to the Elasticsearch platform.
Click on the hamburger menu in the top left corner to reveal the sidebar menu, then select Stack Management under Management.
Navigate to Rules and Connectors under Alerts and Insights.
Select Connectors, then click Create Connector.
Choose the Webhook. Please note that the Webhook connector requires an Elasticsearch Golden license, please check your current license and make sure you have access to this connector.
Input the previously saved request URL into the URL field. Enable the Add HTTP Header option, then input the previously saved Request Header Key and Value to the corresponding fields. Click Add, then save your changes. Please refer to Configuring D3 Webhook with Elasticsearch>D3 SOAR Webhook Configuration for how to get the required information.
You may also run the test to verify whether the webhook has been set up properly.
Commands
Elasticsearch includes the following executable commands for users to set up schedules or create playbook workflows. With the Test Command, you can execute these commands independently for playbook troubleshooting.
Integration API Note
For more information about the Elasticsearch API, please refer to the Elasticsearch API reference.
READER NOTE
Certain permissions are required for each command. Please refer to the Permission Requirements and Configuring Elasticsearch to Work with D3 SOAR for details.
Integration Designed Query
Some commands (Fetch Event, Query and Simple Query) require structured input arguments in Elasticsearch designed query formats.
By default, Elasticsearch sorts matching search results by relevance score, which measures how well each document matches a query. The relevance score is a positive floating-point number, returned in the _score metadata field of the search API. The higher the _score, the more relevant the document. While each query type can calculate relevance scores differently, score calculation also depends on whether the query clause is run in a query or filter context.
Query clause measures whether the document matches the query input and calculates a relative score. No relative score will be calculated by using Filter clause.
Please refer to Query and Filter Context from Elasticsearch’s documentation for more details.
Note for Time-related parameters
The input format of time-related parameters may vary based on your account settings. As a result, the sample data provided in our commands is different from what you see. To set your preferred time format, follow these steps:
Navigate to Configuration > Application Settings. Select Date/Time Format.
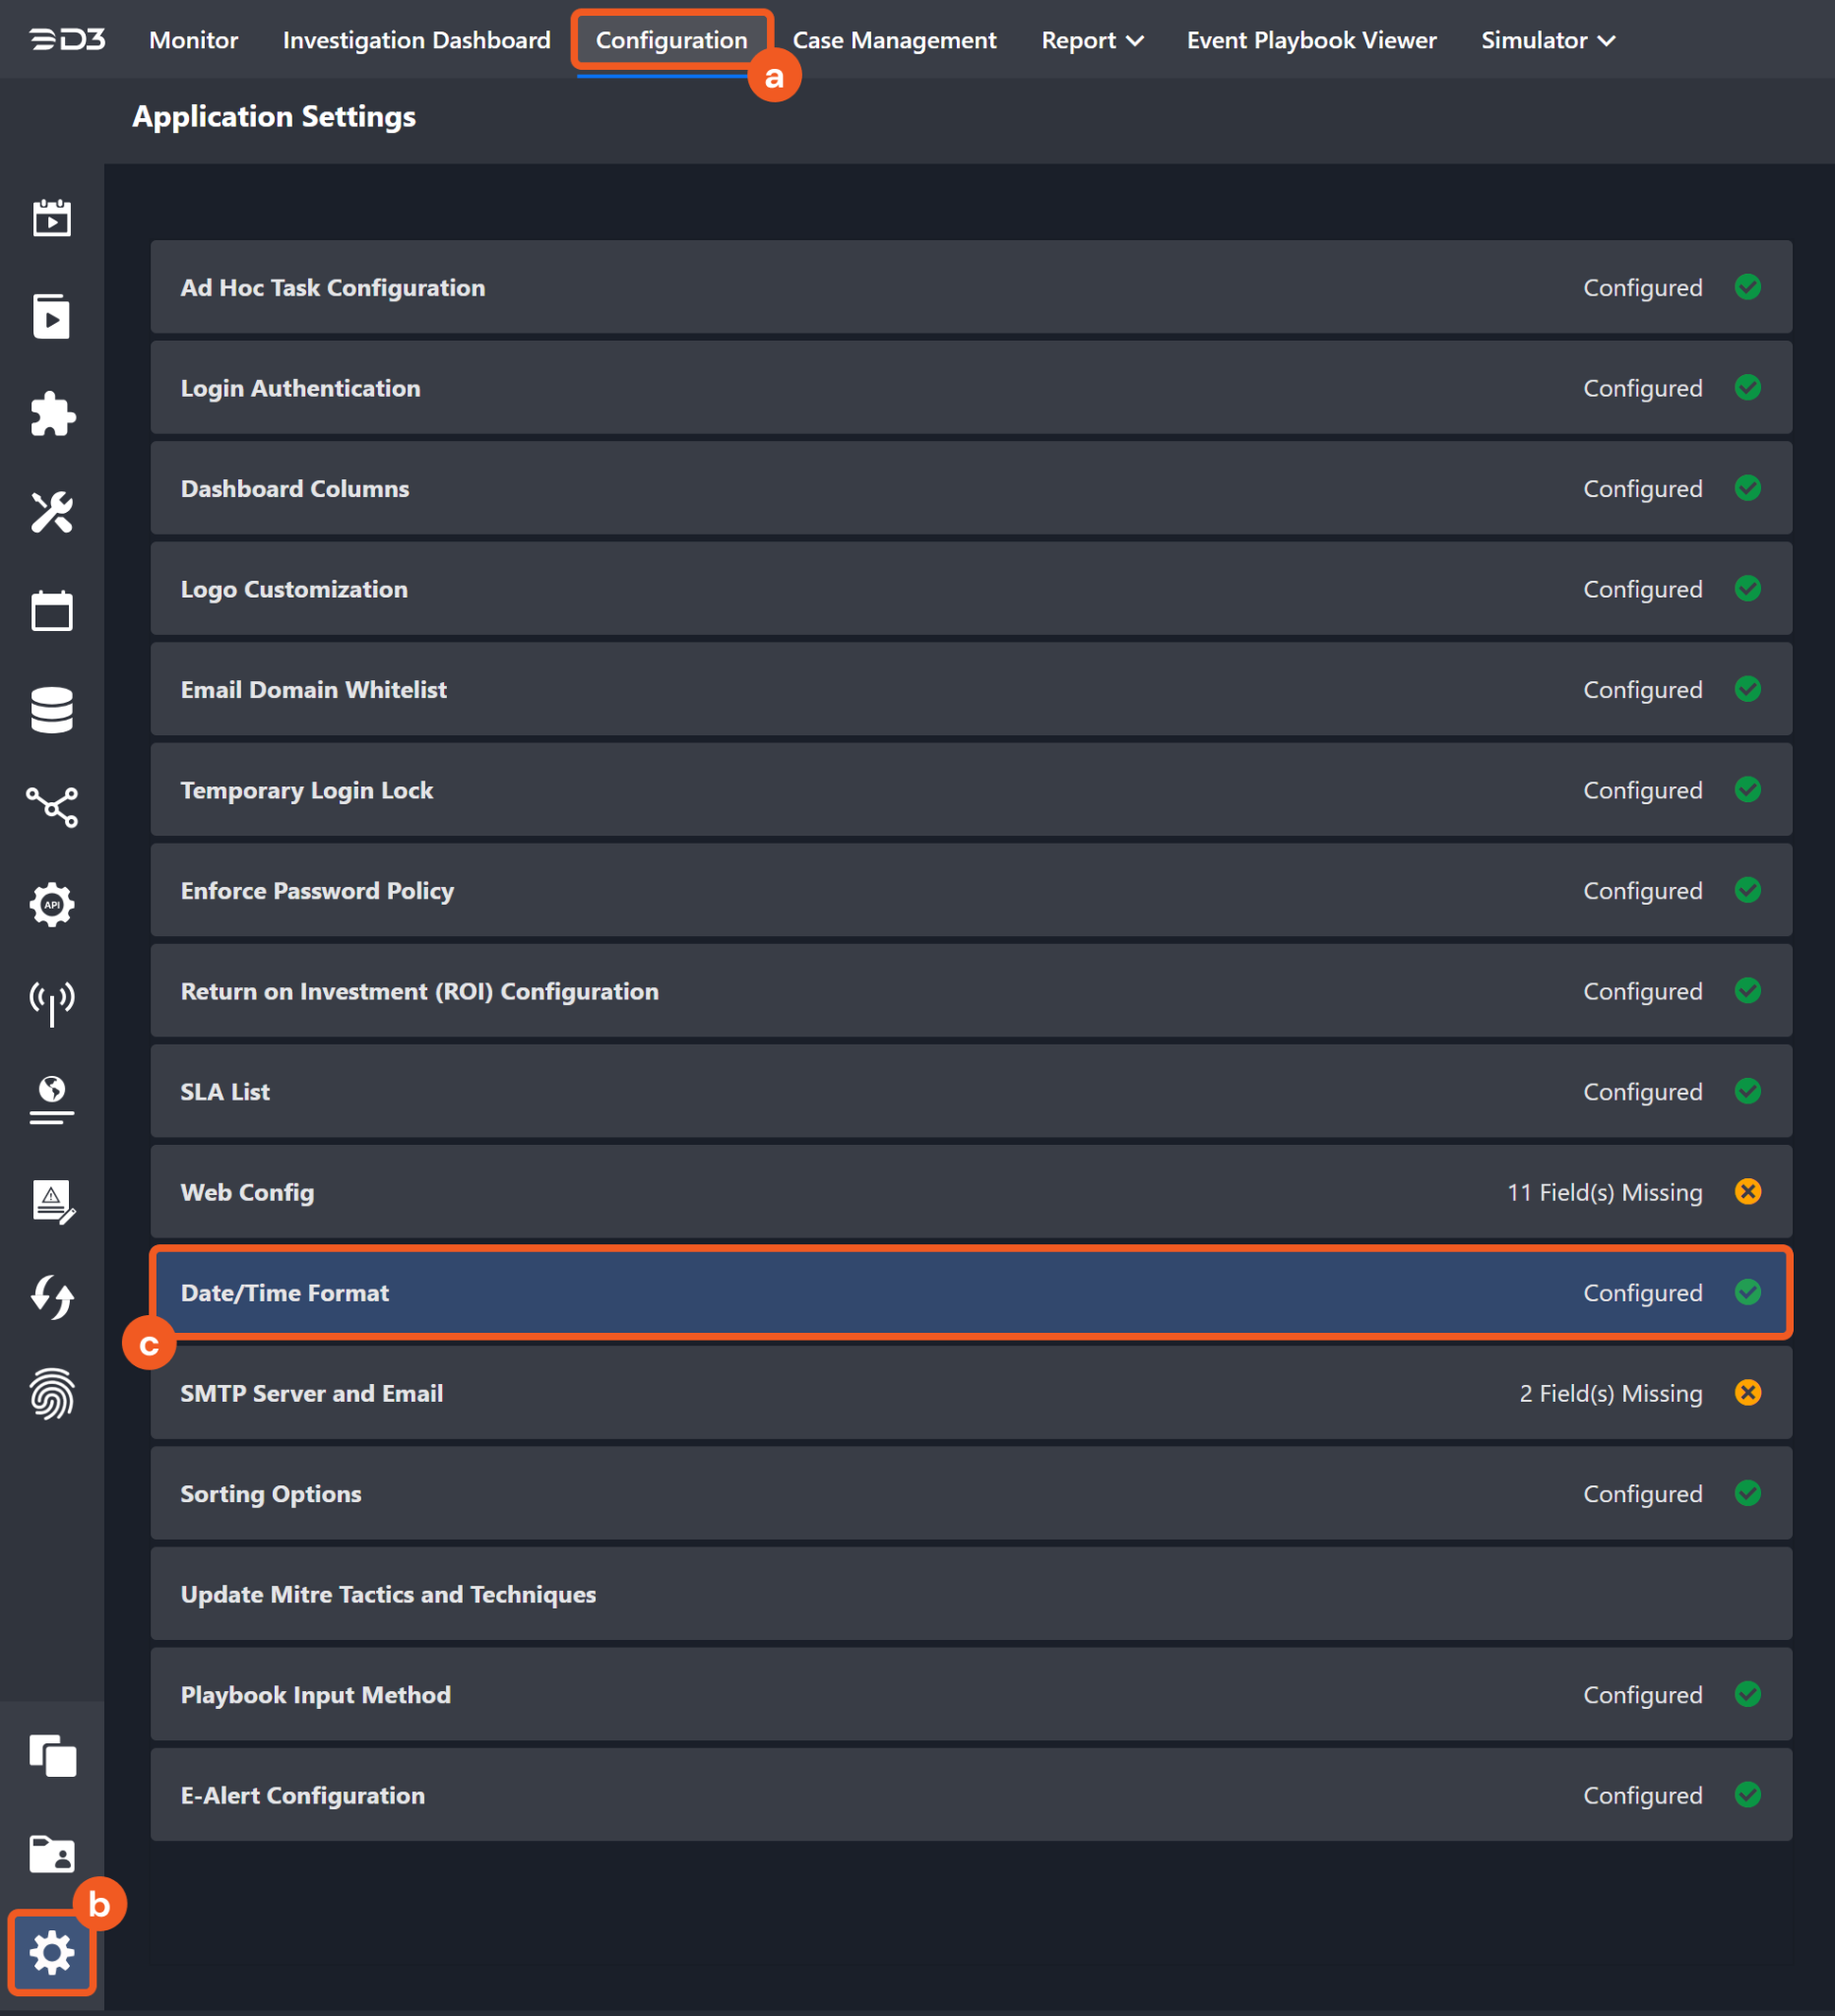
Choose your desired date and time format.
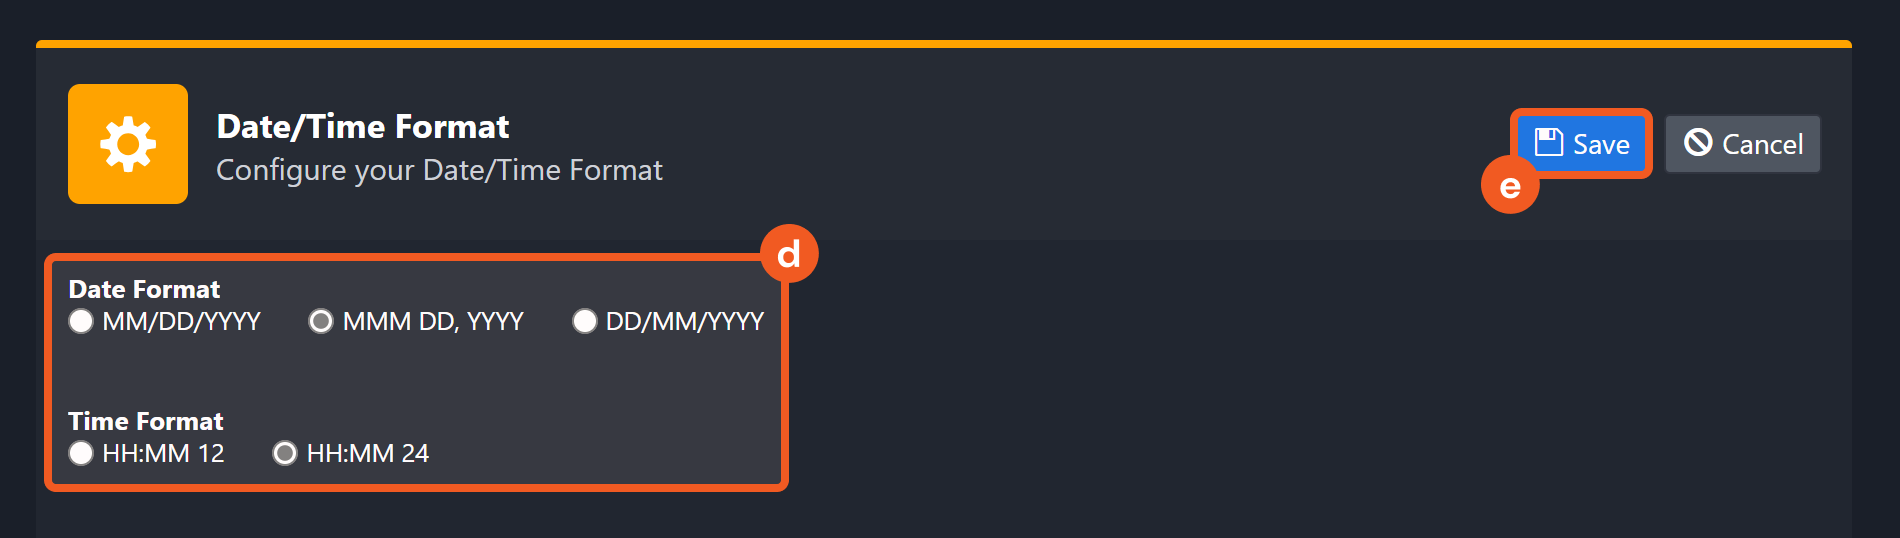
After that, you will be able to view your preferred time format when configuring the DateTime input parameters for commands.
Create Event
Creates a new event in the specified index.
READER NOTE
Index Name is a required parameter to run this command.
Run the List Indices command to obtain Index Name. Index Name can be found in the returned raw data at the path $[*].index.
Please note:
If your input Event ID already exists, no new event will be created and the existing event will be updated.
If you input an Event ID in the JSON object input of Event ID field, it must match the value of the Event ID field. Otherwise, the value you input into the Event ID field will be ignored.
Input
Input Parameter | Required/Optional | Description | Example |
Index Name | Required | The name of the index to which the event is added. | ev***********g |
Event ID | Optional | The ID of the event to be created. If not specified, the system will create an event ID. | 1*** |
Event Object | Required | The JSON object of the event to be created. |
CODE
|
Output
Error Handling
If the Return Data is Failed, an Error tab will appear in the Test Result window.
The error tab contains the details responded from D3 SOAR or third-party API calls, including Failure Indicator, Status Code, and Message. This can help you locate the root cause of a command failure.
Parts in Error | Description | Example |
Failure Indicator | Indicates the command failure that happened at a specific input and/or API call. | Create Event failed. |
Status Code | The response code issued by the third-party API server or the D3 SOAR system that can be used to locate the corresponding error category. For example, if the returned status code is 401, the selected connection is unauthorized to run the command. The user or system support would need to check the permission setting in the Elasticsearch portal. Refer to the HTTP Status Code Registry for details. | Status Code: 401. |
Message | The raw data or captured key error message from the integration API server about the API request failure. | Message: Unable to authenticate user. |
Error Sample Data Create Event failed. Status Code: 401. Message: Unable to authenticate user. |
Create Index
Creates a new index to an Elasticsearch cluster. Please refer to "Create index API | Elasticsearch Guide [8.3] | Elastic" for more on index objects.
Input
Input Parameter | Required/Optional | Description | Example |
Index Name | Required | The name of the index to be created | ev*****gs1216d |
Index Aliases | Optional | The aliases of the index to be created | { "Alias-x86_64": { "filter": { "term": { "architecture": "x86_64" } }, "routing": "shard-1" } } |
Index Settings | Optional | The configuration options for the index | { "number_of_shards": 1, "number_of_replicas": 1 } |
Index Mappings | Optional | The mapping for fields in the index. | { "properties": { "timestamp": { "type": "date" } } } |
Output
Error Handling
If the Return Data is Failed, an Error tab will appear in the Test Result window.
The error tab contains the details responded from D3 SOAR or third-party API calls, including Failure Indicator, Status Code, and Message. This can help you locate the root cause of a command failure.
Parts in Error | Description | Example |
Failure Indicator | Indicates the command failure that happened at a specific input and/or API call. | Create Index failed. |
Status Code | The response code issued by the third-party API server or the D3 SOAR system that can be used to locate the corresponding error category. For example, if the returned status code is 401, the selected connection is unauthorized to run the command. The user or system support would need to check the permission setting in the Elasticsearch portal. Refer to the HTTP Status Code Registry for details. | Status Code: 400. |
Message | The raw data or captured key error message from the integration API server about the API request failure. | Message: Index already exists. |
Error Sample Data Create Index failed. Status Code: 400. Message: Index already exists. |
Fetch Event
Returns Event(s) from the platform based on specified criteria.
READER NOTE
Index is a required parameter to run this command.
Run the List Indices command to obtain the Index. Index names can be found in the returned raw data at the path $[*].index.
Input
Input Parameter | Required/Optional | Description | Example |
Start Time | Required | The Start Time (UTC Time) of the time range for fetching Event(s). The Start Time/End Time map to event.ingested time which is the timestamp when an event arrived in the central data store. | 2021-12-15 00:00 |
End Time | Required | The End Time (UTC Time) of the time range for fetching Event(s). The Start Time/End Time map to event.ingested time which is the timestamp when an event arrived in the central data store. | 2022-03-30 00:00 |
Top Recent Event Number | Optional | The maximum number of events to return. The default value of this field is 20. | 20 |
Index | Required | The name of the index to search. The index name can be obtained from the "List Indices" command. If this field is not defined, events of any index will be returned. | .monitoring-**-*-****.**.05 |
Search Condition | Optional | The queries in JSON format to filter results. Note: A timestamp field can be specified in the sort property to search based on time. The timestamp field can be obtained by the “Get Index Mapping” command. For example, if query is { "query": { "bool": { "must": [{"match": { "source_node.host": "192.***.**.**" }}, { "match": { "source_node.name": "iM****u" }} ]}}, "sort": [ { "@timestamp": "desc" }] }, then it will search all documents that the source_node.host field contains “192.***.**.**” and the source_node field contains “iM****u'' and search based on the @timestamp field. If sort property is not specified, the returned events are sorted by @timestamp in descending order. For details about the query syntax, please refer to Query and filter context | Elasticsearch Guide [8.12] | Elastic from Elasticsearch’s documentation. |
CODE
|
Output
Fetch Event Field Mapping
Please note that Fetch Event commands require event field mapping. Field mapping plays a key role in the data normalization process part of the event pipeline. Field mapping converts the original data fields from the different providers to the D3 fields which are standardized by the D3 Model. Please refer to Event and Incident Intake Field Mapping for details.
To customize field mapping, click + Add Field and add the custom field of your choice. You can also remove built-in field mappings by clicking x. Please note that two underscore characters will automatically prefix the defined Field Name as the System Name for a custom field mapping. Additionally, if an input Field Name contains any spaces, they will automatically be replaced with underscores for the corresponding System Name.
As a system integration, the Elasticsearch integration has some pre-configured field mappings for default field mapping.
Default Event Source
The Default Event Source is the default set of field mappings that are applied when this fetch event command is executed. For out-of-the-box integrations, you will find a set of field mapping provided by the system. Default event source provides field mappings for common fields from fetched events (e.g., Index and Score). The default event source has a “Main Event JSON Path” (i.e., $.hits.hits) that is used to extract a batch of events from the response raw data. Click Edit Main JSON Path to view the “Main Event JSON Path”..png?inst-v=9d16beaf-952a-4ae4-8fe8-e35f7a3745da)
Main Event JSON Path: $.hits.hits
The Main Event JSON Path determines the root path where the system starts parsing raw response data into D3 event data. The JSON path begins with $, representing the root element. The path is formed by appending a sequence of child elements to $, each separated by a dot (.). Square brackets with nested quotation marks ([‘...’]) should be used to separate child elements in JSON arrays.For example, the root node of a JSON Path is hits.hits. The child node denoting the Unique Event Key field would be _id. Putting it together, the JSON Path expression to extract the Unique Event Key is $.hits.hits._id.
Field Name | Source Field |
Unique Event Key | _id |
Index | _index |
Score | _score |
Event Type | ._source._type |
Start Time | ._source.timestamp |
Description | ._source.description |
Event Action | ._source.action |
Error Handling
If the Return Data is Failed, an Error tab will appear in the Test Result window.
The error tab contains the details responded from D3 SOAR or third-party API calls, including Failure Indicator, Status Code, and Message. This can help you locate the root cause of a command failure.
Parts in Error | Description | Example |
Failure Indicator | Indicates the command failure that happened at a specific input and/or API call. | Fetch Event Failed. |
Status Code | The response code issued by the third-party API server or the D3 SOAR system that can be used to locate the corresponding error category. For example, if the returned status code is 401, the selected connection is unauthorized to run the command. The user or system support would need to check the permission setting in the Elasticsearch portal. Refer to the HTTP Status Code Registry for details. | Status Code: 404. |
Message | The raw data or captured key error message from the integration API server about the API request failure. | Message: Index Not Found. |
Error Sample Data Fetch Event Failed. Status Code: 403. Message: Index Not Found. |
Get Index Mapping
Retrieves mapping definitions for the specified index.
READER NOTE
Index is a required parameter to run this command.
Run the List Indices command to obtain the Index. Index Name can be found in the returned raw data at the path $[*].index.
Input
Input Parameter | Required/Optional | Description | Example |
Index | Required | The name of the index to search. The index name can be obtained using the List Indices command | .monitoring-**-*-****.**.05 |
Output
Error Handling
If the Return Data is Failed, an Error tab will appear in the Test Result window.
The error tab contains the details responded from D3 SOAR or third-party API calls, including Failure Indicator, Status Code, and Message. This can help you locate the root cause of a command failure.
Parts in Error | Description | Example |
Failure Indicator | Indicates the command failure that happened at a specific input and/or API call. | Get Index Mapping failed. |
Status Code | The response code issued by the third-party API server or the D3 SOAR system that can be used to locate the corresponding error category. For example, if the returned status code is 401, the selected connection is unauthorized to run the command. The user or system support would need to check the permission setting in the Elasticsearch portal. Refer to the HTTP Status Code Registry for details. | Status Code: 404. |
Message | The raw data or captured key error message from the integration API server about the API request failure. | Message: Index Not Found, no such Index. |
Error Sample Data Get Index Mapping failed. Status Code: 404. Message: Index Not Found, no such Index. |
List Indices
Returns high-level information about indices in a cluster, including backing indices for data streams.
Input
N/A
Output
Error Handling
If the Return Data is Failed, an Error tab will appear in the Test Result window.
The error tab contains the details responded from D3 SOAR or third-party API calls, including Failure Indicator, Status Code, and Message. This can help you locate the root cause of a command failure.
Parts in Error | Description | Example |
Failure Indicator | Indicates the command failure that happened at a specific input and/or API call. | List Indices failed. |
Status Code | The response code issued by the third-party API server or the D3 SOAR system that can be used to locate the corresponding error category. For example, if the returned status code is 401, the selected connection is unauthorized to run the command. The user or system support would need to check the permission setting in the Elasticsearch portal. Refer to the HTTP Status Code Registry for details. | Status Code: 401. |
Message | The raw data or captured key error message from the integration API server about the API request failure. | Message: Unable to authenticate user. |
Error Sample Data List Indices failed. Status Code: 401. Message: Unable to authenticate user. |
Query
Retrieves results with query and index.
READER NOTE
Index is a required parameter to run this command.
Run the List Indices command to obtain the Index. Index Name can be found in the returned raw data at the path $[*].index.
Input
Input Parameter | Required/Optional | Description | Example |
Index | Required | The index for the query (e.g. "logstash-*"). The index name can be obtained from the List Indices command. | ev*****gs |
Query | Required | The filters in JSON format. For more about the query syntax, please refer to Query and filter context | Elasticsearch Guide [8.3] | Elastic. |
CODE
|
Output Fields | Optional | The field list to parse search result details in hints[*]._source. | [ "eventId", "utcTime", "FQDN", "hostname", "processGuid", "processId", "description", "product", "company", "commandLine", "user", "integrityLevel", "parentCommandLine", "timestamp" ] |
Size | Optional | The number of results to return. When the input has no value or is not a positive number, the default value 10 will be used. | 3 |
Offset | Optional | The number of items to skip before starting to collect the result set. When the input has no value or is not a positive number, the default value 0 will be used. | 3 |
Output
Error Handling
If the Return Data is Failed, an Error tab will appear in the Test Result window.
The error tab contains the details responded from D3 SOAR or third-party API calls, including Failure Indicator, Status Code, and Message. This can help you locate the root cause of a command failure.
Parts in Error | Description | Example |
Failure Indicator | Indicates the command failure that happened at a specific input and/or API call. | Query failed. |
Status Code | The response code issued by the third-party API server or the D3 SOAR system that can be used to locate the corresponding error category. For example, if the returned status code is 401, the selected connection is unauthorized to run the command. The user or system support would need to check the permission setting in the Elasticsearch portal. Refer to the HTTP Status Code Registry for details. | Status Code: 404. |
Message | The raw data or captured key error message from the integration API server about the API request failure. | Message: Index Not Found, no such Index. |
Error Sample Data Query failed. Status Code: 404. Message: Index Not Found, no such index. |
Simple Query
Returns results based on a provided query string, using a parser with a limited but fault-tolerant syntax. It ignores any invalid parts of the query string.
READER NOTE
Index is an optional parameter to run this command.
Run the List Indices command to obtain the Index. Index Name can be found in the returned raw data at the path $[*].index.
Input
Input Parameter | Required/Optional | Description | Example |
Index | Optional | Specifies the name of the index to search. The index name can be obtained from the "List Indices" command | .monitoring-**-*-****.**.05 |
Query | Optional | The query string to search. For more about the simple query string syntax,refer to Simple query string query | Elasticsearch Guide [8.3] | Elastic. | John | Tom |
Limit | Optional | The number of hits to return. The default value of this field is 10. | 10 |
Output
Error Handling
If the Return Data is Failed, an Error tab will appear in the Test Result window.
The error tab contains the details responded from D3 SOAR or third-party API calls, including Failure Indicator, Status Code, and Message. This can help you locate the root cause of a command failure.
Parts in Error | Description | Example |
Failure Indicator | Indicates the command failure that happened at a specific input and/or API call. | Simple Query failed. |
Status Code | The response code issued by the third-party API server or the D3 SOAR system that can be used to locate the corresponding error category. For example, if the returned status code is 401, the selected connection is unauthorized to run the command. The user or system support would need to check the permission setting in the Elasticsearch portal. Refer to the HTTP Status Code Registry for details. | Status Code: 404. |
Message | The raw data or captured key error message from the integration API server about the API request failure. | Message: Index Not Found, no such Index. |
Error Sample Data Simple Query failed. Status Code: 404. Message: Index Not Found, no such Index. |
Test Connection
Allows you to perform a health check on an integration connection. You can schedule a periodic health check by selecting Connection Health Check when editing an integration connection.
Input
N/A
Output
Error Handling
If the Return Data is Failed, an Error tab will appear in the Test Result window.
The error tab contains the details responded from D3 SOAR or third-party API calls, including Failure Indicator, Status Code, and Message. This can help you locate the root cause of a command failure.
Parts in Error | Description | Example |
Failure Indicator | Indicates the command failure that happened at a specific input and/or API call. | Test Connection failed. Failed to check the connector. |
Status Code | The response code issued by the third-party API server or the D3 SOAR system that can be used to locate the corresponding error category. For example, if the returned status code is 401, the selected connection is unauthorized to run the command. The user or system support would need to check the permission setting in the Elasticsearch portal. Refer to the HTTP Status Code Registry for details. | Status Code: 403. |
Message | The raw data or captured key error message from the integration API server about the API request failure. | Message: Unable to authenticate user. |
Error Sample Data Test Connection failed. Failed to check the connector. Status Code: 401. Message: Unable to authenticate user |