
Elastic Security
LAST UPDATED: AUG 14, 2025
Overview
Elastic Security combines SIEM threat detection features with endpoint prevention and response capabilities in one solution. These analytical and protection capabilities, leveraged by the speed and extensibility of Elasticsearch, enable analysts to defend their organization from threats before damage and loss occur. D3's integration with Elastic Security APIs provides the ability to ingest alerts or cases to D3 as events, bi-directional operations on alerts and cases, and manages the endpoints with isolate or release actions.
D3 SOAR is providing REST operations to function with Elastic Security.
Elastic Security is available for use in:
D3 SOAR | V15.1.23.0+ |
Category | SIEM |
Deployment Options |
Connection
To connect to Elastic Security from D3 SOAR, follow this part to collect the required information below:
Parameter | Description | Example |
Server URL | The server URL of the Elastic Security server. | HTTP://1.1.1.1:9201 |
User Name | The user name to establish the API connection. | kibanaadmin |
Password | The password to authenticate the API connection. | D3******* |
API Version | The version of the API to use for the connection. | 8.3 |
Permission Requirements
Each endpoint in the Elastic Security API requires a certain permission scope. The following are required scopes for the commands in this integration:
Command | Required Permission |
Add Case Comment | N/A |
Create Case | N/A |
Fetch Event | N/A |
Isolate Endpoints | Superuser role + And at least a Platinum license |
List Actions | N/A |
List Cases | N/A |
List Connectors | N/A |
List Endpoints | N/A |
List Processes | Superuser role + And at least an Enterprise license |
List Rules | N/A |
List Spaces | N/A |
List Tags | N/A |
Release Endpoints | Superuser role |
Suspend Processes | Superuser role + And at least an Enterprise license |
Terminate Processes | Superuser role + And at least an Enterprise license |
Update Alerts | N/A |
Test Connection | N/A |
Elastic Security is using role-based access control (RBAC). Therefore, the command permissions are inherited from the user account’s role. Users need to configure their user profile from the Elastic Security console for each command in this integration.
READER NOTE
Refer to Built-in roles for details on Elastic Security roles.
Configuring Elastic Security to Work with D3 SOAR
Refer to Minimal security setup to enable the security feature.
Creating Users and Assigning Roles
Log in to the Elasticsearch platform.
READER NOTE
Refer to Elastic’s Get started for more on managing services.
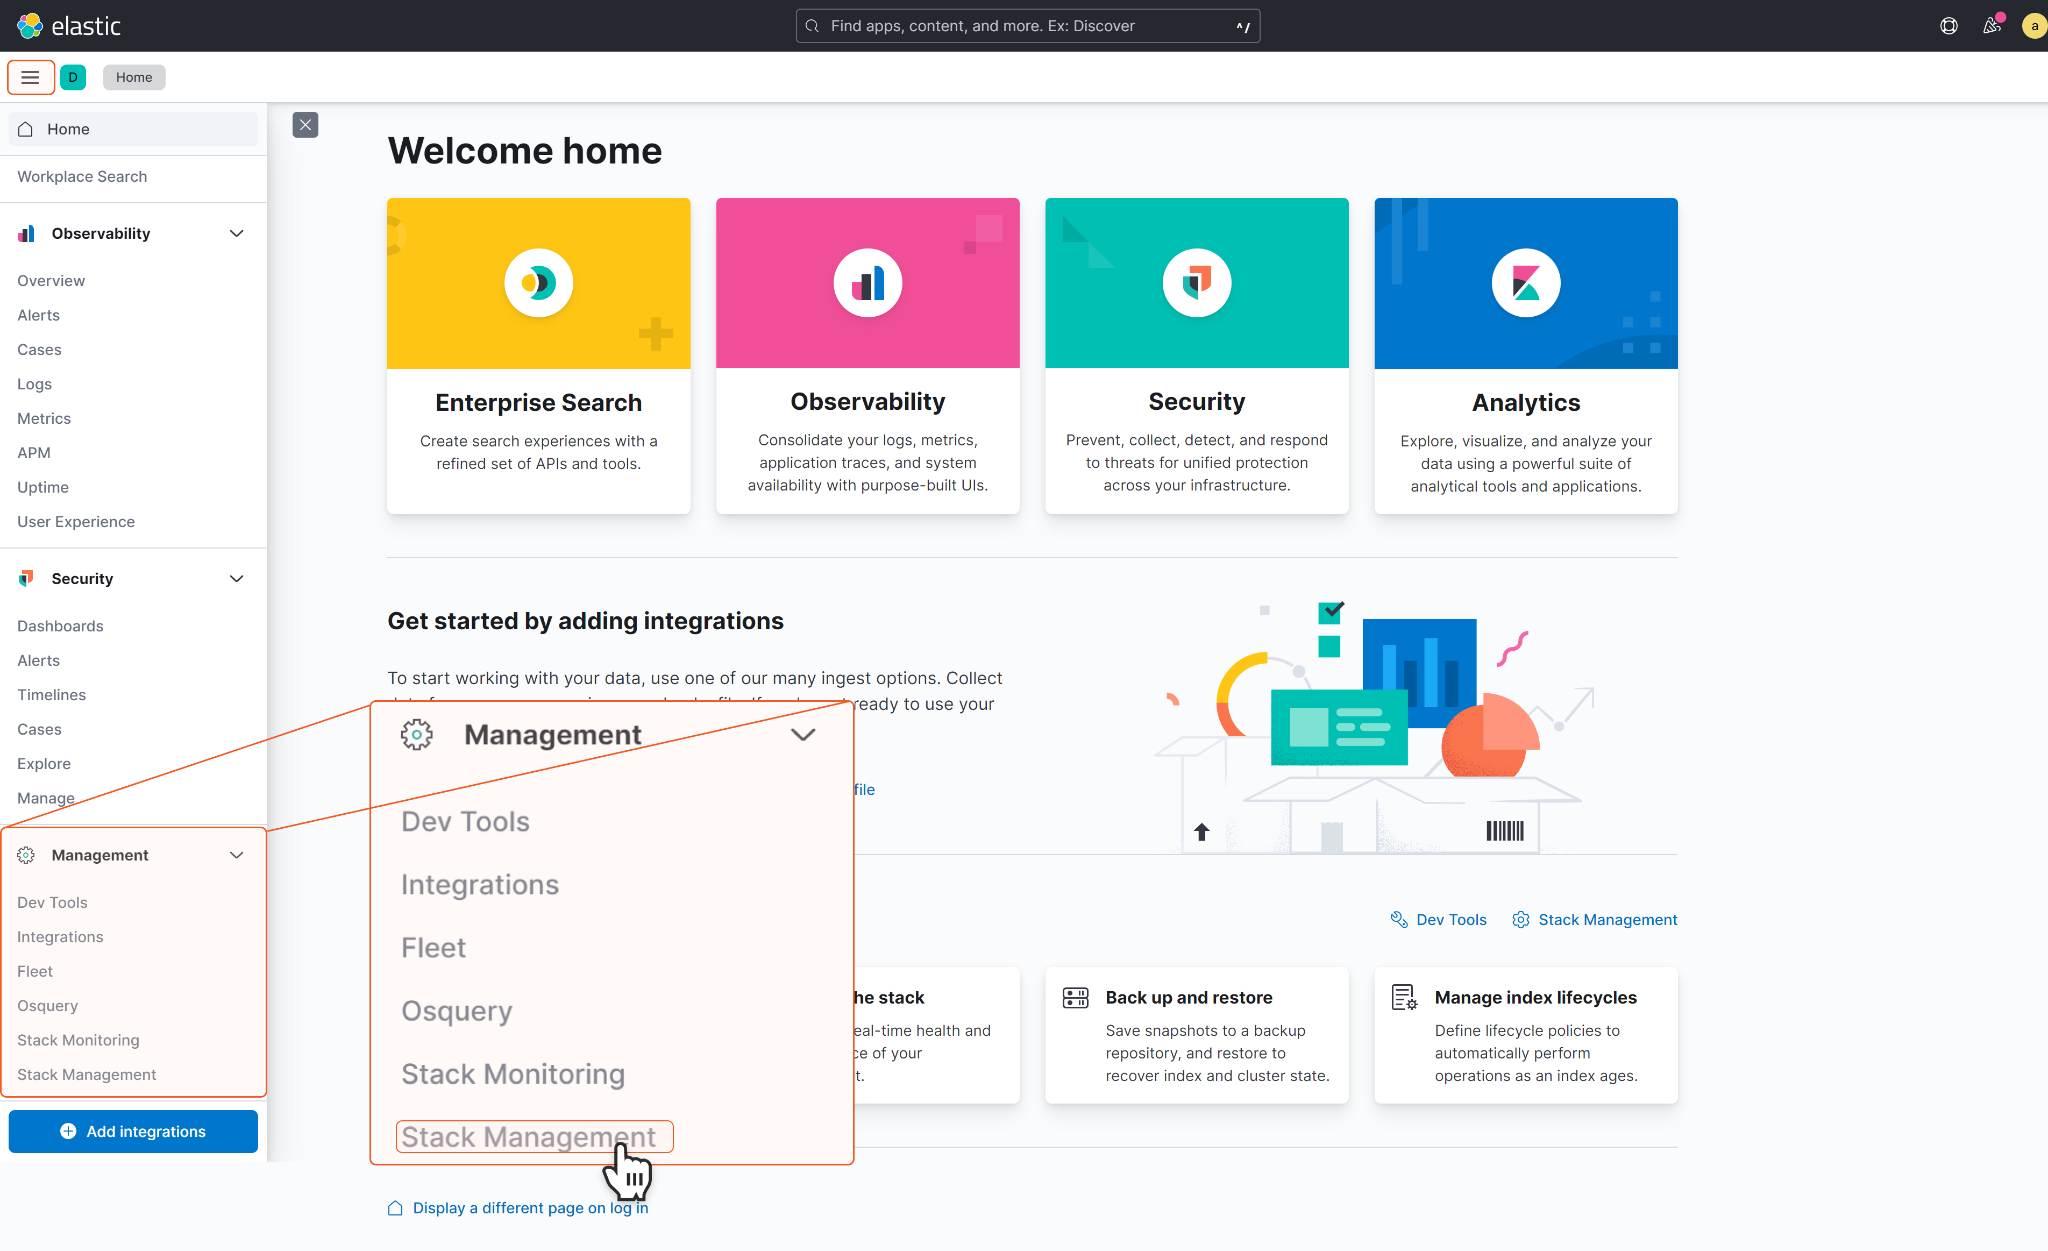
Click on the hamburger menu in the top left corner to reveal the sidebar menu, then select Management > Stack Management.
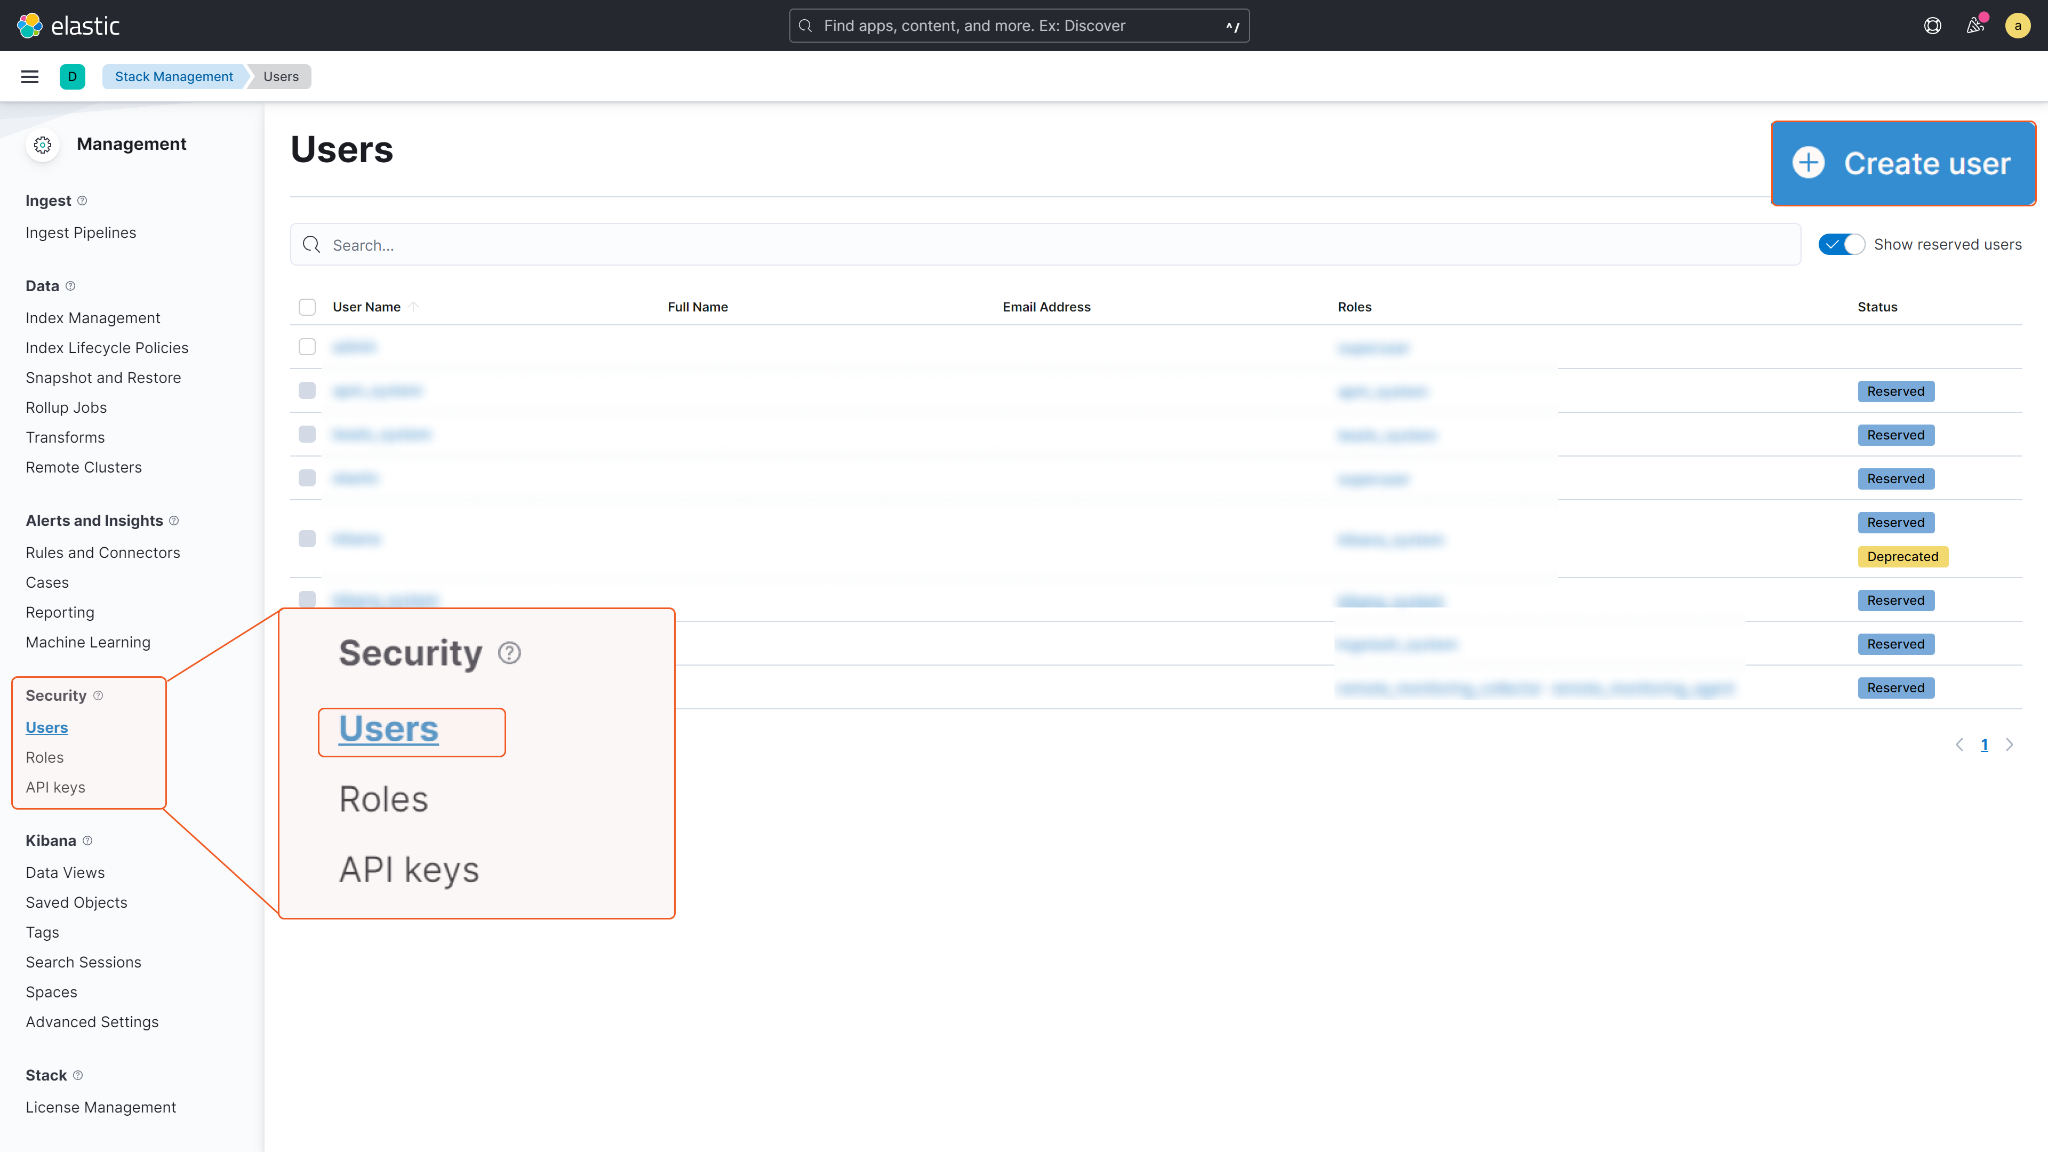
Select Security > Users, then click Create user.
Input the Username and Password. Choose the Roles to grant to the user. Click Create User to confirm the configurations.
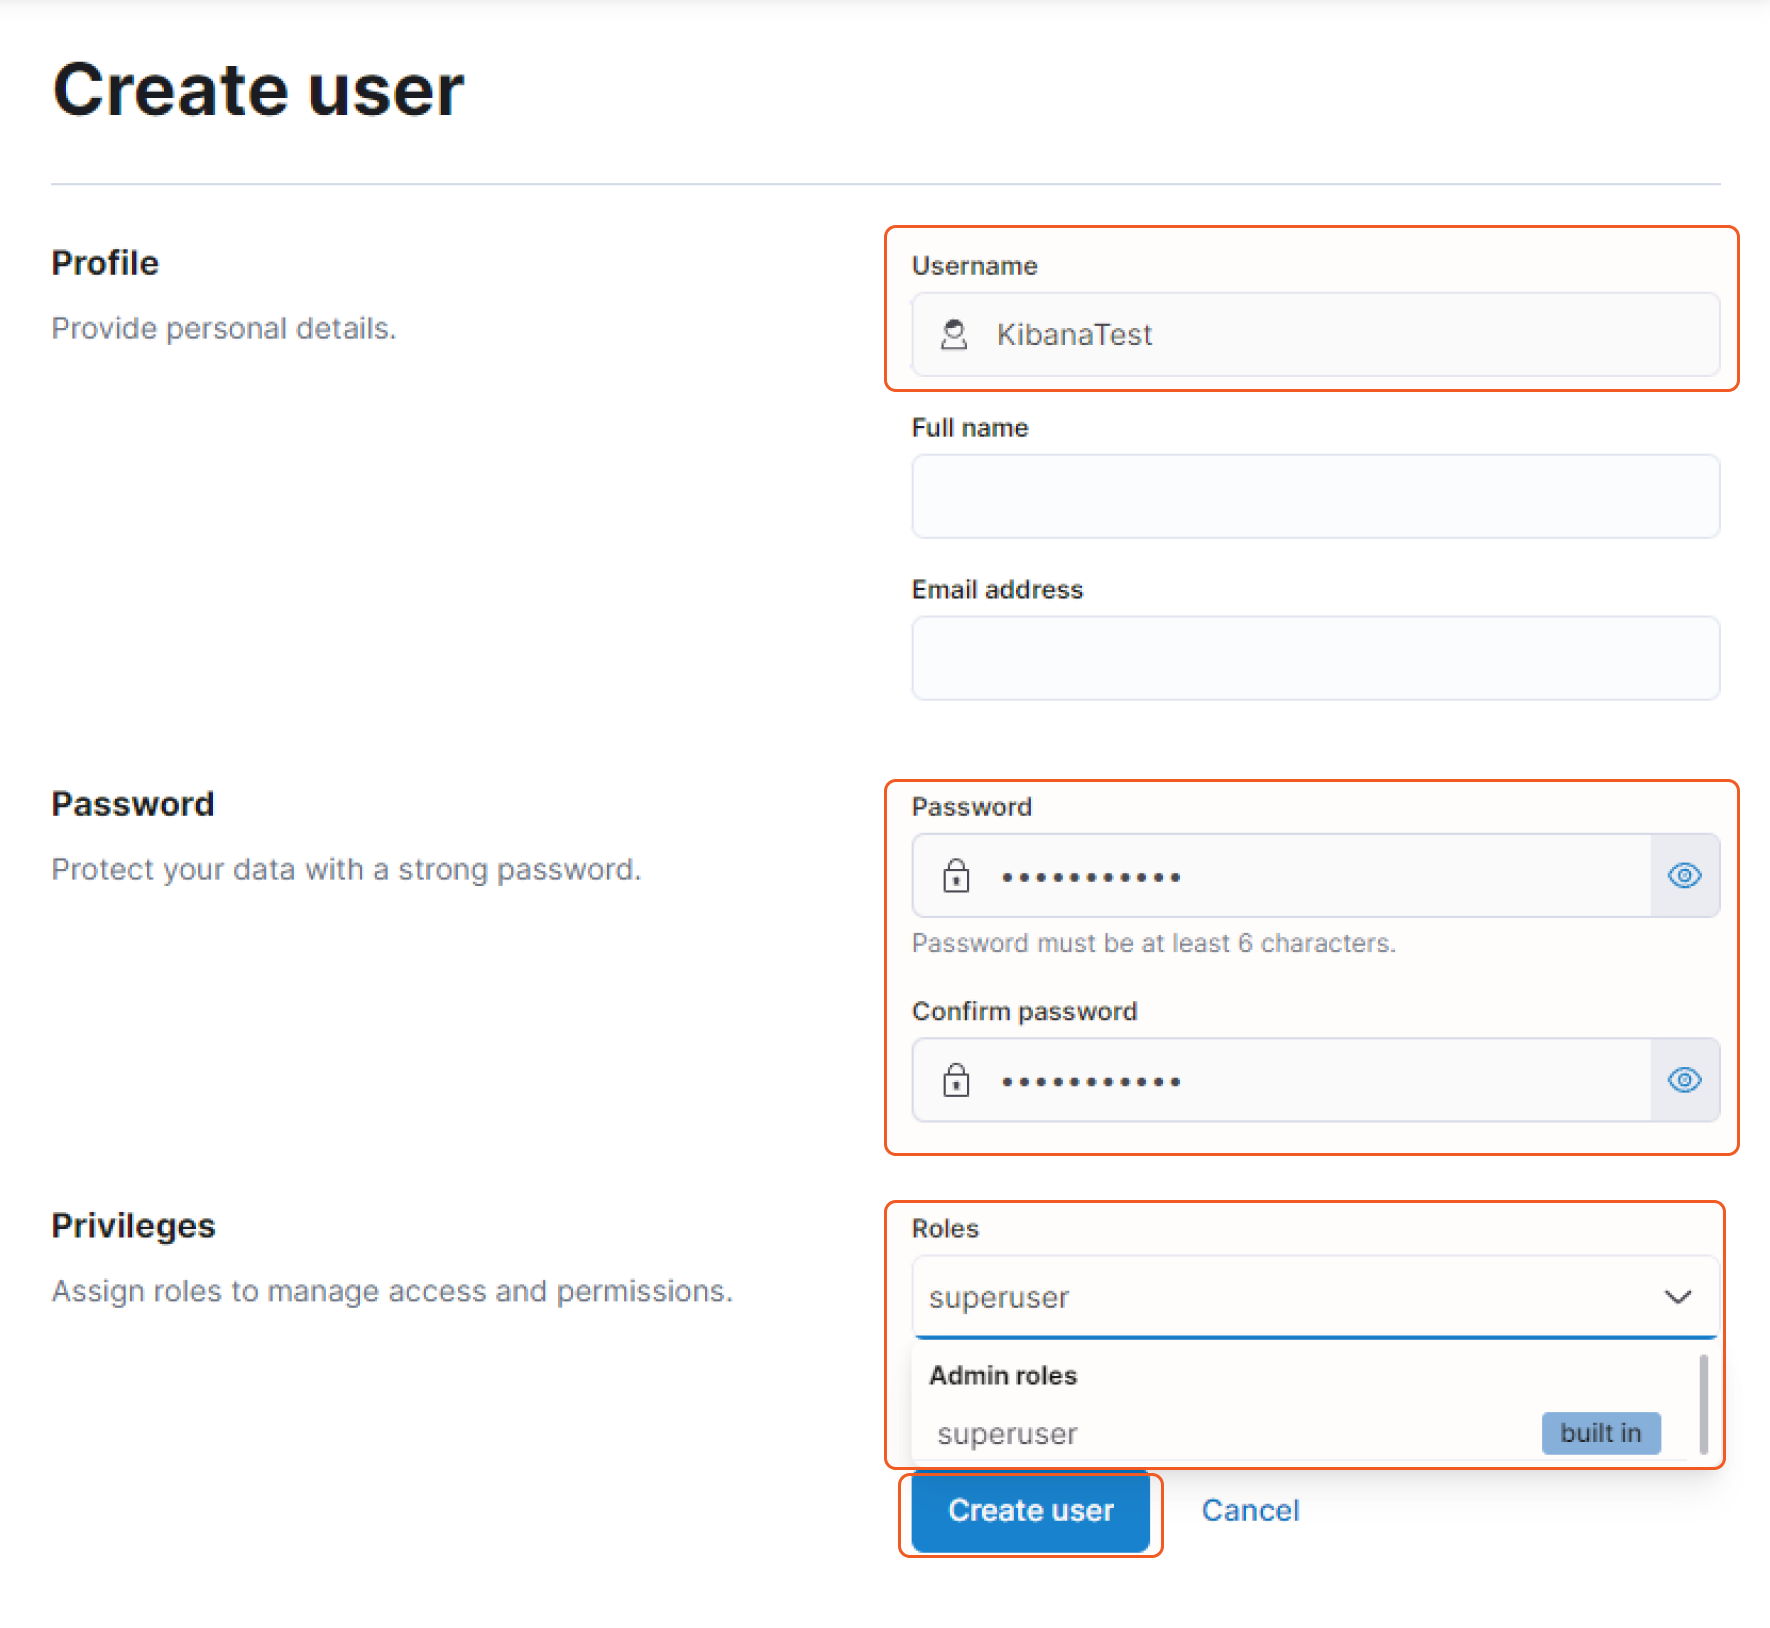
A license upgrade for Elastic Security may be required in order to use certain commands. For more information, refer to Elastic self-managed subscriptions.
Configuring D3 SOAR to Work with Elastic Security
Log in to D3 SOAR.
Find the Elastic Security integration.
.png?inst-v=9d16beaf-952a-4ae4-8fe8-e35f7a3745da)
Navigate to Configuration on the top header menu.
Click on the Integration icon on the left sidebar.
Type Elastic Security in the search box to find the integration, then click it to select it.
Click + Connection, on the right side of the Connections section. A new connection window will appear.
Configure the following fields to create a connection to Elastic Security.
.png?inst-v=9d16beaf-952a-4ae4-8fe8-e35f7a3745da)
Connection Name: The desired name for the connection.
Site: The site on which to use the integration connection. Use the drop-down menu to select the site. The Share to Internal Sites option enables all internal sites to use the connection. Selecting a specific site will only enable that site to use the connection.
Recipient site for events from connections Shared to Internal Sites: This field is displayed when Share to Internal Sites is selected for the Site field, allowing selection of the internal site for deploying the integration connection.
Agent Name (Optional): The proxy agent required to build the connection. Use the dropdown menu to select the proxy agent from a list of previously configured proxy agents.
Description (Optional): The description for the connection.
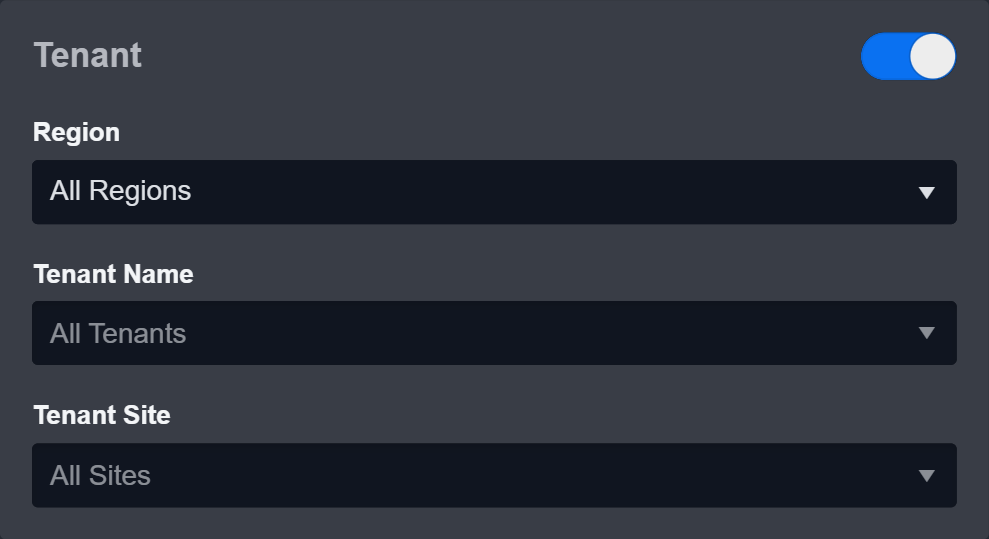
Tenant (Optional): When configuring the connection from a master tenant site, users can choose the specific tenant sites with which to share the connection. Once this setting is enabled, users can filter and select the desired tenant sites from the dropdowns to share the connection.
Configure User Permissions: Defines which users have access to the connection.
Active: The checkbox that enables the connection to be used when selected.
.png?inst-v=9d16beaf-952a-4ae4-8fe8-e35f7a3745da)
System: This section contains the parameters defined specifically for the integration. These parameters must be configured to create the integration connection.
1. Input the Server URL.
2. Copy the User Name from the Elastic Security platform. Refer to step 4 of Configuring Elastic Security to Work with D3 SOAR.
3. Copy the Password from the Elastic Security platform. Refer to step 4 of Configuring Elastic Security to Work with D3 SOAR.
4. Input the API Version. The default value is 8.3.
API version 8.4 is required to run the List Actions, List Processes, Suspend Processes and Terminate Processes commands.Enable Password Vault: An optional feature that allows users to take the stored credentials from their own password vault. Refer to the password vault connection guide if needed.
Connection Health Check: Periodically checks the connection status by scheduling the Test Connection command at the specified interval (in minutes). Available only for active connections, this feature also allows configuring email notifications for failed attempts.
Test the connection.
Click on the Test Connection button to verify credentials and connectivity. A success alert displays Passed with a green checkmark. If the connection fails, review the parameters and retry.
Click OK to close the alert window.
Click + Add to create and add the configured connection.
Commands
Elastic Security includes the following executable commands for users to set up schedules or create playbook workflows. With the Test Command, users can execute these commands independently for playbook troubleshooting.
Integration API Note
For more information about the Elastic Security API, refer to the Elastic Security APIs documentation.
READER NOTE
Certain permissions are required for each command. Refer to the Permission Requirements and Configuring Elastic Security to Work with D3 SOAR for details.
Note for Time-related parameters
The input format of time-related parameters may vary based on user account settings, which may cause the sample data in commands to differ from what is displayed. To adjust the time format, follow these steps:
Navigate to Configuration > Application Settings. Select Date/Time Format.
-20241017-192013.png?inst-v=9d16beaf-952a-4ae4-8fe8-e35f7a3745da)
Choose the desired date and time format, then click on the Save button.
-20241017-192025.png?inst-v=9d16beaf-952a-4ae4-8fe8-e35f7a3745da)
The selected time format will now be visible when configuring Date/Time command input parameters.
Add Case Comment
Adds a comment to a specified case.
READER NOTE
Case ID is a required parameter to run this command.
Run the List Cases command to obtain the Case ID. Case IDs can be found from the returned raw data at the path $.cases[*].id.
Space ID, Alert ID, Alert Index, Rule ID and Rule Name are optional parameters to run this command.
Run the List Spaces command to obtain the Space ID. Space ID can be found from the returned raw data at the path $.id.
Run the Fetch Event command to obtain the Alert ID and Alert Index. Alert IDs can be found from the returned raw data at the path $.hits.hits[*]._id; Alert Index can be found from the returned raw data at the path $.hits.hits[*]._index.
Run the List Rules command to obtain the Rule ID and Rule Name. Rule IDs can be found from the returned raw data at the path $.data[*].id; Rule Names can be found from the raw data at the path $.data[*].name.
Input
Input Parameter | Required/Optional | Description | Example |
Case ID | Required | The ID of the case to add the comment to. Case ID can be obtained using the List Cases command. | ***-***-***-***-*** |
Space ID | Optional | The ID of the space the case was created in. Space IDs can be obtained using the List Spaces command. If this parameter is not defined, the default space will be used. | default |
Comment | Optional | The comment for the specified case. This parameter is required when the Comment Type parameter is set to User. | Description of updating case |
Owner | Required | The case owner for the case. The available values are Cases, Observability, and Security Solution. The value must match the specified case owner. | Security Solution |
Comment Type | Optional | The type of the comment. The available values are User and Alert. The default value is User. | User |
Alert ID | Optional | The ID of the alert. This parameter is required when the Comment Type parameter is set to Alert. Alert ID can be obtained using the Fetch Event command. | 6b***2 |
Alert Index | Optional | The index of the alert. This parameter is required when the Comment Type parameter is set to Alert. Alert Index can be obtained using the Fetch Event command. | .internal.alerts-security.alerts-default-*** |
Rule ID | Optional | The ID of the rule that is associated with the alerts. This parameter is required when the Comment Type parameter is set to Alert. Rule ID can be obtained using the List Rules command. | ***-***-***-***-**** |
Rule Name | Optional | The name of the rule that is associated with the alerts. This parameter is required when the Comment Type parameter is set to Alert. Rule Name can be obtained using the List Rules command. | security_rule |
Output
To view the sample output data for all commands, refer to this article.
Error Handling
If the Return Data is Failed, an Error tab will appear in the Test Result window.
The error tab contains the details responded from D3 SOAR or third-party API calls, including Failure Indicator, Status Code, and Message. This can help locate the root cause of a command failure.
Parts in Error | Description | Example |
Failure Indicator | Indicates the command failure that happened at a specific input and/or API call. | Add Case Comment failed. |
Status Code | The response code issued by the third-party API server or the D3 SOAR system that can be used to locate the corresponding error category. For example, if the returned status code is 401, the selected connection is unauthorized to run the command. The user or system support would need to check the permission setting in the Elastic Security portal. Refer to the HTTP Status Code Registry for details. | Status Code: 403. |
Message | The raw data or captured key error message from the integration API server about the API request failure. | Message: The Comment is required when the Comment Type is User. |
Error Sample Data Add Case Comment failed. Status Code: 403. Message: The Comment is required when the Comment Type is User. |
Create Case
Creates a new case with the specified configuration.
READER NOTE
Space ID, Tags and Connector ID are optional parameters to run this command.
Run the List Spaces command to obtain the Space ID. Space ID can be found from the returned raw data at the path $.id.
Run the List Tags command to obtain the Tags. Tags can be found from the returned raw data.
Run the List Connectors command to obtain the Connector ID. Connector IDs can be found from the returned raw data at the path $[*].id.
Input
Input Parameter | Required/Optional | Description | Example |
Title | Required | The title for the new case. | New case |
Description | Required | The description for the new case. | Description of a new case |
Owner | Required | The owner for the case. The available values are Cases, Observability, and Security Solution. | Security Solution |
Space ID | Optional | The ID of the space in which to create the case. Space ID can be obtained using the List Spaces command. If this parameter is not defined, the default space will be used. | default |
Tags | Optional | The tags for the case. New tags can be added to the case. Tags can be obtained using the List Tags command. |
JSON
|
Severity | Optional | The severity of the case. The available values are Critical, High, Low and Medium. | Critical |
Synchronize Alerts | Optional | The option to turn on alert syncing. The default value is True. | True |
Connector ID | Optional | The connector ID for the case. The default value is none. Connector ID can be obtained using the List Connectors command. New Connector IDs can also be used. | ***-***-***-***-*** |
Connector Name | Optional | The connector name for the case. The default value is none. Connector Name can be obtained using the List Connectors command. New connector names can also be input. | Test connector name |
Connector Type | Optional | The connector type for the case. The default value is None. Connector Type can be obtained using the List Connectors command. | None |
Connector Fields | Optional | The connector fields for the case. Please refer to the link below for more information on fields configuration details (https://www.elastic.co/guide/en/kibana/8.4/cases-api-create.html#_request_body_2). |
JSON
|
Output
To view the sample output data for all commands, refer to this article.
Error Handling
If the Return Data is Failed, an Error tab will appear in the Test Result window.
The error tab contains the details responded from D3 SOAR or third-party API calls, including Failure Indicator, Status Code, and Message. This can help locate the root cause of a command failure.
Parts in Error | Description | Example |
Failure Indicator | Indicates the command failure that happened at a specific input and/or API call. | Create Case failed. |
Status Code | The response code issued by the third-party API server or the D3 SOAR system that can be used to locate the corresponding error category. For example, if the returned status code is 401, the selected connection is unauthorized to run the command. The user or system support would need to check the permission setting in the Elastic Security portal. Refer to the HTTP Status Code Registry for details. | Status Code: 400. |
Message | The raw data or captured key error message from the integration API server about the API request failure. | Message: An internal server error occurred. Check Kibana server logs for details. |
Error Sample Data Create Case failed. Status Code: 400. Message: An internal server error occurred. Check Kibana server logs for details. |
Fetch Event
Returns Elastic Security alerts from the platform based on the specified criteria.
READER NOTE
For the Status parameter, if the option is set to In-progress, it is only available for Kibana version 8.3.
Input
Input Parameter | Required/Optional | Description | Example |
Start Time | Optional | The start time of the time range to retrieve alerts in UTC time. | 2021-12-15 12:00 |
End Time | Optional | The end time of the time range to retrieve alerts in UTC time. | 2022-03-30 12:00 |
Number of Event(s) Fetched | Optional | The maximum number of results to return. When the input value is 0, a negative number, or not specified, the command will return all results that match the given criteria. | 20 |
Status | Optional | The status to filter the alerts by. The available values are Open, In-progress and Closed. The In-progress option is only available for Kibana version 8.3. | Open |
Search Condition | Optional | The filter in JSON format to filter results. The input value will be merged to the $.query.bool.filter array in the request body. Please refer to the link below for more details on the query syntax (https://www.elastic.co/guide/en/elasticsearch/reference/8.4/query-dsl.html). |
JSON
|
Aggregations | Optional | The configuration for aggregations that summarize the data as metrics, statistics, or other analytics. |
JSON
|
Output
To view the sample output data for all commands, refer to this article.
Fetch Event Field Mapping
Fetch Event commands require event field mapping. Field mapping plays a key role for data normalization within the event pipeline. Field mapping converts the original data fields from the different providers to standardized D3 fields as defined by the D3 Model. Refer to Event and Incident Intake Field Mapping for details.
To add a custom field, click on the + Add Field button. Users can also remove built-in field mappings by clicking x. Note that two underscore characters will automatically prefix the defined Field Name as the System Name for a custom field mapping. Additionally, if an input Field Name contains any spaces, they will automatically be replaced with underscores for the corresponding System Name.
As a system integration, the Elastic Security integration has some pre-configured field mappings for default field mapping.
The Default Event Source is the default set of field mappings that are applied when this fetch event command is executed. For out-of-the-box integrations, users will find a set of field mappings provided by the system. Default event source provides field mappings for common fields from the fetched data. The default event source has a "Main Event JSON Path" (i.e., $.hits.hits) that is used to extract a batch of events from the response raw data. Click Edit Main JSON Path to view the “Main Event JSON Path”.
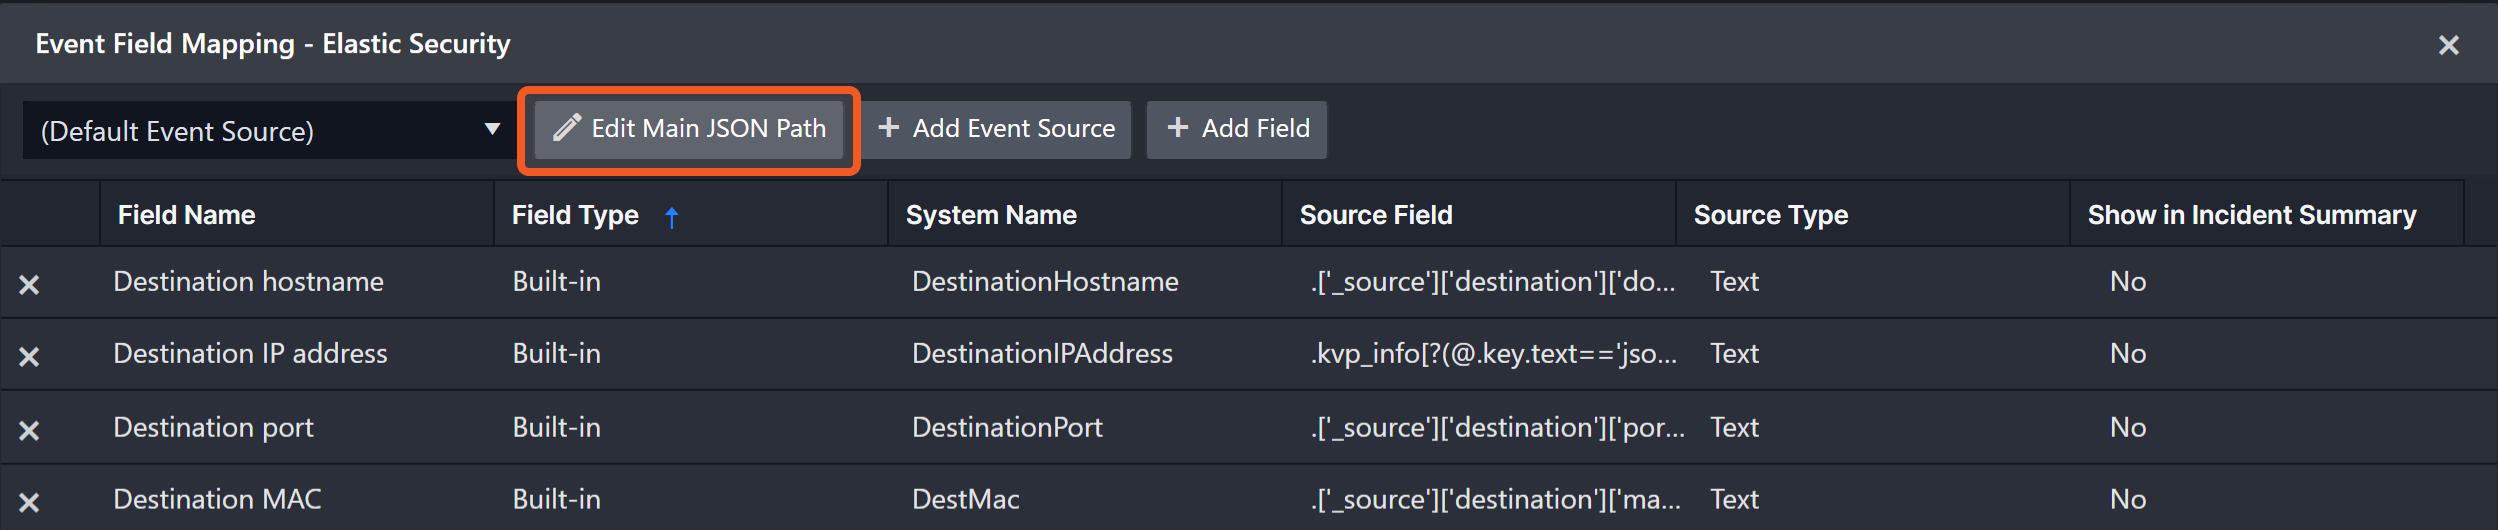
Main Event JSON Path: $.hits.hits
The Main Event JSON Path determines the root path where the system starts parsing raw response data into D3 event data. The JSON path begins with $, representing the root element. The path is formed by appending a sequence of child elements to $, each separated by a dot (.). Square brackets with nested quotation marks ([‘...’]) should be used to separate child elements in JSON arrays.
For example, the root node of a JSON Path is hits.hits. The child node denoting the Agent ID field would be ['_source']['agent']['id']. Putting it together, the JSON Path expression to extract the Agent ID is $.hits.hits.['_source']['agent']['id'].
The pre-configured field mappings are detailed below:
Field Name | Source Field |
Unique Event Key | ._id |
Event Type | .['_source']['event.type'] |
Start Time | .['_source']['kibana.alert.original_time'] |
Description | .['_source']['kibana.alert.reason'] |
Severity | .['_source']['kibana.alert.severity'] |
Status | .['_source']['kibana.alert.status'] |
Score | .['_source']['kibana.alert.risk_score'] |
Event category | .['_source']['event.category'] |
Agent ID | .['_source']['agent']['id'] |
Agent Type | .['_source']['agent']['type'] |
Cloud Account ID | .['_source']['cloud']['account']['id'] |
Cloud Account name | .['_source']['cloud']['account']['name'] |
Cloud Instance ID | .['_source']['cloud']['instance']['id'] |
Cloud Instance Name | .['_source']['cloud']['instance']['name'] |
Cloud Machine Type | .['_source']['cloud']['machine']['type'] |
Cloud Provider | .['_source']['cloud']['provider'] |
Cloud Region | .['_source']['cloud']['region'] |
Destination hostname | .['_source']['destination']['domain'] |
Destination IP address | .['_source']['destination']['ip'] |
Destination port | .['_source']['destination']['port'] |
Destination MAC | .['_source']['destination']['mac'] |
DLL Name | .['_source']['dll']['name'] |
DLL Path | .['_source']['dll']['path'] |
Original event ID | .['_source']['event.id'] |
Workflow Status | .['_source']['kibana.alert.workflow_status'] |
Malware Classification Identifier | .['_source']['file']['Ext']['malware_classification']['identifier'] |
Malware Classification Score | .['_source']['file']['Ext']['malware_classification']['score'] |
Filepath | .['_source']['file']['path'] |
File Hash SHA256 | .['_source']['file']['hash']['sha256'] |
File Hash SHA1 | .['_source']['file']['hash']['sha1'] |
File Hash MD5 | .['_source']['file']['hash']['md5'] |
Event Module | .['_source']['event.module'] |
Hostname | .['_source']['host']['hostname'] |
Operating system | .['_source']['host']['os']['full'] |
Event Action | .['_source']['event.action'] |
Host IPs | .['_source']['host']['ip'] |
Network Application | .['_source']['network']['application'] |
Network Direction | .['_source']['network']['direction'] |
Network Forwarded IP | .['_source']['network']['forwarded_ip'] |
Network Name | .['_source']['network']['name'] |
HTTP method | .['_source']['http']['request']['method'] |
HTTP Response Status Code | .['_source']['http']['response']['status_code'] |
HTTP Request Body | .['_source']['http']['request']['body']['content'] |
Observer Type | .['_source']['observer']['type'] |
Observer Product | .['_source']['observer']['product'] |
Observer Vendor | .['_source']['observer']['vendor'] |
Observer Hostname | .['_source']['observer']['hostname'] |
Observer IP | .['_source']['observer']['ip'] |
Observer Ingress Zone | .['_source']['observer']['ingress']['zone'] |
Observer Egress Zone | .['_source']['observer']['egress']['zone'] |
Organization ID | .['_source']['organization']['id'] |
Organization Name | .['_source']['organization']['name'] |
Process Name | .['_source']['process']['name'] |
Process ID | .['_source']['process']['pid'] |
Process file path | .['_source']['process']['executable'] |
Process command line | .['_source']['process']['command_line'] |
Process Hash SHA256 | .['_source']['process']['hash']['sha256'] |
Process Hashes SHA1 | .['_source']['process']['hash']['sha1'] |
Process Hashes MD5 | .['_source']['process']['hash']['md5'] |
Parent process name | .['_source']['process']['parent']['name'] |
Parent process ID | .['_source']['process']['parent']['pid'] |
Parent process image path | .['_source']['process']['parent']['executable'] |
Parent process commandline | .['_source']['process']['parent']['command_line'] |
Parent Process Hash SHA256 | .['_source']['process']['parent']['hash']['sha256'] |
Parent Process Hash SHA1 | .['_source']['process']['parent']['hash']['sha1'] |
Parent Process Hash MD5 | .['_source']['process']['parent']['hash']['md5'] |
Username | .['_source']['user']['name'] |
User Domain | .['_source']['user']['domain'] |
User Email | .['_source']['user']['email'] |
User Roles | .['_source']['user']['roles'] |
Vulnerability Description | .['_source']['vulnerability']['description'] |
Vulnerability category | .['_source']['vulnerability']['category'] |
CVE | .['_source']['vulnerability']['id'] |
Vulnerability Severity | .['_source']['vulnerability']['severity'] |
Error Handling
If the Return Data is Failed, an Error tab will appear in the Test Result window.
The error tab contains the details responded from D3 SOAR or third-party API calls, including Failure Indicator, Status Code, and Message. This can help locate the root cause of a command failure.
Parts in Error | Description | Example |
Failure Indicator | Indicates the command failure that happened at a specific input and/or API call. | Fetch Event failed. |
Status Code | The response code issued by the third-party API server or the D3 SOAR system that can be used to locate the corresponding error category. For example, if the returned status code is 401, the selected connection is unauthorized to run the command. The user or system support would need to check the permission setting in the Elastic Security portal. Refer to the HTTP Status Code Registry for details. | Status Code: 401. |
Message | The raw data or captured key error message from the integration API server about the API request failure. | Message: The value for parameter (Search Condition) is invalid. |
Error Sample Data Fetch Event failed. Status Code: 401. Message: The value for parameter (Search Condition) is invalid. |
Isolate Endpoints
Isolates the specified endpoints. This command returns more information when the integration connection is using API version 8.4. Run the List Endpoints command to obtain the status of an endpoint.
READER NOTE
Endpoints IDs is a required parameter to run this command.
Run the List Endpoints command to obtain the Endpoints IDs. Endpoints IDs can be found in the returned raw data at the path $.data[*].metadata.agent.id.
Alert IDs and Case IDs are optional parameters to run this command.
Run the Fetch Event command to obtain the Alert IDs. Alert IDs can be found from the returned raw data at the path $.hits.hits[*]._id.
Run the List Cases command to obtain the Case IDs. Case IDs can be found from the returned raw data at the path $.cases[*].id.
Input
Input Parameter | Required/Optional | Description | Example |
Endpoints IDs | Required | The list of endpoint IDs to be isolated. Endpoint IDs can be obtained using the List Endpoints command. |
JSON
|
Comment | Optional | The comment to add to the isolate endpoints action. The comment text will appear in associated cases. | Locked down, pending further investigation(test) |
Alert IDs | Optional | The alert IDs that are associated with the action. The isolated event will be logged in any cases associated with the specified alerts. Alert IDs can be obtained using the Fetch Event command. |
JSON
|
Case IDs | Optional | The case IDs that will log the action. Case IDs can be obtained using the List Cases command. |
JSON
|
Output
To view the sample output data for all commands, refer to this article.
Error Handling
If the Return Data is Failed, an Error tab will appear in the Test Result window.
The error tab contains the details responded from D3 SOAR or third-party API calls, including Failure Indicator, Status Code, and Message. This can help locate the root cause of a command failure.
Parts in Error | Description | Example |
Failure Indicator | Indicates the command failure that happened at a specific input and/or API call. | Isolate Endpoints failed. |
Status Code | The response code issued by the third-party API server or the D3 SOAR system that can be used to locate the corresponding error category. For example, if the returned status code is 401, the selected connection is unauthorized to run the command. The user or system support would need to check the permission setting in the Elastic Security portal. Refer to the HTTP Status Code Registry for details. | Status Code: 404. |
Message | The raw data or captured key error message from the integration API server about the API request failure. | Message: Not Found. |
Error Sample Data Isolate Endpoints failed. Status Code: 404. Message: Not Found. |
List Actions
Retrieves a list of response actions with action IDs or criteria.
READER NOTE
Agent IDs is an optional parameter to run this command.
Run the List Endpoints command to obtain the Agent IDs. Agent IDs can be found in the returned raw data at the path $.data[*].metadata.agent.id.
This command requires a connection using API version 8.4.
Input
Input Parameter | Required/Optional | Description | Example |
Action IDs | Optional | The list of action IDs to retrieve the action details. If this parameter is defined, all other parameters will be omitted. |
JSON
|
Start Time | Optional | The start time for filtering the actions in UTC time. | 2022-03-30 11:00 |
End Time | Optional | The end time for filtering the actions in UTC time. | 2022-03-30 12:00 |
Agent IDs | Optional | The agent IDs to filter the actions. Agent IDs can be obtained using the List Endpoints command. |
JSON
|
Command Names | Optional | The command names of the actions. The available values are isolate, unisolate, kill-process, suspend-process and running-process. |
JSON
|
Page Size | Optional | The maximum number of actions to return. When the input value is 0, a negative number, or not specified, the command will return the default amount (10) of the endpoints that match the given criteria. The value range is 1 to 10000. | 3 |
Page | Optional | The start page of results to retrieve, starting from 1. | 1 |
Output
To view the sample output data for all commands, refer to this article.
Error Handling
If the Return Data is Partially Successful or Failed, an Error tab will appear in the Test Result window.
The error tab contains the details responded from D3 SOAR or third-party API calls, including Failure Indicator, Status Code, and Message. This can help locate the root cause of a command failure.
Parts in Error | Description | Example |
Failure Indicator | Indicates the command failure that happened at a specific input and/or API call. | List Actions failed. |
Status Code | The response code issued by the third-party API server or the D3 SOAR system that can be used to locate the corresponding error category. For example, if the returned status code is 401, the selected connection is unauthorized to run the command. The user or system support would need to check the permission setting in the Elastic Security portal. Refer to the HTTP Status Code Registry for details. | Status Code: 404. |
Message | The raw data or captured key error message from the integration API server about the API request failure. | Message: Action with id xxx not found. |
Error Sample Data List Actions failed. Status Code: 404. Message: Action with id xxx not found. |
List Cases
Returns Elastic Security alerts from the platform based on the specified criteria.
READER NOTE
Space ID and Tags are optional parameters to run this command.
Run the List Spaces command to obtain the Space ID. Space ID can be found from the returned raw data at the path $.id.
Run the List Tags command to obtain the Tags. Tags can be found from the returned raw data.
Input
Input Parameter | Required/Optional | Description | Example |
Start Time | Optional | The start time of the created case time range in UTC time. | 2021-12-15 12:00 |
End Time | Optional | The end time of the created case time range in UTC time. | 2022-03-30 12:00 |
Space ID | Optional | The ID of the space to retrieve the cases. Space IDs can be obtained using the List Spaces command. If this parameter is not defined, the default space will be used. | default |
Owner | Optional | The applications as the owner to filter the cases. The available values are Cases, Observability, and Security Solution. | Security Solution |
Search Condition | Optional | The filter in string format to filter cases. Please refer to the link below for more details of the simple query string syntax (https://www.elastic.co/guide/en/elasticsearch/reference/8.3/query-dsl-simple-query-string-query.html#simple-query-string-syntax). | testSpaceCase1 testCase1 |
Severity | Optional | The severity to filter the cases. The available values are Critical, High, Low and Medium. | Critical |
Tags | Optional | The list of tags to filter the cases. Tags can be obtained using the List Tags command. | test tags |
Page Size | Optional | The maximum number of endpoints to return. When the input value is 0, a negative number, or not specified, the command will return the default amount (10) of the cases that match the given criteria. The value range is 1 to 10000 but the total available returned count is limited to 10000 including using Page. For example, when Page = 2, the Maximum Page Size = 5000, and the total result number is still 10000. | 3 |
Page | Optional | The page of results to retrieve. The page index starts from 1. | 1 |
Order By | Optional | The sort column of the returned results. The default value is Created At. | Created At |
Direction | Optional | The sort order of the results. The default value is Descending. | Descending |
Output
To view the sample output data for all commands, refer to this article.
Error Handling
If the Return Data is Failed, an Error tab will appear in the Test Result window.
The error tab contains the details responded from D3 SOAR or third-party API calls, including Failure Indicator, Status Code, and Message. This can help locate the root cause of a command failure.
Parts in Error | Description | Example |
Failure Indicator | Indicates the command failure that happened at a specific input and/or API call. | List Cases failed. |
Status Code | The response code issued by the third-party API server or the D3 SOAR system that can be used to locate the corresponding error category. For example, if the returned status code is 401, the selected connection is unauthorized to run the command. The user or system support would need to check the permission setting in the Elastic Security portal. Refer to the HTTP Status Code Registry for details. | Status Code: 404. |
Message | The raw data or captured key error message from the integration API server about the API request failure. | Message: Saved object not found. |
Error Sample Data List Cases failed. Status Code: 404. Message: Saved object not found. |
List Connectors
Retrieves all connectors by the criteria.
READER NOTE
Space ID is an optional parameter to run this command.
Run the List Spaces command to obtain the Space ID. Space ID can be found from the returned raw data at the path $.id.
Input
Input Parameter | Required/Optional | Description | Example |
Space ID | Optional | The ID of the space to retrieve the connectors. Space IDs can be obtained using the List Spaces command. If this parameter is not defined, the default space will be used. | default |
Output
To view the sample output data for all commands, refer to this article.
Error Handling
If the Return Data is Failed, an Error tab will appear in the Test Result window.
The error tab contains the details responded from D3 SOAR or third-party API calls, including Failure Indicator, Status Code, and Message. This can help locate the root cause of a command failure.
Parts in Error | Description | Example |
Failure Indicator | Indicates the command failure that happened at a specific input and/or API call. | List Connectors failed. |
Status Code | The response code issued by the third-party API server or the D3 SOAR system that can be used to locate the corresponding error category. For example, if the returned status code is 401, the selected connection is unauthorized to run the command. The user or system support would need to check the permission setting in the Elastic Security portal. Refer to the HTTP Status Code Registry for details. | Status Code: 403. |
Message | The raw data or captured key error message from the integration API server about the API request failure. | Message: The remote server refused to connect, please check Server URL or API service availability. |
Error Sample Data List Connectors failed. Status Code: 403. Message: The remote server refused to connect, please check Server URL or API service availability. |
List Endpoints
Returns Elastic Security managed endpoints details with the specified criteria.
Input
Input Parameter | Required/Optional | Description | Example |
Endpoints IDs | Optional | The list of endpoint IDs to retrieve details for. If this parameter is defined, all other parameters will be ignored. |
JSON
|
Query | Optional | The query string to filter the endpoints. Please refer to the link below for more details on the query syntax (https://www.elastic.co/guide/en/kibana/current/kuery-query.html). | united.endpoint.host.os.name : Windows |
Host Statuses | Optional | The list of the agent health statuses to filter the endpoints. The available values are healthy, unhealthy, offline, updating, inactive, and unenrolled. |
JSON
|
Page Size | Optional | The maximum number of endpoints to return. When the input value is 0, a negative number, or not specified, the command will return the default amount (10) of the endpoints that match the given criteria. The value range is 1 to 10000. | 3 |
Page | Optional | The zero-based page of results to retrieve. | 1 |
Output
To view the sample output data for all commands, refer to this article.
Error Handling
If the Return Data is Partially Successful or Failed, an Error tab will appear in the Test Result window.
The error tab contains the details responded from D3 SOAR or third-party API calls, including Failure Indicator, Status Code, and Message. This can help locate the root cause of a command failure.
Parts in Error | Description | Example |
Failure Indicator | Indicates the command failure that happened at a specific input and/or API call. | List Endpoints failed. |
Status Code | The response code issued by the third-party API server or the D3 SOAR system that can be used to locate the corresponding error category. For example, if the returned status code is 401, the selected connection is unauthorized to run the command. The user or system support would need to check the permission setting in the Elastic Security portal. Refer to the HTTP Status Code Registry for details. | Status Code: 404. |
Message | The raw data or captured key error message from the integration API server about the API request failure. | Message: Endpoint with id jkn not found. |
Error Sample Data List Endpoints failed. Status Code: 404. Message: Endpoint with id jkn not found. |
List Processes
Returns a list of running processes of the Elastic Security managed endpoints.
READER NOTE
Endpoints IDs is a required parameter to run this command.
Run the List Endpoints command to obtain the Endpoints IDs. Endpoints IDs can be found in the returned raw data at the path $.data[*].metadata.agent.id.
Alert IDs and Case IDs are optional parameters to run this command.
Run the Fetch Event command to obtain the Alert IDs. Alert IDs can be found from the returned raw data at the path $.hits.hits[*]._id.
Run the List Cases command to obtain the Case IDs. Case IDs can be found from the returned raw data at the path $.cases[*].id.
This command requires a connection using API version 8.4.
Input
Input Parameter | Required/Optional | Description | Example |
Endpoints IDs | Required | The list of endpoint IDs to retrieve process details. Endpoint IDs can be obtained using the List Endpoints command. |
JSON
|
Comment | Optional | The comment to add to the get process action. The comment text will appear in associated cases. | Get processes list, pending further investigation(test) |
Alert IDs | Optional | The alert IDs that are associated with the action. The get process event will be logged in any cases associated with the specified alerts. Alert IDs can be obtained using the Fetch Event command. |
JSON
|
Case IDs | Optional | The case IDs that will log the action. Case IDs can be obtained using the List Cases command. |
JSON
|
Output
To view the sample output data for all commands, refer to this article.
Error Handling
If the Return Data is Failed, an Error tab will appear in the Test Result window.
The error tab contains the details responded from D3 SOAR or third-party API calls, including Failure Indicator, Status Code, and Message. This can help locate the root cause of a command failure.
Parts in Error | Description | Example |
Failure Indicator | Indicates the command failure that happened at a specific input and/or API call. | List Processes failed. |
Status Code | The response code issued by the third-party API server or the D3 SOAR system that can be used to locate the corresponding error category. For example, if the returned status code is 401, the selected connection is unauthorized to run the command. The user or system support would need to check the permission setting in the Elastic Security portal. Refer to the HTTP Status Code Registry for details. | Status Code: 404. |
Message | The raw data or captured key error message from the integration API server about the API request failure. | Message: Not Found. |
Error Sample Data List Processes failed. Status Code: 404. Message: Not Found. |
List Rules
Retrieves all rules by the specified criteria.
READER NOTE
Space ID is an optional parameter to run this command.
Run the List Spaces command to obtain the Space ID. Space ID can be found from the returned raw data at the path $.id.
Input
Input Parameter | Required/Optional | Description | Example |
Space ID | Optional | The ID of the space to retrieve the rules. Space IDs can be obtained using the List Spaces command. If this parameter is not defined, the default space will be used. | default |
Search Condition | Optional | The filter in string format to filter rules. Please refer to the link below for more details of the simple query string syntax (https://www.elastic.co/guide/en/elasticsearch/reference/8.3/query-dsl-simple-query-string-query.html#simple-query-string-syntax). | my* |
Page Size | Optional | The maximum number of rules to return. When the input value is 0, a negative number, or not specified, the command will return the default amount (10) of cases that match the given criteria. The value range is 1 to 10000, but the total available returned count is limited to 10000 including using Page. The Page * Page Size cannot exceed 10000. For example, when Page = 2, the Maximum Page Size will be 5000. | 3 |
Page | Optional | The page of results to retrieve. The page index starts from 1. | 1 |
Order By | Optional | The sort column of the return results. The default value is Created At. | Created At |
Direction | Optional | The sort order of the result. The default value is Descending. | Descending |
Output
To view the sample output data for all commands, refer to this article.
Error Handling
If the Return Data is Failed, an Error tab will appear in the Test Result window.
The error tab contains the details responded from D3 SOAR or third-party API calls, including Failure Indicator, Status Code, and Message. This can help locate the root cause of a command failure.
Parts in Error | Description | Example |
Failure Indicator | Indicates the command failure that happened at a specific input and/or API call. | List Rules failed. |
Status Code | The response code issued by the third-party API server or the D3 SOAR system that can be used to locate the corresponding error category. For example, if the returned status code is 401, the selected connection is unauthorized to run the command. The user or system support would need to check the permission setting in the Elastic Security portal. Refer to the HTTP Status Code Registry for details. | Status Code: 403. |
Message | The raw data or captured key error message from the integration API server about the API request failure. | Message: You cannot use alerting because your trial license has expired. |
Error Sample Data List Rules failed. Status Code: 403. Message: You cannot use alerting because your trial license has expired. |
List Spaces
Retrieves all Elastic Security spaces. This functionality is in technical preview and may be changed or removed in a future release.
Input
Input Parameter | Required/Optional | Description | Example |
Purpose | Optional | The authorization checks that will be applied to filter the spaces. The available values are Any, Copy Saved Objects Into Space, and Share Saved Objects Into Space. The Purpose and Include Authorized Purposes parameters cannot both have values simultaneously. If both parameters are defined, the value of the parameter Include Authorized Purposes will be ignored. | Any |
Include Authorized Purposes | Optional | The option to return any spaces that the user is authorized to access in any capacity. Each space will contain the purpose(s) for which the user is authorized. If the Purpose parameter is defined, then this parameter will be ignored. | False |
Output
To view the sample output data for all commands, refer to this article.
Error Handling
If the Return Data is Failed, an Error tab will appear in the Test Result window.
The error tab contains the details responded from D3 SOAR or third-party API calls, including Failure Indicator, Status Code, and Message. This can help locate the root cause of a command failure.
Parts in Error | Description | Example |
Failure Indicator | Indicates the command failure that happened at a specific input and/or API call. | List Spaces failed. |
Status Code | The response code issued by the third-party API server or the D3 SOAR system that can be used to locate the corresponding error category. For example, if the returned status code is 401, the selected connection is unauthorized to run the command. The user or system support would need to check the permission setting in the Elastic Security portal. Refer to the HTTP Status Code Registry for details. | Status Code: 403. |
Message | The raw data or captured key error message from the integration API server about the API request failure. | Message: The remote server refused to connect, please check Server URL or API service availability. |
Error Sample Data List Spaces failed. Status Code: 403. Message: The remote server refused to connect, please check Server URL or API service availability. |
List Tags
Retrieves all tags by the specified criteria.
READER NOTE
Space ID is an optional parameter to run this command.
Run the List Spaces command to obtain the Space ID. Space ID can be found from the returned raw data at the path $.id.
Input
Input Parameter | Required/Optional | Description | Example |
Space ID | Optional | The ID of the space to retrieve the tags. Space IDs can be obtained using the List Spaces command. If this parameter is not defined, the default space will be used. | default |
Owner | Optional | The applications as the owner to filter the tags. The available values are Cases, Observability, and Security Solution. | Security Solution |
Output
To view the sample output data for all commands, refer to this article.
Error Handling
If the Return Data is Failed, an Error tab will appear in the Test Result window.
The error tab contains the details responded from D3 SOAR or third-party API calls, including Failure Indicator, Status Code, and Message. This can help locate the root cause of a command failure.
Parts in Error | Description | Example |
Failure Indicator | Indicates the command failure that happened at a specific input and/or API call. | List Tags failed. |
Status Code | The response code issued by the third-party API server or the D3 SOAR system that can be used to locate the corresponding error category. For example, if the returned status code is 401, the selected connection is unauthorized to run the command. The user or system support would need to check the permission setting in the Elastic Security portal. Refer to the HTTP Status Code Registry for details. | Status Code: 404. |
Message | The raw data or captured key error message from the integration API server about the API request failure. | Message: Saved object not found. |
Error Sample Data List Tags failed. Status Code: 404. Message: Saved object not found. |
Release Endpoints
Releases the specified isolated endpoints. This command returns more information when the integration connection is using API version 8.4. Run the List Endpoints command to obtain the status of an endpoint.
READER NOTE
Endpoints IDs is a required parameter to run this command.
Run the List Endpoints command to obtain the Endpoints IDs. Endpoints IDs can be found in the returned raw data at the path $.data[*].metadata.agent.id.
Alert IDs and Case IDs are optional parameters to run this command.
Run the Fetch Event command to obtain the Alert IDs. Alert IDs can be found from the returned raw data at the path $.hits.hits[*]._id.
Run the List Cases command to obtain the Case IDs. Case IDs can be found from the returned raw data at the path $.cases[*].id.
Input
Input Parameter | Required/Optional | Description | Example |
Endpoints IDs | Required | The list of endpoint IDs to be released. Endpoint IDs can be obtained using the List Endpoints command. |
JSON
|
Comment | Optional | The comment to add to the release endpoints action. The comment text will appear in associated cases. | Locked down, pending further investigation(test) |
Alert IDs | Optional | The alert IDs that are associated with the action. The released event will be logged in any cases associated with the specified alerts. Alert IDs can be obtained using the Fetch Event command. |
JSON
|
Case IDs | Optional | The case IDs that will log the action taken on. Case IDs can be obtained using the List Cases command. |
JSON
|
Output
To view the sample output data for all commands, refer to this article.
Error Handling
If the Return Data is Failed, an Error tab will appear in the Test Result window.
The error tab contains the details responded from D3 SOAR or third-party API calls, including Failure Indicator, Status Code, and Message. This can help locate the root cause of a command failure.
Parts in Error | Description | Example |
Failure Indicator | Indicates the command failure that happened at a specific input and/or API call. | Release Endpoints failed. |
Status Code | The response code issued by the third-party API server or the D3 SOAR system that can be used to locate the corresponding error category. For example, if the returned status code is 401, the selected connection is unauthorized to run the command. The user or system support would need to check the permission setting in the Elastic Security portal. Refer to the HTTP Status Code Registry for details. | Status Code: 404. |
Message | The raw data or captured key error message from the integration API server about the API request failure. | Message: Not Found. |
Error Sample Data Release Endpoints failed. Status Code: 404. Message: Not Found. |
Suspend Processes
Suspends processes on a host of the Elastic Security managed endpoint.
READER NOTE
Endpoints IDs is a required parameter to run this command.
Run the List Endpoints command to obtain the Endpoints IDs. Endpoints IDs can be found in the returned raw data at the path $.data[*].metadata.agent.id.
Process IDs, Entity IDs, Alert IDs and Case IDs are optional parameters to run this command.
One of Process IDs or Entity IDs must be provided.
Run the List Processes command to obtain the Process IDs.
Run the List Processes command to obtain the Entity IDs. Entity IDs can be found from the returned raw data at the path $.parameters.entity_id.
Run the Fetch Event command to obtain the Alert IDs. Alert IDs can be found from the returned raw data at the path $.hits.hits[*]._id.
Run the List Cases command to obtain the Case IDs. Case IDs can be found from the returned raw data at the path $.cases[*].id.
This command requires a connection using API version 8.4.
Input
Input Parameter | Required/Optional | Description | Example |
Endpoint IDs | Required | The endpoint ID to suspend the process. Endpoint IDs can be obtained using the List Endpoints command. | ***-***-***-***-*** |
Process IDs | Optional | The list of process IDs of the processes to be suspended. Process IDs can be obtained using the List Processes command. Process IDs the Entity IDs Parameter cannot both be empty. The parameter Entity IDs will be omitted when Process IDs has a value. |
JSON
|
Entity IDs | Optional | The list of entity IDs of the processes to be suspended. Entity IDs can be obtained using the List Processes command. Entity IDs and the Process IDs parameter cannot be both empty. This parameter will be omitted when Process IDs has a value. |
JSON
|
Comment | Optional | The comment to add to the suspend process action. The comment text will appear in associated cases. | Get processes list, pending further investigation(test) |
Alert IDs | Optional | The alert IDs that are associated with the action. The get process event will be logged in any cases associated with the specified alerts. Alert IDs can be obtained using the Fetch Event command. |
JSON
|
Case IDs | Optional | The case IDs that will log the action taken on. Case IDs can be obtained using the List Cases command. |
JSON
|
Output
To view the sample output data for all commands, refer to this article.
Error Handling
If the Return Data is Partially Successful or Failed, an Error tab will appear in the Test Result window.
The error tab contains the details responded from D3 SOAR or third-party API calls, including Failure Indicator, Status Code, and Message. This can help locate the root cause of a command failure.
Parts in Error | Description | Example |
Failure Indicator | Indicates the command failure that happened at a specific input and/or API call. | Terminate Processes failed. |
Status Code | The response code issued by the third-party API server or the D3 SOAR system that can be used to locate the corresponding error category. For example, if the returned status code is 401, the selected connection is unauthorized to run the command. The user or system support would need to check the permission setting in the Elastic Security portal. Refer to the HTTP Status Code Registry for details. | Status Code: 401. |
Message | The raw data or captured key error message from the integration API server about the API request failure. | Message: The value for parameter (Process IDs) is invalid. |
Error Sample Data Terminate Processes failed. Status Code: 401. Message: The value for parameter (Process IDs) is invalid. |
Terminate Processes
Terminates processes on a host of the Elastic Security managed endpoint.
READER NOTE
Endpoints IDs is a required parameter to run this command.
Run the List Endpoints command to obtain the Endpoints IDs. Endpoints IDs can be found in the returned raw data at the path $.data[*].metadata.agent.id.
Process IDs, Entity IDs, Alert IDs and Case IDs are optional parameters to run this command.
One of Process IDs or Entity IDs must be provided.
Run the List Processes command to obtain the Process IDs.
Run the List Processes command to obtain the Entity IDs. Entity IDs can be found from the returned raw data at the path $.parameters.entity_id.
Run the Fetch Event command to obtain the Alert IDs. Alert IDs can be found from the returned raw data at the path $.hits.hits[*]._id.
Run the List Cases command to obtain the Case IDs. Case IDs can be found from the returned raw data at the path $.cases[*].id.
Input
Input Parameter | Required/Optional | Description | Example |
Endpoint IDs | Required | The endpoint ID to terminate the process. Endpoint IDs can be obtained using the List Endpoints command. | ***-***-***-***-*** |
Process IDs | Optional | The list of process IDs for the processes to terminate. Process IDs can be obtained using the List Processes command. This parameter and the Entity IDs parameter cannot both be empty. The parameter Entity IDs will be omitted when Process IDs has a value. |
JSON
|
Entity IDs | Optional | The list of entity IDs for the processes to terminate. Entity IDs can be obtained using the List Processes command. This parameter and the Process IDs parameter cannot both be empty. This parameter will be omitted when Process IDs has a value. |
JSON
|
Comment | Optional | The comment for the terminate process action. The comment text will appear in associated cases. | Get processes list, pending further investigation(test) |
Alert IDs | Optional | The alert IDs that are associated with the action. The get process event will be logged in any cases associated with the specified alerts. Alert IDs can be obtained using the Fetch Event command. |
JSON
|
Case IDs | Optional | The case IDs that will log the action taken on. Case IDs can be obtained using the List Cases command. |
JSON
|
Output
To view the sample output data for all commands, refer to this article.
Error Handling
If the Return Data is Partially Successful or Failed, an Error tab will appear in the Test Result window.
The error tab contains the details responded from D3 SOAR or third-party API calls, including Failure Indicator, Status Code, and Message. This can help locate the root cause of a command failure.
Parts in Error | Description | Example |
Failure Indicator | Indicates the command failure that happened at a specific input and/or API call. | Terminate Processes failed. |
Status Code | The response code issued by the third-party API server or the D3 SOAR system that can be used to locate the corresponding error category. For example, if the returned status code is 401, the selected connection is unauthorized to run the command. The user or system support would need to check the permission setting in the Elastic Security portal. Refer to the HTTP Status Code Registry for details. | Status Code: 401. |
Message | The raw data or captured key error message from the integration API server about the API request failure. | Message: The value for parameter (Process IDs) is invalid. |
Error Sample Data Terminate Processes failed. Status Code: 401. Message: The value for parameter (Process IDs) is invalid. |
Update Alerts
Updates the status of the specified alerts.
READER NOTE
Alert IDs is an optional parameter to run this command.
At least one of the Alert IDs or Query needs to be filled.
Run the Fetch Event command to obtain the Alert IDs. Alert IDs can be found from the returned raw data at the path $.hits.hits[*]._id.
Input
Input Parameter | Required/Optional | Description | Example |
Alert IDs | Optional | The list of alert IDs to be updated. Alert IDs can be obtained using the Fetch Event command. This parameter and the Query parameter cannot both be empty. If both Alert IDs and Query have values, the value of the Query parameter will be ignored. |
JSON
|
Query | Optional | The query that determines which alerts will be updated. The input value will be set to the $.query.bool.filter array in the request body. This parameter and the Alert IDs parameter cannot both be empty. If both Alert IDs and Query have values, the value of the Query parameter will be ignored. Please refer to the link below for more details of the query syntax (https://www.elastic.co/guide/en/elasticsearch/reference/8.4/query-dsl.html). |
JSON
|
Status | Optional | The status to be updated to the specified alerts. The available values are Open and Closed. The default value is Closed. The In-progress option is only available for Kibana version 8.3. When the version is above 8.3 and In-progress is selected, it will be set to Closed status. | Open |
Output
To view the sample output data for all commands, refer to this article.
Error Handling
If the Return Data is Partially Successful or Failed, an Error tab will appear in the Test Result window.
The error tab contains the details responded from D3 SOAR or third-party API calls, including Failure Indicator, Status Code, and Message. This can help locate the root cause of a command failure.
Parts in Error | Description | Example |
Failure Indicator | Indicates the command failure that happened at a specific input and/or API call. | Update Alerts failed. |
Status Code | The response code issued by the third-party API server or the D3 SOAR system that can be used to locate the corresponding error category. For example, if the returned status code is 401, the selected connection is unauthorized to run the command. The user or system support would need to check the permission setting in the Elastic Security portal. Refer to the HTTP Status Code Registry for details. | Status Code: 401. |
Message | The raw data or captured key error message from the integration API server about the API request failure. | Message: Please make sure you have provided all correct Alert IDs. |
Error Sample Data Update Alerts failed. Status Code: 401. Message: Please make sure you have provided all correct Alert IDs. |
Test Connection
Allows users to perform a health check on an integration connection. Users can schedule a periodic health check by selecting Connection Health Check when editing an integration connection.
Input
N/A
Output
Output Type | Description | Return Data Type |
Return Data | Indicates one of the possible command execution states: Successful or Failed. The Failed state can be triggered by any of the following errors:
More details about an error can be viewed in the Error tab. | String |
Error Handling
If the Return Data is Failed, an Error tab will appear in the Test Result window.
The error tab contains the details responded from D3 SOAR or third-party API calls, including Failure Indicator, Status Code, and Message. This can help locate the root cause of a command failure.
Parts in Error | Description | Example |
Failure Indicator | Indicates the command failure that happened at a specific input and/or API call. | Test Connection failed. Failed to check the connector. |
Status Code | The response code issued by the third-party API server or the D3 SOAR system that can be used to locate the corresponding error category. For example, if the returned status code is 401, the selected connection is unauthorized to run the command. The user or system support would need to check the permission setting in the Elastic Security portal. Refer to the HTTP Status Code Registry for details. | Status Code: 403. |
Message | The raw data or captured key error message from the integration API server about the API request failure. | Message: The remote server refused to connect, please check Server URL or API service availability. |
Error Sample Data Test Connection failed. Failed to check the connector. Status Code: 403. Message: The remote server refused to connect, please check Server URL or API service availability. |