
Devo Query
LAST UPDATED: JULY 30, 2025
Overview
Devo SIEM is a cloud-based data logging and security analytics platform designed to improve access to security data across an enterprise. Security teams have access to real-time and historical data to quickly respond to their organization’s threat landscape. This integration allows organizations to query and manage alerts as well as other data sources.
Devo Query is available for use in:
With the Devo Query integration, D3 SOAR can:
Automatically ingest events from Devo’s alert tables after configuring scheduled jobs in the Fetch Event command.
Normalize event log data from Devo after configuring field extraction mapping for better visibility of ingested Devo alerts on D3’s Investigation Dashboard.
Automatically perform initial enrichment, data cleansing, and correlation on ingested Devo alerts to determine whether they are potential threats with the default Event Playbook. Events marked as threats will be further processed as incidents in an Incident Playbook.
Execute the Run Query command to gain contextual information for dynamic incident investigations with the ad-hoc command feature. The Run Query command can also be used as automated Incident Playbook tasks.
Connection
To connect to Devo Query from D3 SOAR, please follow this part to collect the required information below:
Parameter | Description | Example |
Server URL (domain level) | The server URL of the Devo API. | https://apiv2-us.devo.com |
API Key | The API key for authentication. | 739a347d9***********d8b4426 |
API Secret | The API secret for authentication. | 76cf41************399a088 |
Permission Requirements
Each endpoint in the Devo Query API requires a certain permission scope. The following are required scopes for each command in this integration:
Command | Required Permissions |
Run Query | Alerts > Alert configuration with view/manage permission Alerts > Triggered alerts with view permission Data > Aggregation Tasks > Domain aggregation tasks with view permission Data > Input Data > Data upload with view/manage permission Data > Input Data > Relays with view permission Data Search > Finders with view/manage permission Data Search > Search Window > Custom tables with view/manage permission Data Search > Search Window > Data search download with view permission Data Search > Search Window > Log autoparser with view/manage permission Data Search > Search Window > Show/hide columns with view/manage permission Data Search > Search Window > Time control with view/manage permission |
Fetch Event | |
Test Connection |
Configuring Devo Query to Work with D3 SOAR
Log in to the Devo Data Analytics Platform with your credentials.
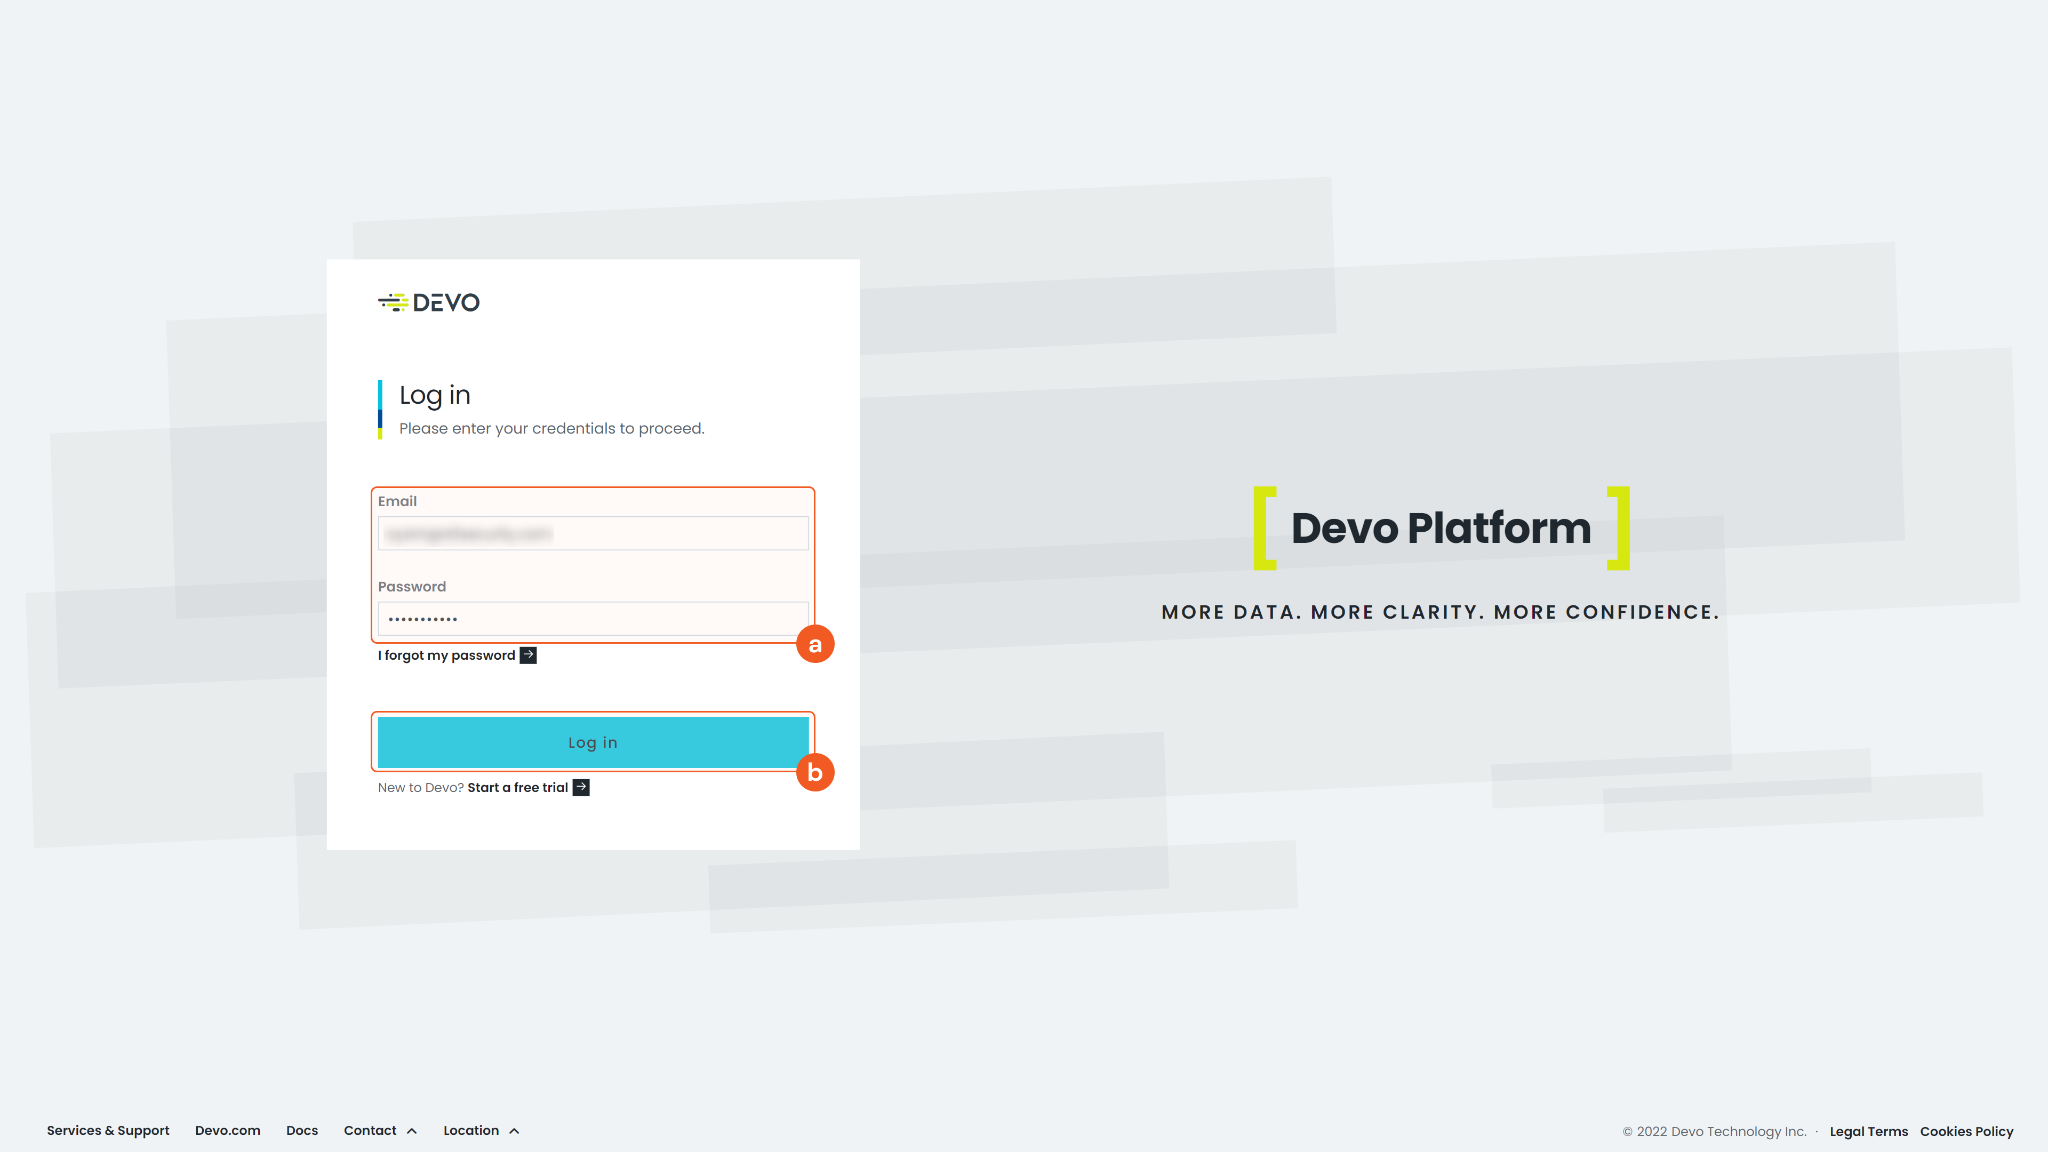
READER NOTE
To use a domain API key and API secret to sign the API request, your account must have Admin privileges.
Devo’s login site URL is different depending on your geographic location:
In North America, use https://us.devo.com/login
In Europe, use https://eu.devo.com/login
In Spain, use https://es.devo.com/login
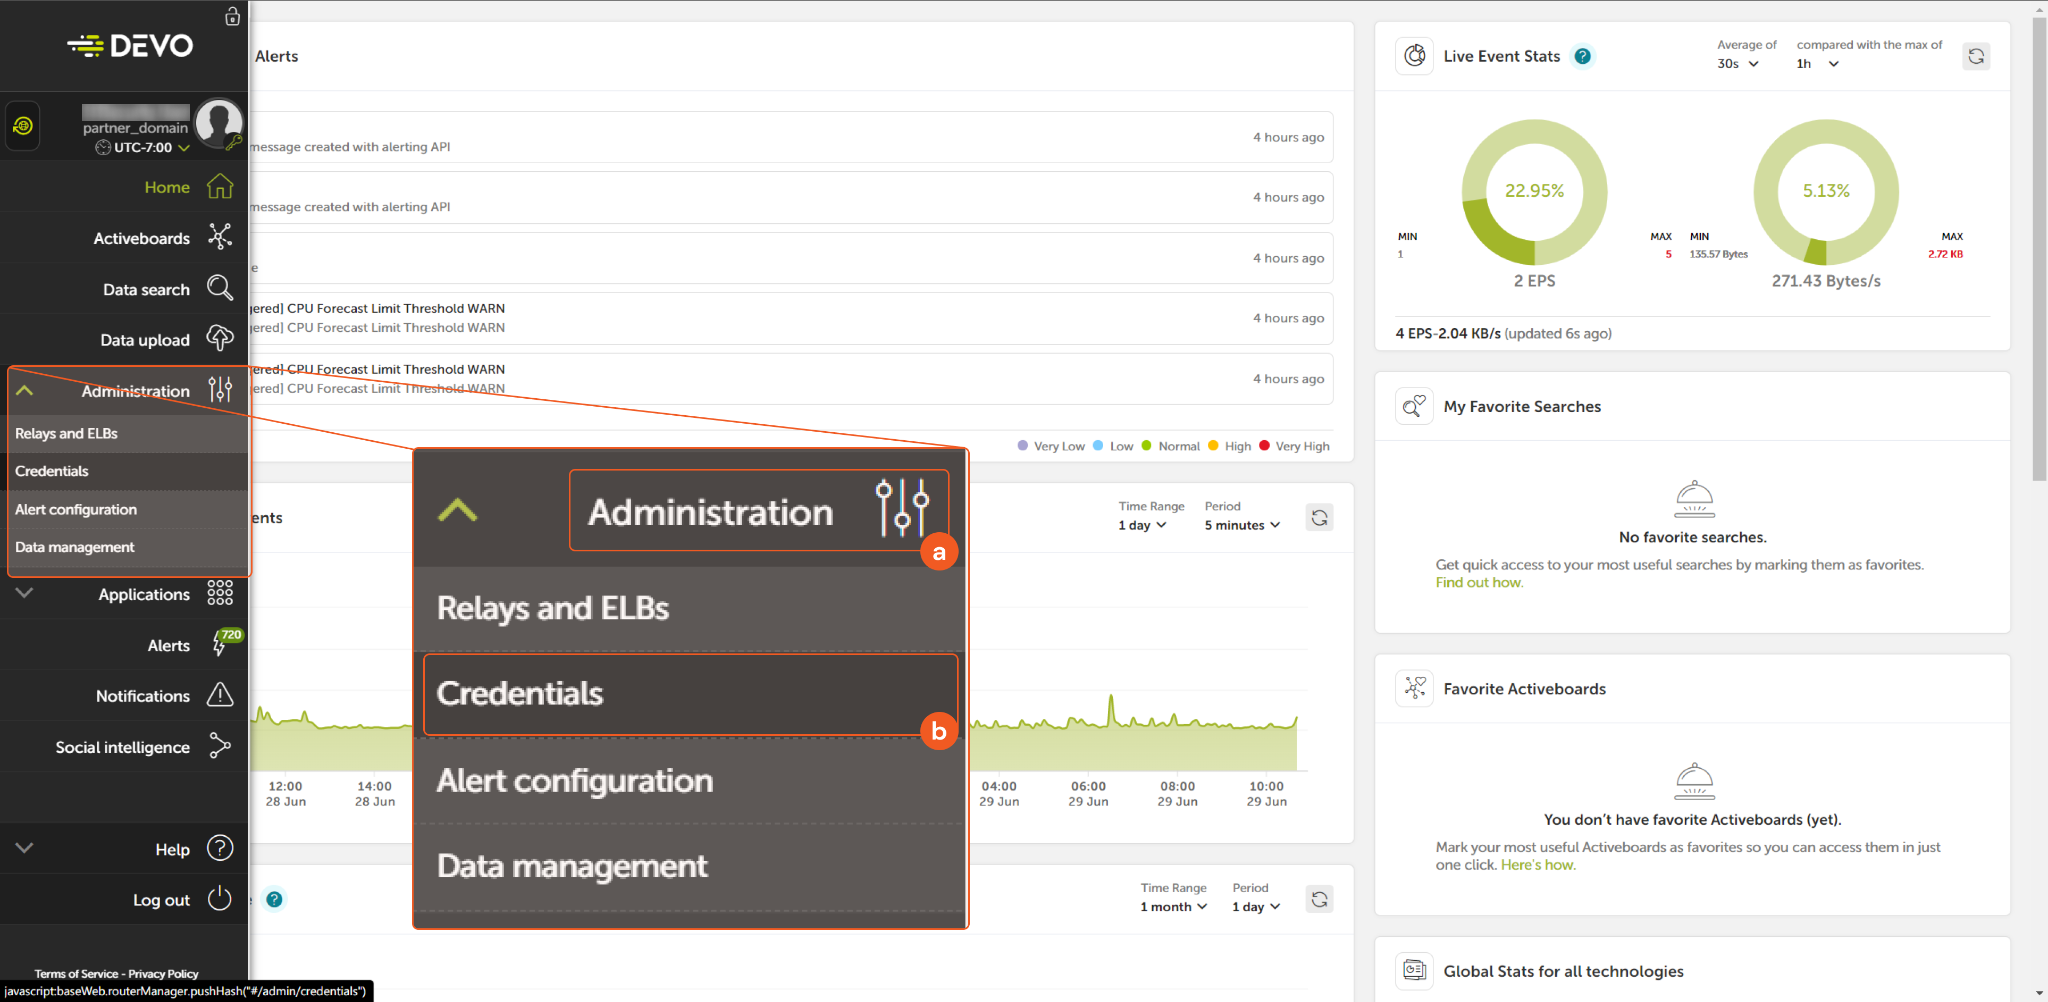
Click the Administration tab on the left sidebar menu to expand the submenu, then click Credentials.
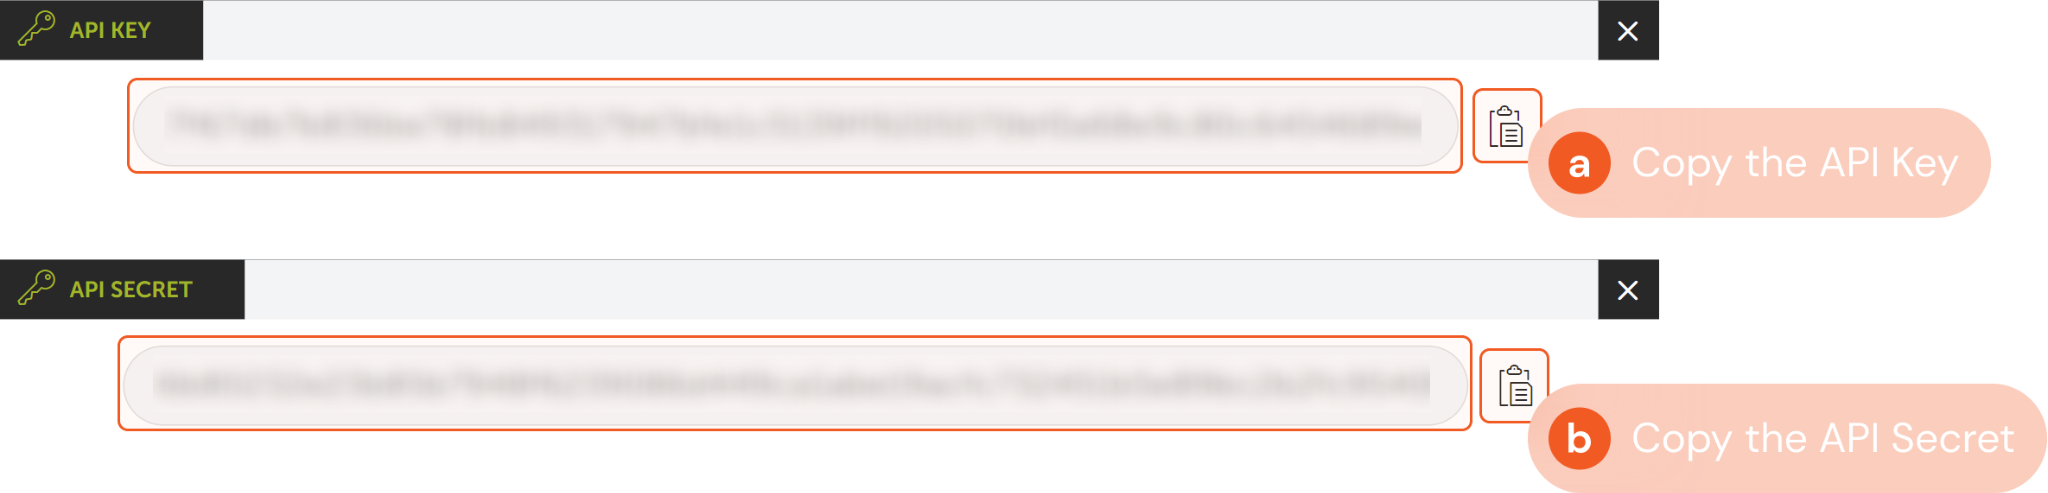
Under the Access Keys tab, click Show to display the API Key and API Secret for the user you will use for the integration connection.
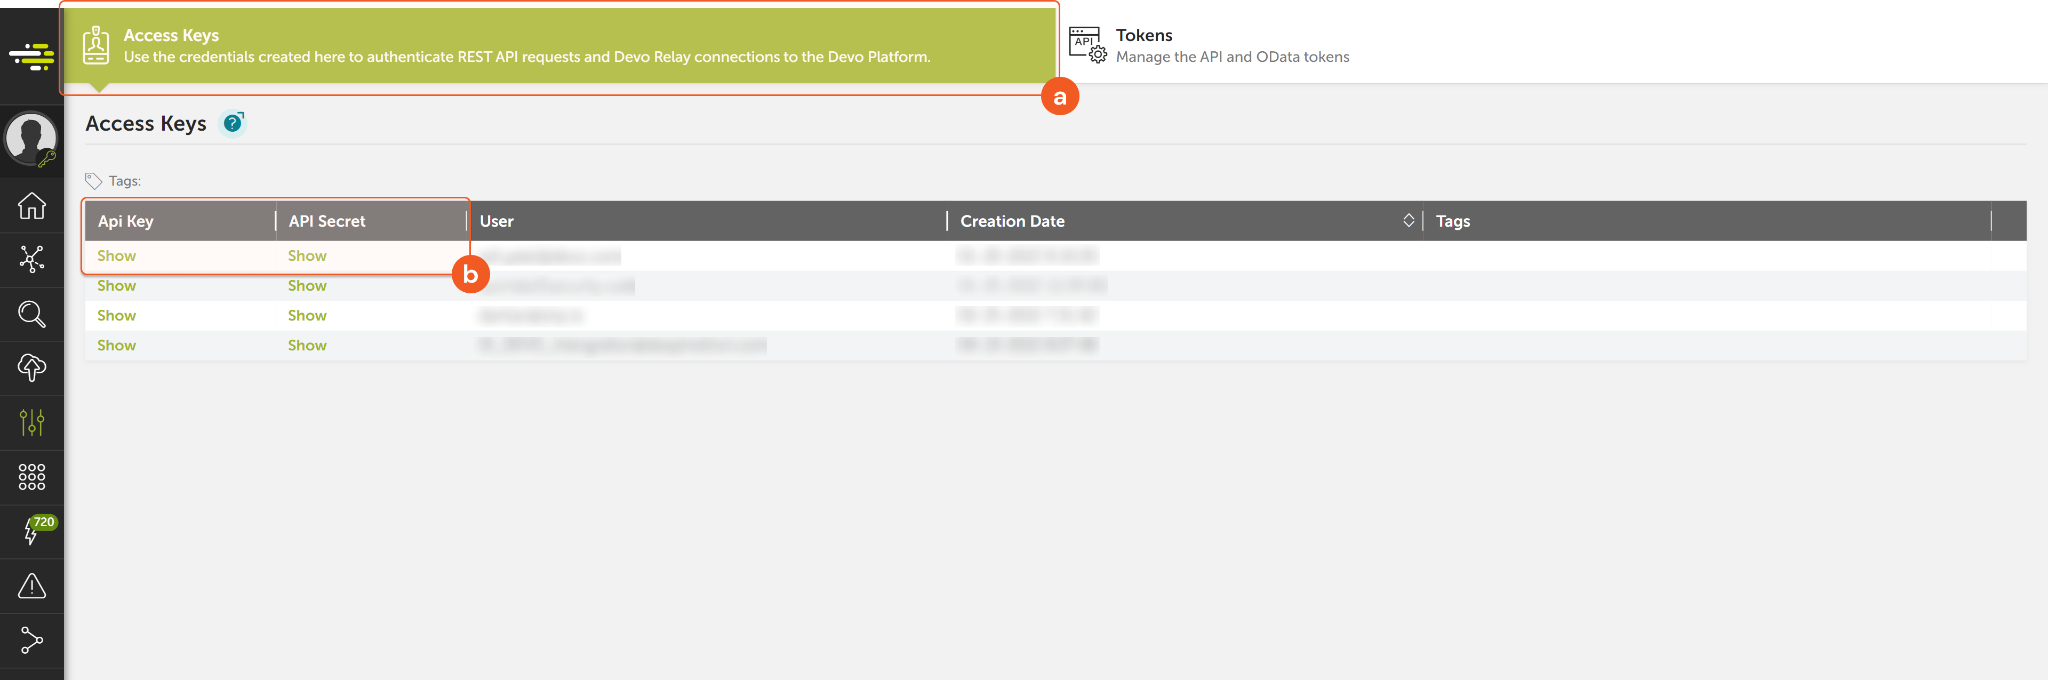
Copy and save API Key and API Secret for D3 SOAR connection in later steps.
Configuring D3 SOAR to Work with Devo Query
Log in to D3 SOAR.
Find the Devo Query integration.
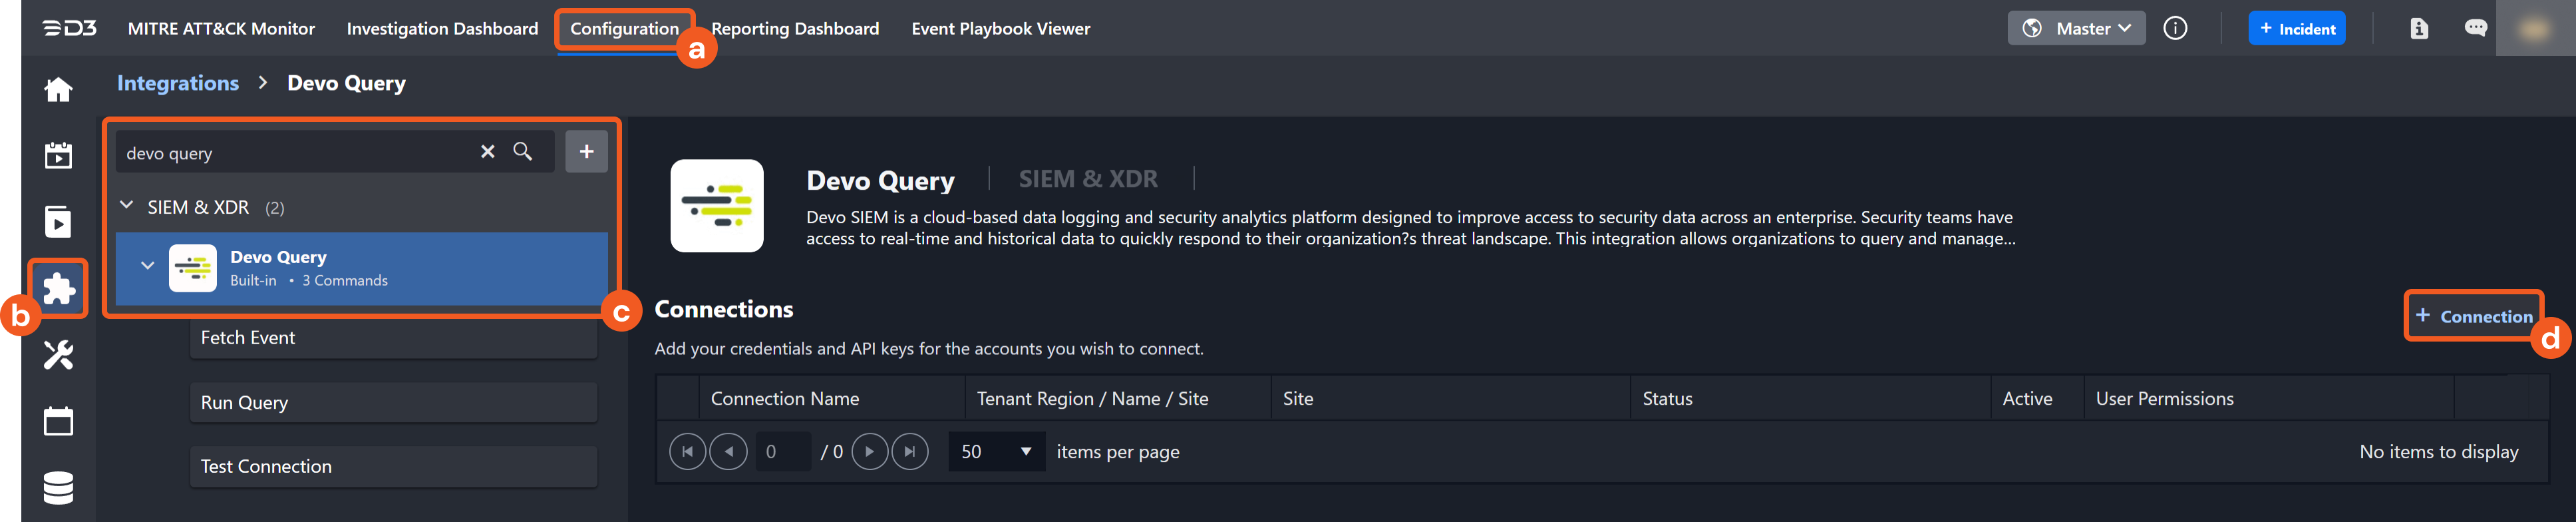
Navigate to Configuration on the top header menu.
Click on the Integration icon on the left sidebar.
Type Devo Query in the search box to find the integration, then click it to select it.
Click + Connection, on the right side of the Connections section. A new connection window will appear.
Configure the following fields to create a connection to Devo Query.
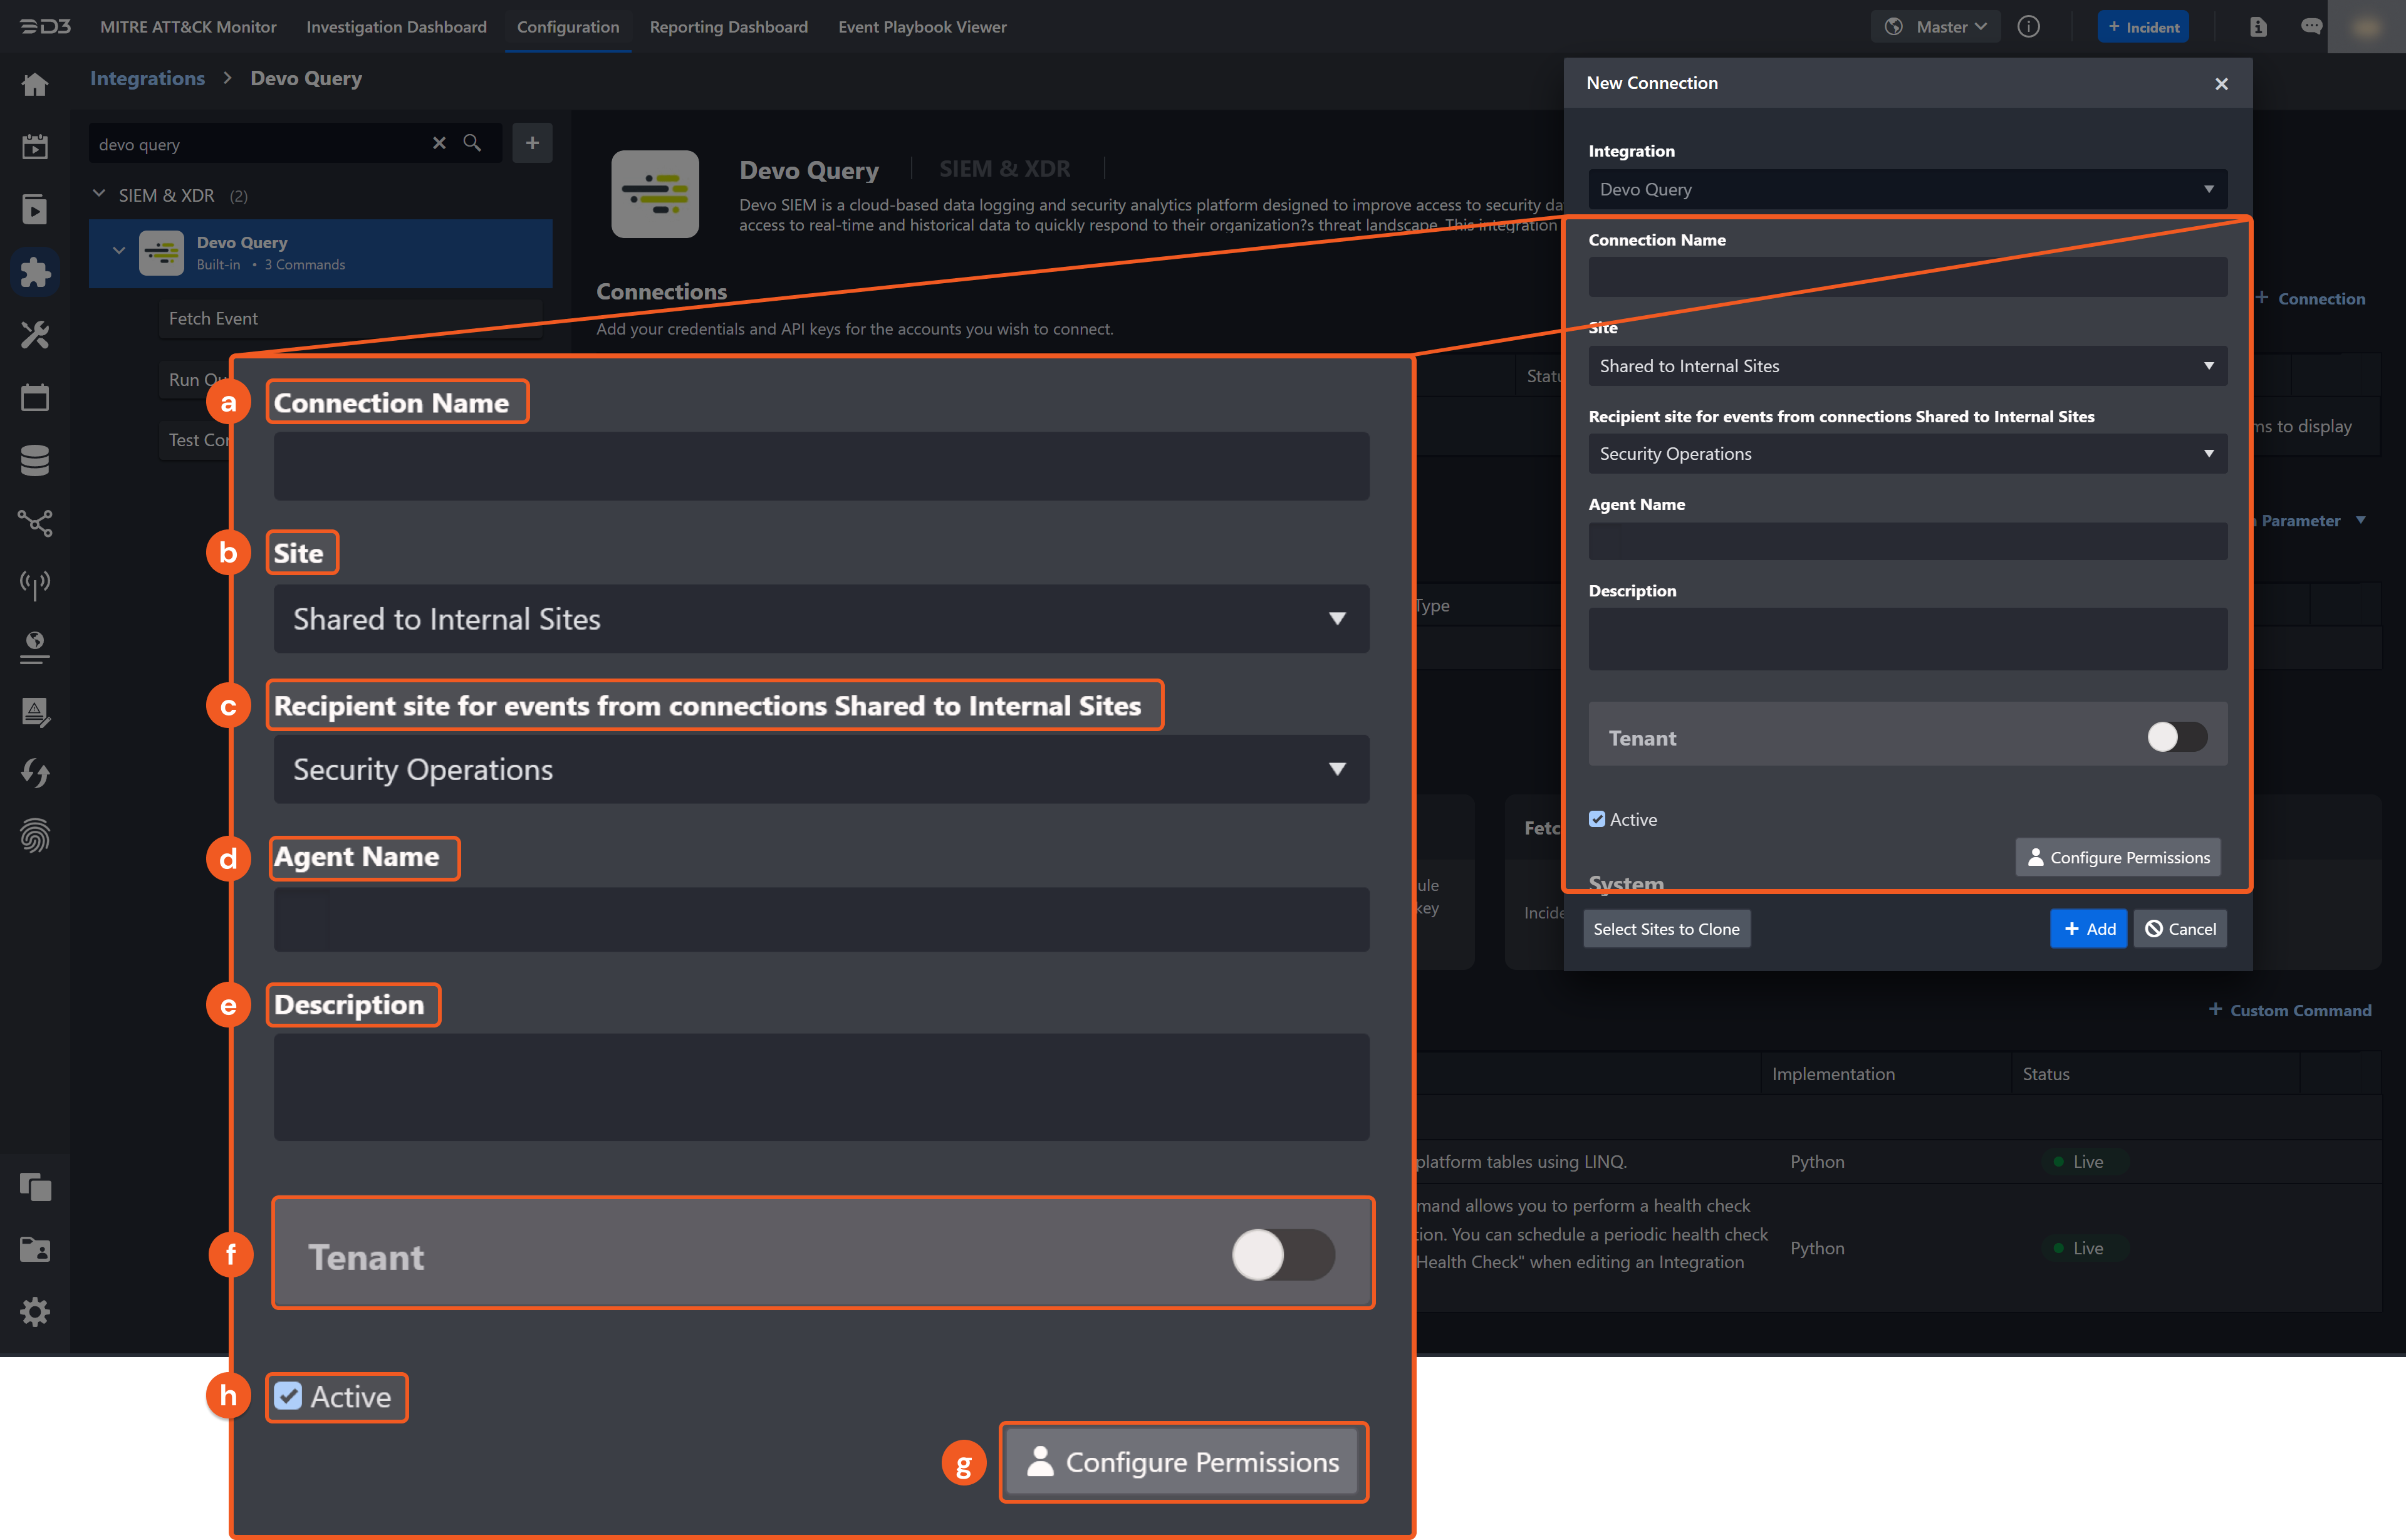
Connection Name: The desired name for the connection.
Site: Specifies the site to use the integration connection. Use the drop-down menu to select the site. The Share to Internal Sites option enables all sites defined as internal sites to use the connection. Selecting a specific site will only enable that site to use the connection.
Recipient site for events from connections Shared to Internal Sites: This field appears if you selected Share to Internal Sites for Site to let you select the internal site to deploy the integration connection.
Agent Name (Optional): Specifies the proxy agent required to build the connection. Use the dropdown menu to select the proxy agent from a list of previously configured proxy agents.
Description (Optional): Add your desired description for the connection.
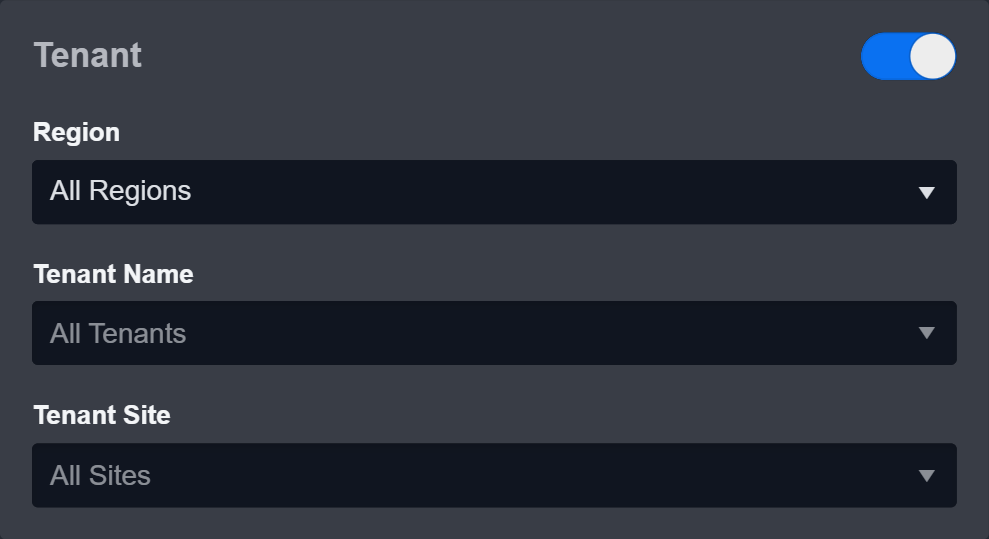
Tenant (Optional): When configuring the connection from a master tenant site, you have the option to choose the specific tenant sites you want to share the connection with. Once you enable this setting, you can filter and select the desired tenant sites from the dropdowns to share the connection.
Configure User Permissions: Defines which users have access to the connection.
Active: Check the tick box to ensure the connection is available for use.
.png?inst-v=af46509e-712d-44d1-86ae-063065b59543)
System: This section contains the parameters defined specifically for the integration. These parameters must be configured to create the integration connection.
1. Input your domain level Server URL. The default value is https://apiv2-us.devo.com.
2. Input the API Key. Refer to step 4 of Configuring Devo Query to Work with D3 SOAR.
3. Input the API Secret. Refer to step 4 of Configuring Devo Query to Work with D3 SOAR.
Note: The default server URL is set to https://apiv2-us.devo.com. Input the server URL based on your Devo domain’s geographic region:USA: https://apiv2-us.devo.com
EU: https://apiv2-eu.devo.com
GCP (Spain): https://apiv2-es.devo.com
Enable Password Vault: An optional feature that allows users to take the stored credentials from their own password vault. Please refer to the password vault connection guide if needed.
Connection Health Check: Updates the connection status you have created. A connection health check is done by scheduling the Test Connection command of this integration. This can only be done when the connection is active.
To set up a connection health check, check the Connection Health Check tickbox. You can customize the interval (minutes) for scheduling the health check. An email notification can be set up after a specified number of failed connection attempts.
Test the connection.
Click Test Connection to verify the account credentials and network connection. If the Test Connection Passed alert window appears, the test connection is successful. You will see Passed with a green checkmark appear beside the Test Connection button. If the test connection fails, please check your connection parameters and try again.
Click OK to close the alert window.
Click + Add to create and add the configured connection.
Commands
Devo Query includes the following executable commands for users to set up schedules or create playbook workflows. With the Test Command, you can execute these commands independently for playbook troubleshooting.
Integration API Note
For more information about the Devo Query API, please refer to the Devo Query API reference.
READER NOTE
Certain permissions are required for each command. Please refer to the Permission Requirements and Configuring Devo Query to Work with D3 SOAR for details.
Integration Designed Query
Some commands require structured input arguments in Language Integrated Query (LINQ). LINQ syntax is similar to that of SQL. Refer to LINQ query examples from Devo’s documentation for detail.
To fit the LINQ query into D3 SOAR commands’ input arguments, you can omit some duplicated inputs. An example of an original LINQ query is as follows:
from siem.logtrust.alert.info
where priority >=1.0 and context = "my.alert.partner_domain.CrowdstrikeAlert"
select * limit 10
The corresponding inputs for integration commands in D3 are as follows:
Command | Input Parameter | D3 Structured Input |
Fetch Event | Search Condition | priority >=1.0 and context = "my.alert.partner_domain.CrowdstrikeAlert" |
Run Query | Query | from siem.logtrust.alert.info where priority >=1.0 and context = my.alert.partner_domain.CrowdstrikeAlert" select * limit 10 |
Note for Time-related parameters
The input format of time-related parameters may vary based on your account settings. As a result, the sample data provided in our commands is different from what you see. To set your preferred time format, follow these steps:
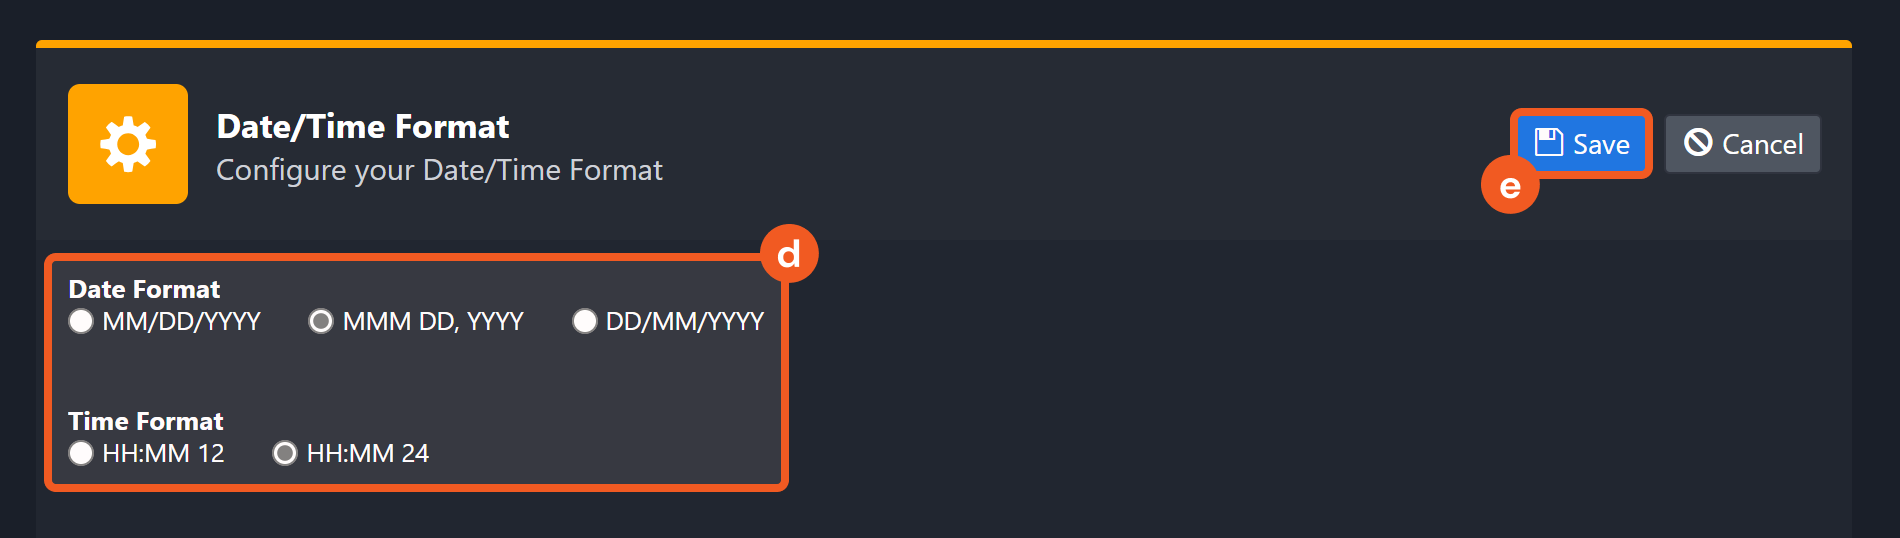
Navigate to Configuration > Application Settings. Select Date/Time Format.
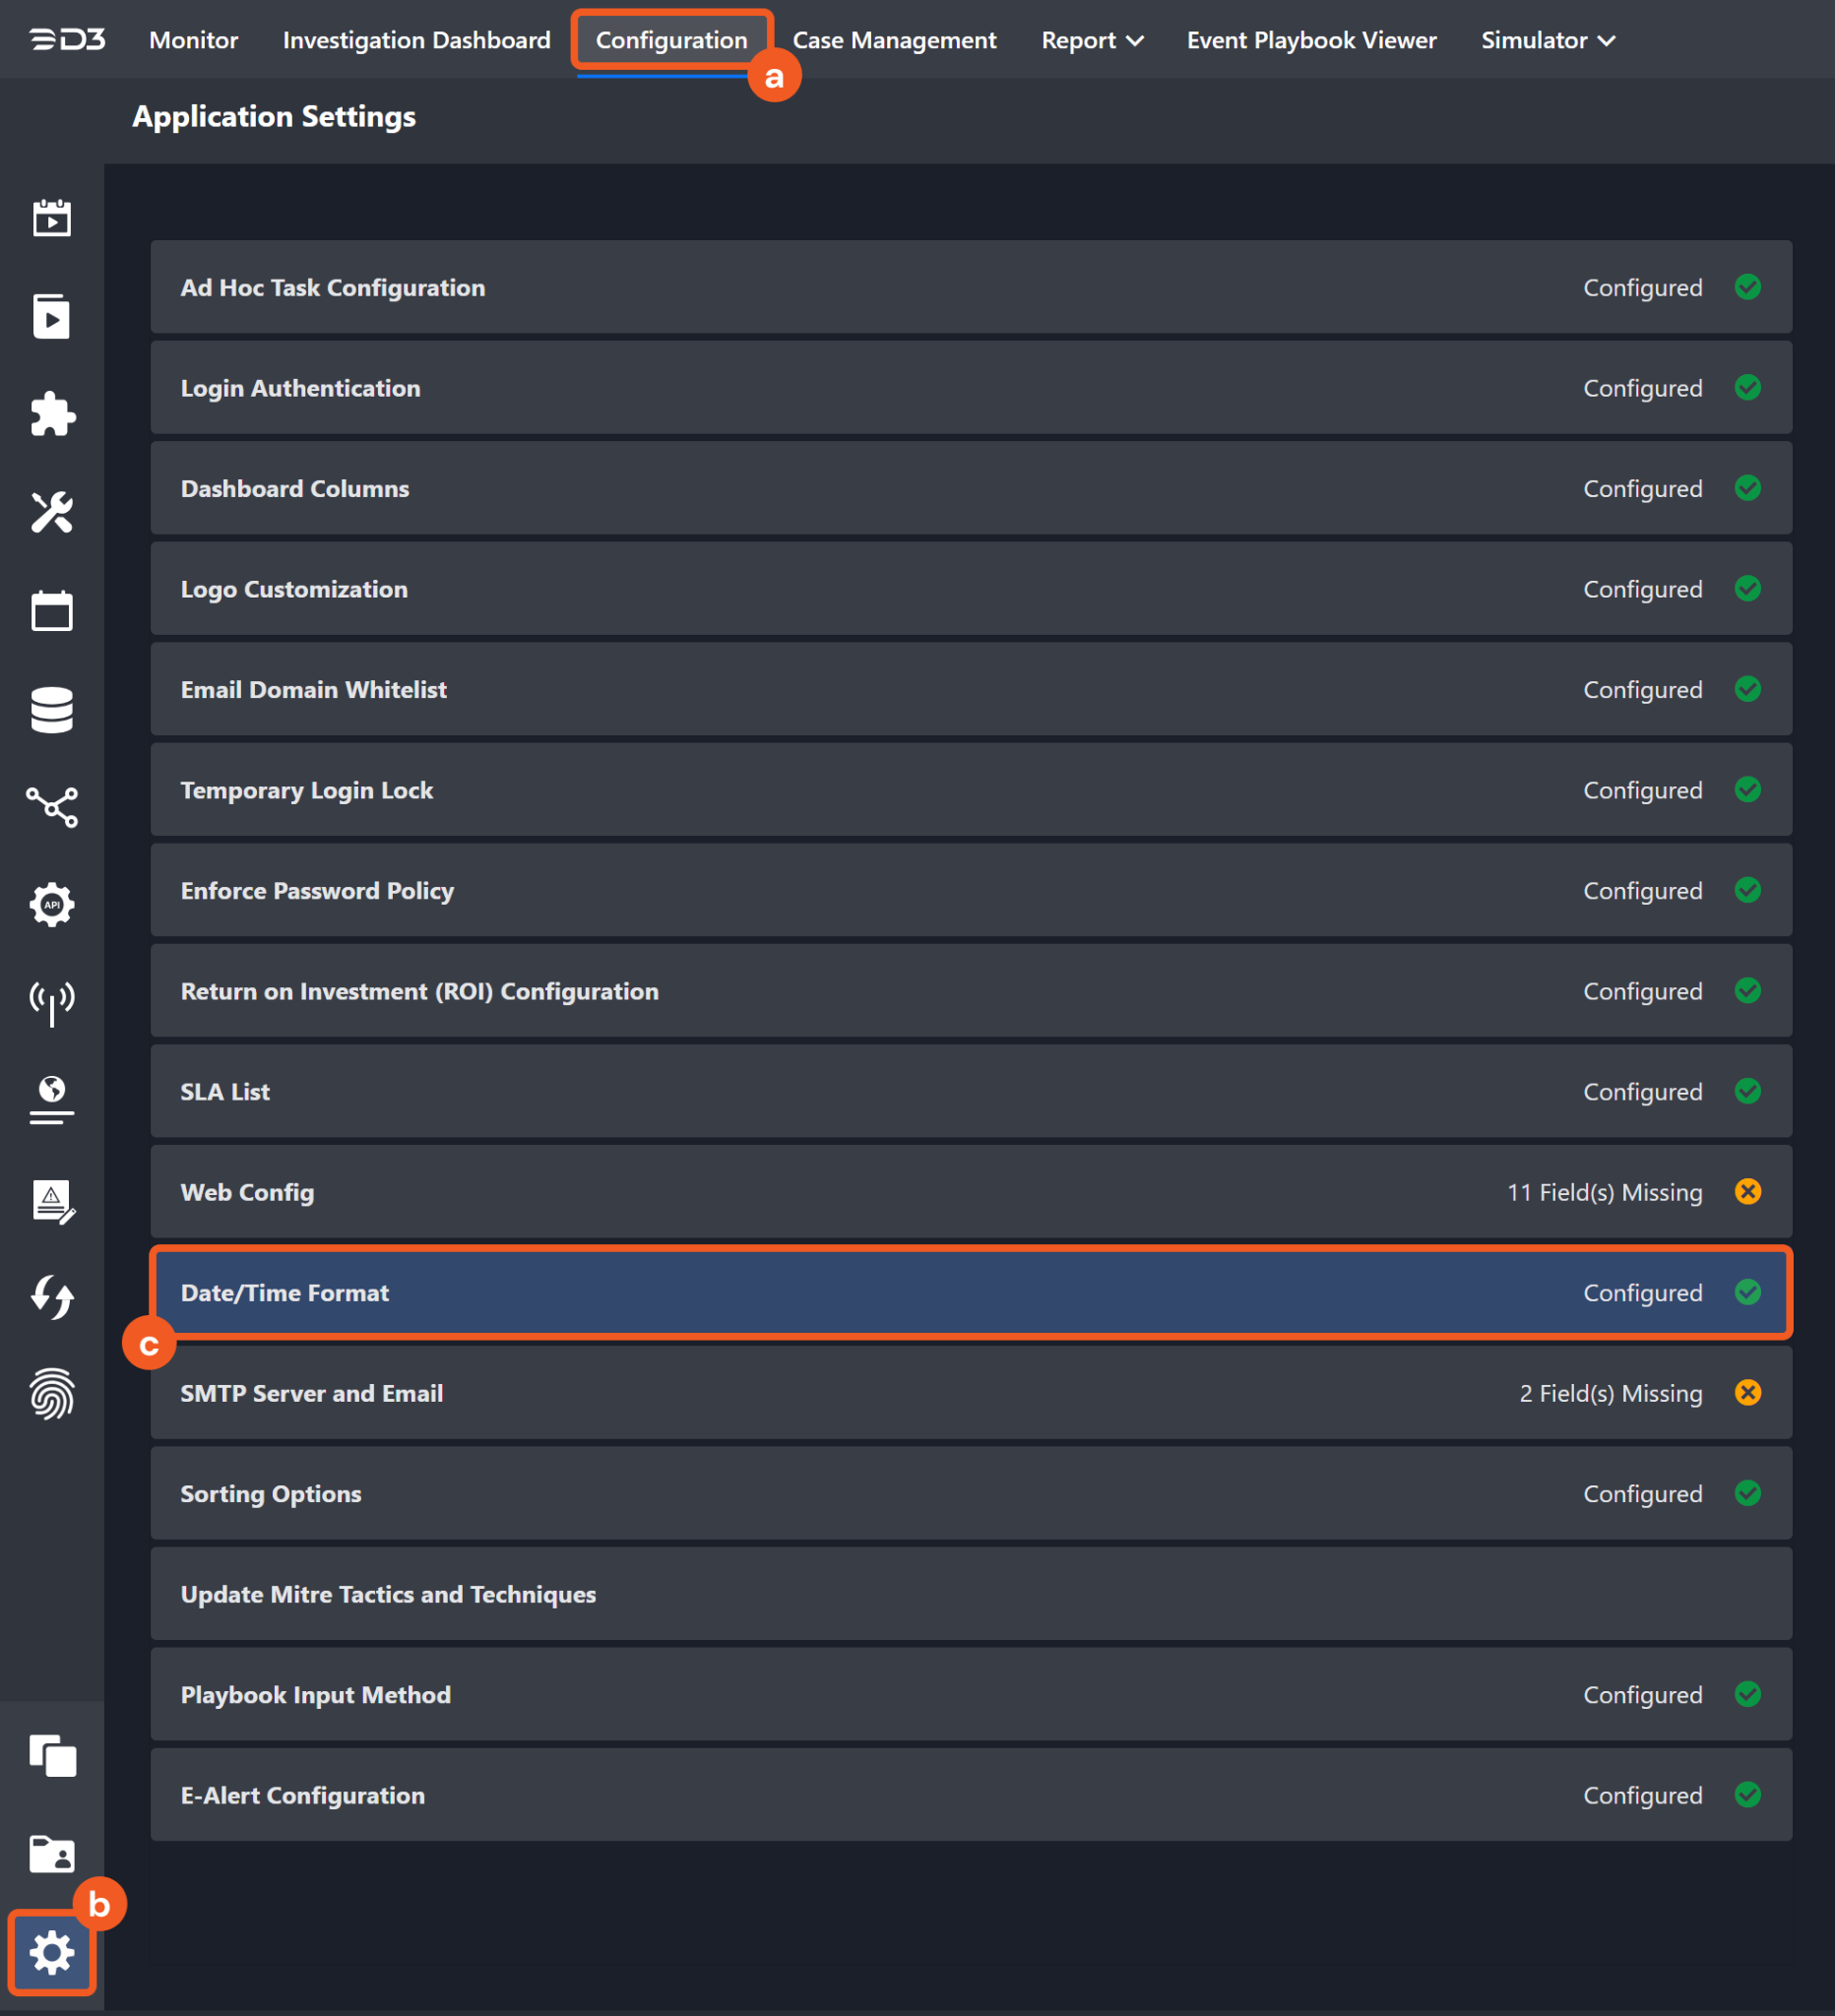
Choose your desired date and time format.
After that, you will be able to view your preferred time format when configuring the DateTime input parameters for commands.
Fetch Event
Returns events from Devo SIEM based on specified query criteria.
READER NOTE
If the input is 10 minutes later than the current time for the End Time parameter, the current time will be used. This prevents the command from idling until future events have taken place.
The number of events returned is limited by defining the search criteria. If not specified, all events within the specified time range of the query will be returned. It is recommended to limit the number of events returned because the command might timeout.
Input
Input Parameter | Required/Optional | Description | Example |
Start Time | Required | The start time for retrieving event(s) that were created after the provided start time, in UTC time. | 2022-08-02 00:00 |
End Time | Required | The end time for retrieving event(s) that were created before the provided start time, in UTC time. | 2022-08-05 00:00 |
Number of Event(s) Fetched | Optional | The maximum number of events to return. The last created event will be returned first. | 5 |
Search Condition | Optional | The LINQ conditions to filter returned events. For more about LINQ syntax, please refer to Build a query using LINQ from Devo’s documentation. Note: This command was designed to search the table siem.logtrust.alert.info. You will only need to specify the condition for where clauses (e.g. priority >=1.0 and context = "my.alert.partner_domain.CrowdstrikeAlert). | priority >=1.0 and context = "my.alert.partner_domain.CrowdstrikeAlert" |
Table Name | Optional | The name of the table to retrieve events from. If this parameter is not defined, the command will retrieve data from the table siem.logtrust.alert.info. | siem.logtrust.alert.info |
Tolerance Scope | Optional | The tolerance scope (in minutes) for the query to fetch events between the specified start and end time to avoid event loss or fetch failure. The events will be fetched between {Start Time - Tolerance Scope, End Time}. The default value is 0. | 5 |
Output
Fetch Event Field Mapping
Please note that Fetch Event commands require event field mapping. Field mapping plays a key role in the data normalization process part of the event pipeline. Field mapping converts the original data fields from the different providers to the D3 fields which are standardized by the D3 Model. Please refer to Event and Incident Intake Field Mapping for details.
If you require a custom field mapping, click +Add Field to add a custom field mapping. You may also remove built-in field mappings by clicking x. Please note that two underscore characters will automatically prefix the defined Field Name as the System Name for a custom field mapping. Additionally, if an input Field Name contains any spaces, they will automatically be replaced with underscores for the corresponding System Name.
As a system integration, the Devo Query integration has some pre-configured field mappings for default field mapping.
Default Event Source
The Default Event Source is the default set of field mappings that are applied when this fetch event command is executed. For out-of-the-box integrations, you will find a set of field mapping provided by the system. Default event source provides field mappings for common fields from fetched events. The default event source has a “Main Event JSON Path” (i.e., $.object) that is used to extract a batch of events from the response raw data. Click Edit Main JSON Path to view the “Main Event JSON Path”..png?inst-v=af46509e-712d-44d1-86ae-063065b59543)
Main Event JSON Path: $.object
The Main Event JSON Path determines the root path where the system starts parsing raw response data into D3 event data. The JSON path begins with $, representing the root element. The path is formed by appending a sequence of child elements to $, each separated by a dot (.). Square brackets with nested quotation marks ([‘...’]) should be used to separate child elements in JSON arrays.
For example, the root node of a JSON Path is object. The child node denoting the Unique Event Key field would be alertId. Putting it together, the JSON Path expression to extract the Unique Event Key is $.object.alertId.
The pre-configured field mappings are detailed below:
Field Name | Source Field |
Unique Event Key | .alertId |
Start Time | .eventdate |
Event Type | .context |
Status | .status |
Priority | .priority |
Hostname | .alertHost |
Event category | .category |
Source hostname | .srcHost |
Source IP address | .srcIp |
Source port | .srcPort |
Destination hostname | .dstHost |
Destination IP address | .dstIp |
Destination port | .dstPort |
Protocol info | .protocol |
Username | .username |
Extra Data | .extraData |
Error Handling
If the Return Data is Failed, an Error tab will appear in the Test Result window.
The error tab contains the details responded from D3 SOAR or third-party API calls, including Failure Indicator, Status Code, and Message. This can help you locate the root cause of a command failure.
Parts in Error | Description | Example |
Failure Indicator | Indicates the command failure that happened at a specific input and/or API call. | Fetch Event failed. |
Status Code | The response code issued by the third-party API server or the D3 SOAR system that can be used to locate the corresponding error category. For example, if the returned status code is 401, the selected connection is unauthorized to run the command. The user or system support would need to check the permission setting in the Devo Query portal. Refer to the HTTP Status Code Registry for details. | Status Code: 410 |
Message | The raw data or captured key error message from the integration API server about the API request failure. | Message: Failed due to maximum command execution time exceeded. |
Error Sample Data Fetch Event failed. Status Code: 410. Message: Failed due to maximum command execution time exceeded. |
Run Query
Queries data in the Devo platform tables using LINQ.
Input
Input Parameter | Required/Optional | Description | Example |
From | Required | The start time for querying data created after the provided start time, in UTC time. | 2022-05-18 00:00 |
To | Required | The end time for querying data created before the provided end time, in UTC time. | 2022-05-21 00:00 |
Query | Required | The LINQ query string to run. For more about LINQ syntax, please refer to Build a query using LINQ from Devo’s documentation. Please refer to the Integration Design Query section above for more details. | from demo.ecommerce.data where method='POST' and bytesTransferred > 800 select * limit 10 |
Output
Error Handling
If the Return Data is Partially Successful or Failed, an Error tab will appear in the Test Result window.
The error tab contains the details responded from D3 SOAR or third-party API calls, including Failure Indicator, Status Code, and Message. This can help you locate the root cause of a command failure.
Parts in Error | Description | Example |
Failure Indicator | Indicates the command failure that happened at a specific input and/or API call. | Run Query failed. |
Status Code | The response code issued by the third-party API server or the D3 SOAR system that can be used to locate the corresponding error category. For example, if the returned status code is 401, the selected connection is unauthorized to run the command. The user or system support would need to check the permission setting in the Devo Query portal. Refer to the HTTP Status Code Registry for details. | Status code: 405 |
Message | The raw data or captured key error message from the integration API server about the API request failure. | Message: Date from not valid or not found. |
Error Sample Data Run Query failed. Status Code: 405. Message: Date from not valid or not found. |
Test Connection
Allows you to perform a health check on an integration connection. You can schedule a periodic health check by selecting Connection Health Check when editing an integration connection.
Input
N/A
Output
Error Handling
If the Return Data is Failed, an Error tab will appear in the Test Result window.
The error tab contains the details responded from D3 SOAR or third-party API calls, including Failure Indicator, Status Code, and Message. This can help you locate the root cause of a command failure.
Parts in Error | Description | Example |
Failure Indicator | Indicates the command failure that happened at a specific input and/or API call. | Test Connection failed. Failed to check the connector. |
Status Code | The response code issued by the third-party API server or the D3 SOAR system that can be used to locate the corresponding error category. For example, if the returned status code is 401, the selected connection is unauthorized to run the command. The user or system support would need to check the permission setting in the Devo Query portal. Refer to the HTTP Status Code Registry for details. | Status Code: 401. |
Message | The raw data or captured key error message from the integration API server about the API request failure. | Message: Unauthorized HTTP Status error. |
Error Sample Data Test Connection failed. Failed to check the connector. Status Code: 401. Message: Unauthorized HTTP Status error. |
FAQ
Q: What is Devo?
A: Devo is a cloud-based multi-tenant, centralized log management solution designed for large-scale and performance requirements. Devo collects machine data generated by traditional machine data sources and business applications in real-time and provides analytics in a centralized platform. Devo allows organizations to gain insight into their applications, infrastructure, and business systems with built-in applications, real-time dashboards, and alerts. It also provides security and IT professionals and data scientists the tools they need to extract valuable and actionable intelligence from petabytes of data.
Q: How does Devo work with D3 SOAR?
A: Events are retrieved from Devo in JSON format and sent to D3 SOAR via REST API.