
Devo Alerts
LAST UPDATED: JULY 30, 2025
Overview
Devo SIEM is a cloud-based data logging and security analytics platform designed to improve access to security data across an enterprise. Security teams have access to real-time and historical data to quickly respond to their organization's threat landscape. This integration allows organizations to query and manage alerts as well as other data sources.
D3 SOAR is providing REST operations to function with Devo Alerts.
Devo Alerts is available for use in:
Connection
To connect to Devo Alerts from D3 SOAR, please follow this part to collect the required information below:
Parameter | Description | Example |
Server URL | The server URL of the Devo Alerts API. | https://api-us.devo.com |
Stand Alone Token | The stand alone token for authentication. | 16a1****************f239 |
API Version | The version of the API to use for the connection. | v1 |
Configuring Devo Alerts to Work with D3 SOAR
Generating Authentication Tokens
Refer to Authentication tokens from Devo's documentation for instructions on generating authentication tokens. A token is required to establish the integration connection in D3 SOAR.
Authorizing Alerts API Requests
Refer to Authorizing Alerts API requests from Devo's documentation for instructions on authorizing access for the Alerts API.
When utilizing API access through an authorized token, the tasks you are allowed to perform are determined by the role permissions assigned to your account in Devo. To understand the specific role permissions required for different types of requests, please refer to the Working with the Alerts API documentation.
Once the token is generated, it can be found in the table. Click its name and copy the token value from the details window that appears.
Configuring D3 SOAR to Work with Devo Alerts
Log in to D3 SOAR.
Find the Devo Alerts integration.
.png?inst-v=58b65ad9-4f60-4ed1-a7f3-2491ba9726de)
Navigate to Configuration on the top header menu.
Click on the Integration icon on the left sidebar.
Type Devo Alerts in the search box to find the integration, then click it to select it.
Click + Connection, on the right side of the Connections section. A new connection window will appear.
Configure the following fields to create a connection to Devo Alerts.
.png?inst-v=58b65ad9-4f60-4ed1-a7f3-2491ba9726de)
Connection Name: The desired name for the connection.
Site: Specifies the site to use the integration connection. Use the drop-down menu to select the site. The Share to Internal Sites option enables all sites defined as internal sites to use the connection. Selecting a specific site will only enable that site to use the connection.
Recipient site for events from connections Shared to Internal Sites: This field appears if you selected Share to Internal Sites for Site to let you select the internal site to deploy the integration connection.
Agent Name (Optional): Specifies the proxy agent required to build the connection. Use the dropdown menu to select the proxy agent from a list of previously configured proxy agents.
Description (Optional): Add your desired description for the connection.
Tenant (Optional): When configuring the connection from a master tenant site, you have the option to choose the specific tenant sites you want to share the connection with. Once you enable this setting, you can filter and select the desired tenant sites from the dropdowns to share the connection.
Configure User Permissions: Defines which users have access to the connection.
Active: Check the tick box to ensure the connection is available for use.
.png?inst-v=58b65ad9-4f60-4ed1-a7f3-2491ba9726de)
System: This section contains the parameters defined specifically for the integration. These parameters must be configured to create the integration connection.
1. Input the Server URL. The default value is https://api-us.devo.com.
2. Copy the Stand Alone Token from the Devo Alerts platform. Refer to Configuring Devo Alerts to Work with D3 SOAR.
3. Input the API Version. The default value is v1.Connection Health Check: Updates the connection status you have created. A connection health check is done by scheduling the Test Connection command of this integration. This can only be done when the connection is active.
To set up a connection health check, check the Connection Health Check tickbox. You can customize the interval (minutes) for scheduling the health check. An email notification can be set up after a specified number of failed connection attempts.Enable Password Vault: An optional feature that allows users to take the stored credentials from their own password vault. Please refer to the password vault connection guide if needed.
Test the connection.
Click Test Connection to verify the account credentials and network connection. If the Test Connection Passed alert window appears, the test connection is successful. You will see Passed with a green checkmark appear beside the Test Connection button. If the test connection fails, please check your connection parameters and try again.
Click OK to close the alert window.
Click + Add to create and add the configured connection.
Commands
Devo Alerts includes the following executable commands for users to set up schedules or create playbook workflows. With the Test Command, you can execute these commands independently for playbook troubleshooting.
Integration API Note
For more information about the Devo Alerts API, please refer to the Devo Alerts API reference.
READER NOTE
Certain permissions are required for each command. Please refer to Authorizing Alerts API Requests and Configuring Devo Alerts to Work with D3 SOAR for details.
Note for Time-related parameters
The input format of time-related parameters may vary based on your account settings. As a result, the sample data provided in our commands is different from what you see. To set your preferred time format, follow these steps:
Navigate to Configuration > Application Settings. Select Date/Time Format.
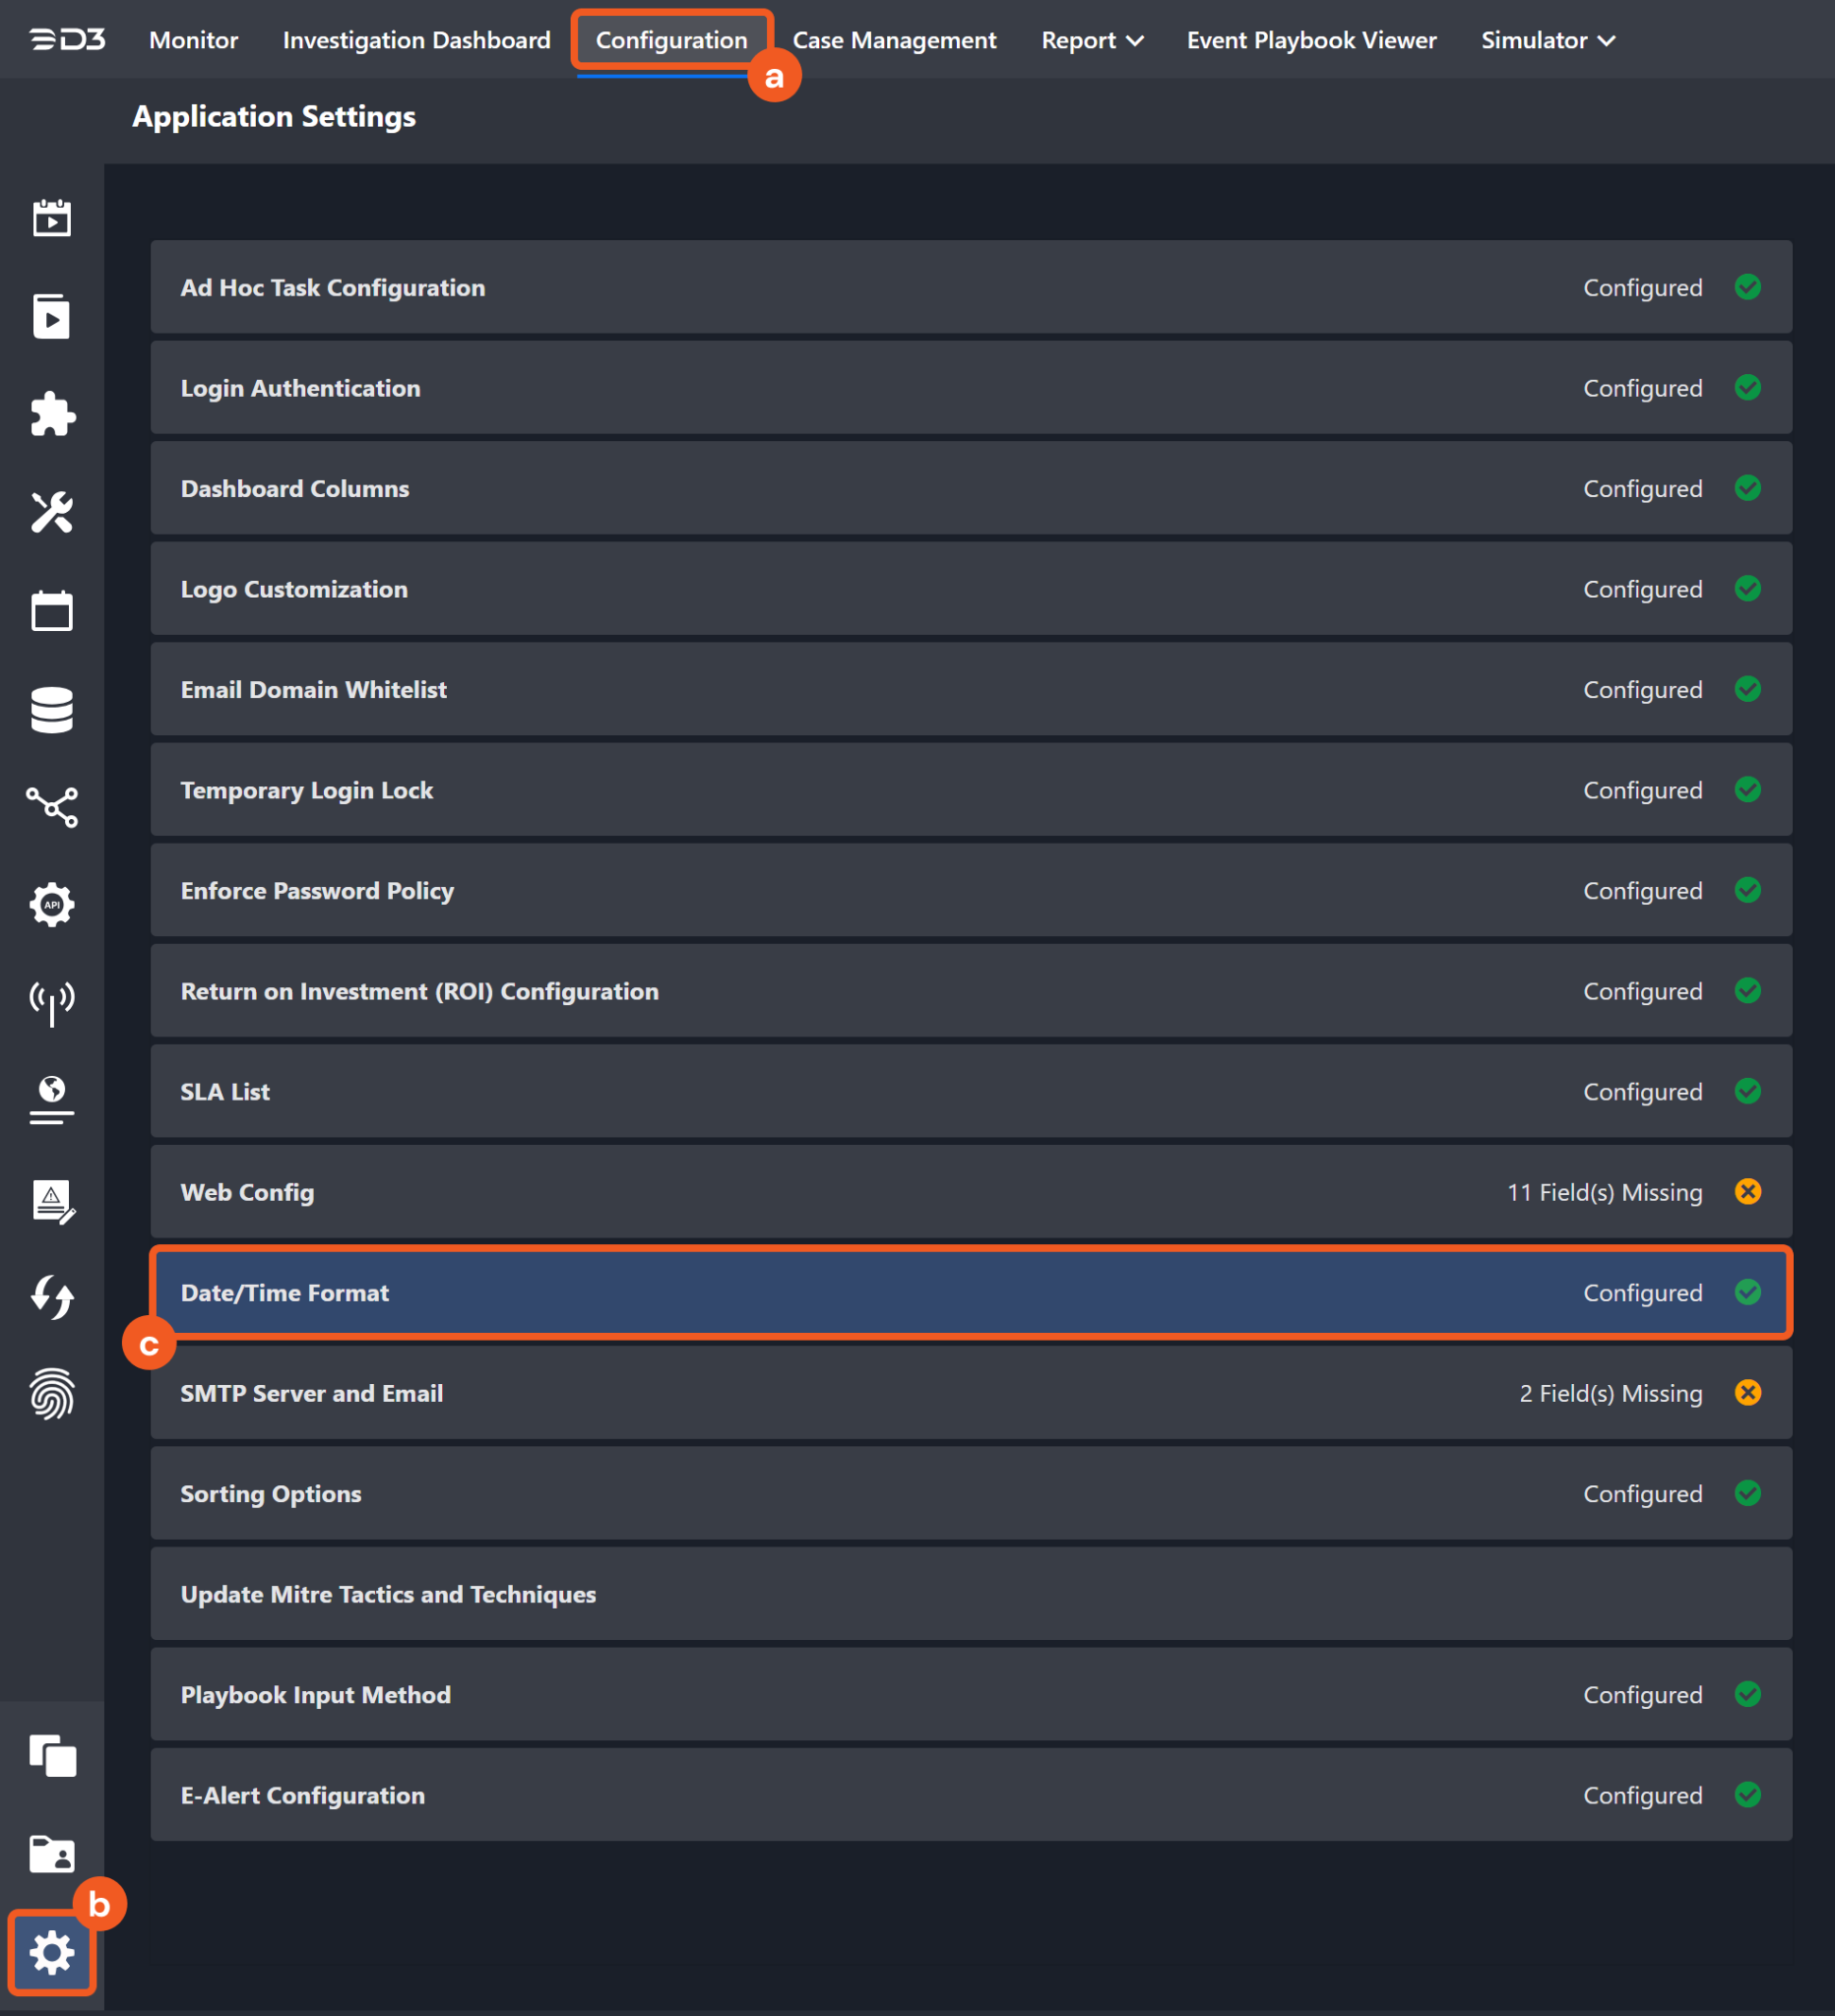
Choose your desired date and time format.
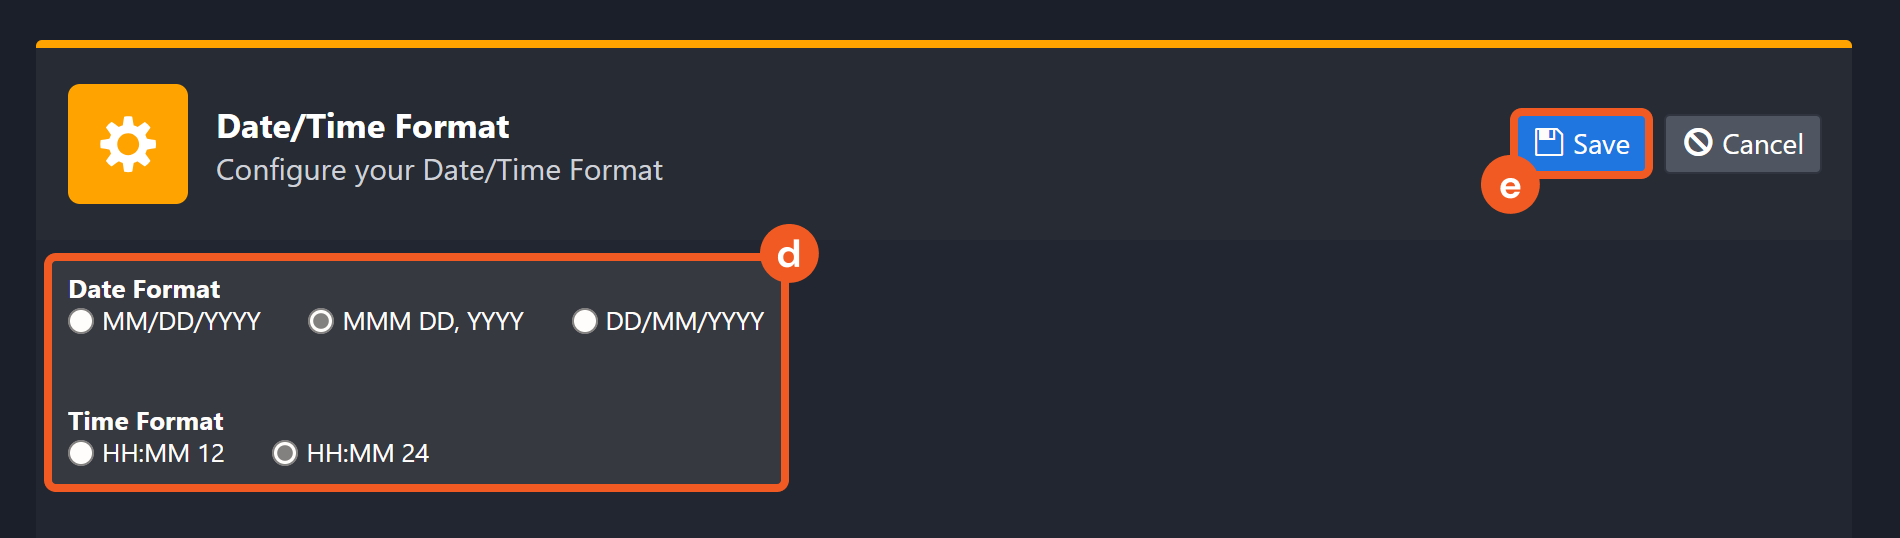
After that, you will be able to view your preferred time format when configuring the DateTime input parameters for commands.
Add Comment To Alerts
Adds an annotation to the specified triggered alerts.
READER NOTE
The parameter Alert IDs is required to run this command.
You should already have your desired Alert IDs on hand to run this command. If you don’t, you can use the Fetch Event command with defined filters to retrieve the desired Alert IDs. The Alert IDs can be found in the raw data at the path $[*].id.
The parameter Reply To Comment IDs is optional to run this command.
If you set the Comment Type parameter as Reply, the Reply To Comment IDs parameter is required.
Run the Get Alert Details command to obtain Reply To Comment IDs. Reply To Comment IDs can be found from the returned raw data at the path $[*].commentsList[*].id.
Input
Input Parameter | Required/Optional | Description | Example |
Alert IDs | Required | The IDs of the alerts to add the annotation. Alert IDs can be obtained using the Fetch Event command. | ["***","***"] |
Comment Type | Required | The annotation type is indicated by the following options: Alert: Create a new annotation for an alert. Reply: Respond to an existing annotation. Note: If you wish to reply to an existing annotation, please provide the corresponding Comment IDs in the "Reply To Comment IDs" parameter. | ALERT |
Comment Title | Optional | The title of the annotation. | testAnnotation |
Comment Message | Required | The message content of the annotation. | From alerts API, test comments d3lab |
Reply To Comment IDs | Optional | The ID of the comment to reply to. Comment IDs can be obtained using the Get Alert Details command. This parameter is not required if you are adding a new comment. | [ "***" ] |
Output
Error Handling
If the Return Data is Partially Successful or Failed, an Error tab will appear in the Test Result window.
The error tab contains the details responded from D3 SOAR or third-party API calls, including Failure Indicator, Status Code, and Message. This can help you locate the root cause of a command failure.
Parts in Error | Description | Example |
Failure Indicator | Indicates the command failure that happened at a specific input and/or API call. | Add Comment To Alerts failed. |
Status Code | The response code issued by the third-party API server or the D3 SOAR system that can be used to locate the corresponding error category. For example, if the returned status code is 401, the selected connection is unauthorized to run the command. The user or system support would need to check the permission setting in the Devo Alerts portal. Refer to the HTTP Status Code Registry for details. | Status Code: 400. |
Message | The raw data or captured key error message from the integration API server about the API request failure. | Message: Comment IDs parameter is required for Reply comment type. You can get Comment ID with the Get Alert Details command. |
Error Sample Data Add Comment To Alerts failed. Status Code: 400. Message: Comment IDs parameter is required for Reply comment type. You can get Comment ID with the Get Alert Details command. |
Fetch Event
Returns Alerts from the Devo platform based on specified criteria(s).
Input
Input Parameter | Required/Optional | Description | Example |
Start Time | Required | The start time of the time range to fetch events triggered after the specified timestamp, in UTC format. | 2023-03-05 00:00 |
End Time | Optional | The end time of the time range to fetch events triggered before the specified timestamp, in UTC format. If this parameter is not defined, the default value is the current time. | 2023-03-10 00:00 |
Number of Event(s) Fetched | Optional | The maximum number of events to return, with the most recently updated event being returned first. If this parameter is not defined, all alerts occurring between the Start Time and End Time will be returned. | 5 |
Show All | Optional | The option to retrieve all triggered alerts, including the ones with false positive and closed status, when set to True. By default, the value is set to False. | False |
Tolerance Scope | Optional | The tolerance scope in minutes of the query to fetch event between start and end time to avoid the loss of events. Events will be fetched between {Start Time - Tolerance Scope}. The default value is 0. | 5 |
Output
Fetch Event Field Mapping
Please note that Fetch Event commands require event field mapping. Field mapping plays a key role in the data normalization process part of the event pipeline. Field mapping converts the original data fields from the different providers to the D3 fields which are standardized by the D3 Model. Please refer to Event and Incident Intake Field Mapping for details.
If you require a custom field mapping, click + Add Field to add a custom field mapping. You can also remove built-in field mappings by clicking x. Please note that two underscore characters will automatically prefix the defined Field Name as the System Name for a custom field mapping. Additionally, if an input Field Name contains any spaces, they will automatically be replaced with underscores for the corresponding System Name.
As a system integration, the Devo Alerts integration has some pre-configured field mappings for default field mapping.
Default Event Source
The Default Event Source is the default set of field mappings that are applied when this fetch event command is executed. For out-of-the-box integrations, you will find a set of field mapping provided by the system. Default event source provides field mappings for common fields from fetched events. The default event source has a “Main Event JSON Path” (i.e., $) that is used to extract a batch of events from the response raw data. Click Edit Main JSON Path to view the “Main Event JSON Path”..png?inst-v=58b65ad9-4f60-4ed1-a7f3-2491ba9726de)
Main Event JSON Path: $
The Main Event JSON Path determines the root path where the system starts parsing raw response data into D3 event data. The JSON path begins with $, representing the root element. The path is formed by appending a sequence of child elements to $, each separated by a dot (.). Square brackets with nested quotation marks ([‘...’]) should be used to separate child elements in JSON arrays.
For example, the root node of a JSON Path is $. The child node denoting the Unique Event Key field would be id. Putting it together, the JSON Path expression to extract the Unique Event Key is $.id.
The pre-configured field mappings are detailed below:
Field Name | Source Field |
Unique Event Key | .id |
Start Time | .createdate |
Event Type | .context |
Status | .status |
Priority | .priority |
Tactics | .alertMitreTactics |
Techniques | .alertMitreTechniques |
Event category | .category |
Source hostname | .srcHost |
Source IP address | .srcIp |
Source port | .srcPort |
Destination hostname | .dstHost |
Destination IP address | .dstIp |
Destination port | .dstPort |
Protocol info | .protocol |
Username | .username |
Extra Data | .extraData |
Alert Definition ID | .alertDefinition.id |
Error Handling
If the Return Data is Failed, an Error tab will appear in the Test Result window.
The error tab contains the details responded from D3 SOAR or third-party API calls, including Failure Indicator, Status Code, and Message. This can help you locate the root cause of a command failure.
Parts in Error | Description | Example |
Failure Indicator | Indicates the command failure that happened at a specific input and/or API call. | Fetch Event failed. |
Status Code | The response code issued by the third-party API server or the D3 SOAR system that can be used to locate the corresponding error category. For example, if the returned status code is 401, the selected connection is unauthorized to run the command. The user or system support would need to check the permission setting in the Devo Alerts portal. Refer to the HTTP Status Code Registry for details. | Status Code: 400. |
Message | The raw data or captured key error message from the integration API server about the API request failure. | Message: The value for parameter (Tolerance Scope) is invalid. |
Error Sample Data Fetch Event failed. Status Code: 400. Message: The value for parameter (Tolerance Scope) is invalid. |
Get Alert Details
Retrieves detailed information about the specified alert(s).
READER NOTE
The parameter Alert IDs is required to run this command.
You should already have your desired Alert IDs on hand to run this command. If you don’t, you can use the Fetch Event command with defined filters to retrieve the desired Alert IDs. The Alert IDs can be found in the raw data at the path $[*].id.
Input
Input Parameter | Required /Optional | Description | Example |
Alert IDs | Required | The IDs of the alerts to retrieve details. | ["163784909"] |
Output
Error Handling
If the Return Data is Partially Successful or Failed, an Error tab will appear in the Test Result window.
The error tab contains the details responded from D3 SOAR or third-party API calls, including Failure Indicator, Status Code, and Message. This can help you locate the root cause of a command failure.
Parts in Error | Description | Example |
Failure Indicator | Indicates the command failure that happened at a specific input and/or API call. | Get Alert Details failed. |
Status Code | The response code issued by the third-party API server or the D3 SOAR system that can be used to locate the corresponding error category. For example, if the returned status code is 401, the selected connection is unauthorized to run the command. The user or system support would need to check the permission setting in the Devo Alerts portal. Refer to the HTTP Status Code Registry for details. | Status Code: 400. |
Message | The raw data or captured key error message from the integration API server about the API request failure. | Message: Invalid alert ID. |
Error Sample Data Get Alert Details failed. Status Code: 400. Message: Invalid alert ID. |
Update Alert Status
Updates alert statuses in bulk.
READER NOTE
The parameter Alert IDs is required to run this command.
You should already have your desired Alert IDs on hand to run this command. If you don’t, you can use the Fetch Event command with defined filters to retrieve the desired Alert IDs. The Alert IDs can be found in the raw data at the path $[*].id.
Input
Input Parameter | Required /Optional | Description | Example |
Alert IDs | Required | The IDs of the alerts to update status. Alert IDs can be obtained using the Fetch Event command. | ["163784909","163768055"] |
Status | Required | The updated status of the specified alerts. | Updated |
Output
Error Handling
If the Return Data is Partially Successful or Failed, an Error tab will appear in the Test Result window.
The error tab contains the details responded from D3 SOAR or third-party API calls, including Failure Indicator, Status Code, and Message. This can help you locate the root cause of a command failure.
Parts in Error | Description | Example |
Failure Indicator | Indicates the command failure that happened at a specific input and/or API call. | Update Alert Status failed. |
Status Code | The response code issued by the third-party API server or the D3 SOAR system that can be used to locate the corresponding error category. For example, if the returned status code is 401, the selected connection is unauthorized to run the command. The user or system support would need to check the permission setting in the Devo Alerts portal. Refer to the HTTP Status Code Registry for details. | Status Code: 400. |
Message | The raw data or captured key error message from the integration API server about the API request failure. | Message: Could not update alert with id xxx into domain partner_domain to status 0. |
Error Sample Data Update Alert Status failed. Status Code: 400. Message: Could not update alert with id xxx into domain partner_domain to status 0. |
Test Connection
Allows you to perform a health check on an integration connection. You can schedule a periodic health check by selecting Connection Health Check when editing an integration connection.
Input
N/A
Output
Error Handling
If the Return Data is Failed, an Error tab will appear in the Test Result window.
The error tab contains the details responded from D3 SOAR or third-party API calls, including Failure Indicator, Status Code, and Message. This can help you locate the root cause of a command failure.
Parts in Error | Description | Example |
Failure Indicator | Indicates the command failure that happened at a specific input and/or API call. | Test Connection failed. Failed to check the connector. |
Status Code | The response code issued by the third-party API server or the D3 SOAR system that can be used to locate the corresponding error category. For example, if the returned status code is 401, the selected connection is unauthorized to run the command. The user or system support would need to check the permission setting in the Devo Alerts portal. Refer to the HTTP Status Code Registry for details. | Status Code: 400. |
Message | The raw data or captured key error message from the integration API server about the API request failure. | Message: Name or service not known. |
Error Sample Data Test Connection failed. Failed to check the connector. Status Code: 400. Message: Name or service not known. |