
Dell Secureworks Taegis XDR
LAST UPDATED: AUGUST 14, 2025
Overview
Secureworks Taegis XDR (formerly Secureworks Red Cloak Threat Detection Response) is a threat-intelligence-based security analytics platform with built-in security context. Secureworks Taegis XDR allows organizations to detect, investigate, and respond to advanced threats across their endpoints, network, and cloud environments.
D3 SOAR is providing REST operations to function with Taegis XDR.
Dell Secureworks Taegis XDR is available for use in:
Connection
To connect to Taegis XDR from D3 SOAR, please follow this part to collect the required information below:
Parameter | Description | Example |
Server Url | The server URL of the Taegis XDR API. | https://api.ctpx.secureworks.com |
Client ID | The client ID to authenticate the API connection. | c14U*****BUAv |
Client Secret | The client secret to authenticate the API connection. | ZxFc*****ylPn |
Permission Requirements
Each endpoint in the Taegis XDR API requires a certain permission scope. All of the following commands for Taegis XDR can be run by an account with Tenant Auditor permissions: Fetch Event, Search Assets, Search Investigations, Get Threat Intelligence, Get Threat Watch list, Search Alerts, List Countermeasure Rulesets, List Countermeasure Threat Indicators and Test Connection.
As Taegis XDR is using role-based access control (RBAC), the Client ID and Secret are generated based on a specific user account and the application. Therefore, the command permissions are inherited from the user account’s role. Users need to configure their user profile from the Taegis XDR console for each command in this integration.
READER NOTE
Taegis XDR’s default user profiles (sorted from the least permissions to the most) are as follows:
Administrator (Tenant Admin)
Analyst (Tenant Analyst)
Responder (Tenant Responder)
Auditor (Tenant Auditor) - Read Only Access
Please refer to User Roles and Profile Settings for details on configuring user profiles. The user you configured and used to login will affect the permission of the obtained client ID and Secret.
Configuring Taegis XDR to Work with D3 SOAR
READER NOTE
Taegis™ XDR client credentials can be created by Taegis™ XDR users who have a role of Tenant Analyst or Tenant Admin in the target tenant. The credentials are valid for that one tenant only, and only in the region they were created for. If your application needs to access multiple regions, you must create separate client credentials for each region.
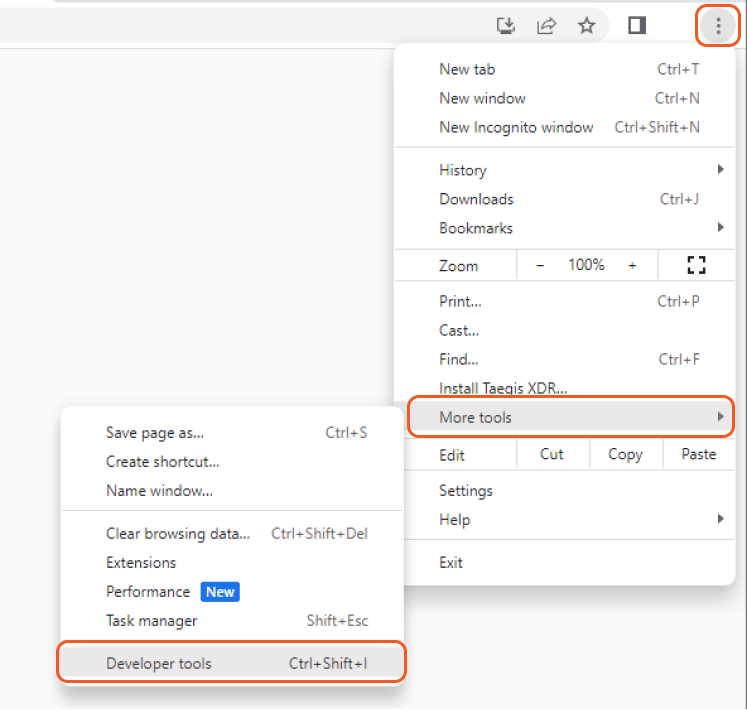
Log in to Taegis XDR with Chrome.
-20250414-235412.png?inst-v=affa99c9-69ca-4cbf-b8b5-b74ef4b8a3d6)
Open the Chrome Developer Tools.
Go to the Console tab, enter the following string, and press Enter. An access_token is copied to your clipboard.
copy(localStorage.access_token)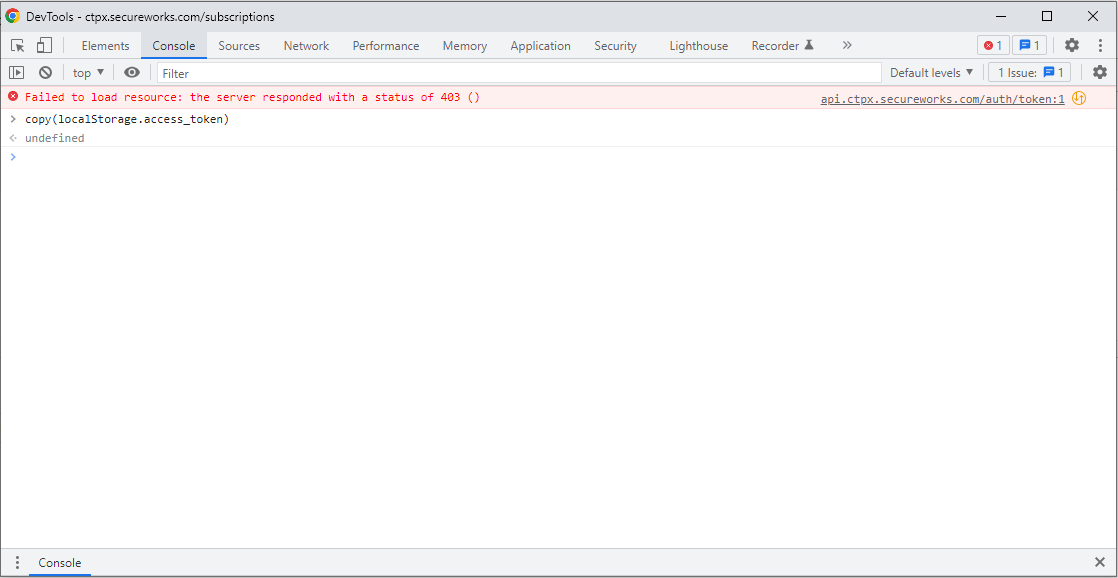
READER NOTE *
The access_token token is not displayed in the Chrome Developer Tools Console, and it is only copied to your clipboard. The command returns undefined.
For convenience, paste this access_token to a text editor (e.g. notepad) first. You will need it for the next step.
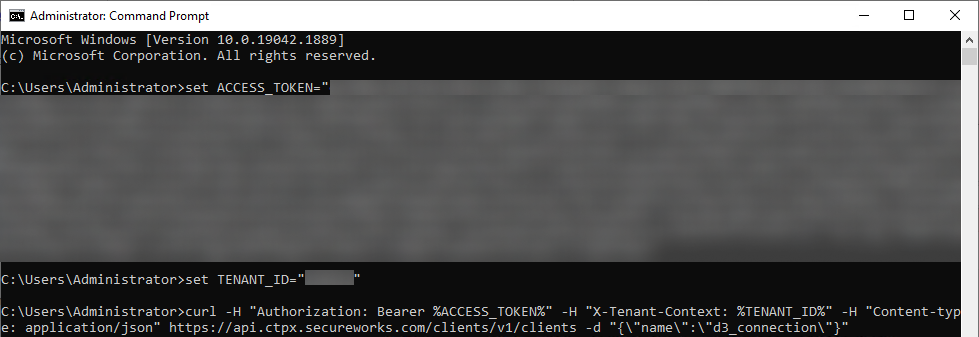
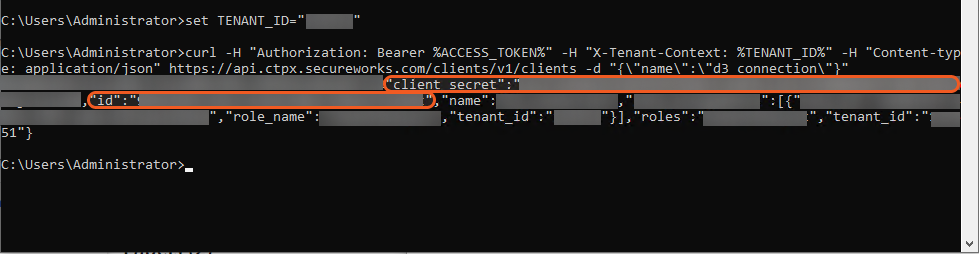
Open a command line terminal, and run the following commands to create your client credentials.
set ACCESS_TOKEN="your_access_token"set TENANT_ID="your_tenant_id"curl -H "Authorization: Bearer %ACCESS_TOKEN%" -H "X-Tenant-Context: %TENANT_ID%" -H "Content-type: application/json" https://api.ctpx.secureworks.com/clients/v1/clients -d "{\"name\":\"your_unique_application_name\"}"your_access_token: Paste the access_token you copied from the Chrome developer tools console.
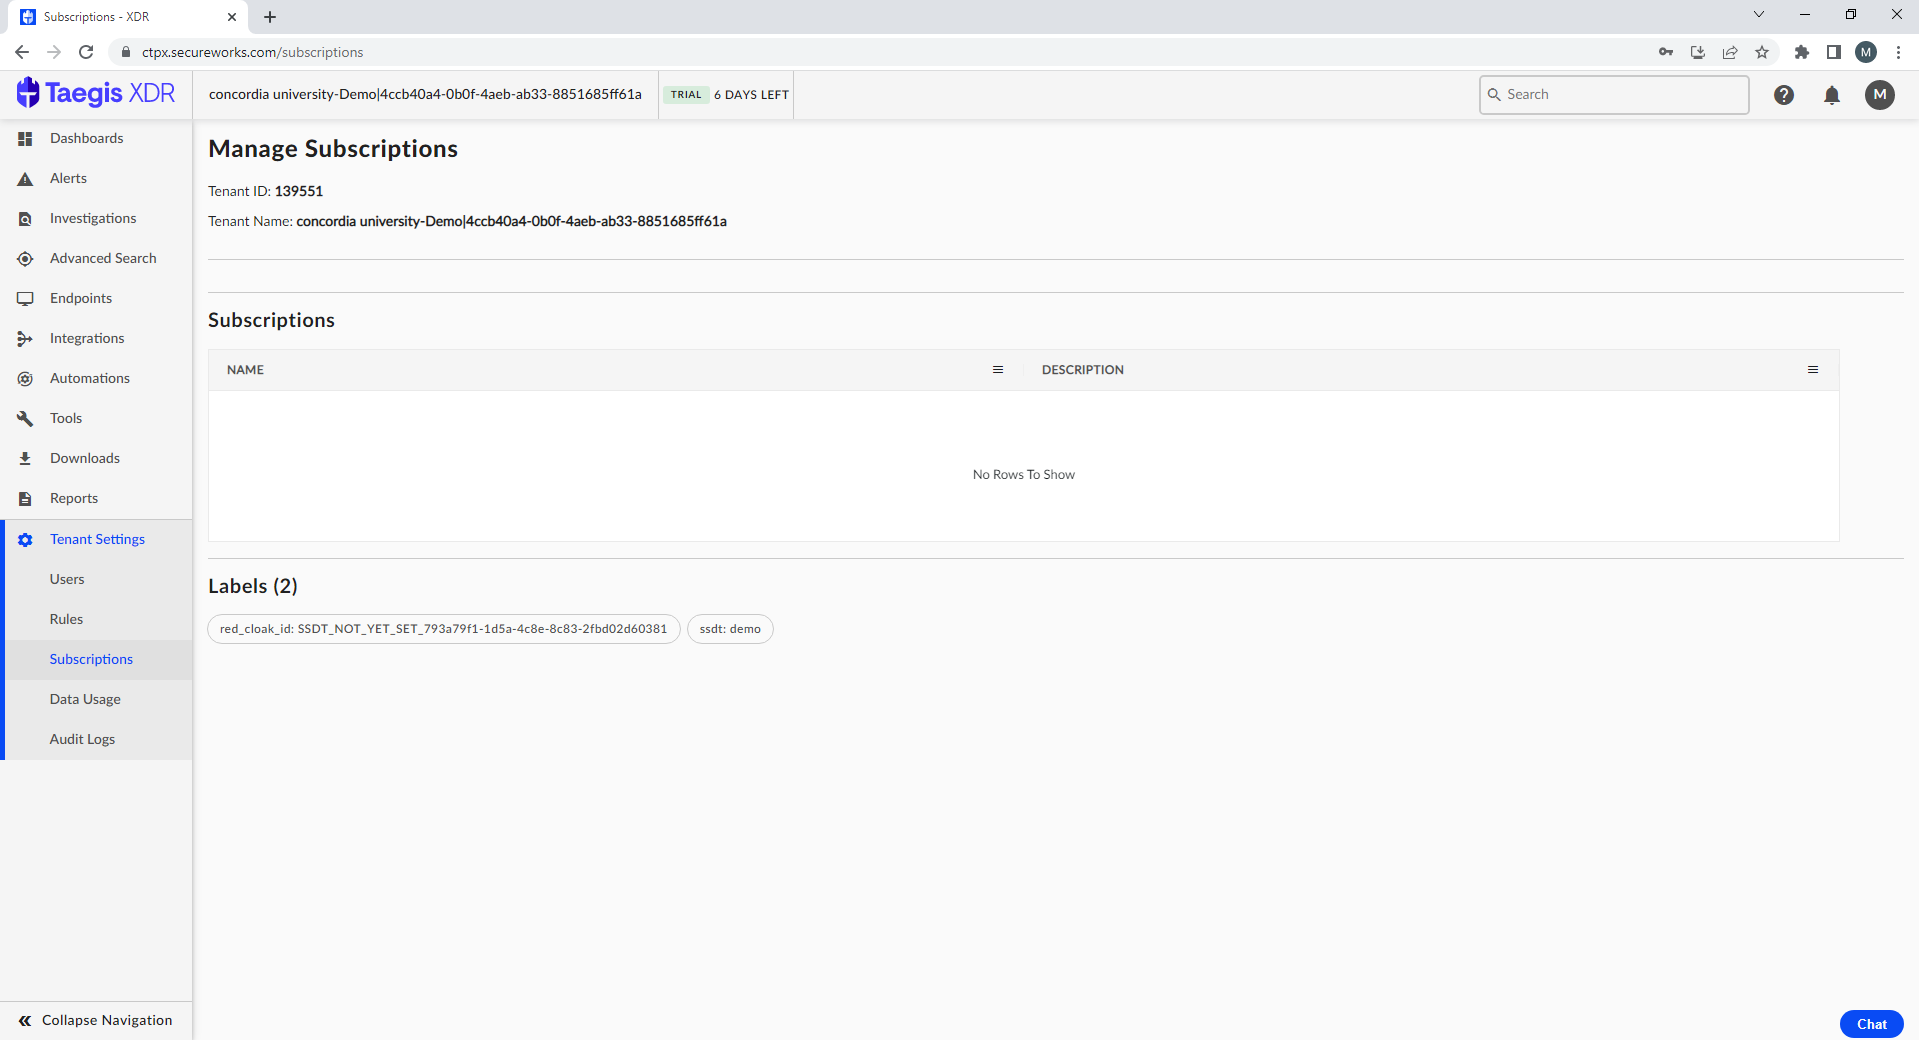
your_tenant_id: You can get it from Taegis XDR UI: Tenant Settings > Subscriptions
your_unique_application_name: Enter a unique application name of your choice. The application name must be unique.
Your new client id and client secret are returned. Save the client_id and client_secret values from this response for connecting to D3 VSOC.
See https://docs.ctpx.secureworks.com/apis/api_authenticate/ for more information.
Configuring D3 SOAR to Work with Dell Secureworks Taegis XDR
Log in to D3 SOAR.
Find the Taegis XDR integration.
.png?inst-v=affa99c9-69ca-4cbf-b8b5-b74ef4b8a3d6)
Navigate to Configuration on the top header menu.
Click on the Integration icon on the left sidebar.
Type Taegis XDR in the search box to find the integration, then click it to select it.
Click + Connection, on the right side of the Connections section. A new connection window will appear.
Configure the following fields to create a connection to Taegis XDR.
.png?inst-v=affa99c9-69ca-4cbf-b8b5-b74ef4b8a3d6)
Connection Name: The desired name for the connection.
Site: Specifies the site to use the integration connection. Use the drop-down menu to select the site. The Share to Internal Sites option enables all sites defined as internal sites to use the connection. Selecting a specific site will only enable that site to use the connection.
Recipient site for events from connections Shared to Internal Sites: This field appears if you selected Share to Internal Sites for Site to let you select the internal site to deploy the integration connection.
Agent Name (Optional): Specifies the proxy agent required to build the connection. Use the dropdown menu to select the proxy agent from a list of previously configured proxy agents.
Description (Optional): Add your desired description for the connection.
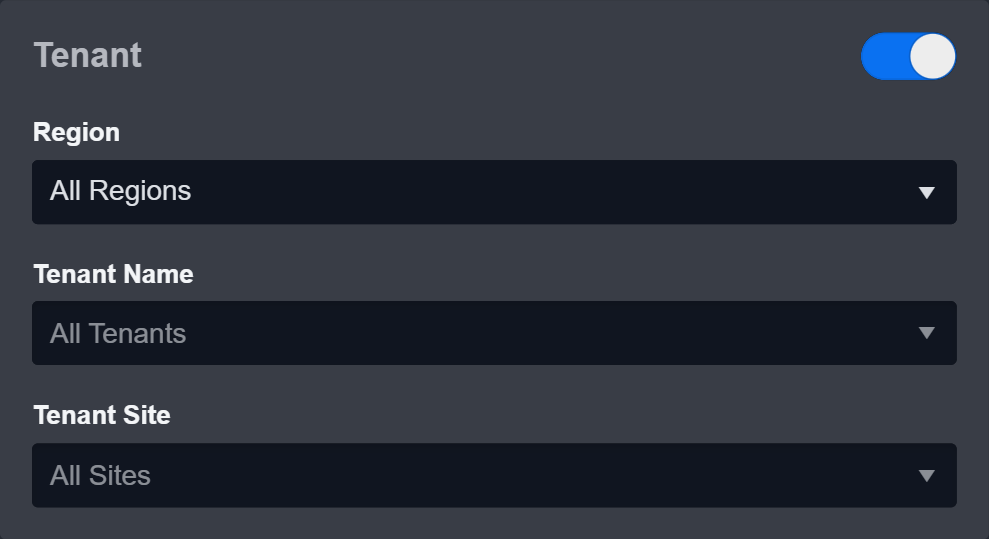
Tenant (Optional): When configuring the connection from a master tenant site, you have the option to choose the specific tenant sites you want to share the connection with. Once you enable this setting, you can filter and select the desired tenant sites from the dropdowns to share the connection.
Configure User Permissions: Defines which users have access to the connection.
Active: Check the tick box to ensure the connection is available for use.
.png?inst-v=affa99c9-69ca-4cbf-b8b5-b74ef4b8a3d6)
System: This section contains the parameters defined specifically for the integration. These parameters must be configured to create the integration connection.
1. Input your domain level Server URL.
2. Copy the Client ID from the Taegis XDR platform. Refer to step 5 of Configuring Taegis XDR to Work with D3 SOAR.
3. Copy the Client Secret from the Taegis XDR platform. Refer to step 5 of Configuring Taegis XDR to Work with D3 SOAR.Connection Health Check: Updates the connection status you have created. A connection health check is done by scheduling the Test Connection command of this integration. This can only be done when the connection is active.
To set up a connection health check, check the Connection Health Check tickbox. You can customize the interval (minutes) for scheduling the health check. An email notification can be set up after a specified number of failed connection attempts.Enable Password Vault: An optional feature that allows users to take the stored credentials from their own password vault. Please refer to the password vault connection guide if needed.
Test the connection.
Click Test Connection to verify the account credentials and network connection. If the Test Connection Passed alert window appears, the test connection is successful. You will see Passed with a green checkmark appear beside the Test Connection button. If the test connection fails, please check your connection parameters and try again.
Click OK to close the alert window.
Click + Add to create and add the configured connection.
Commands
Taegis XDR includes the following executable commands for users to set up schedules or create playbook workflows. With the Test Command, you can execute these commands independently for playbook troubleshooting.
Integration API Note
For more information about the Taegis XDR API, please refer to the Taegis XDR API reference.
READER NOTE
Certain permissions are required for each command. Please refer to the Permission Requirements and Configuring Taegis XDR to Work with D3 SOAR for details.
Note for Time-related parameters
The input format of time-related parameters may vary based on your account settings. As a result, the sample data provided in our commands is different from what you see. To set your preferred time format, follow these steps:
Navigate to Configuration > Application Settings. Select Date/Time Format.
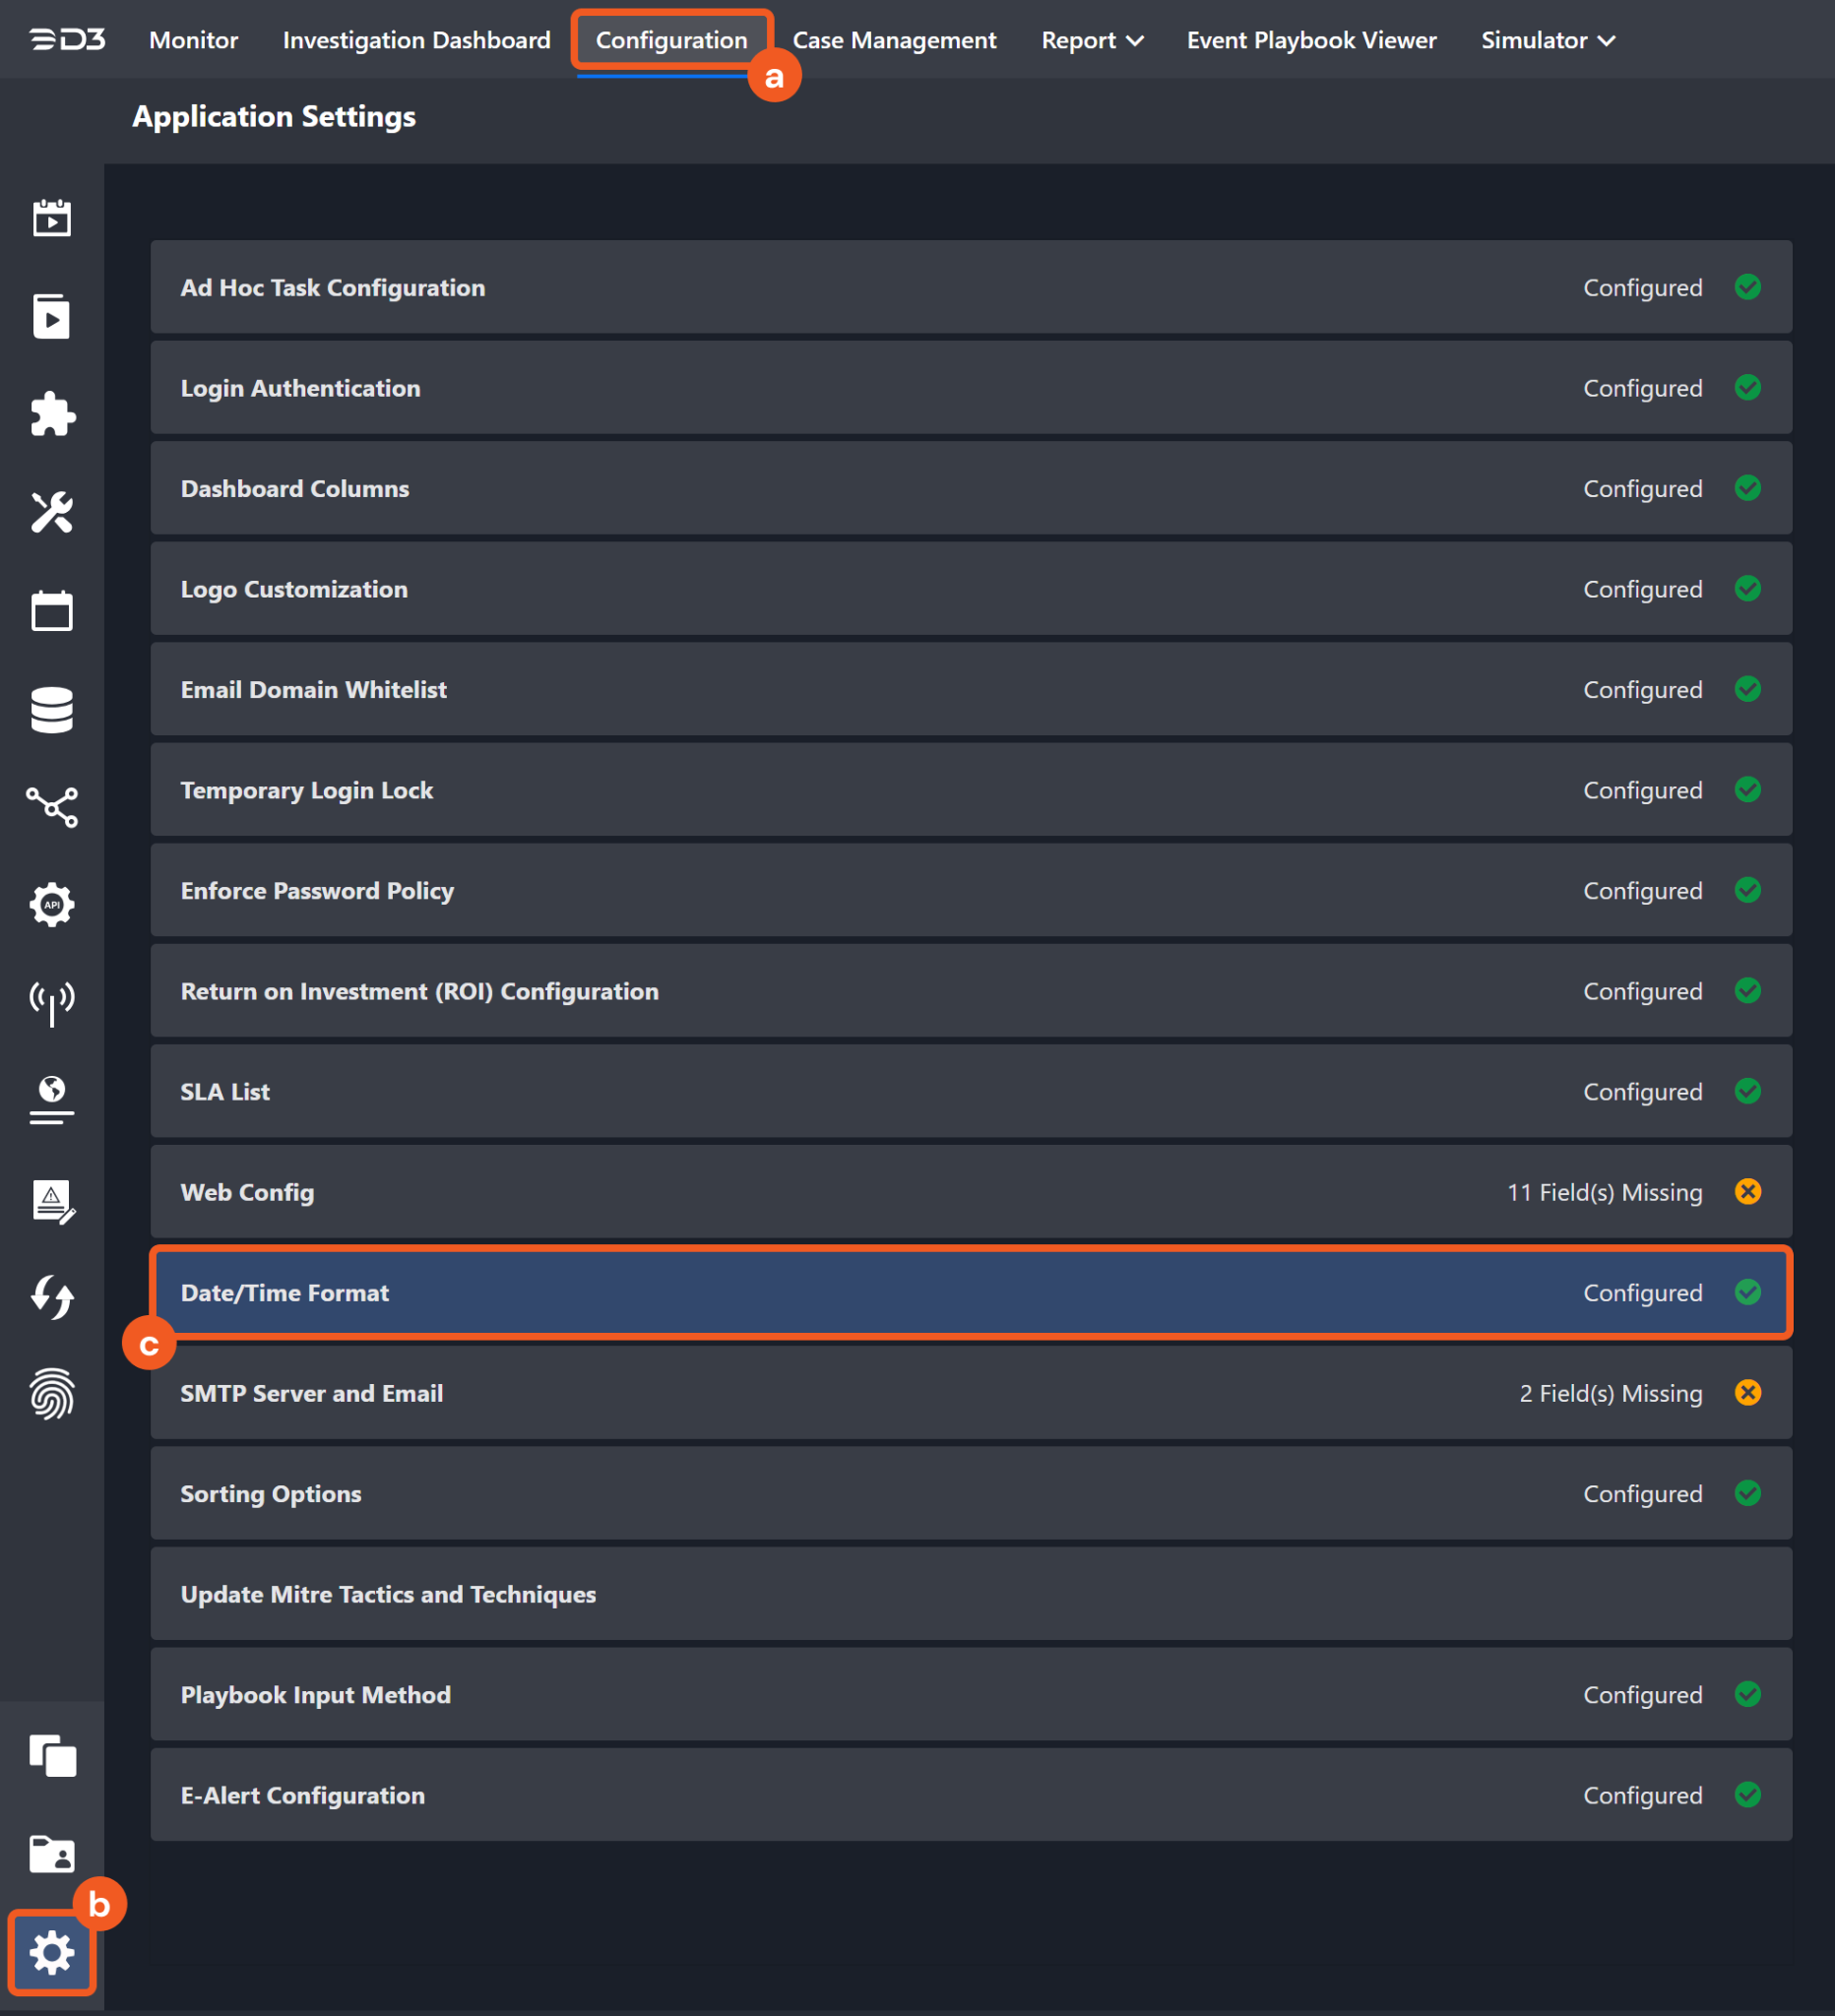
Choose your desired date and time format.
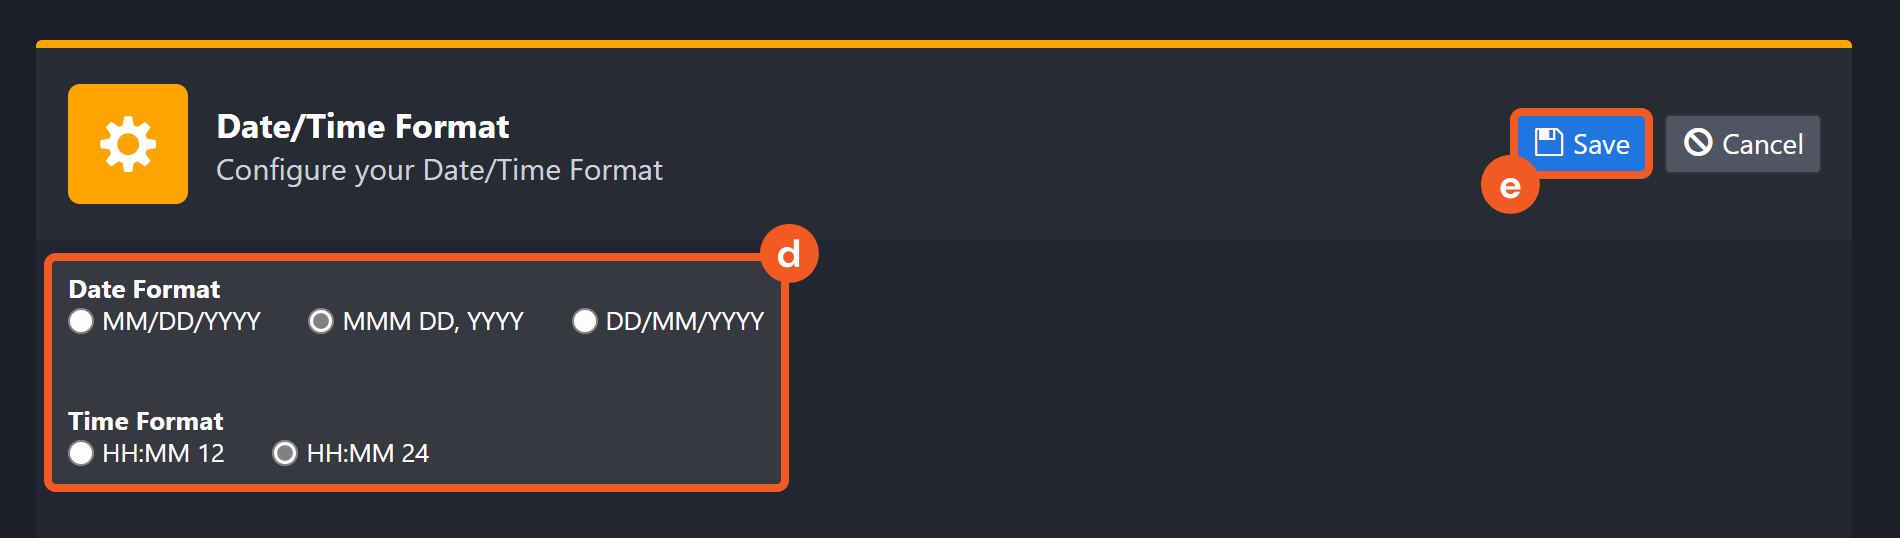
After that, you will be able to view your preferred time format when configuring the DateTime input parameters for commands.
Fetch Event
Returns all Taegis XDR alerts or investigations matching the specified criteria — including time range.
Input
Input Parameter | Required/Optional | Description | Example |
Start Time | Optional | The start of the time range (in UTC) for retrieving alerts or investigations based on the specified query time type. Alerts must have been created within the past 180 days. By default, the start time is 24 hours before the end time. | 2023-04-27 00:00 |
End Time | Optional | The end of the time range (in UTC) for fetching alerts or investigations based on the specified query time type. By default, end time is the current time. | 2023-04-28 00:00 |
Number of Event(s) Fetched | Optional | The number of the most recent events to retrieve. Valid values range from 1 to 10000. By default, the value is 10000. | 10 |
Search Condition | Optional | The search condition expression used to filter the returned results. For query syntax, see https://docs.ctpx.secureworks.com/search/querylanguage/advanced_search/#basic-syntax. For Alert event source, omit the "from alert where" clause — only include the expression beginning after the "where" keyword. For Investigation event source, refer to the supported CQL fields at https://docs.taegis.secureworks.com/apis/using_investigations_api/#supported-fields-for-cql. | severity >= 0.75 and status='OPEN' |
Tolerance Scope | Optional | A time window (in minutes) that extends the time range for fetching events by subtracting from the specified start time. Tolerance scope helps prevent data loss by accounting for API response delays caused by temporary server-side data unavailability—arising from processing and synchronization—from the vendor. With the tolerance scope applied, events will be fetched within the range of (Start Time - Tolerance Scope) to End Time. By default, the tolerance scope is set to 0. | 0 |
Query Time Type | Optional | The time field used to search for alerts or investigations. For the alert event source, available time fields are:
By default, the value is Created Time. For the investigation event source, available time fields are:
By default, the value is Updated Time. | First Activity Time |
Event Source | Optional | The event source from which to ingest events. Available options are:
By default, the value is Alert. | Investigation |
Output
To view the sample output data for all commands, refer to this article.
Fetch Event Field Mapping
Please note that Fetch Event commands require event field mapping. Field mapping plays a key role in the data normalization process part of the event pipeline. Field mapping converts the original data fields from the different providers to the D3 fields which are standardized by the D3 Model. Please refer to Event and Incident Intake Field Mapping for details.
If you require a custom field mapping, click +Add Field to add a custom field mapping. You may also remove built-in field mappings by clicking x. Please note that two underscore characters will automatically prefix the defined Field Name as the System Name for a custom field mapping. Additionally, if an input Field Name contains any spaces, they will automatically be replaced with underscores for the corresponding System Name.
As a system integration, the Taegis XDR integration has some pre-configured field mappings for default field mapping.
Default Event Source
The Default Event Source is the default set of field mappings that are applied when this fetch event command is executed. For out-of-the-box integrations, you will find a set of field mapping provided by the system. Default event source provides field mappings for common fields from fetched events. The default event source has a "Main Event JSON Path" (i.e., $.data.alertsServiceSearch.alerts.list) that is used to extract a batch of events from the response raw data. View the "Main Event JSON Path" by clicking on the Edit Main JSON Path button.-20250415-012208.png?inst-v=affa99c9-69ca-4cbf-b8b5-b74ef4b8a3d6)
Main Event JSON Path: $.data.alertsServiceSearch.alerts.list
The Main Event JSON Path determines the root path where the system starts parsing raw response data into D3 event data. The JSON path begins with $, representing the root element. The path is formed by appending a sequence of child elements to $, each separated by a dot (.). Square brackets with nested quotation marks ([‘...’]) should be used to separate child elements in JSON arrays.
For example, the root node of a JSON Path is data.alertsServiceSearch.alerts.list. The child node denoting the Unique Event Key field would be id. Putting it together, the JSON Path expression to extract the Unique Event Key is $.data.alertsServiceSearch.alerts.list.id.
The pre-configured field mappings are detailed below:
Field Name | Source Field |
Default Event Source (Main Event JSON Path: $.data.alertsServiceSearch.alerts.list) | |
Unique Event Key | .id |
Event Type | .__typename |
Start Time | .metadata.created_at.seconds |
Description | .metadata.description |
Techniques | .attack_technique_ids |
Severity | .metadata.severity |
Status | .status |
First Behavior Time | .metadata.began_at.seconds |
Last Behavior Time | .metadata.ended_at.seconds |
Message | .metadata.title |
Entities | .entities.entities |
Event Source for Investigation Event (Search String: {$.__typename}=InvestigationV2) The search string format is {jsonpath}=value. If the value of the $.__typename key is InvestigationV2 in the event object under raw data, then Investigation Event will use the field mapping below. | |
Event code | .shortId |
Event Type | .__typename |
Document ID | .id |
Description | .title |
Investigation Type | .type |
Status | .status |
Priority | .priority |
Key Findings | .keyFindings |
Start Time | .createdAt |
Assignee ID | .assigneeId |
Tenant ID | .tenantId |
Updated Time | .updatedAt |
Rule ID | .ruleId |
Tag | .tags |
Alert IDs | .alertsEvidence[*].alertId |
Event IDs | .eventsEvidence[*].eventId |
Asset IDs | .assetsEvidence[*].assettId |
Error Handling
If the Return Data is Failed, an Error tab will appear in the Test Result window.
The error tab contains the details responded from D3 SOAR or third-party API calls, including Failure Indicator, Status Code, and Message. This can help you locate the root cause of a command failure.
Parts in Error | Description | Example |
Failure Indicator | Indicates the command failure that happened at a specific input and/or API call. | Fetch Event failed. |
Status Code | The response code issued by the third-party API server or the D3 SOAR system that can be used to locate the corresponding error category. For example, if the returned status code is 401, the selected connection is unauthorized to run the command. The user or system support would need to check the permission setting in the Taegis XDR portal. Refer to the HTTP Status Code Registry for details. | Status Code: 400. |
Message | The raw data or captured key error message from the integration API server about the API request failure. | Message: Invalid Query. |
Error Sample Data Fetch Event failed. Status Code: 400. Message: Invalid Query. |
Get Threat Intelligence
Retrieves threat intelligence on the specified indicators.
Input
Input Parameter | Required/Optional | Description | Example |
Indicators | Required | The indicators to retrieve corresponding threat intelligence. | [ "40.00.000.000" ] |
Output
To view the sample output data for all commands, refer to this article.
Error Handling
If the Return Data is Failed, an Error tab will appear in the Test Result window.
The error tab contains the details responded from D3 SOAR or third-party API calls, including Failure Indicator, Status Code, and Message. This can help you locate the root cause of a command failure.
Parts in Error | Description | Example |
Failure Indicator | Indicates the command failure that happened at a specific input and/or API call. | Get Threat Intelligence failed. |
Status Code | The response code issued by the third-party API server or the D3 SOAR system that can be used to locate the corresponding error category. For example, if the returned status code is 401, the selected connection is unauthorized to run the command. The user or system support would need to check the permission setting in the Taegis XDR portal. Refer to the HTTP Status Code Registry for details. | Status Code: 400. |
Message | The raw data or captured key error message from the integration API server about the API request failure. | Message: Invalid Indicator. |
Error Sample Data Get Threat Intelligence failed. Status Code: 400. Message: Invalid Indicator. |
Get Threat Watchlist
Retrieves a threat watchlist of the specified indicator type.
Input
Input Parameter | Required/Optional | Description | Example |
Indicator Types | Required | The indicator type to retrieve the threat watchlist. The available indicator types are Domain, File, and IP. | Domain |
Output
To view the sample output data for all commands, refer to this article.
Error Handling
If the Return Data is Failed, an Error tab will appear in the Test Result window.
The error tab contains the details responded from D3 SOAR or third-party API calls, including Failure Indicator, Status Code, and Message. This can help you locate the root cause of a command failure.
Parts in Error | Description | Example |
Failure Indicator | Indicates the command failure that happened at a specific input and/or API call. | Get Threat Watchlist failed. |
Status Code | The response code issued by the third-party API server or the D3 SOAR system that can be used to locate the corresponding error category. For example, if the returned status code is 401, the selected connection is unauthorized to run the command. The user or system support would need to check the permission setting in the Taegis XDR portal. Refer to the HTTP Status Code Registry for details. | Status Code: 403. |
Message | The raw data or captured key error message from the integration API server about the API request failure. | Message: Forbidden. |
Error Sample Data Get Threat Watchlist failed. Status Code: 403. Message: Forbidden. |
List Countermeasure Rulesets
Returns Counter Threat Unit (CTU) countermeasure rulesets.
Input
N/A
Output
To view the sample output data for all commands, refer to this article.
Error Handling
If the Return Data is Failed, an Error tab will appear in the Test Result window.
The error tab contains the details responded from D3 SOAR or third-party API calls, including Failure Indicator, Status Code, and Message. This can help you locate the root cause of a command failure.
Parts in Error | Description | Example |
Failure Indicator | Indicates the command failure that happened at a specific input and/or API call. | List Countermeasure Rulesets failed. |
Status Code | The response code issued by the third-party API server or the D3 SOAR system that can be used to locate the corresponding error category. For example, if the returned status code is 401, the selected connection is unauthorized to run the command. The user or system support would need to check the permission setting in the Taegis XDR portal. Refer to the HTTP Status Code Registry for details. | Status Code: 403. |
Message | The raw data or captured key error message from the integration API server about the API request failure. | Message: Forbidden. |
Error Sample Data List Countermeasure Rulesets failed. Status Code: 403. Message: Forbidden. |
List Countermeasure Threat Indicators
Retrieves the versions of Threat Indicator Lists released by the CTU. You have the option to retrieve all versions of the Threat Indicator Lists or only the most recent ones.
Input
Input Parameter | Required/Optional | Description | Example |
Version | Required | The option to retrieve all or the most recent versions of Threat Indicator Lists. | All Versions |
Output
To view the sample output data for all commands, refer to this article.
Error Handling
If the Return Data is Failed, an Error tab will appear in the Test Result window.
The error tab contains the details responded from D3 SOAR or third-party API calls, including Failure Indicator, Status Code, and Message. This can help you locate the root cause of a command failure.
Parts in Error | Description | Example |
Failure Indicator | Indicates the command failure that happened at a specific input and/or API call. | List Countermeasure Threat Indicators failed. |
Status Code | The response code issued by the third-party API server or the D3 SOAR system that can be used to locate the corresponding error category. For example, if the returned status code is 401, the selected connection is unauthorized to run the command. The user or system support would need to check the permission setting in the Taegis XDR portal. Refer to the HTTP Status Code Registry for details. | Status Code: 403. |
Message | The raw data or captured key error message from the integration API server about the API request failure. | Message: Forbidden. |
Error Sample Data List Countermeasure Threat Indicators failed. Status Code: 403. Message: Forbidden. |
Resolve Alerts
Resolves alerts using alert IDs.
READER NOTE
Alert ID is a required parameter to run this command.
Run the Search Alerts command to obtain the Alert ID. Alert IDs can be found in the raw data at $.data.alertsServiceSearch.alerts.list[*].id.
Input
Input Parameter | Required/Optional | Description | Example |
Alert IDs | Required | The IDs of the alerts to be resolved. Alert IDs can be obtained using the Fetch Event or Search Alerts commands. |
JSON
|
Resolution Status | Required | The resolution status of the alerts. The options are:
| False Positive |
Reason | Optional | The resolution reason. | – |
Output
To view the sample output data for all commands, refer to this article.
Error Handling
If the Return Data is Failed, an Error tab will appear in the Test Result window.
The error tab contains the details responded from D3 SOAR or third-party API calls, including Failure Indicator, Status Code, and Message. This can help you locate the root cause of a command failure.
Parts in Error | Description | Example |
Failure Indicator | Indicates the command failure that happened at a specific input and/or API call. | Resolve Alerts failed. |
Status Code | The response code issued by the third-party API server or the D3 SOAR system that can be used to locate the corresponding error category. For example, if the returned status code is 401, the selected connection is unauthorized to run the command. The user or system support would need to check the permission setting in the Taegis XDR portal. Refer to the HTTP Status Code Registry for details. | Status Code: 400. |
Message | The raw data or captured key error message from the integration API server about the API request failure. | Message: Invalid Queries. |
Error Sample Data Resolve Alerts failed. Status Code: 400. Message: Invalid Queries. |
Search Alerts
Retrieves alerts matching the given criteria.
Input
Input Parameter | Required/Optional | Description | Example |
Start Time | Optional | The start time (in UTC format) of the time range for searching alerts. The start time corresponds to the specified query time type. If this parameter is not defined, the default start time is 24 hours before the end time. | 2023-05-01 00:00 |
End Time | Optional | The end time (in UTC format) of the time range for searching alerts. The end time corresponds to the specified query time type. If this parameter is not defined, the default end time is the current time. | 2023-05-02 00:00 |
Query Time Type | Required | The time field to search for alerts. The available time fields to search by are First Activity Time, Last Activity Time, Created Time and Inserted Time. | First Activity Time |
Limit | Optional | The number of the most recent events to fetch. The valid value is an integer between 1 and 10000. If this parameter is not defined, the default value is 10000. | 10 |
Query | Optional | The query expression to filter the returned results. For more information about the query syntax, refer to the documentation at https://docs.ctpx.secureworks.com/search/querylanguage/advanced_search/#basic-syntax. Note: There is no need to include the "from alert where" clause in your query since it has already been hard coded by D3. You should only state the query language after the "where" keyword. | severity >= 0.75 and status='OPEN' |
Output
To view the sample output data for all commands, refer to this article.
Error Handling
If the Return Data is Failed, an Error tab will appear in the Test Result window.
The error tab contains the details responded from D3 SOAR or third-party API calls, including Failure Indicator, Status Code, and Message. This can help you locate the root cause of a command failure.
Parts in Error | Description | Example |
Failure Indicator | Indicates the command failure that happened at a specific input and/or API call. | Search Alerts failed. |
Status Code | The response code issued by the third-party API server or the D3 SOAR system that can be used to locate the corresponding error category. For example, if the returned status code is 401, the selected connection is unauthorized to run the command. The user or system support would need to check the permission setting in the Taegis XDR portal. Refer to the HTTP Status Code Registry for details. | Status Code: 400. |
Message | The raw data or captured key error message from the integration API server about the API request failure. | Message: Invalid Queries. |
Error Sample Data Search Alerts failed. Status Code: 400. Message: Invalid Queries. |
Search Assets
Retrieves endpoints matching the given criteria.
Input
Input Parameter | Required/Optional | Description | Example |
Limit | Optional | The maximum number of assets to return. The valid input value is an integer between 1 and 100. If this parameter is not specified, all assets matching the specified endpoint state will be returned. | 10 |
Endpoint State | Required | The state of the endpoints to return. | Active |
Output
To view the sample output data for all commands, refer to this article.
Error Handling
If the Return Data is Failed, an Error tab will appear in the Test Result window.
The error tab contains the details responded from D3 SOAR or third-party API calls, including Failure Indicator, Status Code, and Message. This can help you locate the root cause of a command failure.
Parts in Error | Description | Example |
Failure Indicator | Indicates the command failure that happened at a specific input and/or API call. | Search Assets failed. |
Status Code | The response code issued by the third-party API server or the D3 SOAR system that can be used to locate the corresponding error category. For example, if the returned status code is 401, the selected connection is unauthorized to run the command. The user or system support would need to check the permission setting in the Taegis XDR portal. Refer to the HTTP Status Code Registry for details. | Status Code: 403. |
Message | The raw data or captured key error message from the integration API server about the API request failure. | Message: Forbidden. |
Error Sample Data Search Assets failed. Status Code: 403. Message: Forbidden. |
Search Investigations
Retrieves investigations matching the given criteria.
Input
Input Parameter | Required/Optional | Description | Example |
Start Time | Optional | The start time (in UTC format) of the time range for searching investigations. The start time corresponds to the specified query time type. If this parameter is not defined, the default start time is 24 hours before the end time. | 2023-05-01 00:00 |
End Time | Optional | The end time (in UTC format) of the time range for searching investigations. The end time corresponds to the specified query time type. If this parameter is not defined, the default end time is the current time. | 2023-05-02 00:00 |
Query Time Type | Required | The time field to search for investigations. The available time fields to search by are Created Time, Updated Time and Notified Time. | Updated Time |
Limit | Optional | The maximum number of investigations to return. The valid value is an integer between 1 and 100. If this parameter is not defined, all investigations matching the search conditions will be returned. | 10 |
Query | Optional | The query expression to filter the returned results. For more information about the query syntax, refer to the documentation at https://docs.ctpx.secureworks.com/search/querylanguage/advanced_search/#basic-syntax. | type in ('Security Investigation') priority =2 |
Filter Text | Optional | The string for a free text search. | Test-A |
Output
To view the sample output data for all commands, refer to this article.
Error Handling
If the Return Data is Failed, an Error tab will appear in the Test Result window.
The error tab contains the details responded from D3 SOAR or third-party API calls, including Failure Indicator, Status Code, and Message. This can help you locate the root cause of a command failure.
Parts in Error | Description | Example |
Failure Indicator | Indicates the command failure that happened at a specific input and/or API call. | Search Investigations failed. |
Status Code | The response code issued by the third-party API server or the D3 SOAR system that can be used to locate the corresponding error category. For example, if the returned status code is 401, the selected connection is unauthorized to run the command. The user or system support would need to check the permission setting in the Taegis XDR portal. Refer to the HTTP Status Code Registry for details. | Status Code: 400. |
Message | The raw data or captured key error message from the integration API server about the API request failure. | Message: Invalid Query. |
Error Sample Data Search Investigations failed. Status Code: 400. Message: Invalid Query. |
Test Connection
Allows you to perform a health check on an integration connection. You can schedule a periodic health check by selecting Connection Health Check when editing an integration connection.
Input
N/A
Output
Error Handling
If the Return Data is Failed, an Error tab will appear in the Test Result window.
The error tab contains the details responded from D3 SOAR or third-party API calls, including Failure Indicator, Status Code, and Message. This can help you locate the root cause of a command failure.
Parts in Error | Description | Example |
Failure Indicator | Indicates the command failure that happened at a specific input and/or API call. | Test Connection failed. Failed to check the connector. |
Status Code | The response code issued by the third-party API server or the D3 SOAR system that can be used to locate the corresponding error category. For example, if the returned status code is 401, the selected connection is unauthorized to run the command. The user or system support would need to check the permission setting in the Taegis XDR portal. Refer to the HTTP Status Code Registry for details. | Status Code: 403. |
Message | The raw data or captured key error message from the integration API server about the API request failure. | Message: Forbidden. |
Error Sample Data Test Connection failed. Failed to check the connector. Status Code: 403. Message: Forbidden. |