
DataSet (Scalyr)
LAST UPDATED: JULY 30, 2025
Overview
Dataset, formerly known as Scalyr, is a server log monitoring tool. Dataset offers an integrated suite of server monitoring, log management, visualization and analysis tools that aggregates all the metrics into a centralized system in real time, which can be integrated with cloud services.
D3 SOAR is providing REST operations to function with DataSet (Scalyr).
DataSet (Scalyr) is available for use in:
Known Limitations
When an account exceeds the rate limit, additional API queries are rejected with a status of 429 ("Too Many Requests").
For the Timeseries Query, a rate limit may be applied if you issue more than 100 novel queries (queries for which a timeseries has not already been created) per hour.
Please refer to Rate Limiting for detailed information.
Connection
To connect to DataSet (Scalyr) from D3 SOAR, please follow this part to collect the required information below:
Parameter | Description | Example |
Server URL | The server URLof your DataSet instance, which is the same as your DataSet web console base URL. | https://app.scalyr.com |
Configuration Read Access Key | The Configuration Read Access Key which is required for the List Files command. | 0kdByKrN*******************************SVZK4us- |
Configuration Write Access Key | The Configuration Write Access Key which is required for Put File and Delete File commands. | 0_I6yBRR******************************CMZAdLE- |
Log Read Access Key | The Log Read Access Key which is required to use the Test Connection, Query, Numeric Query, Timeseries Query, Facet Query, Power Query and Fetch Event commands. | 0G/oJpTD*****************************eOxvqvU- |
Log Write Access Key | The Log Write Access Key which is required to use the Add Events command. | 00X_4CdV*****************************202d4zo- |
Permission Requirements
Each endpoint in the DataSet (Scalyr) API requires a certain permission scope. The following are required scopes for the commands in this integration:
Command | Required Permission |
Add Events | Log Write Access Key |
Delete File | Configuration Write Access Key |
Facet Query | Log Read Access Key |
Fetch Event | Log Read Access Key |
List Files | Configuration Read Access Key |
Numeric Query | Log Read Access Key |
Power Query | Log Read Access Key |
Put File | Configuration Write Access Key |
Query | Log Read Access Key |
Timeseries Query | Log Read Access Key |
Test Connection | Log Read Access Key |
Configuring DataSet (Scalyr) to Work with D3 SOAR
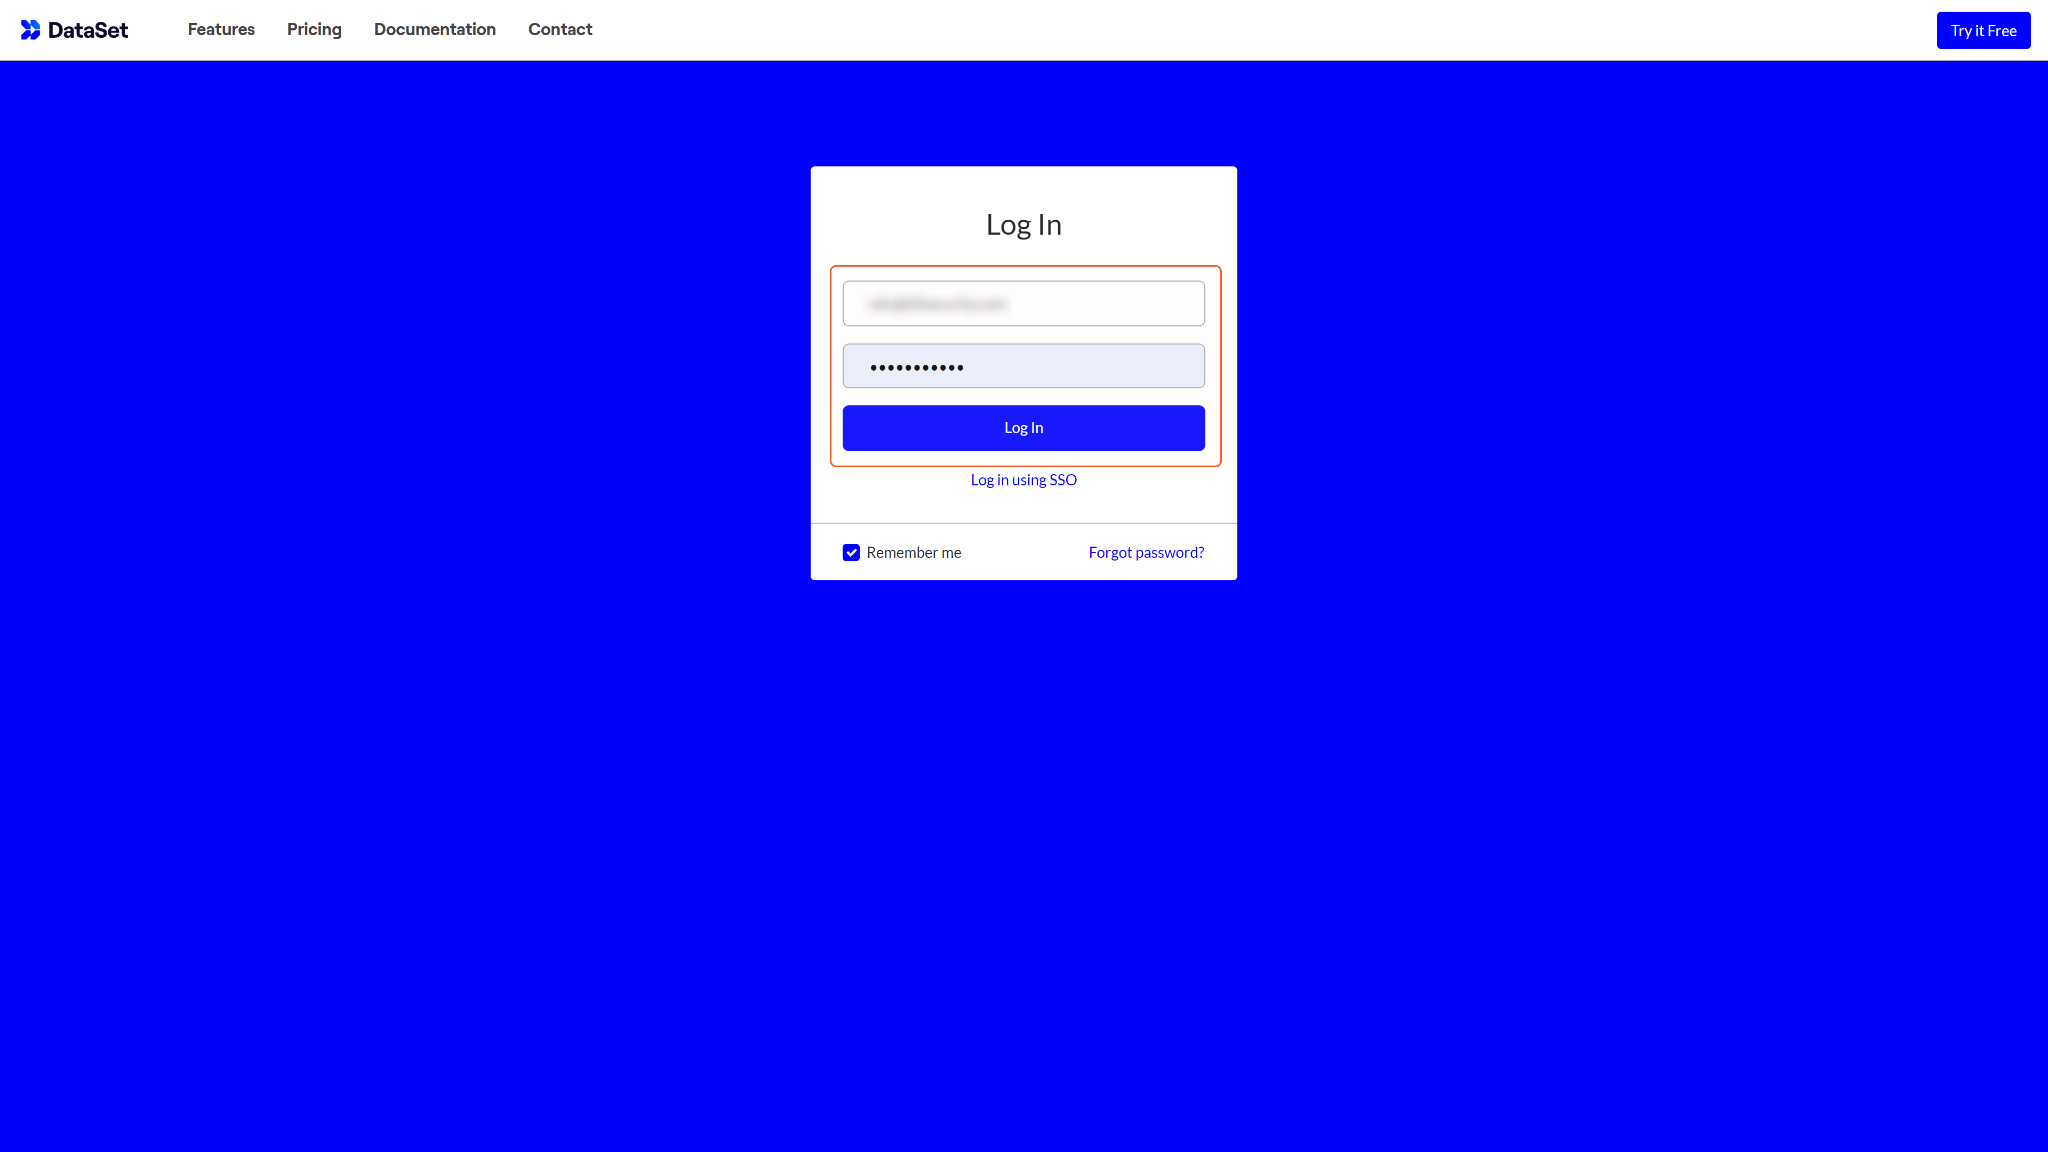
Log in to Dataset with your credentials.
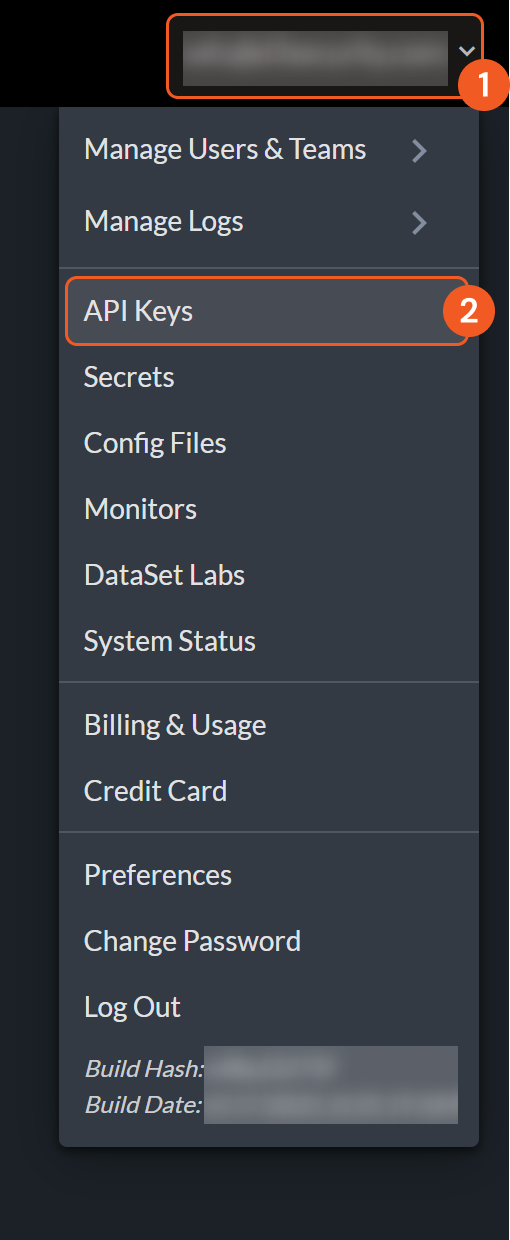
Navigate to the account dropdown located at the top right corner of your screen, and select API Keys.
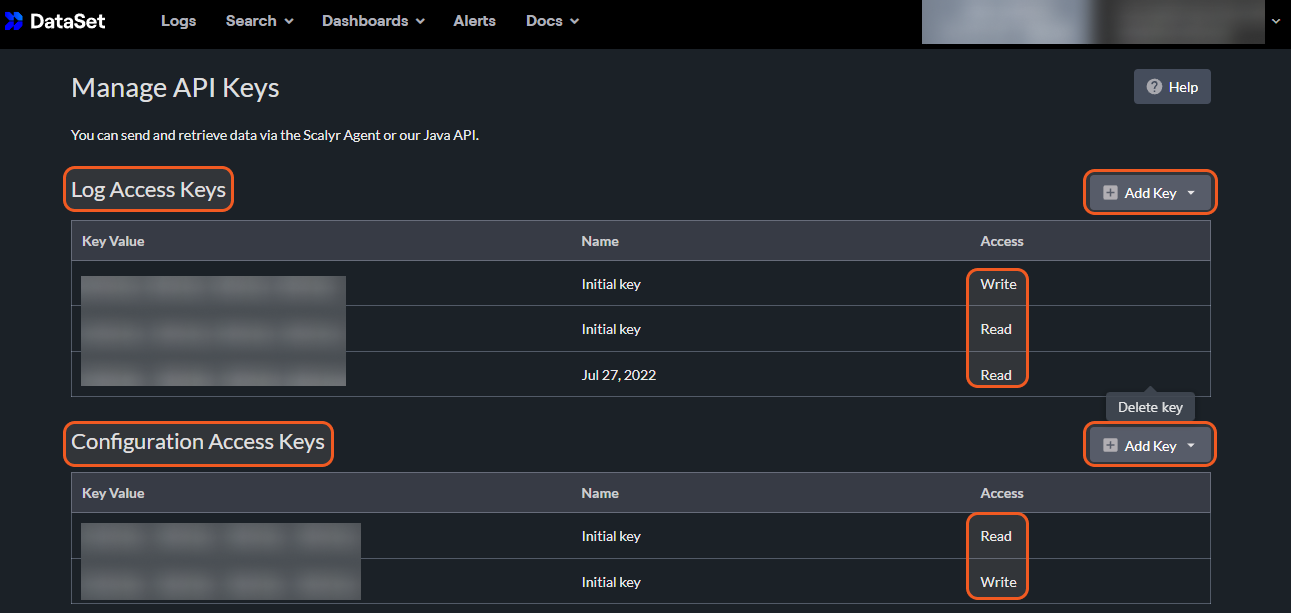
You may click the Add Key button to choose to create Log Access Keys and Configuration Access Keys with read or write access. Please refer to the Permission Requirements for the scope needed for each command.
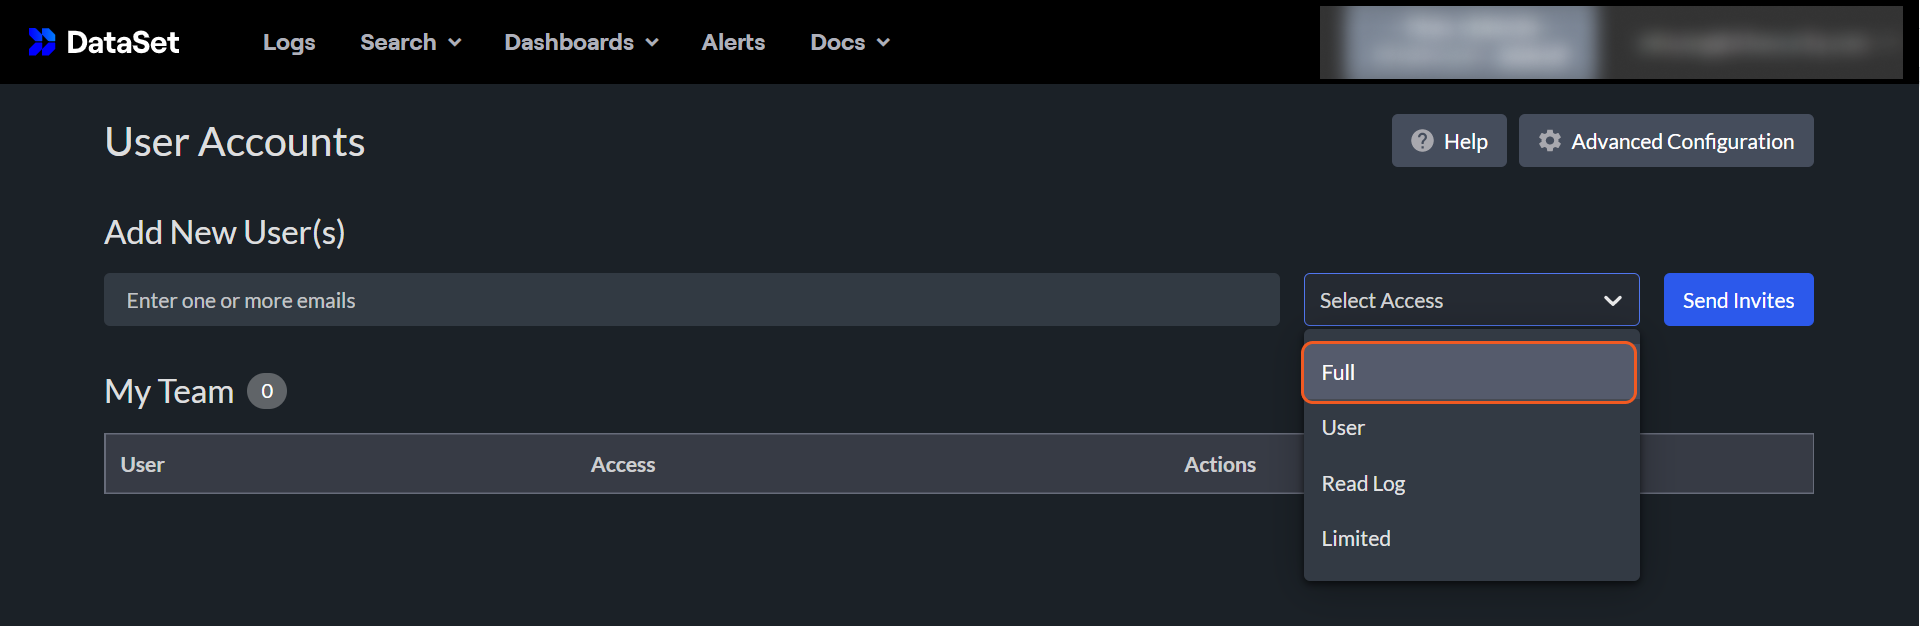
If you want to create another user for completing the above steps, Full access is required to access the API Keys configuration.
Configuring D3 SOAR to Work with DataSet (Scalyr)
Log in to D3 SOAR.
Find the DataSet (Scalyr) integration.
.png?inst-v=9d16beaf-952a-4ae4-8fe8-e35f7a3745da)
Navigate to Configuration on the top header menu.
Click on the Integration icon on the left sidebar.
Type DataSet (Scalyr) in the search box to find the integration, then click it to select it.
Click + Connection, on the right side of the Connections section. A new connection window will appear.
Configure the following fields to create a connection to DataSet (Scalyr).
.png?inst-v=9d16beaf-952a-4ae4-8fe8-e35f7a3745da)
Connection Name: The desired name for the connection.
Site: Specifies the site to use the integration connection. Use the drop-down menu to select the site. The Share to Internal Sites option enables all sites defined as internal sites to use the connection. Selecting a specific site will only enable that site to use the connection.
Recipient site for events from connections Shared to Internal Sites: This field appears if you selected Share to Internal Sites for Site to let you select the internal site to deploy the integration connection.
Agent Name (Optional): Specifies the proxy agent required to build the connection. Use the dropdown menu to select the proxy agent from a list of previously configured proxy agents.
Description (Optional): Add your desired description for the connection.
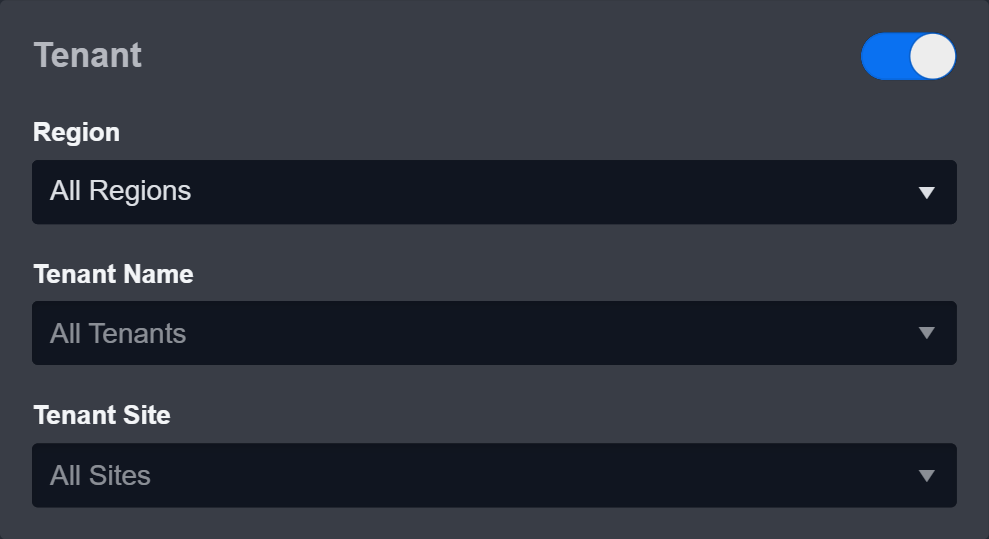
Tenant (Optional): When configuring the connection from a master tenant site, you have the option to choose the specific tenant sites you want to share the connection with. Once you enable this setting, you can filter and select the desired tenant sites from the dropdowns to share the connection.
Configure User Permissions: Defines which users have access to the connection.
Active: Check the tick box to ensure the connection is available for use.
.png?inst-v=9d16beaf-952a-4ae4-8fe8-e35f7a3745da)
System: This section contains the parameters defined specifically for the integration. These parameters must be configured to create the integration connection.
1. Fill in the Server URL (domain level).
2. Only the Log Read Access Key parameter is required to pass the connection, since the test connection only needs log read access. The parameters listed below may also be required for other commands to execute successfully. Please check the Permission Requirements section for the commands' access keys. If you want to use all of the commands, please fill in all four access keys.
3. Input the Log Write Access Key.
4. Input the Configuration Read Access Key.
5. Input the Configuration Write Access Key.Enable Password Vault: An optional feature that allows users to take the stored credentials from their own password vault. Please refer to the password vault connection guide if needed.
Connection Health Check: Updates the connection status you have created. A connection health check is done by scheduling the Test Connection command of this integration. This can only be done when the connection is active.
To set up a connection health check, check the Connection Health Check tickbox. You can customize the interval (minutes) for scheduling the health check. An email notification can be set up after a specified number of failed connection attempts.
Test the connection.
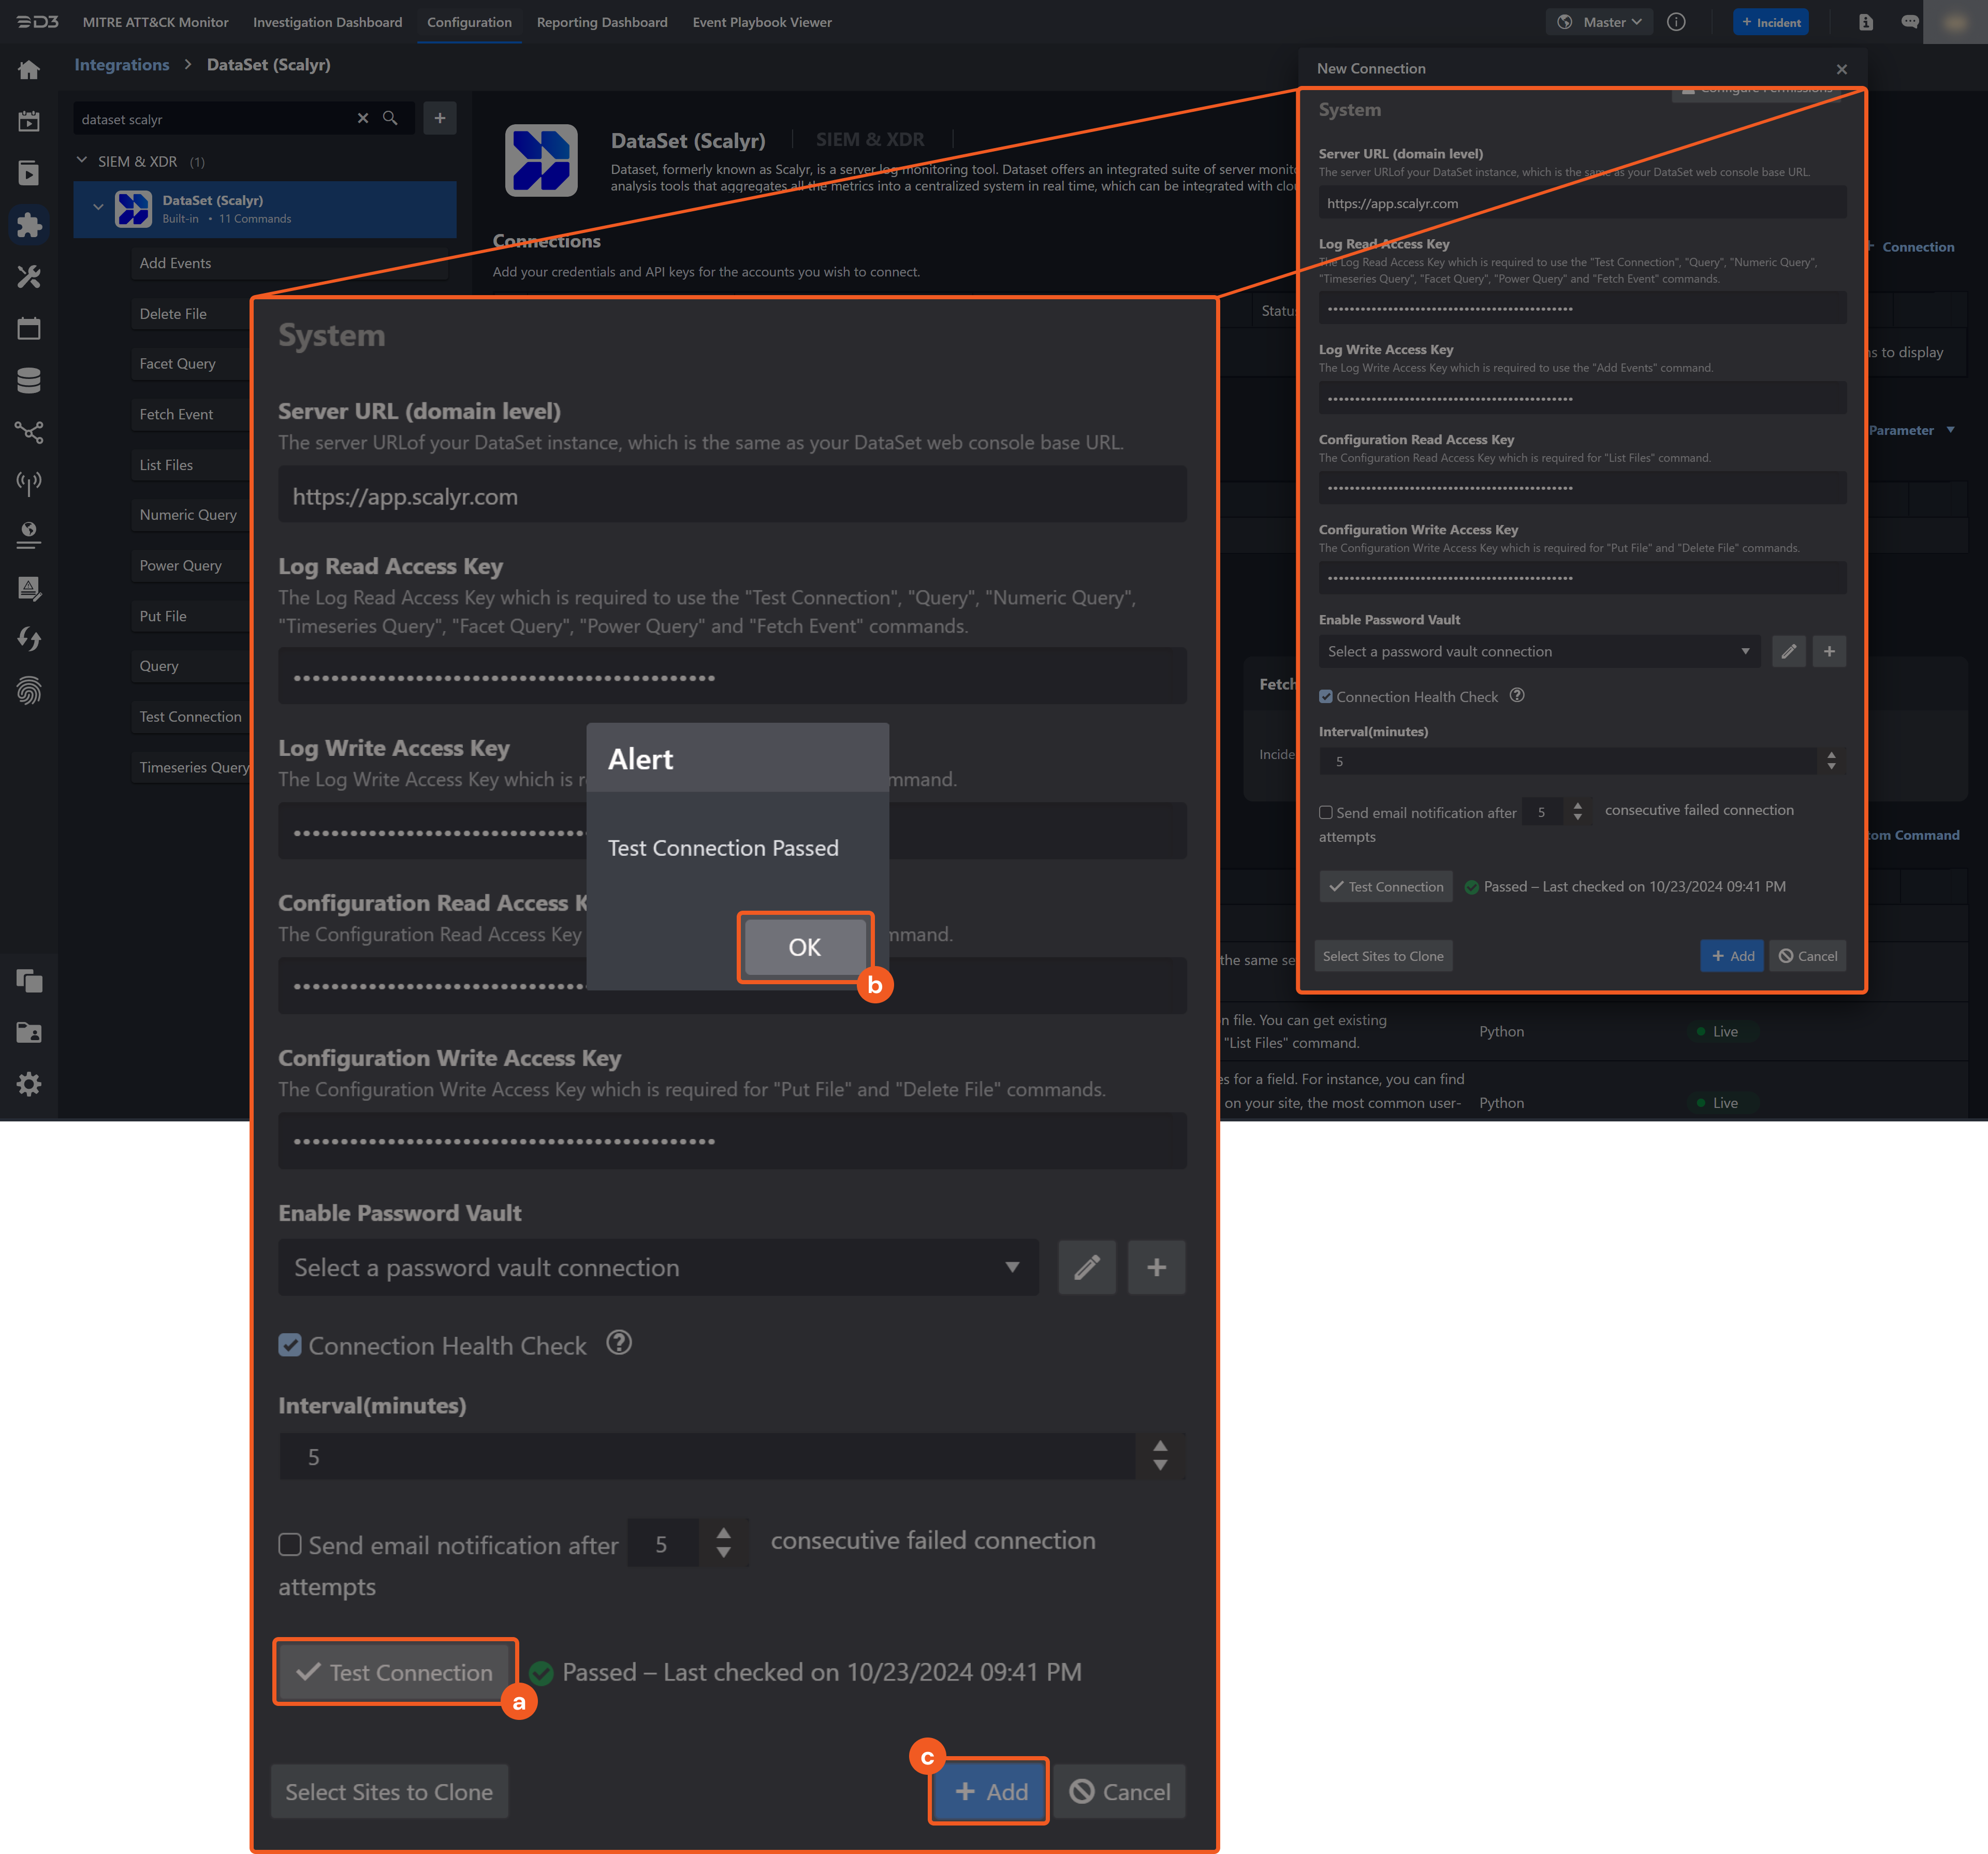
Click Test Connection to verify the account credentials and network connection. If the Test Connection Passed alert window appears, the test connection is successful. You will see Passed with a green checkmark appear beside the Test Connection button. If the test connection fails, please check your connection parameters and try again.
Click OK to close the alert window.
Click + Add to create and add the configured connection.
Commands
DataSet (Scalyr) includes the following executable commands for users to set up schedules or create playbook workflows. With the Test Command, you can execute these commands independently for playbook troubleshooting.
Integration API Note
For more information about the DataSet (Scalyr) API, please refer to the DataSet (Scalyr) API reference.
READER NOTE
Certain permissions are required for each command. Please refer to the Permission Requirements and Configuring DataSet (Scalyr) to Work with D3 SOAR for details.
Note for Time-related parameters
The input format of time-related parameters may vary based on your account settings. As a result, the sample data provided in our commands is different from what you see. To set your preferred time format, follow these steps:
Navigate to Configuration > Application Settings. Select Date/Time Format.
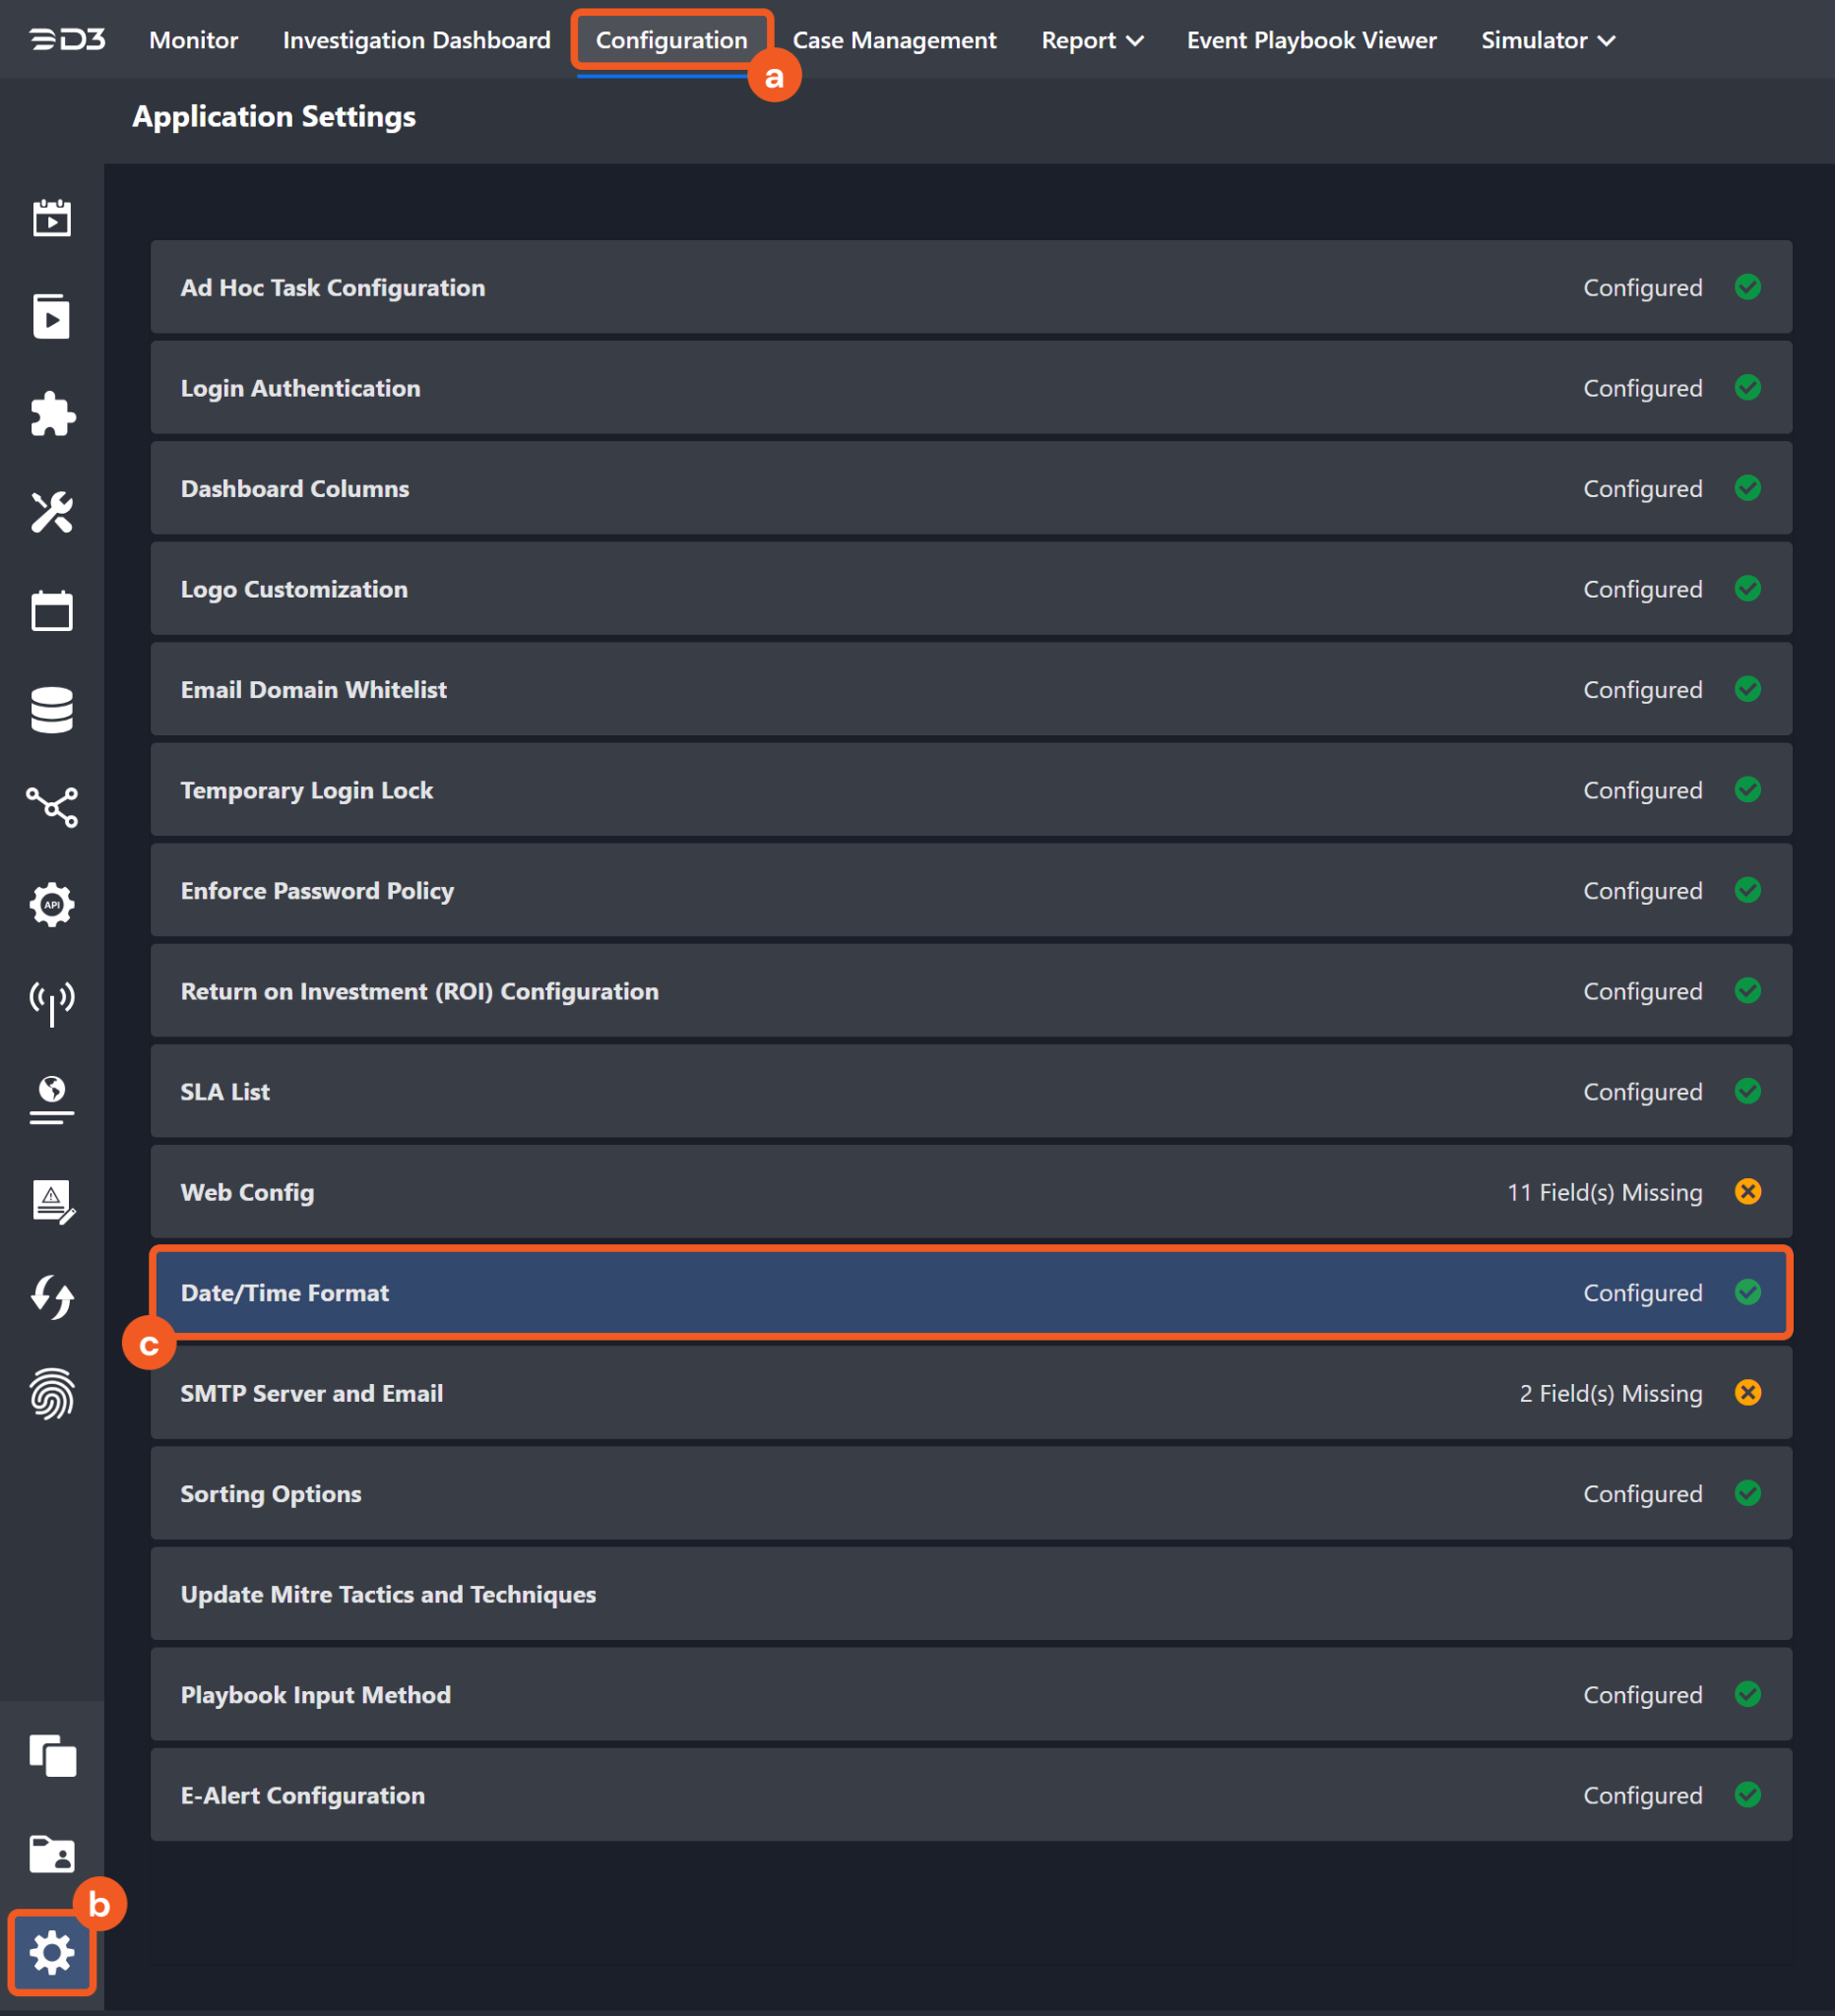
Choose your desired date and time format.
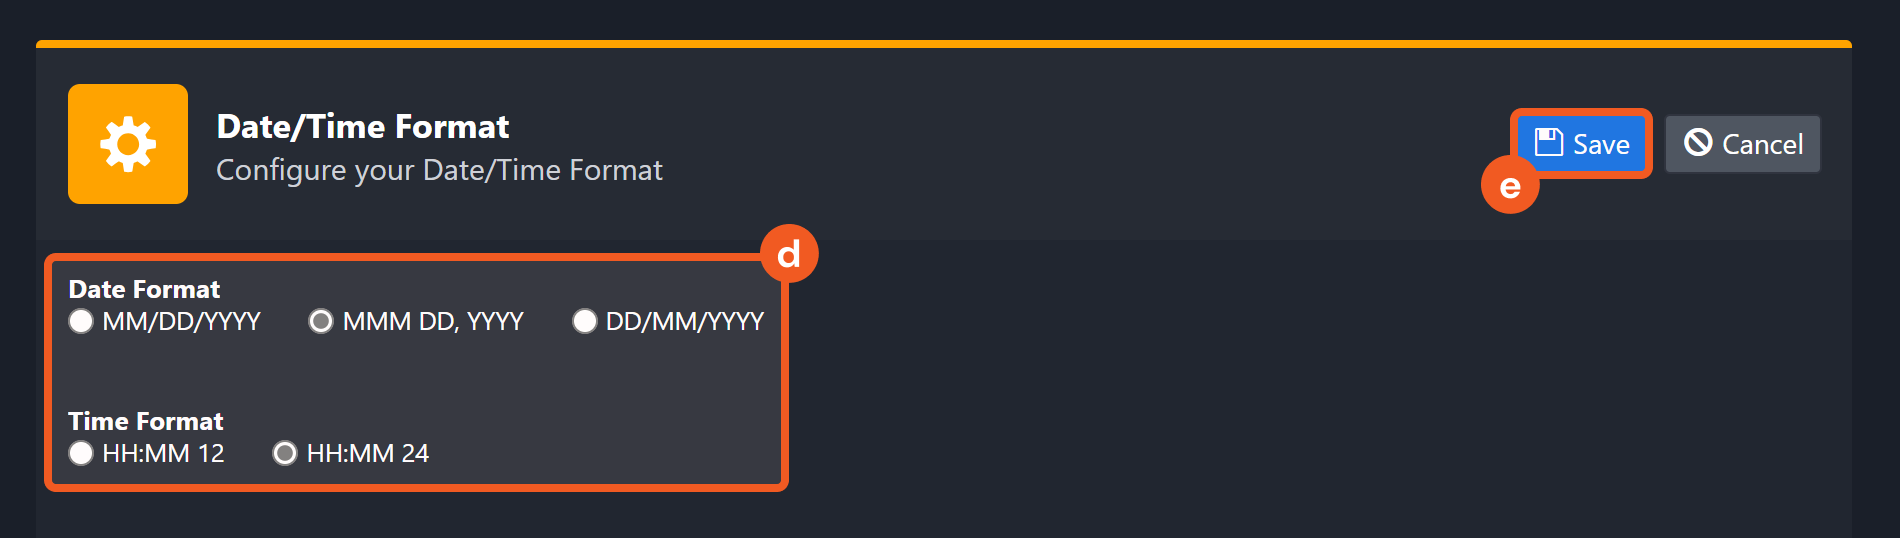
After that, you will be able to view your preferred time format when configuring the DateTime input parameters for commands.
Add Events
Creates events (log records) with the same severity and constant attributes (logs) in one thread.
READER NOTE
For the Session parameter, your defined session identifier will automatically be created with a corresponding UUID that is generated by D3, in the format "log_session_{19 digit number}". The session identifier will be shown in other commands' returned raw data, for example Fetch Event. Using the same input in the Session parameter will not create a new UUID, so try to use the same Session identifier for each request to avoid reaching the rate limit. If you receive "backoff" (429) errors, please use another session name to divide the events to add.
Threads that do not already exist can be input to create new threads. To retrieve existing threads, run the Fetch Event command. Threads can be obtained from the returned raw data at the path $.matches[*].thread.
Input
Input Parameter | Required/Optional | Description | Example |
Session | Required | An arbitrary string (up to 200 chars) uniquely defining the upload process's lifetime. A session identifier is automatically generated using D3's UUID, following the format "log_session_{19 digit number}". It is important to avoid creating a new session identifier for each request. If you create too many session identifiers or your session exceeds 12MB/s, Dataset may apply a rate limit to your account. Similarly, rate limiting may occur if the throughput per session exceeds around 12MB/s. If you encounter "backoff" (429) errors during sustained periods of high throughput, it is recommended to distribute your added Events activity across multiple sessions. | d3labTestEventSession |
Session Info | Optional | The fields associated with the uploading process. These fields can then be used when querying the uploaded events. This parameter is optional, but you should generally specify at least a serverHost or source field (see sample data), containing your hostname or some other stable server identifier. We use this value to organize events from different servers. Session Info should remain the same for all API invocations that share a session value. | { "serverHost": "host-1", "serverType": "on_prem", "region": "ca-central", "source": "***" } |
Thread | Optional | The unique thread name appearing in the events list. If this parameter is not defined, the default value is default. | d3labTestThread_728 |
Log Attributes | Optional | The constant attributes, whose value does not change across multiple events in the request. This reduces redundant data, and improves throughput. | { "_k8s_ck": "Deployment", "_k8s_cn": "***" } |
Severity | Optional | The importance of the event(s), using the classic scale Finest, Finer, Fine, Info, Warning, Error, Fatal. If not specified, the default value is Info. | Warning |
Event Contents | Required | The content of the event(s). If you have multiple events to add, please put each event content as an object in the event object list. | [ { "message": "test event at ***", "recordId": "***-***-***-***-***" } ] |
Output
Error Handling
If the Return Data is Failed, an Error tab will appear in the Test Result window.
The error tab contains the details responded from D3 SOAR or third-party API calls, including Failure Indicator, Status Code, and Message. This can help you locate the root cause of a command failure.
Parts in Error | Description | Example |
Failure Indicator | Indicates the command failure that happened at a specific input and/or API call. | Add Events failed. |
Status Code | The response code issued by the third-party API server or the D3 SOAR system that can be used to locate the corresponding error category. For example, if the returned status code is 401, the selected connection is unauthorized to run the command. The user or system support would need to check the permission setting in the DataSet (Scalyr) portal. Refer to the HTTP Status Code Registry for details. | Status Code: 429. |
Message | The raw data or captured key error message from the integration API server about the API request failure. | Message: Backoff. |
Error Sample Data Add Events failed. Status Code: 429. Message: Backoff. |
Delete File
Deletes the specified configuration file. You can get existing configuration files by running the List Files command.
READER NOTE
File Path is a required parameter to run this command.
Run the List Files command to obtain the File Path. File Path can be found in the returned raw data at the path $.paths.
After successfully running this command, you may check the result in the List Files command. The path you deleted will disappear.
Input
Input Parameter | Required/Optional | Description | Example |
File Path | Required | The file path of the configuration file you are going to delete. Existing configuration File Path can be obtained using the List Files command. Please note, File Path must begin with a '/'. | /***/sample1 |
Output
Error Handling
If the Return Data is Failed, an Error tab will appear in the Test Result window.
The error tab contains the details responded from D3 SOAR or third-party API calls, including Failure Indicator, Status Code, and Message. This can help you locate the root cause of a command failure.
Parts in Error | Description | Example |
Failure Indicator | Indicates the command failure that happened at a specific input and/or API call. | Delete File failed. |
Status Code | The response code issued by the third-party API server or the D3 SOAR system that can be used to locate the corresponding error category. For example, if the returned status code is 401, the selected connection is unauthorized to run the command. The user or system support would need to check the permission setting in the DataSet (Scalyr) portal. Refer to the HTTP Status Code Registry for details. | Status Code: 443. |
Message | The raw data or captured key error message from the integration API server about the API request failure. | Message: Failed to establish a new connection. |
Error Sample Data Delete File failed. Status Code: 443. Message: Failed to establish a new connection. |
Facet Query
Retrieves the most common values for a field. For instance, you can find the most common URLs accessed on your site, the most common user-agent strings, or the most common response codes returned.
Input
Input Parameter | Required/Optional | Description | Example |
Start Time | Required | The start time of the time range to do a facet query in UTC time format. | 2023-04-17 00:00 |
End Time | Optional | The end time of the time range to do a facet query in UTC format. If this parameter is not defined, the default end time is the present time. | 2023-04-18 00:00 |
Limit | Optional | The maximum number of unique values to return. Input value can range from 1 to 1000. If this parameter is not defined, the default value is 100. | 100 |
Filter | Optional | The events to match, using the same syntax as the Expression field in the query UI. To match all events, omit this field or pass an empty string. Please refer to Help: Query Language | DataSet for more information. | source='scalyr' |
Field | Required | The event field to retrieve. | delayMax |
Output
Error Handling
If the Return Data is Failed, an Error tab will appear in the Test Result window.
The error tab contains the details responded from D3 SOAR or third-party API calls, including Failure Indicator, Status Code, and Message. This can help you locate the root cause of a command failure.
Parts in Error | Description | Example |
Failure Indicator | Indicates the command failure that happened at a specific input and/or API call. | Facet Query failed. |
Status Code | The response code issued by the third-party API server or the D3 SOAR system that can be used to locate the corresponding error category. For example, if the returned status code is 401, the selected connection is unauthorized to run the command. The user or system support would need to check the permission setting in the DataSet (Scalyr) portal. Refer to the HTTP Status Code Registry for details. | Status Code: 401. |
Message | The raw data or captured key error message from the integration API server about the API request failure. | Message: Error in filter expression. |
Error Sample Data Facet Query failed. Status Code: 401. Message: Error in filter expression. |
Fetch Event
Returns all events in a specified time range, or only events matching specific criteria.
Input
Input Parameter | Required /Optional | Description | Example |
Start Time | Optional | The start time of the time range to fetch events in UTC time format. If you specify End Time but not Start Time, the query covers 24 hours ending at the End Time. If neither parameter is defined, the default is to query the last 24 hours. | 2023-04-17 00:00 |
End Time | Optional | The end time of the time range to fetch events in UTC time format. If you specify the Start Time but not the End Time, the query covers 24 hours beginning at the Start Time. If neither parameter is defined, the default is to query the last 24 hours. | 2023-04-18 00:00 |
Number of Event(s) Fetched | Optional | The maximum number of records to return. If this parameter is not defined, the default value is 100. | 5000 |
Search Condition | Optional | The query to return events, using the same syntax as the Expression field in the query UI. To match all events, omit this field or pass an empty string. Please refer to Help: Query Language | DataSet for more information. | source= '***' |
Team Emails | Optional | The list of account emails to query for cross-team search. The API key used to authenticate the request must belong to an account with access to all teams listed in this property. | ["test@example.com"] |
Tolerance Scope(Minute) | Optional | The tolerance scope (the default value is 10) in minutes of the query to get events between start and end time to avoid the loss of events. The event will be fetched between {Start Time - Tolerance Scope, End Time}. | 10 |
Output
Fetch Event Field Mapping
Please note that Fetch Event commands require event field mapping. Field mapping plays a key role in the data normalization process part of the event pipeline. Field mapping converts the original data fields from the different providers to the D3 fields which are standardized by the D3 Model. Please refer to Event and Incident Intake Field Mapping for details.
If you require a custom field mapping, click +Add Field to add a custom field mapping. You may also remove built-in field mappings by clicking x. Please note that two underscore characters will automatically prefix the defined Field Name as the System Name for a custom field mapping. Additionally, if an input Field Name contains any spaces, they will automatically be replaced with underscores for the corresponding System Name.
As a system integration, the DataSet (Scalyr) integration has some pre-configured field mappings for default field mapping.
Default Event Source
The Default Event Source is the default set of field mappings that are applied when this fetch event command is executed. For out-of-the-box integrations, you will find a set of field mapping provided by the system. Default event source provides field mappings for common fields from fetched events. The default event source has a “Main Event JSON Path” (i.e., $.matches) that is used to extract a batch of events from the response raw data. Click Edit Main JSON Path to view the “Main Event JSON Path”..png?inst-v=9d16beaf-952a-4ae4-8fe8-e35f7a3745da)
Main Event JSON Path: $.matches
The Main Event JSON Path determines the root path where the system starts parsing raw response data into D3 event data. The JSON path begins with $, representing the root element. The path is formed by appending a sequence of child elements to $, each separated by a dot (.). Square brackets with nested quotation marks ([‘...’]) should be used to separate child elements in JSON arrays.
For example, the root node of a JSON Path is matches. The child node denoting the Unique Event Key field would be timestamp. Putting it together, the JSON Path expression to extract the Unique Event Key is $.matches.$.timestamp.
The pre-configured field mappings are detailed below:
Field Name | Source Field |
Unique Event Key | .timestamp |
Event Type | .session |
Severity | .severity |
Start Time | .timestamp |
Source thread ID | .thread |
Message | .message |
Content | .attributes |
Error Handling
If the Return Data is Failed, an Error tab will appear in the Test Result window.
The error tab contains the details responded from D3 SOAR or third-party API calls, including Failure Indicator, Status Code, and Message. This can help you locate the root cause of a command failure.
Parts in Error | Description | Example |
Failure Indicator | Indicates the command failure that happened at a specific input and/or API call. | Fetch Event failed. |
Status Code | The response code issued by the third-party API server or the D3 SOAR system that can be used to locate the corresponding error category. For example, if the returned status code is 401, the selected connection is unauthorized to run the command. The user or system support would need to check the permission setting in the DataSet (Scalyr) portal. Refer to the HTTP Status Code Registry for details. | Status Code: 400. |
Message | The raw data or captured key error message from the integration API server about the API request failure. | Message: parameter teamEmails is invalid. |
Error Sample Data Fetch Event failed. Status Code: 400. Message: parameter teamEmails is invalid. |
List Files
Lists all configuration files.
Input
N/A
Output
Error Handling
If the Return Data is Failed, an Error tab will appear in the Test Result window.
The error tab contains the details responded from D3 SOAR or third-party API calls, including Failure Indicator, Status Code, and Message. This can help you locate the root cause of a command failure.
Parts in Error | Description | Example |
Failure Indicator | Indicates the command failure that happened at a specific input and/or API call. | List Files failed. |
Status Code | The response code issued by the third-party API server or the D3 SOAR system that can be used to locate the corresponding error category. For example, if the returned status code is 401, the selected connection is unauthorized to run the command. The user or system support would need to check the permission setting in the DataSet (Scalyr) portal. Refer to the HTTP Status Code Registry for details. | Status Code: 401. |
Message | The raw data or captured key error message from the integration API server about the API request failure. | Message: Please make sure Configuration Read Access Key is valid. |
Error Sample Data List Files failed. Status Code: 401. Message: Please make sure Configuration Read Access Key is valid. |
Numeric Query
Retrieves numeric data, e.g. for graphing. You can count the rate of events matching some criteria (e.g. error rate), or retrieve a numeric field (e.g. response size). Please note, this method is effectively deprecated. Use timeseriesQuery to retrieve numeric data. A timeseriesQuery with "createSummaries": false and "onlyUseSummaries": false is effectively a numericQuery.
Input
Input Parameter | Required/Optional | Description | Example |
Start Time | Required | The start time of the time range to do a numeric query in UTC time format. | 2023-04-17 00:00 |
End Time | Optional | The end time of the time range to do a numeric query in UTC time format. If not specified, the default end time is the present time. | 2023-04-18 00:00 |
Function | Optional | The value to compute from the matching events. You can use any function listed in Graph Functions, except for fraction(expr). For example: mean(x) or median(responseTime), if x and responseTime are fields of your log. You can also specify a simple field name, such as responseTime, to return the mean value of that field. If you omit the function argument, the rate of matching events per second will be returned. Specifying the rate yields the same result. | mean(delayMax) |
Filter | Optional | The query to return events, using the same syntax as the Expression field in the query UI. To match all events, omit this field or pass an empty string. Please refer to Help: Query Language | DataSet for more information. | source='scalyr' |
Buckets | Optional | The number of numeric values to return. The time range is divided into this many equal slices. For instance, if you query a four-hour period with buckets = 4, the query will return four numbers, each covering a one-hour period. The input value can range from 1 to 5000. The default is 1. | 24 |
Output
Error Handling
If the Return Data is Failed, an Error tab will appear in the Test Result window.
The error tab contains the details responded from D3 SOAR or third-party API calls, including Failure Indicator, Status Code, and Message. This can help you locate the root cause of a command failure.
Parts in Error | Description | Example |
Failure Indicator | Indicates the command failure that happened at a specific input and/or API call. | Numeric Query failed. |
Status Code | The response code issued by the third-party API server or the D3 SOAR system that can be used to locate the corresponding error category. For example, if the returned status code is 401, the selected connection is unauthorized to run the command. The user or system support would need to check the permission setting in the DataSet (Scalyr) portal. Refer to the HTTP Status Code Registry for details. | Status Code: 404. |
Message | The raw data or captured key error message from the integration API server about the API request failure. | Message: Error in filter expression. |
Error Sample Data Numeric Query failed. Status Code: 400. Message: Error in filter expression. |
Power Query
Performs a Power Query. Please refer to Help: PowerQueries | DataSet for more information on Power Query syntax.
Input
Input Parameter | Required/Optional | Description | Example |
Start Time | Optional | The start time of the time range to perform a Power Query in UTC time format. If you specify End Time but not Start Time, the query covers 24 hours ending at the End Time. If neither parameter is defined, the default is to query the last 24 hours. | 2023-04-17 00:00 |
End Time | Optional | The end time of the time range to perform a Power Query. If you specify Start Time but not the End Time, the query covers 24 hours beginning at the startTime. If neither parameter is defined, the default is to query the last 24 hours. | 2023-04-17 00:00 |
Query | Required | The query to execute in the PowerQuery language. Please refer to PowerQueries for more information on Power Query syntax. | source ="scalyr" | group requests=count(),delays=count(delayMax > 3) | let delayRate = delays/requests | filter delayRate > 0.4|sort -delayRate |
Team Emails | Optional | The list of account emails to query for cross-team search. The API key used to authenticate the request must belong to an account with access to all teams listed in this property. | ["test@example.com"] |
Output
Error Handling
If the Return Data is Failed, an Error tab will appear in the Test Result window.
The error tab contains the details responded from D3 SOAR or third-party API calls, including Failure Indicator, Status Code, and Message. This can help you locate the root cause of a command failure.
Parts in Error | Description | Example |
Failure Indicator | Indicates the command failure that happened at a specific input and/or API call. | Power Query failed. |
Status Code | The response code issued by the third-party API server or the D3 SOAR system that can be used to locate the corresponding error category. For example, if the returned status code is 401, the selected connection is unauthorized to run the command. The user or system support would need to check the permission setting in the DataSet (Scalyr) portal. Refer to the HTTP Status Code Registry for details. | Status Code: 400. |
Message | The raw data or captured key error message from the integration API server about the API request failure. | Message: Error in filter expression. |
Error Sample Data Power Query failed. Status Code: 400. Message: Error in filter expression. |
Put File
Creates or updates a configuration file. You can get existing configuration files by running the List Files command.
READER NOTE
After you successfully run this command, you may check the result in the List Files command. The new path you added/updated will appear.
Input
Input Parameter | Required/Optional | Description | Example |
File Path | Required | The file path of the configuration to create or update. Configuration file paths can be obtained using the List Files command. Note: File paths must begin with '/'. | /d3lab/sample1 |
File Content | Optional | The content for the new/updated configuration file. | { "x": 123, "y": "foo", "z": true } |
Output
Error Handling
If the Return Data is Failed, an Error tab will appear in the Test Result window.
The error tab contains the details responded from D3 SOAR or third-party API calls, including Failure Indicator, Status Code, and Message. This can help you locate the root cause of a command failure.
Parts in Error | Description | Example |
Failure Indicator | Indicates the command failure that happened at a specific input and/or API call. | Put File failed. |
Status Code | The response code issued by the third-party API server or the D3 SOAR system that can be used to locate the corresponding error category. For example, if the returned status code is 401, the selected connection is unauthorized to run the command. The user or system support would need to check the permission setting in the DataSet (Scalyr) portal. Refer to the HTTP Status Code Registry for details. | Status Code: 401. |
Message | The raw data or captured key error message from the integration API server about the API request failure. | Message: File paths must begin with a \. |
Error Sample Data Put File failed. Status Code: 401. Message: File paths must begin with a \. |
Query
Retrieves all events in a specified time range, or only events matching specific criteria.
Input
Input Parameter | Required/Optional | Description | Example |
Start Time | Optional | The start time of the time range to query in UTC time format. If you specify End Time but not Start Time, the query covers 24 hours ending at the End Time. If neither parameter is defined, the default is to query the last 24 hours. | 2023-04-17 00:00 |
End Time | Optional | The end time of the time range to query in UTC time format. If you specify Start Time but not End Time, the query covers 24 hours beginning at the Start Time. If neither parameter is defined, the default is to query the last 24 hours. | 2023-04-18 00:00 |
Limit | Optional | The maximum number of records to return. If this parameter is undefined, the default value is 100. | 5000 |
Filter | Optional | The query to return events, using the same syntax as the Expression field in the query UI. To match all events, omit this field or pass an empty string. Please refer to Help: Query Language | DataSet for more information. | serverHost='DESKTOP-***' AND metric= '**.**' |
Team Emails | Optional | The list of account emails to query for cross-team search. The API key used to authenticate the request must belong to an account with access to all teams listed in this property. | ["test@example.com"] |
Output
Error Handling
If the Return Data is Failed, an Error tab will appear in the Test Result window.
The error tab contains the details responded from D3 SOAR or third-party API calls, including Failure Indicator, Status Code, and Message. This can help you locate the root cause of a command failure.
Parts in Error | Description | Example |
Failure Indicator | Indicates the command failure that happened at a specific input and/or API call. | Query failed. |
Status Code | The response code issued by the third-party API server or the D3 SOAR system that can be used to locate the corresponding error category. For example, if the returned status code is 401, the selected connection is unauthorized to run the command. The user or system support would need to check the permission setting in the DataSet (Scalyr) portal. Refer to the HTTP Status Code Registry for details. | Status Code: 400. |
Message | The raw data or captured key error message from the integration API server about the API request failure. | Message: Error in filter expression. |
Error Sample Data Query failed. Status Code: 400. Message: Error in filter expression. |
Timeseries Query
Retrieves numeric data. Multiple queries are supported. For queries you wish to execute repeatedly, you can create a timeseries of precomputed query results. Query execution will be almost instantaneous. You can also specify whether a query only executes against the timeseries, or against the event database if a preexisting time series does not exist. Please note, if you want to do multiple queries, you can only use the Queries parameter, and other parameters will be omitted.
Input
Input Parameter | Required/Optional | Description | Example |
Start Time | Required | The start time of the time range to do a timeseries query in UTC time format. | 2023-04-17 00:00 |
End Time | Optional | The end time of the time range to do a timeseries query in UTC time format. If this parameter is undefined, the default end time is the present time. | 2023-04-18 00:00 |
Function | Optional | The value to compute from the matching events. You can use any function listed in Graph Functions, except for fraction(expr). For example: mean(x) or median(responseTime), if x and responseTime are fields of your log. You can also specify a simple field name, such as responseTime, to return the mean value of that field. If you omit the function argument, the rate of matching events per second will be returned. Specifying the rate yields the same result. | mean(delayMax) |
Filter | Required | The query to return events, using the same syntax as the Expression field in the query UI. To match all events, omit this field or pass an empty string. Please refer to Help: Query Language | DataSet for more information. | source='scalyr' |
Buckets | Optional | The number of numeric values to return. The time range is divided into this many equal slices. For instance, if you query a four-hour period with buckets = 4, the query will return four numbers, each covering a one-hour period. The input value can range from 1 to 5000. The default is 1. | 24 |
Create Summaries | Optional | The option to generate a time series in DataSet based on your query, when set to True. This process involves updating the time series in real-time using the ingestion pipeline, and then performing a "backfill" to fill in any gaps in the time span of your query. The backfill process is automatic and will update the time series again if you query the same data with an earlier start time. After the backfill is complete, query execution is nearly instantaneous. | True |
Only Use Summaries | Optional | The option to execute the query on only preexisting time series, when set to True. When set to False (which is the default), the query will execute against the event database if no preexisting timeseries is available. | False |
Queries | Optional | The JSON object containing multiple time series query objects to run. This parameter is used for executing multiple time series queries. All other parameters are ignored when this parameter is defined. | [ { "filter": "source=\"scalyr\"", "function": "mean(delayMax)", "startTime": "2022-07-27T00:00:00Z", "endTime": "2022-07-28T00:00:00Z", "buckets": 24, "createSummaries": false, // Defaults to true "onlyUseSummaries": false // Defaults to false }, { "filter": "source=\"scalyr\"", "function": "count", "startTime": "2022-07-27T00:00:00Z", "endTime": "2022-07-28T00:00:00Z", "buckets": 24, "createSummaries": true, // Defaults to true "onlyUseSummaries": false // Defaults to false } ] |
Output
Error Handling
If the Return Data is Failed, an Error tab will appear in the Test Result window.
The error tab contains the details responded from D3 SOAR or third-party API calls, including Failure Indicator, Status Code, and Message. This can help you locate the root cause of a command failure.
Parts in Error | Description | Example |
Failure Indicator | Indicates the command failure that happened at a specific input and/or API call. | Timeseries Query failed. |
Status Code | The response code issued by the third-party API server or the D3 SOAR system that can be used to locate the corresponding error category. For example, if the returned status code is 401, the selected connection is unauthorized to run the command. The user or system support would need to check the permission setting in the DataSet (Scalyr) portal. Refer to the HTTP Status Code Registry for details. | Status Code: 400. |
Message | The raw data or captured key error message from the integration API server about the API request failure. | Message: Error in filter expression. |
Error Sample Data Timeseries Query failed. Status Code: 400. Message: Error in filter expression. |
Test Connection
Allows you to perform a health check on an integration connection. You can schedule a periodic health check by selecting Connection Health Check when editing an integration connection.
Input
N/A
Output
Error Handling
If the Return Data is Failed, an Error tab will appear in the Test Result window.
The error tab contains the details responded from D3 SOAR or third-party API calls, including Failure Indicator, Status Code, and Message. This can help you locate the root cause of a command failure.
Parts in Error | Description | Example |
Failure Indicator | Indicates the command failure that happened at a specific input and/or API call. | Test Connection failed. Failed to check the connector. |
Status Code | The response code issued by the third-party API server or the D3 SOAR system that can be used to locate the corresponding error category. For example, if the returned status code is 401, the selected connection is unauthorized to run the command. The user or system support would need to check the permission setting in the DataSet (Scalyr) portal. Refer to the HTTP Status Code Registry for details. | Status Code: 443. |
Message | The raw data or captured key error message from the integration API server about the API request failure. | Message: Failed to establish a new connection. |
Error Sample Data Test Connection failed. Failed to check the connector. Status Code: 443. Message: Failed to establish a new connection. |