
CrowdStrike Falcon LogScale (Humio)
LAST UPDATED: NOVEMBER 12, 2025
Overview
CrowdStrike Falcon LogScale (formerly known as Humio) is a log management system. Integration with LogScale mainly covers the major operations commonly used by users, such as operations to create, delete, and list alerts; operations to create, delete, and stop Query Jobs; and operations to create, list, and get actions.
D3 SOAR is providing REST operations to function with Falcon LogScale(Humio).
Falcon LogScale(Humio) is available for use in:
Connection
Gather the following information to connect D3 SOAR to Falcon LogScale(Humio).
Parameter | Description | Example |
API Token | The API token to use for authenticating the connection. | r8sP*****OV1b |
Server URL | The LogScale URL. | https://cloud.us.humio.com |
API Version | The version of the API to use for the connection. | v1 |
Permission Requirements
Each endpoint in the Falcon LogScale(Humio) API requires a certain permission scope. The following are required scopes for the commands in this integration:
Command | Required Permissions |
Create Alert (GraphQL) | Triggers and actions > Change triggers |
Create Email Action (GraphQL) | Triggers and actions > Change actions |
Create Query Job | Data access > Data read access |
Create Webhook Action (GraphQL) | Triggers and actions > Change actions |
Delete Actions (GraphQL) | Triggers and actions > Change actions |
Delete Alerts (GraphQL) | Triggers and actions > Change triggers |
Fetch Event | Data access > Data read access |
Get Actions By IDs (GraphQL) | Triggers and actions > Change actions |
Get Alerts By IDs (GraphQL) | Data access > Data read access |
List Actions (GraphQL) | Triggers and actions > Change actions |
List Alerts (GraphQL) | Data access > Data read access |
List Repository and View Names | Data access > Data read access |
Poll Query Job | Data access > Data read access |
Stop Query Job | Data access > Data read access |
Test Connection | Data access > Data read access |
Falcon LogScale(Humio)'s role-based access control (RBAC) model enables authorization of users based on roles with different sets of permissions. LogScale distinguishes between authentication, which establishes the identity of the user, and authorization, which decides what actions an authenticated user may perform. For more information, see Manage users & permissions | Falcon LogScale Cloud 1.143.0-1.156.0 | LogScale Documentation (humio.com).
Configuring Falcon LogScale(Humio) to Work with D3 SOAR
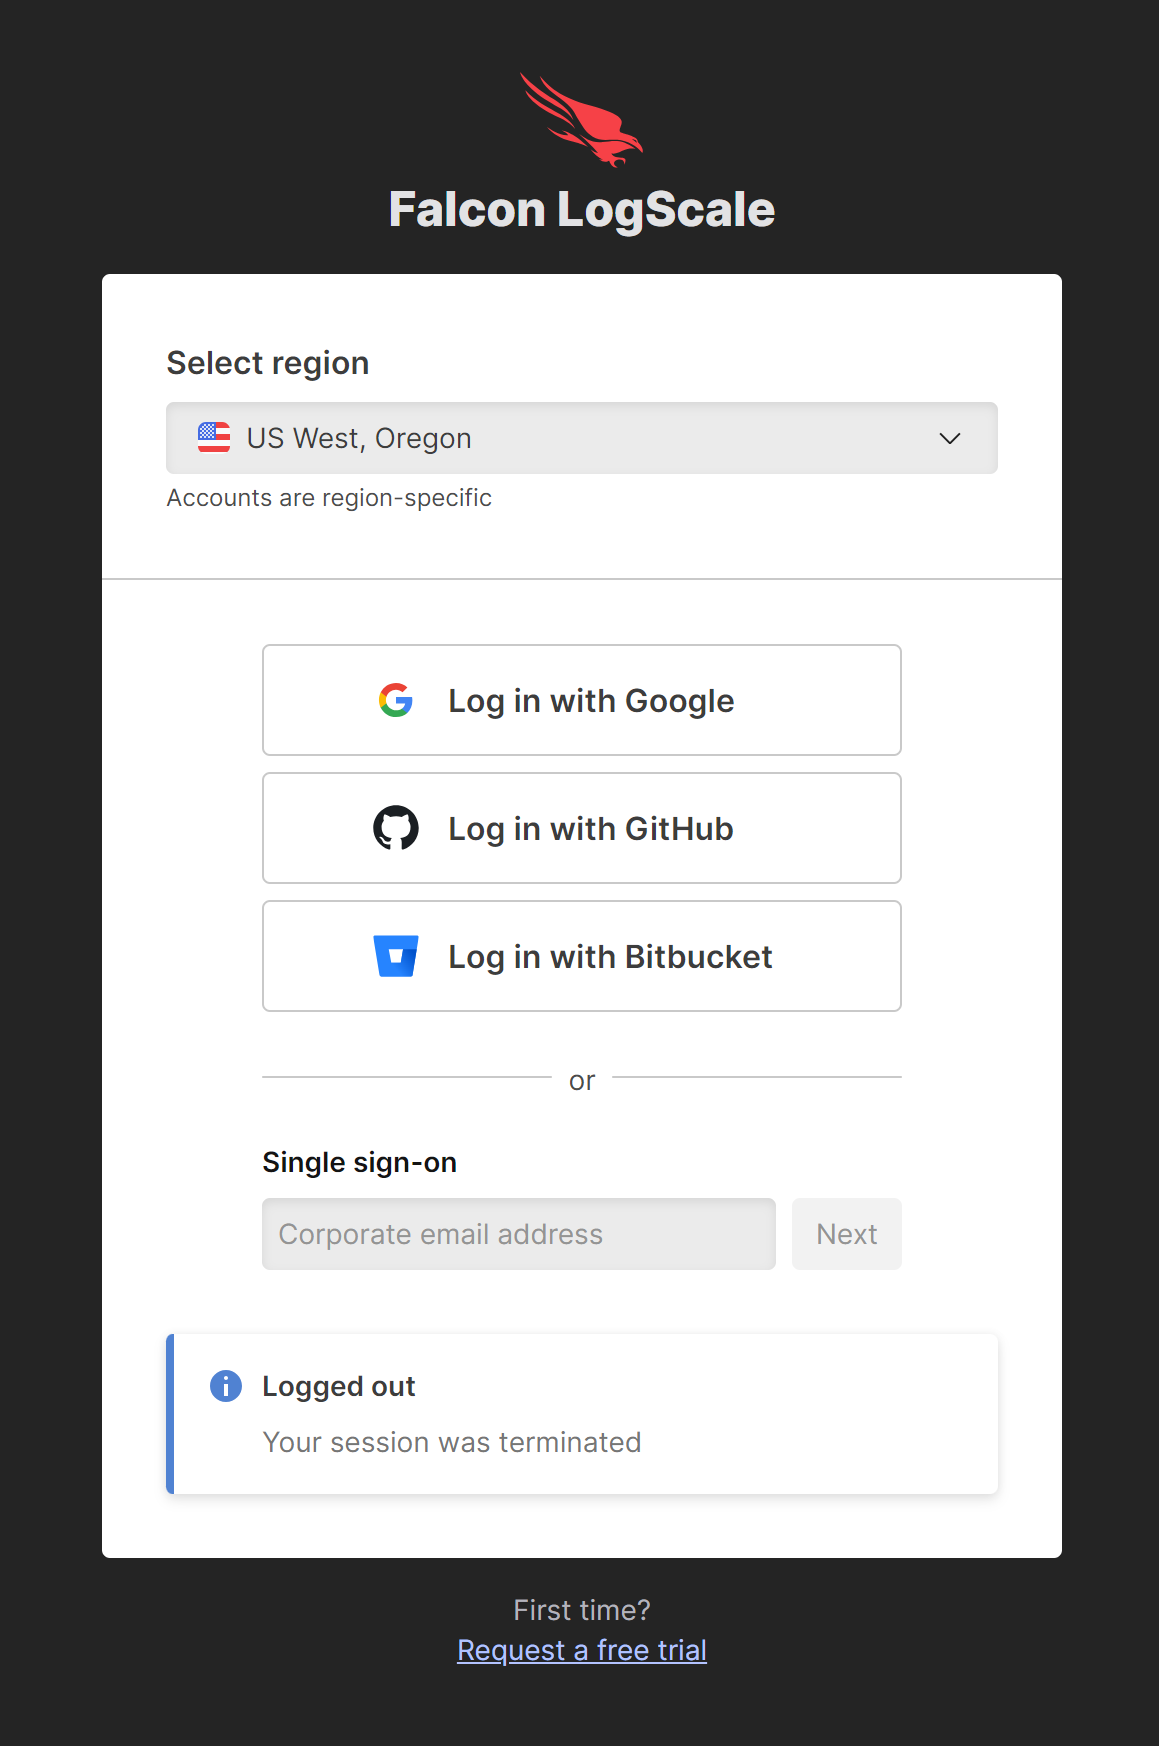
Log into CrowdStrike Falcon LogScale.
Navigate to the Manage your account dashboard.
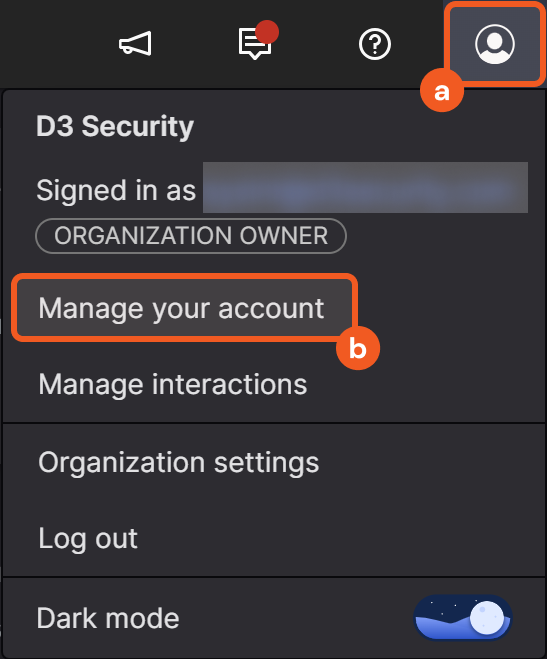
Click on the user icon on the top right corner of the portal.
Click on the Manage your account option in the dropdown menu.
Generate the API token.
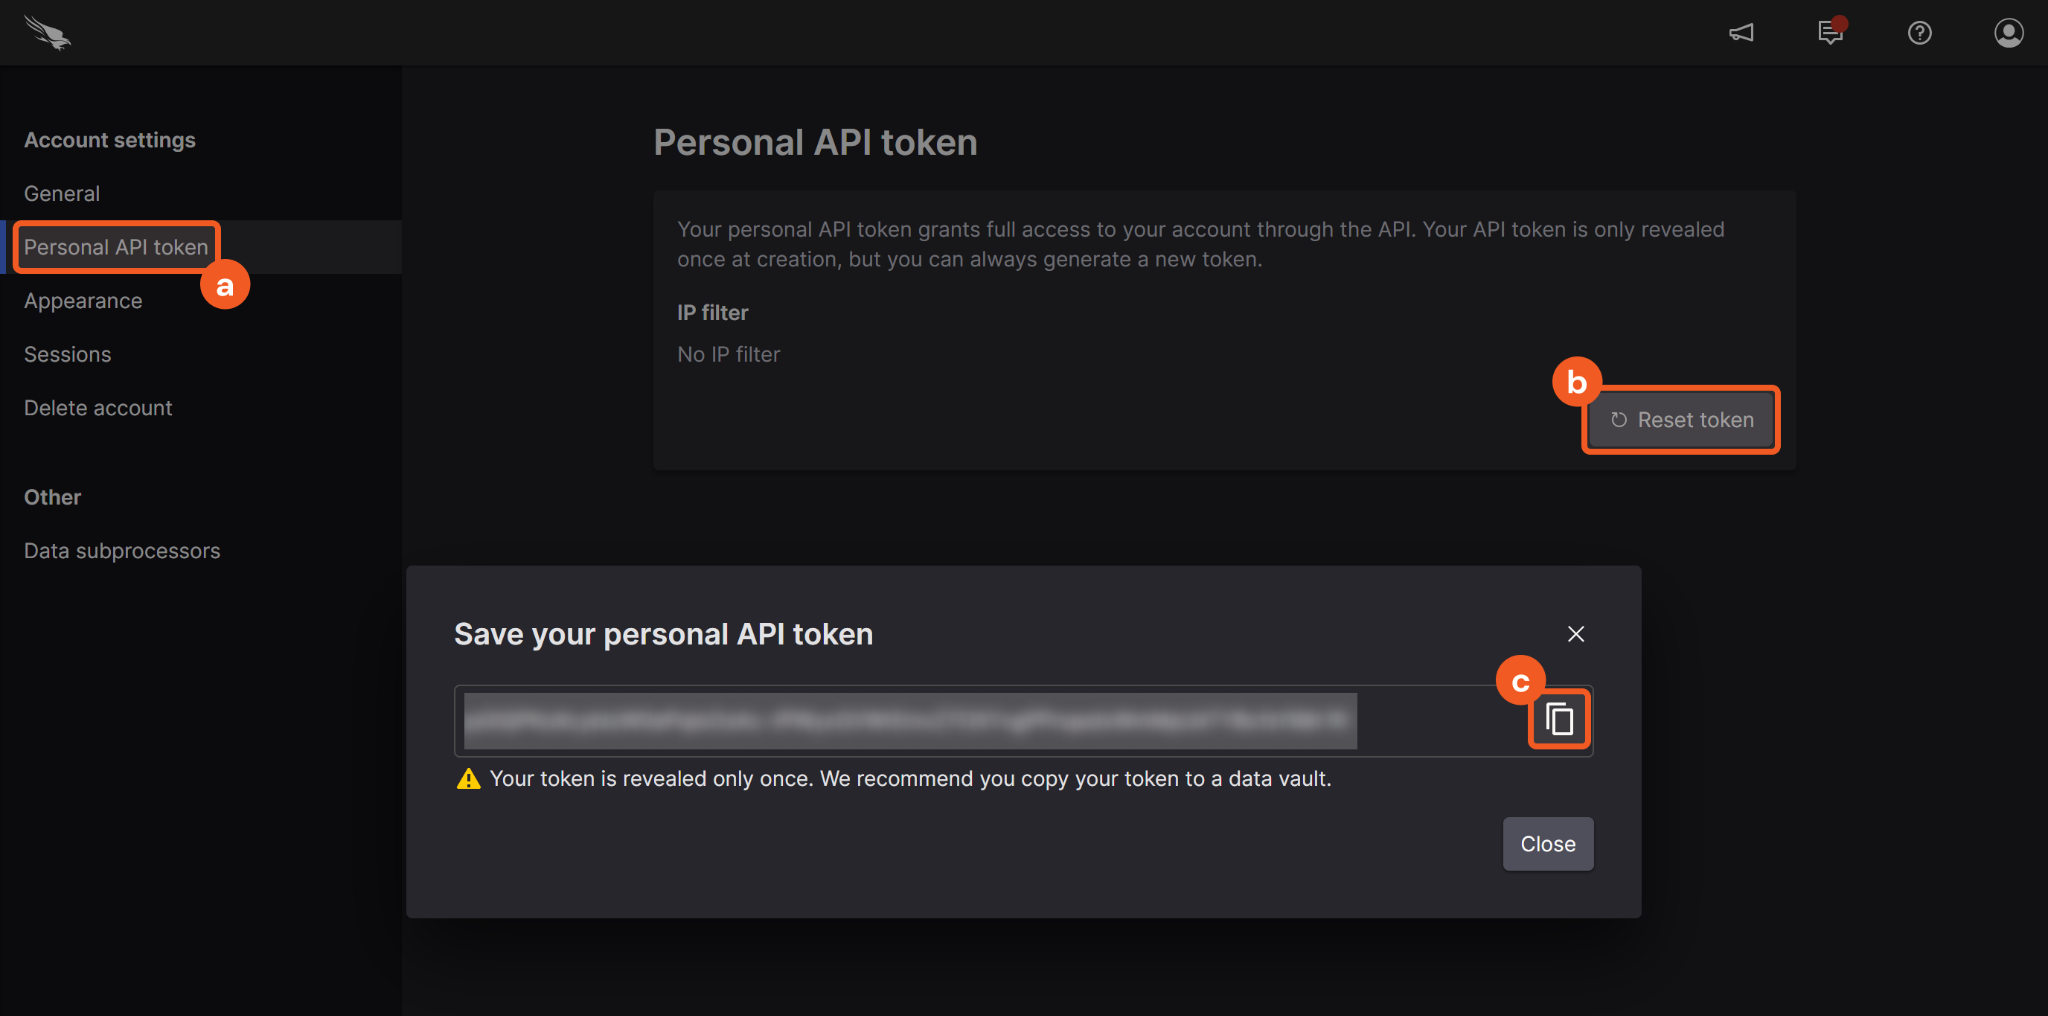
Click on the Personal API token left sidebar option.
Click on the Reset token button.
Click on the Copy button, then paste the API token into D3 vSOC. Refer to step 3.i.2 of Configuring D3 SOAR to Work with Falcon LogScale(Humio).
Configuring D3 SOAR to Work with Falcon LogScale(Humio)
Log in to D3 SOAR.
Find the LogScale integration.
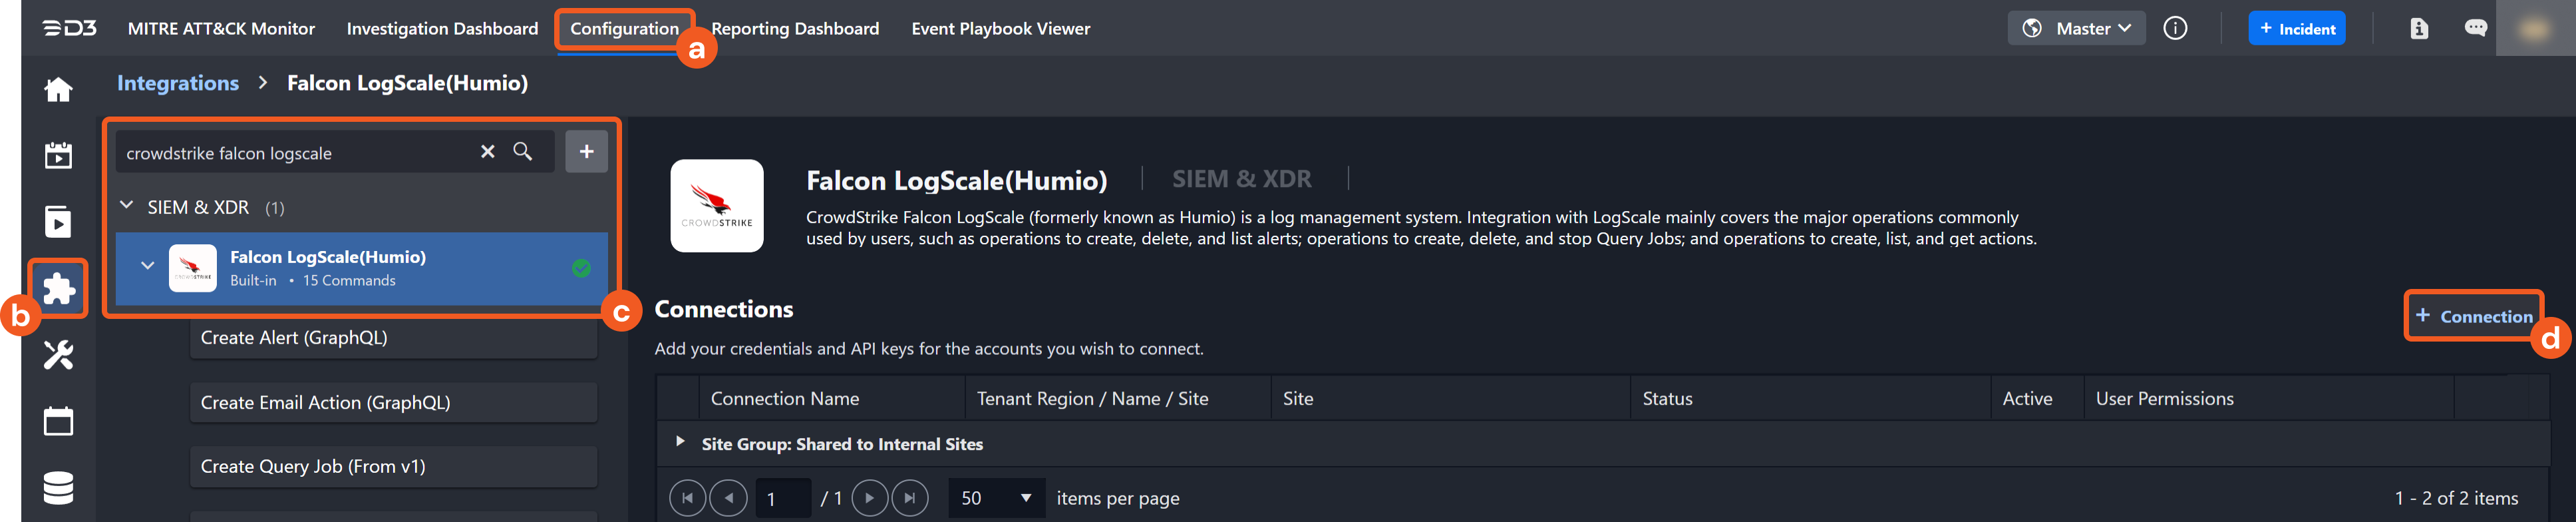
Navigate to Configuration on the top header menu.
Click on the Integration icon on the left sidebar.
Type Falcon LogScale(Humio) in the search box to find the integration, then click it to select it.
Click + Connection, on the right side of the Connections section. A new connection window will appear.
Configure the following fields to create a connection to Falcon LogScale(Humio).
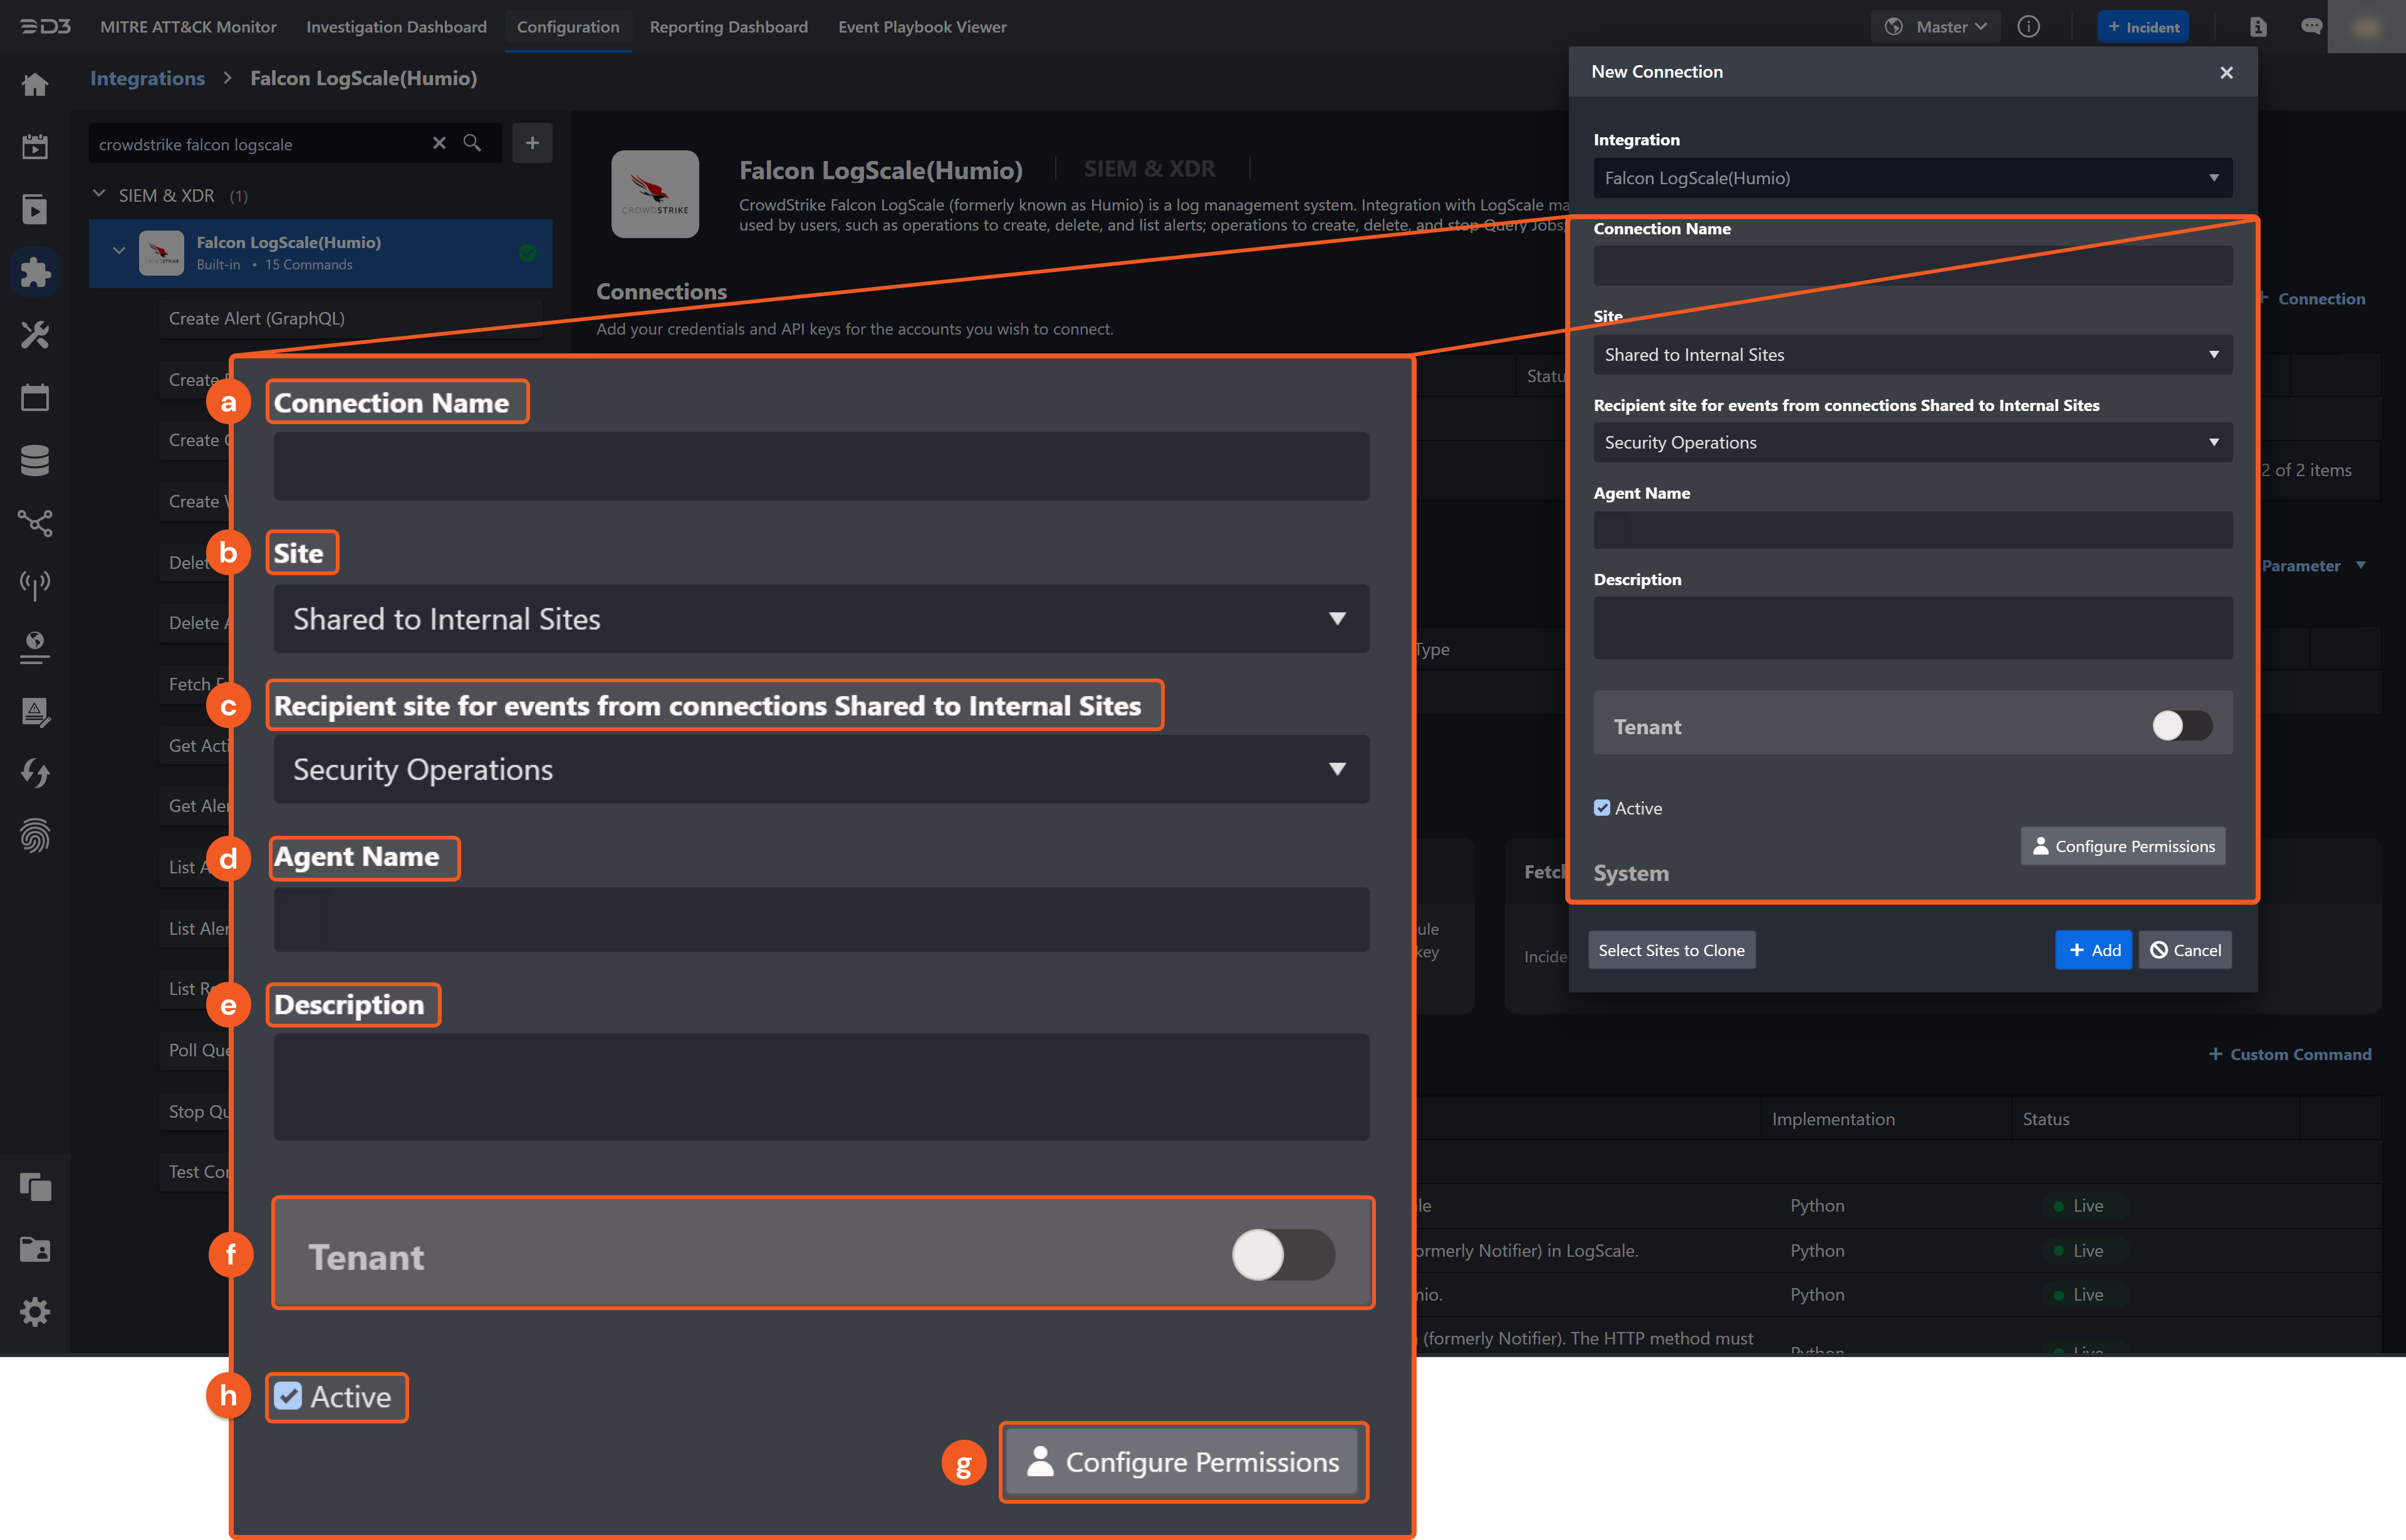
Connection Name: The desired name for the connection.
Site: The site on which to use the integration connection. Use the drop-down menu to select the site. The Share to Internal Sites option enables all internal sites to use the connection. Selecting a specific site will only enable that site to use the connection.
Recipient site for events from connections Shared to Internal Sites: This field is displayed when Share to Internal Sites is selected for the Site field, allowing selection of the internal site for deploying the integration connection.
Agent Name (Optional): The proxy agent required to build the connection. Use the dropdown menu to select the proxy agent from a list of previously configured proxy agents.
Description (Optional): The description for the connection.
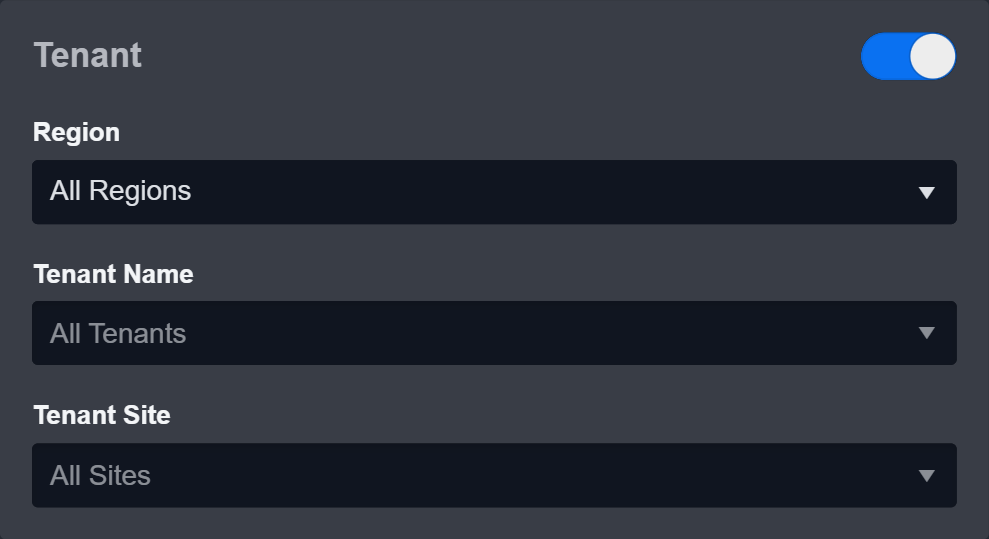
Tenant (Optional): When configuring the connection from a master tenant site, users can choose the specific tenant sites with which to share the connection. Once this setting is enabled, users can filter and select the desired tenant sites from the dropdowns to share the connection.
Configure User Permissions: Defines which users have access to the connection.
Active: The checkbox that enables the connection to be used when selected.
System: This section contains the parameters defined specifically for the integration. These parameters must be configured to create the integration connection.
.png?inst-v=b3e22cc7-f647-4753-ac50-35b16f082a1a)
Input the Server URL. The default value is https://cloud.us.humio.com.
Copy the API token from the LogScale platform. Refer to step 3c of Configuring Falcon LogScale(Humio) to Work with D3 SOAR.
Input the API Version. The default value is v1.
Enable Password Vault: An optional feature that allows users to take the stored credentials from their own password vault. Refer to the password vault connection guide if needed.
Connection Health Check: Periodically checks the connection status by scheduling the Test Connection command at the specified interval (in minutes). Available only for active connections, this feature also allows configuring email notifications for failed attempts.
Test the connection.
Click on the Test Connection button to verify credentials and connectivity. A success alert displays Passed with a green checkmark. If the connection fails, review the parameters and retry.
Click OK to close the alert window.
Click + Add to create and add the configured connection.
Commands
Falcon LogScale(Humio) includes the following executable commands for users to set up schedules or create playbook workflows. With the Test Command, users can execute these commands independently for playbook troubleshooting.
Integration API Note
For more information about the Falcon LogScale(Humio) API, refer to the Falcon LogScale(Humio) API reference.
READER NOTE
Certain permissions are required for each command. Refer to the Permission Requirements and Configuring LogScale to Work with D3 SOAR sections for details.
Note for Time-related parameters
The input format of time-related parameters may vary based on user account settings, which may cause the sample data in commands to differ from what is displayed. To adjust the time format, follow these steps:
Navigate to Configuration > Application Settings. Select Date/Time Format.
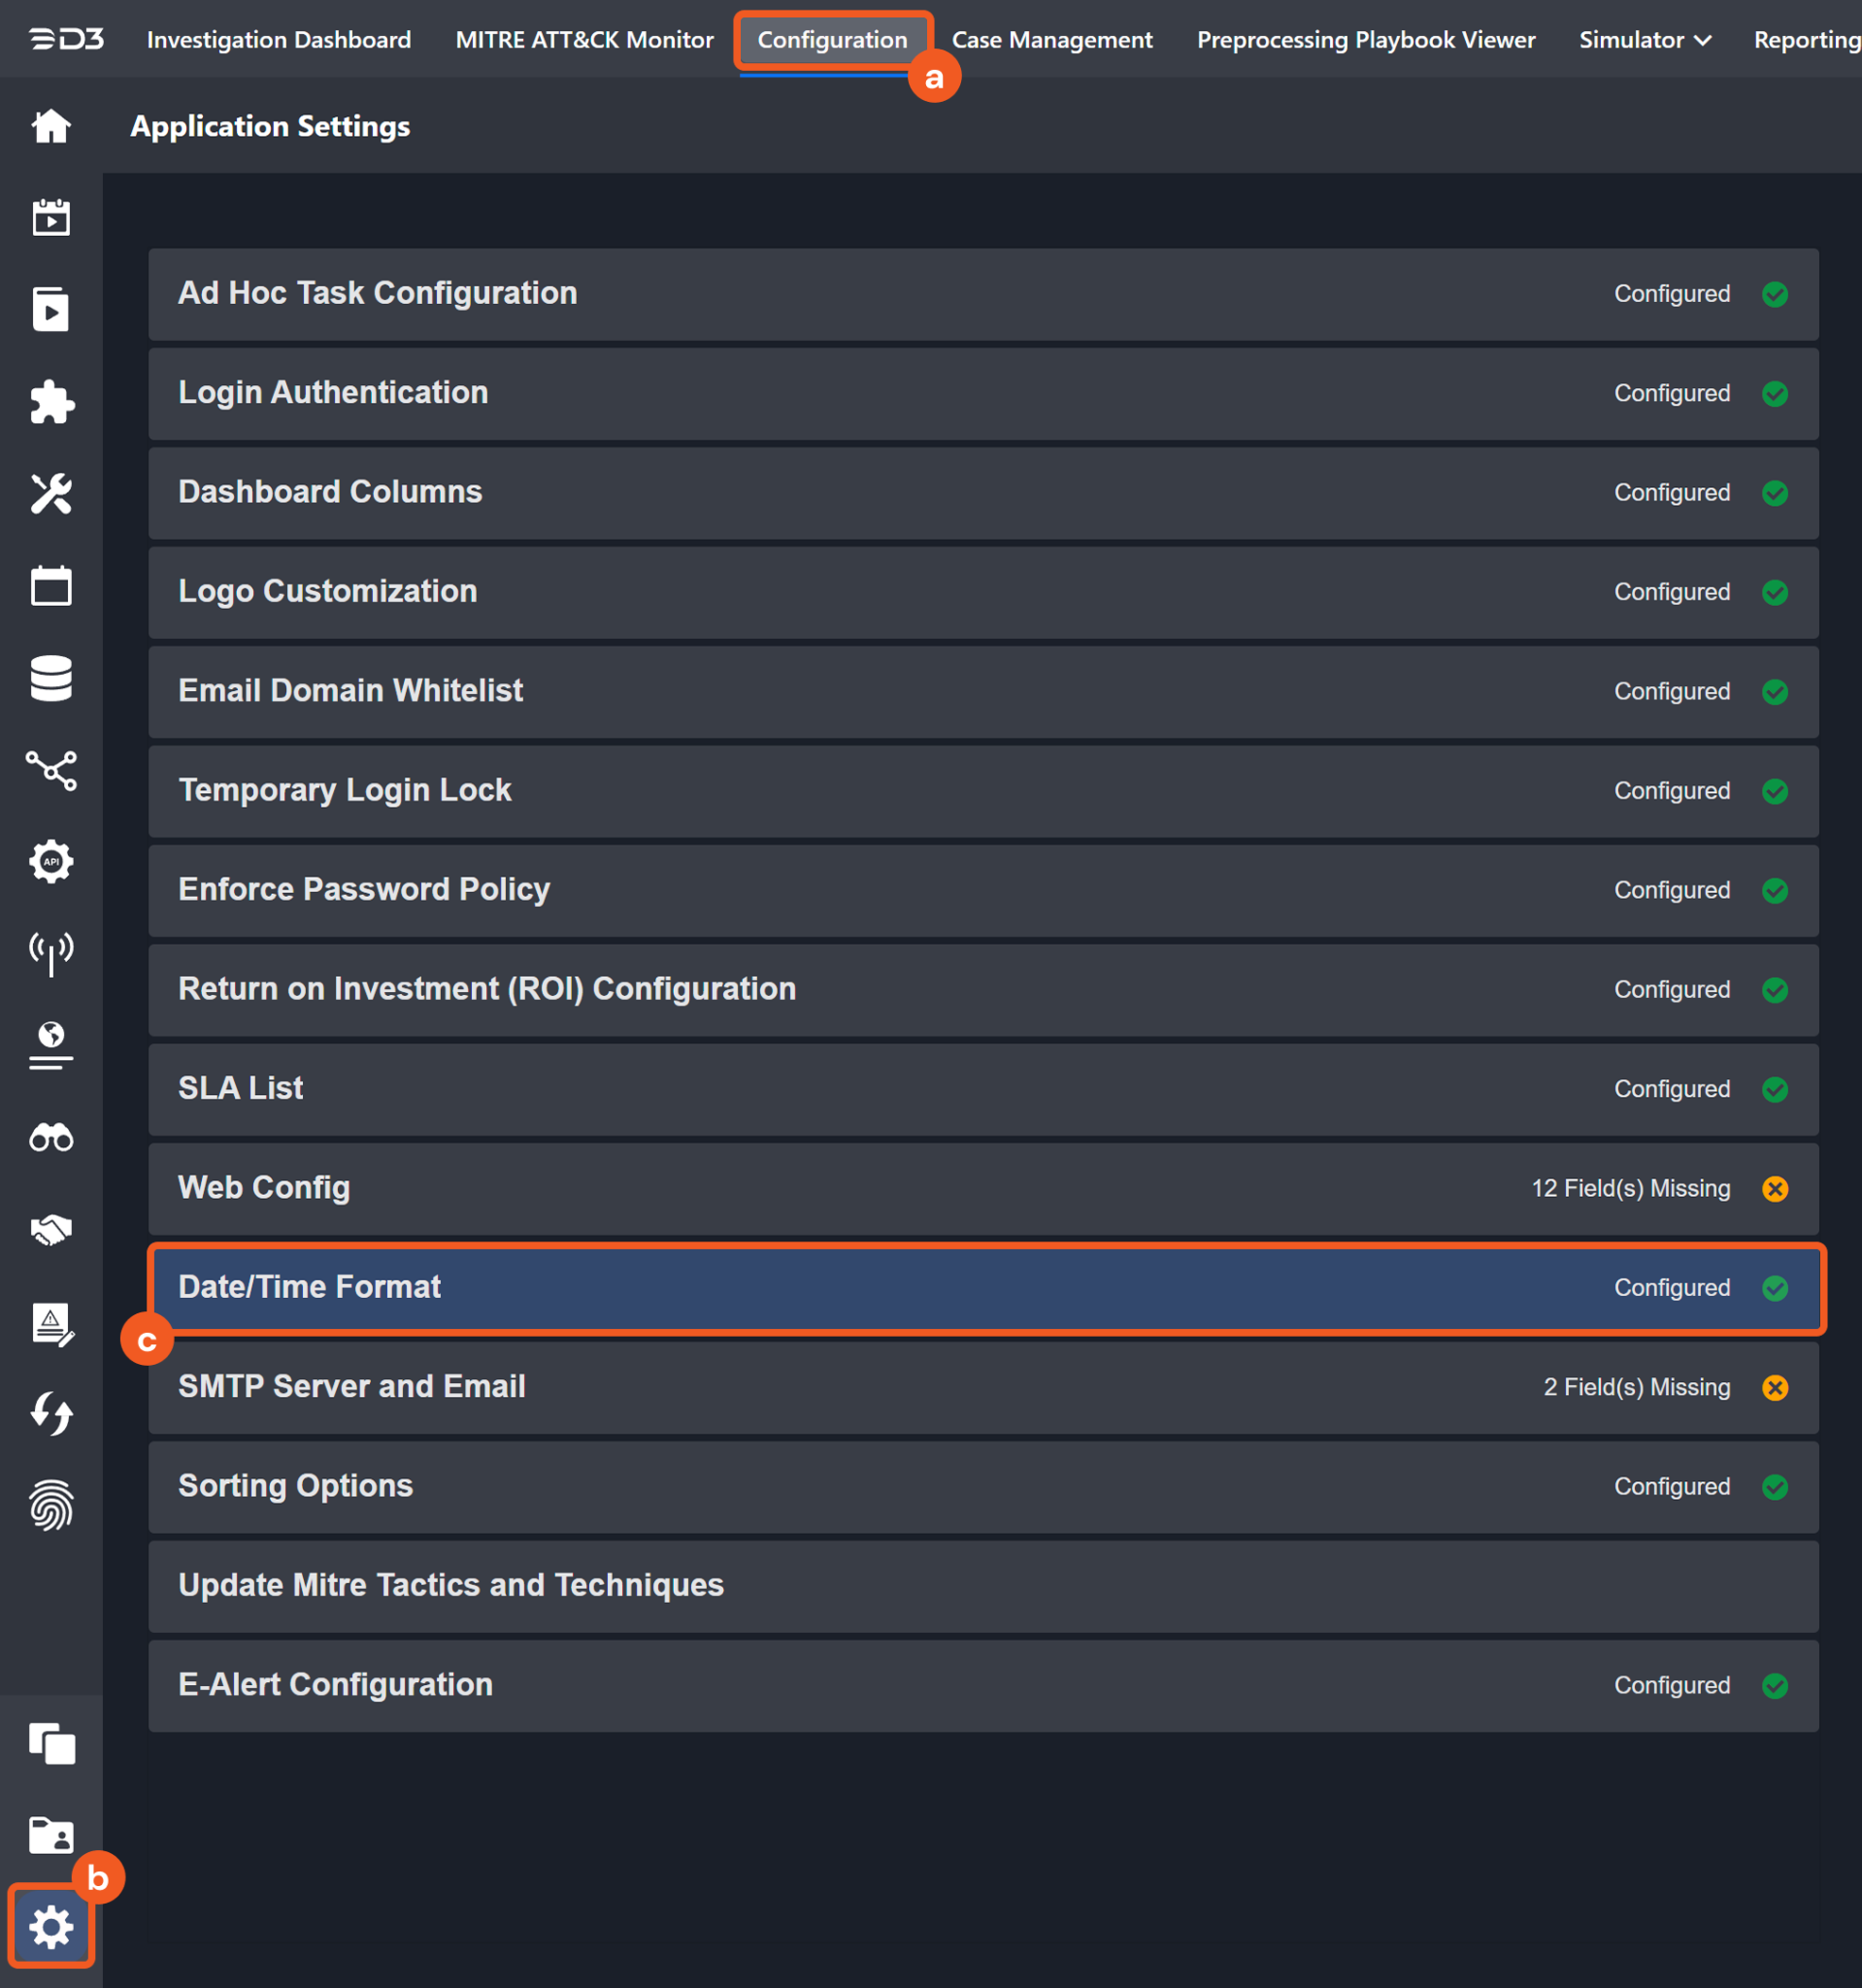
Choose the desired date and time format, then click on the Save button.
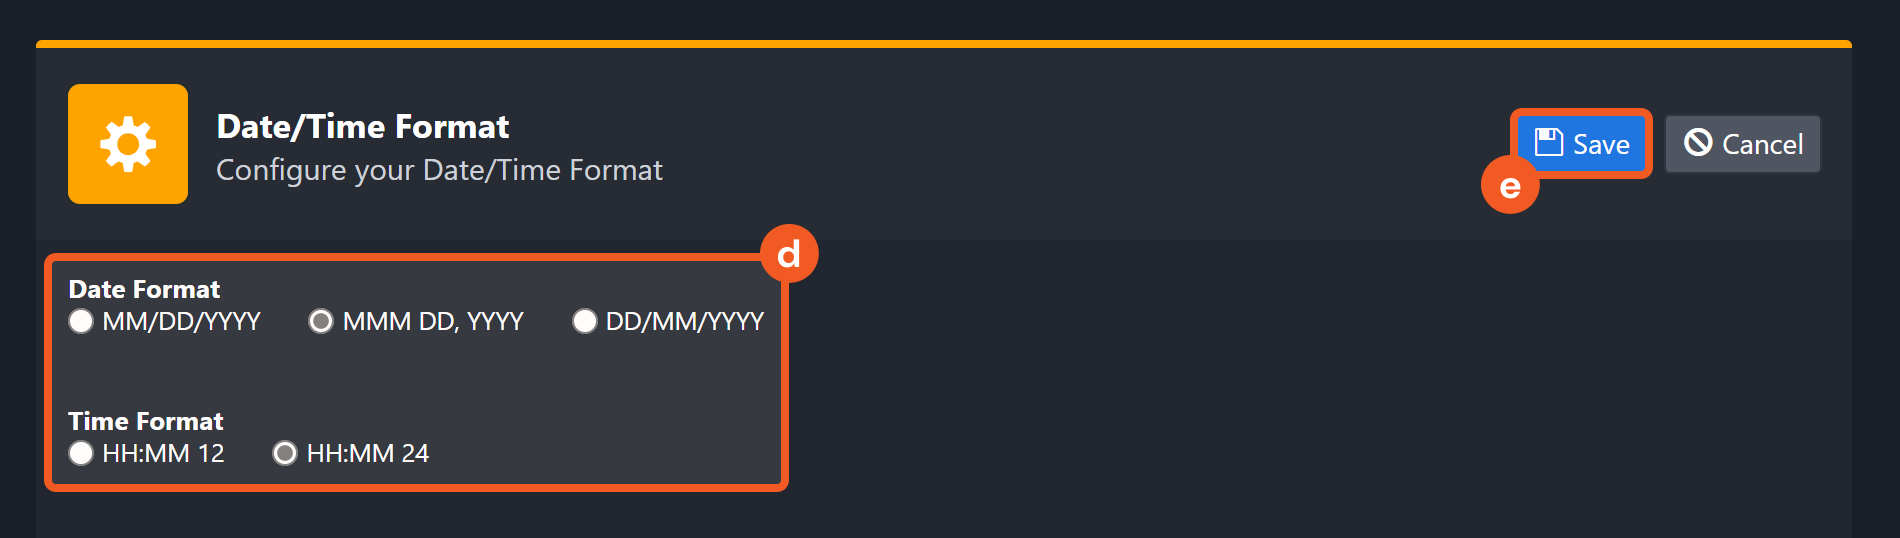
The selected time format will now be visible when configuring Date/Time command input parameters.
Create Alert (GraphQL)
Creates an alert in LogScale.
READER NOTE
Repository Or View Name and Actions (Notifiers) are required parameters to run this command.
Run the List Repository and View Names command to obtain the Repository Or View Name. Repository or View names can be found in the raw data at the path $.data.searchDomains[*].name.
Run the List Actions command to obtain the Actions (Notifiers). Actions (Notifiers) can be found in the raw data at the path $.data.searchDomain.actions[*].id.
Input
Input Parameter | Required/Optional | Description | Example |
Repository Or View Name | Required | The name of the repository or view for which to create alerts. Repository Or View Name can be obtained using the List Repository and View Names command. | sandbox |
Alert Name | Required | The name of the alert to be created. | TestAlert001 |
Query String | Required | Use a query string to refine the search condition. For example, to search for events containing "office" in the URL field, use "url=*office*." Refer to Query Filters | LogScale for details about using query filters. | url=*posts* |
Query Start | Required | The start time of the alert. The format is a number followed by the units: hours (h), minutes (m), and/or days (d). For example, 1h means 1 hour ago. 2m means 2 minutes ago. 3d means 3 days ago. | 24h |
Actions (Notifiers) | Required | The ID(s) of action(s). Action IDs can be obtained using the List Actions command. |
JSON
|
Throttle Time Millis | Optional | The minimum amount of time in milliseconds taken between invoking actions. By default, the value is 600000. | 100000 |
Description | Optional | A description for the alert. | Test Humio alert919a |
Labels | Optional | The values of the labels applied to the alert. |
JSON
|
Output
To view the sample output data for all commands, refer to this article.
Error Handling
If the Return Data displays Failed, an Error tab will appear in the Test Result window.
The error tab contains the details responded from D3 SOAR or third-party API calls, including Failure Indicator, Status Code, and Message. This can help locate the root cause of a command failure.
Parts in Error | Description | Example |
Failure Indicator | Indicates the command failure that happened at a specific input and/or API call. | Create Alert (GraphQL) failed. |
Status Code | The response code issued by the third-party API server or the D3 SOAR system that can be used to locate the corresponding error category. For example, if the returned status code is 401, the selected connection is unauthorized to run the command. The user or system support would need to check the permission setting in the Falcon LogScale(Humio) portal. Refer to the HTTP Status Code Registry for details. | Status Code: 400. |
Message | The raw data or captured key error message from the integration API server about the API request failure. | Message: Bad Request. |
Error Sample Data Create Alert (GraphQL) failed. Status Code: 400. Message: Bad Request. |
Create Email Action (GraphQL)
Creates an email action (formerly Notifier) in LogScale.
READER NOTE
Repository Or View Name is a required parameter to run this command.
Run the List Repository and View Names command to obtain the Repository Or View Name. Repository or View names can be found in the raw data at the path $.data.searchDomains[*].name.
Input
Input Parameter | Required/Optional | Description | Example |
Repository or View Name | Required | The name of the repository or view for which to create Email Actions. Repository or view name can be obtained using the List Repository and View Names command. | sandbox |
Action Name | Required | The name of the email action to be created. | Test Email Action 011 |
Recipients | Required | The email address(es) of the recipient(s). |
JSON
|
Subject Template | Optional | The template used for the email subject. To use variables in the subject, refer to New Webhook Action | Falcon LogScale(Humio). By default, the value is LogScale Alert Email. | LogScale Alert Email |
Body Template | Optional | The template used for the email body. To use variables in the body, refer to New Webhook Action | Falcon LogScale(Humio). See the example for the default value. |
JSON
|
Use Proxy | Optional | Whether the action should use a configured proxy to make web requests. By default, the value is False. | False |
Attach CSV | Optional | Whether the result should be attached as a CSV file. By default, the value is False. | True |
Output
To view the sample output data for all commands, refer to this article.
Error Handling
If the Return Data displays Failed, an Error tab will appear in the Test Result window.
The error tab contains the details responded from D3 SOAR or third-party API calls, including Failure Indicator, Status Code, and Message. This can help locate the root cause of a command failure.
Parts in Error | Description | Example |
Failure Indicator | Indicates the command failure that happened at a specific input and/or API call. | Create Email Action (GraphQL) failed. |
Status Code | The response code issued by the third-party API server or the D3 SOAR system that can be used to locate the corresponding error category. For example, if the returned status code is 401, the selected connection is unauthorized to run the command. The user or system support would need to check the permission setting in the Falcon LogScale(Humio) portal. Refer to the HTTP Status Code Registry for details. | Status Code: 400. |
Message | The raw data or captured key error message from the integration API server about the API request failure. | Message: Bad Request. |
Error Sample Data Create Email Action (GraphQL) failed. Status Code: 400. Message: Bad Request. |
Create Query Job
Creates a Query Job for LogScale.
READER NOTE
Repository Name is a required parameter to run this command.
Run the List Repository and View Names command to obtain the Repository Name. Repository names can be found in the raw data at the path $.data.searchDomains[*].name.
Input
Input Parameter | Required/Optional | Description | Example |
Start Time | Required | The start time of the Query Job (in UTC). | 2021-05-26 03:47:49.000 |
End Time | Required | The end time of the Query Job (in UTC). | 2021-05-27 03:47:49.000 |
Query String | Optional | Use a query string to refine the search condition. For example, to search for events containing "office" in the URL field, use "url=*office*." Refer to Query Filters | Falcon LogScale(Humio) for details about using query filters. | url=*office* |
Repository Name | Required | The name of the repository to be used. Repository names can be obtained using the List Repository and View Names command. | sandbox |
Output
To view the sample output data for all commands, refer to this article.
Error Handling
If the Return Data displays Failed, an Error tab will appear in the Test Result window.
The error tab contains the details responded from D3 SOAR or third-party API calls, including Failure Indicator, Status Code, and Message. This can help locate the root cause of a command failure.
Parts in Error | Description | Example |
Failure Indicator | Indicates the command failure that happened at a specific input and/or API call. | Create Query Job failed. |
Status Code | The response code issued by the third-party API server or the D3 SOAR system that can be used to locate the corresponding error category. For example, if the returned status code is 401, the selected connection is unauthorized to run the command. The user or system support would need to check the permission setting in the Falcon LogScale(Humio) portal. Refer to the HTTP Status Code Registry for details. | Status Code: 400. |
Message | The raw data or captured key error message from the integration API server about the API request failure. | Message: Bad Request. |
Error Sample Data Create Query Job failed. Status Code: 400. Message: Bad Request. |
Create Webhook Action (GraphQL)
Creates a webhook action (formerly Notifier). The HTTP method must be POST.
READER NOTE
Repository Or View Name is a required parameter to run this command.
Run the List Repository and View Names command to obtain the Repository Or View Name. Repository or View names can be found in the raw data at the path $.data.searchDomains[*].name.
Input
Input Parameter | Required/Optional | Description | Example |
Repository or View Name | Required | The name of the repository or view for which to create a Webhook Action. Repository or view name can be obtained using the List Repository and View Names command. | sandbox |
Action Name | Required | The name of the action to be created. | Test Webhook Action919 |
URL | Required | The URL to be used in the webhook. | ***** |
Headers | Optional | HTTP headers to add to the webhook action. | "Content-Type : application/json , AuthKey : 38pv*****ZVgQ" |
Ignore SSL | Optional | Whether or not to ignore the SSL. By default, the value is false. | False |
Body Template | Optional | The body template to be used in the webhook action. To find all available variables, refer to New Webhook Action | Falcon LogScale(Humio). See the example for the default value. |
JSON
|
Use Proxy | Optional | Whether the action should use a configured proxy to make web requests. By default, the value is False. | False |
Output
To view the sample output data for all commands, refer to this article.
Error Handling
If the Return Data displays Failed, an Error tab will appear in the Test Result window.
The error tab contains the details responded from D3 SOAR or third-party API calls, including Failure Indicator, Status Code, and Message. This can help locate the root cause of a command failure.
Parts in Error | Description | Example |
Failure Indicator | Indicates the command failure that happened at a specific input and/or API call. | Create Webhook Action (GraphQL) failed. |
Status Code | The response code issued by the third-party API server or the D3 SOAR system that can be used to locate the corresponding error category. For example, if the returned status code is 401, the selected connection is unauthorized to run the command. The user or system support would need to check the permission setting in the Falcon LogScale(Humio) portal. Refer to the HTTP Status Code Registry for details. | Status Code: 400. |
Message | The raw data or captured key error message from the integration API server about the API request failure. | Message: Bad Request. |
Error Sample Data Create Webhook Action (GraphQL) failed. Status Code: 400. Message: Bad Request. |
Delete Actions (GraphQL)
Deletes actions in LogScale.
READER NOTE
Repository Or View Name and Action IDs are required parameters to run this command.
Run the List Repository and View Names command to obtain the Repository Or View Name. Repository or View names can be found in the raw data at the path $.data.searchDomains[*].name.
Run the List Actions command to obtain the Actions IDs. Action IDs can be found in the raw data at the path $.data.searchDomain.actions[*].id.
Input
Input Parameter | Required/Optional | Description | Example |
Repository or View Name | Required | The name of the repository or view from which to delete actions. Repository or view name can be obtained using the List Repository and View Names command. | sandbox |
Action IDs | Required | The ID(s) of the action(s) to be deleted. Action IDs can be obtained using the List Actions command. |
JSON
|
Output
To view the sample output data for all commands, refer to this article.
Error Handling
If the Return Data displays Partially Successful or Failed, an Error tab will appear in the Test Result window.
The error tab contains the details responded from D3 SOAR or third-party API calls, including Failure Indicator, Status Code, and Message. This can help locate the root cause of a command failure.
Parts in Error | Description | Example |
Failure Indicator | Indicates the command failure that happened at a specific input and/or API call. | Delete Actions (GraphQL) failed. |
Status Code | The response code issued by the third-party API server or the D3 SOAR system that can be used to locate the corresponding error category. For example, if the returned status code is 401, the selected connection is unauthorized to run the command. The user or system support would need to check the permission setting in the Falcon LogScale(Humio) portal. Refer to the HTTP Status Code Registry for details. | Status Code: 400. |
Message | The raw data or captured key error message from the integration API server about the API request failure. | Message: Bad Request. |
Error Sample Data Delete Actions (GraphQL) failed. Status Code: 400. Message: Bad Request. |
Delete Alerts (GraphQL)
Deletes alerts in LogScale.
READER NOTE
Repository Or View Name and Alert IDs are required parameters to run this command.
Run the List Repository and View Names command to obtain the Repository Or View Name. Repository Or View Names can be found in the raw data at the path $.data.searchDomains[*].name.
Run the List Alerts command to obtain the Alert IDs. Alert IDs can be found in the raw data at the path $.Results[*].data.searchDomain.alert.id.
Input
Input Parameter | Required/Optional | Description | Example |
Repository Or View Name | Required | The name of the repository or view from which to delete alerts. Repository or view name can be obtained using the List Repository and View Names command. | sandbox |
Alert IDs | Required | The ID(s) of the alert(s) to be deleted. Alert IDs can be obtained using the List Alerts command. |
JSON
|
Output
To view the sample output data for all commands, refer to this article.
Error Handling
If the Return Data displays Partially Successful or Failed, an Error tab will appear in the Test Result window.
The error tab contains the details responded from D3 SOAR or third-party API calls, including Failure Indicator, Status Code, and Message. This can help locate the root cause of a command failure.
Parts in Error | Description | Example |
Failure Indicator | Indicates the command failure that happened at a specific input and/or API call. | Delete Alerts (GraphQL) failed. |
Status Code | The response code issued by the third-party API server or the D3 SOAR system that can be used to locate the corresponding error category. For example, if the returned status code is 401, the selected connection is unauthorized to run the command. The user or system support would need to check the permission setting in the Falcon LogScale(Humio) portal. Refer to the HTTP Status Code Registry for details. | Status Code: 400. |
Message | The raw data or captured key error message from the integration API server about the API request failure. | Message: Bad Request. |
Error Sample Data Delete Alerts (GraphQL) failed. Status Code: 400. Message: Bad Request. |
Fetch Event
Retrieves events by the specified search condition and time range.
READER NOTE
Repository Name is a required parameter to run this command.
Run the List Repository and View Names command to obtain the Repository Name. Repository names can be found in the raw data at the path $.data.searchDomains[*].name.
Input
Input Parameter | Required/Optional | Description | Example |
Start Time | Required | The start time of the time range (in UTC). | 2021-05-25 03:47:49.000 |
End Time | Required | The end time of the time range (in UTC). | 2021-05-26 03:47:49.000 |
Number of Event(s) Fetched | Optional | The maximum number of rules to return. By default, the value is 50 | 50 |
Search Condition | Optional | Use a query string to refine the search condition. For example, to search for events containing "office" in the URL field, use "url=*office*." Refer to Query Filters | Falcon LogScale(Humio) for details about using query filters. | url=*office* |
Repository Name | Required | The name of the repository to be used. Repository names can be obtained using the List Repository and View Names command. | sandbox |
Output
To view the sample output data for all commands, refer to this article.
Fetch Event Field Mapping
See Field Mappings.
The Falcon LogScale(Humio) system integration includes pre-configured field mappings for the default event source.
The Default Event Source is the default system-provided set of field mappings applied when the fetch event command is executed. It includes a Main Event JSON Path, which is the JSONPath expression that points to the base array of event objects. The source field path continues from this array to locate the required data.
The Main Event JSON Path can be viewed by clicking on the Edit Event Source button.
.png?inst-v=b3e22cc7-f647-4753-ac50-35b16f082a1a)
Main Event JSON Path: $.
The root array contains the event objects. Within each event object, the key @id denotes the Unique Event Key field. As such, the full JSONPath expression to extract the Unique Event Key is $.@id.
The pre-configured field mappings are detailed below:
Field Name | Source Field |
Unique Event Key | .@id |
Event Type | .#type |
Raw event data | .@rawstring |
Original source | .#repo |
Start Time | .["@timeStamp"] |
URL | .url |
Time Zone | .["@timezone"] |
Client | .client |
Error Handling
If the Return Data displays Failed, an Error tab will appear in the Test Result window.
The error tab contains the details responded from D3 SOAR or third-party API calls, including Failure Indicator, Status Code, and Message. This can help locate the root cause of a command failure.
Parts in Error | Description | Example |
Failure Indicator | Indicates the command failure that happened at a specific input and/or API call. | Fetch Event failed. |
Status Code | The response code issued by the third-party API server or the D3 SOAR system that can be used to locate the corresponding error category. For example, if the returned status code is 401, the selected connection is unauthorized to run the command. The user or system support would need to check the permission setting in the Falcon LogScale(Humio) portal. Refer to the HTTP Status Code Registry for details. | Status Code: 400. |
Message | The raw data or captured key error message from the integration API server about the API request failure. | Message: Bad Request. |
Error Sample Data Fetch Event failed. Status Code: 400. Message: Bad Request. |
Get Actions By IDs (GraphQL)
Retrieves action(s) by Action ID(s) from LogScale.
READER NOTE
Repository Name and Action IDs are required parameters to run this command.
Run the List Repository and View Names command to obtain the Repository Name. Repository Names can be found in the raw data at the path $.data.searchDomains[*].name.
Run the List Actions command to obtain the Action IDs. Action IDs can be found in the raw data at the path $.data.searchDomain.actions[*].id.
Input
Input Parameter | Required/Optional | Description | Example |
Repository Name | Required | The name of the repository or view from which to retrieve actions. Repository or view name can be obtained using the List Repository and View Names command. | sandbox |
Action IDs | Required | The ID(s) of the action(s) to retrieve. Action IDs can be obtained using the List Actions command. |
JSON
|
Output
To view the sample output data for all commands, refer to this article.
Error Handling
If the Return Data displays Partially Successful or Failed, an Error tab will appear in the Test Result window.
The error tab contains the details responded from D3 SOAR or third-party API calls, including Failure Indicator, Status Code, and Message. This can help locate the root cause of a command failure.
Parts in Error | Description | Example |
Failure Indicator | Indicates the command failure that happened at a specific input and/or API call. | Get Actions By IDs (GraphQL) failed. |
Status Code | The response code issued by the third-party API server or the D3 SOAR system that can be used to locate the corresponding error category. For example, if the returned status code is 401, the selected connection is unauthorized to run the command. The user or system support would need to check the permission setting in the Falcon LogScale(Humio) portal. Refer to the HTTP Status Code Registry for details. | Status Code: 400. |
Message | The raw data or captured key error message from the integration API server about the API request failure. | Message: Bad Request. |
Error Sample Data Get Actions By IDs (GraphQL) failed. Status Code: 400. Message: Bad Request. |
Get Alerts By IDs (GraphQL)
Retrieves alert(s) by Alert ID(s) from LogScale.
READER NOTE
Repository Name and Alert IDs are required parameters to run this command.
Run the List Repository and View Names command to obtain the Repository Name. Repository names can be found in the raw data at the path $.data.searchDomains[*].name.
Run the List Alerts command to obtain Alert IDs. Alert IDs can be found in the raw data at the path $.data.searchDomain.alerts[*].id.
Input
Input Parameter | Required/Optional | Description | Example |
Repository Name | Required | The name of the repository or view from which to retrieve alerts. Repository names can be obtained using the List Repository and View Names command. | sandbox |
Alert IDs | Required | The ID(s) of the alert(s) to be retrieved. Alert IDs can be obtained using the List Alerts command. |
JSON
|
Output
To view the sample output data for all commands, refer to this article.
Error Handling
If the Return Data displays Partially Successful or Failed, an Error tab will appear in the Test Result window.
The error tab contains the details responded from D3 SOAR or third-party API calls, including Failure Indicator, Status Code, and Message. This can help locate the root cause of a command failure.
Parts in Error | Description | Example |
Failure Indicator | Indicates the command failure that happened at a specific input and/or API call. | Get Alerts By IDs (GraphQL) failed. |
Status Code | The response code issued by the third-party API server or the D3 SOAR system that can be used to locate the corresponding error category. For example, if the returned status code is 401, the selected connection is unauthorized to run the command. The user or system support would need to check the permission setting in the Falcon LogScale(Humio) portal. Refer to the HTTP Status Code Registry for details. | Status Code: 400. |
Message | The raw data or captured key error message from the integration API server about the API request failure. | Message: Bad Request. |
Error Sample Data Get Alerts By IDs (GraphQL) failed. Status Code: 400. Message: Bad Request. |
List Actions (GraphQL)
Lists actions (notifiers) from a specified repository or view of LogScale.
READER NOTE
Repository Name is a required parameter to run this command.
Run the List Repository and View Names command to obtain the Repository Name. Repository names can be found in the raw data at the path $.data.searchDomains[*].name.
Input
Input Parameter | Required/Optional | Description | Example |
Repository Name | Required | The name of the repository or view from which to list actions. Repository or view names can be obtained using the List Repository and View Names command. | sandbox |
Output
To view the sample output data for all commands, refer to this article.
Error Handling
If the Return Data displays Failed, an Error tab will appear in the Test Result window.
The error tab contains the details responded from D3 SOAR or third-party API calls, including Failure Indicator, Status Code, and Message. This can help locate the root cause of a command failure.
Parts in Error | Description | Example |
Failure Indicator | Indicates the command failure that happened at a specific input and/or API call. | List Actions (GraphQL) failed. |
Status Code | The response code issued by the third-party API server or the D3 SOAR system that can be used to locate the corresponding error category. For example, if the returned status code is 401, the selected connection is unauthorized to run the command. The user or system support would need to check the permission setting in the Falcon LogScale(Humio) portal. Refer to the HTTP Status Code Registry for details. | Status Code: 400. |
Message | The raw data or captured key error message from the integration API server about the API request failure. | Message: Bad Request. |
Error Sample Data List Actions (GraphQL) failed. Status Code: 400. Message: Bad Request. |
List Alerts (GraphQL)
Lists alerts in a specified repository of LogScale.
READER NOTE
Repository Name is a required parameter to run this command.
Run the List Repository and View Names command to obtain the Repository Name. Repository names can be found in the raw data at the path $.data.searchDomains[*].name.
Input
Input Parameter | Required/Optional | Description | Example |
Repository Name | Required | The name of the repository from which to list alerts. Repository names can be obtained using the List Repository and View Names command. | sandbox |
Output
To view the sample output data for all commands, refer to this article.
Error Handling
If the Return Data displays Failed, an Error tab will appear in the Test Result window.
The error tab contains the details responded from D3 SOAR or third-party API calls, including Failure Indicator, Status Code, and Message. This can help locate the root cause of a command failure.
Parts in Error | Description | Example |
Failure Indicator | Indicates the command failure that happened at a specific input and/or API call. | List Alerts (GraphQL) failed. |
Status Code | The response code issued by the third-party API server or the D3 SOAR system that can be used to locate the corresponding error category. For example, if the returned status code is 401, the selected connection is unauthorized to run the command. The user or system support would need to check the permission setting in the Falcon LogScale(Humio) portal. Refer to the HTTP Status Code Registry for details. | Status Code: 400. |
Message | The raw data or captured key error message from the integration API server about the API request failure. | Message: Bad Request. |
Error Sample Data List Alerts (GraphQL) failed. Status Code: 400. Message: Bad Request. |
List Repository and View Names
Lists the names of repositories and views from LogScale.
Input
N/A
Output
To view the sample output data for all commands, refer to this article.
Error Handling
If the Return Data displays Failed, an Error tab will appear in the Test Result window.
The error tab contains the details responded from D3 SOAR or third-party API calls, including Failure Indicator, Status Code, and Message. This can help locate the root cause of a command failure.
Parts in Error | Description | Example |
Failure Indicator | Indicates the command failure that happened at a specific input and/or API call. | List Repository and View Names failed. |
Status Code | The response code issued by the third-party API server or the D3 SOAR system that can be used to locate the corresponding error category. For example, if the returned status code is 401, the selected connection is unauthorized to run the command. The user or system support would need to check the permission setting in the Falcon LogScale(Humio) portal. Refer to the HTTP Status Code Registry for details. | Status Code: 400. |
Message | The raw data or captured key error message from the integration API server about the API request failure. | Message: Bad Request. |
Error Sample Data List Repository and View Names failed. Status Code: 400. Message: Bad Request. |
Poll Query Job
Retrieves the result of the Query Job.
READER NOTE
Job Id and Repository Name are required parameters to run this command.
Run the Create Query Job command to obtain the Job Id. Job Ids can be found in the raw data at the path $.id.
Run the List Repository and View Names command to obtain the Repository Name. Repository names can be found in the raw data at the path $.data.searchDomains[*].name.
Input
Input Parameter | Required/Optional | Description | Example |
Job Id | Required | The ID of the Query Job to be polled. Job Ids can be obtained using the Create Query Job command. | P7-3*****LJu4 |
Repository Name | Required | The name of the repository to be used. Repository names can be obtained using the List Repository and View Names command. | sandbox |
Output
To view the sample output data for all commands, refer to this article.
Error Handling
If the Return Data displays Failed, an Error tab will appear in the Test Result window.
The error tab contains the details responded from D3 SOAR or third-party API calls, including Failure Indicator, Status Code, and Message. This can help locate the root cause of a command failure.
Parts in Error | Description | Example |
Failure Indicator | Indicates the command failure that happened at a specific input and/or API call. | Poll Query Job failed. |
Status Code | The response code issued by the third-party API server or the D3 SOAR system that can be used to locate the corresponding error category. For example, if the returned status code is 401, the selected connection is unauthorized to run the command. The user or system support would need to check the permission setting in the Falcon LogScale(Humio) portal. Refer to the HTTP Status Code Registry for details. | Status Code: 400. |
Message | The raw data or captured key error message from the integration API server about the API request failure. | Message: Bad Request. |
Error Sample Data Poll Query Job failed. Status Code: 400. Message: Bad Request. |
Stop Query Job
Stops a running Query Job.
READER NOTE
Job Id and Repository Name are required parameters to run this command.
Run the Create Query Job command to obtain the Job Id. Job Id can be found in the raw data at the path $.id.
Run the List Repository and View Names command to obtain the Repository Name. Repository names can be found in the raw data at the path $.data.searchDomains[*].name.
Input
Input Parameter | Required/Optional | Description | Example |
Job Ids | Required | The ID of the Query Job to be stopped. Job Ids can be obtained using the Create Query Job command. |
JSON
|
Repository Name | Required | The name of the repository to be used. Repository names can be obtained using the List Repository and View Names command. | sandbox |
Output
To view the sample output data for all commands, refer to this article.
Error Handling
If the Return Data displays Failed, an Error tab will appear in the Test Result window.
The error tab contains the details responded from D3 SOAR or third-party API calls, including Failure Indicator, Status Code, and Message. This can help locate the root cause of a command failure.
Parts in Error | Description | Example |
Failure Indicator | Indicates the command failure that happened at a specific input and/or API call. | Stop Query Job failed. |
Status Code | The response code issued by the third-party API server or the D3 SOAR system that can be used to locate the corresponding error category. For example, if the returned status code is 401, the selected connection is unauthorized to run the command. The user or system support would need to check the permission setting in the Falcon LogScale(Humio) portal. Refer to the HTTP Status Code Registry for details. | Status Code: 400. |
Message | The raw data or captured key error message from the integration API server about the API request failure. | Message: Bad Request. |
Error Sample Data Stop Query Job failed. Status Code: 400. Message: Bad Request. |
Test Connection
Performs a health check on an integration connection. You can schedule a periodic health check by selecting Connection Health Check when editing an integration connection.
Input
N/A
Output
Output Type | Description | Return Data Type |
Return Data | Indicates one of the possible command execution states: Successful or Failed. The Failed state can be triggered by any of the following errors:
More details about an error can be viewed in the Error tab. | String |
Error Handling
If the Return Data displays Failed, an Error tab will appear in the Test Result window.
The error tab contains the details responded from D3 SOAR or third-party API calls, including Failure Indicator, Status Code, and Message. This can help locate the root cause of a command failure.
Parts in Error | Description | Example |
Failure Indicator | Indicates the command failure that happened at a specific input and/or API call. | Test Connection failed. Failed to check the connector. |
Status Code | The response code issued by the third-party API server or the D3 SOAR system that can be used to locate the corresponding error category. For example, if the returned status code is 401, the selected connection is unauthorized to run the command. The user or system support would need to check the permission setting in the Falcon LogScale(Humio) portal. Refer to the HTTP Status Code Registry for details. | Status Code: 400. |
Message | The raw data or captured key error message from the integration API server about the API request failure. | Message: Bad Request. |
Error Sample Data Test Connection failed. Failed to check the connector. Status Code: 400. Message: Bad Request. |