
Cortex XSIAM
LAST UPDATED: NOVEMBER 10, 2025
Overview
Cortex XSIAM (Extended Security Intelligence and Automation Management) is a comprehensive security operations platform designed to automate, scale, and enhance the processes of a security operations center (SOC). It consolidates data ingestion, threat detection, incident response, and automation within a single, unified platform.
D3 SOAR is providing REST operations to function with Cortex XSIAM.
Cortex XSIAM is available for use in:
Connection
To connect to Cortex XSIAM from D3 SOAR, follow this part to collect the required information below:
Parameter | Description | Example |
FQDN | The fully qualified domain name associated with each tenant. When an API key and key ID are generated, an individual FQDN is assigned. | sample.xdr.us.paloaltonetworks.com |
Key ID | The unique token used to authenticate the API key. | 2 |
API Key | The API key for authenticating API calls. Depending on the desired security level, two types of API Keys can be generated: Advanced or Standard. | fnll*****UmWy |
Key Type | The type of API Key generated. Depending on the desired security level, two types of API Keys can be generated: Advanced or Standard. | Advanced |
Configuring D3 SOAR to Work with Cortex XSIAM
Refer to the official Cortex XSIAM documentation for instructions on generating an API key:
Get Started with Cortex XSIAM APIs
Configuring D3 SOAR to Work with Cortex XSIAM
Log in to D3 SOAR.
Find the Cortex XSIAM integration.
-20250417-234558.png?inst-v=a9107af0-b04c-4e31-bb5a-938372783868)
Navigate to Configuration on the top header menu.
Click on the Integration icon on the left sidebar.
Type Cortex XSIAM in the search box to find the integration, then click it to select it.
Click on the + Connection button on the right side of the Connections section. A new connection window will appear.
Configure the following fields to create a connection to Cortex XSIAM.
-20250417-234632.png?inst-v=a9107af0-b04c-4e31-bb5a-938372783868)
Connection Name: The desired name for the connection.
Site: The site on which to use the integration connection. Use the drop-down menu to select the site. The Share to Internal Sites option enables all internal sites to use the connection. Selecting a specific site will only enable that site to use the connection.
Recipient site for events from connections Shared to Internal Sites: This field is displayed when Share to Internal Sites is selected for the Site field, allowing selection of the internal site for deploying the integration connection.
Agent Name (Optional): The proxy agent required to build the connection. Use the dropdown menu to select the proxy agent from a list of previously configured proxy agents.
Description (Optional): The description for the connection.
Tenant (Optional): When configuring the connection from a master tenant site, users can choose the specific tenant sites with which to share the connection. Once this setting is enabled, users can filter and select the desired tenant sites from the dropdowns to share the connection.
Configure User Permissions: Defines which users have access to the connection.
Active: The checkbox that enables the connection to be used when selected.
System: This section contains the parameters defined specifically for the integration. These parameters must be configured to create the integration connection.
-20250417-234715.png?inst-v=a9107af0-b04c-4e31-bb5a-938372783868)
1. Input the FQDN.
2. Input the key ID.
3. Input the API key from the Cortex XSIAM platform.
4. Input the key type.Enable Password Vault: An optional feature that allows users to take the stored credentials from their own password vault. Refer to the password vault connection guide if needed.
Connection Health Check: Periodically checks the connection status by scheduling the Test Connection command at the specified interval (in minutes). Available only for active connections, this feature also allows configuring email notifications for failed attempts.
Test the connection.
Click on the Test Connection button to verify credentials and connectivity. A success alert displays Passed with a green checkmark. If the connection fails, review the parameters and retry.
Click OK to close the alert window.
Click + Add to create and add the configured connection.
Commands
Cortex XSIAM includes the following executable commands for users to set up schedules or create playbook workflows. With the Test Command function, users can execute these commands independently for playbook troubleshooting.
Integration API Note
For more information about the Cortex XSIAM API, refer to the Cortex XSIAM API reference.
Note for Time-related parameters
The input format of time-related parameters may vary based on user account settings, which may cause the sample data in commands to differ from what is displayed. To adjust the time format, follow these steps:
Navigate to Configuration Application Settings. Select Date/Time Format.
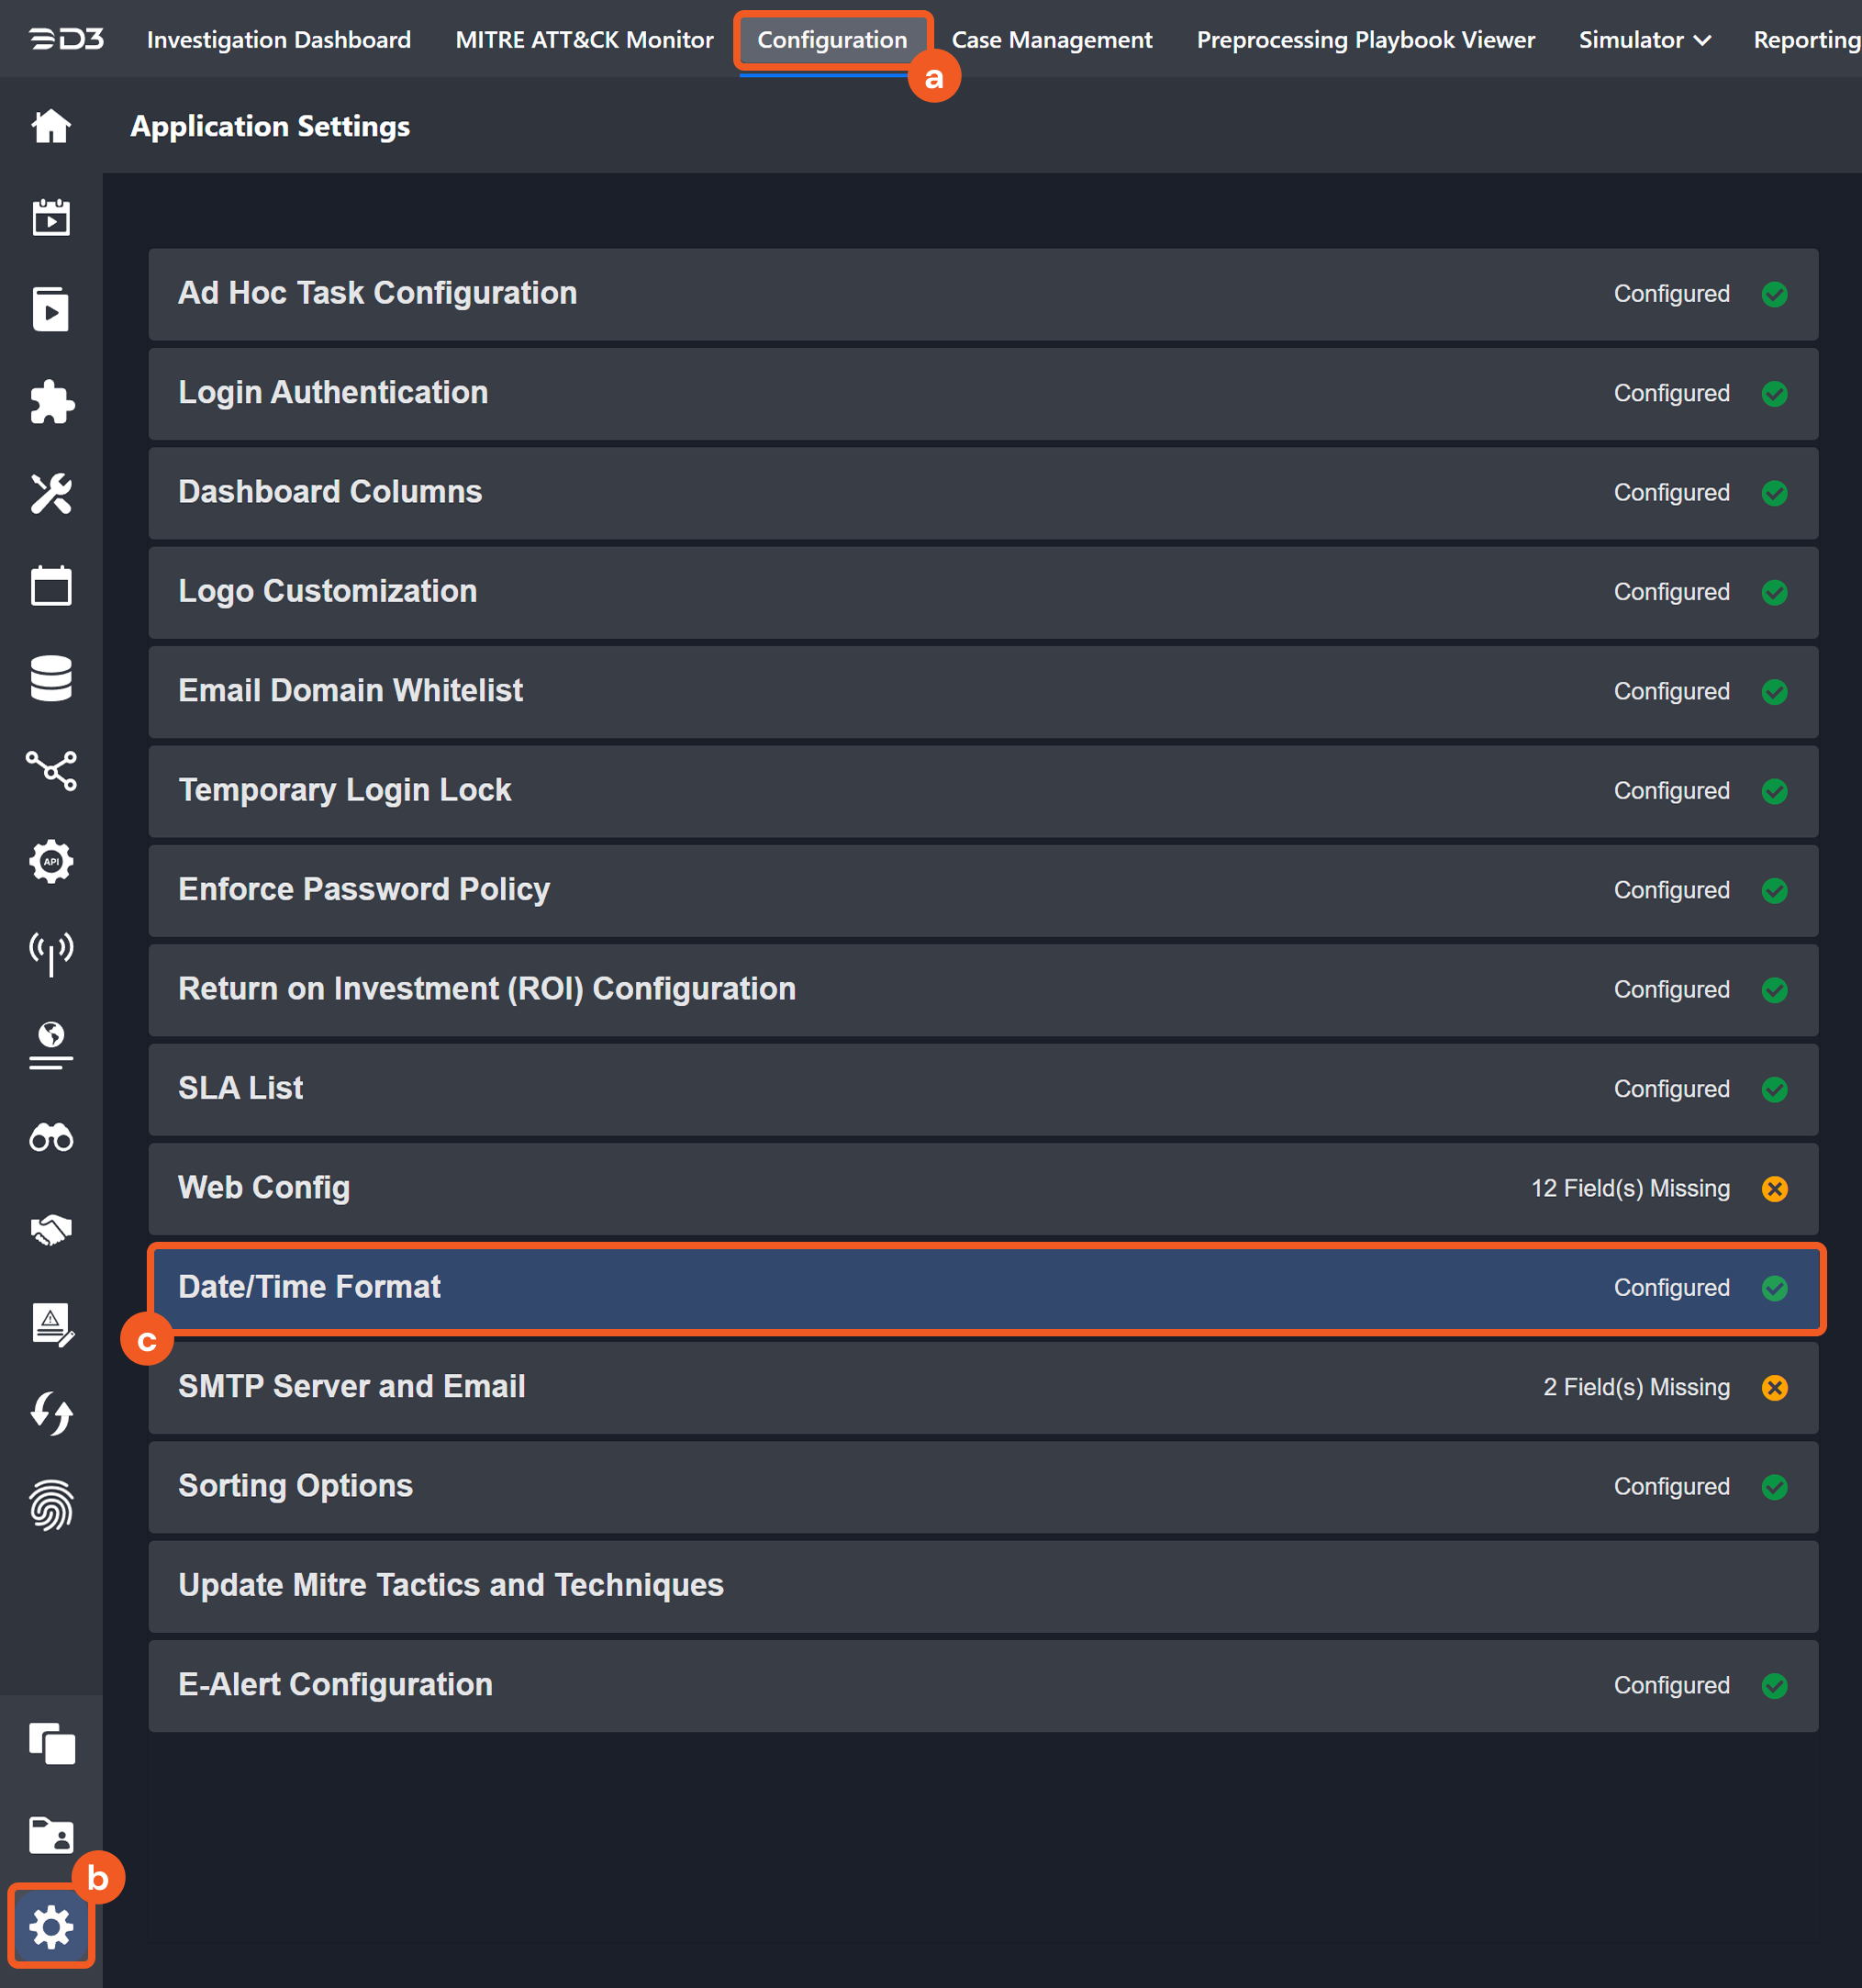
Choose the desired date and time format, then click on the Save button.
The selected time format will now be visible when configuring Date/Time command input parameters.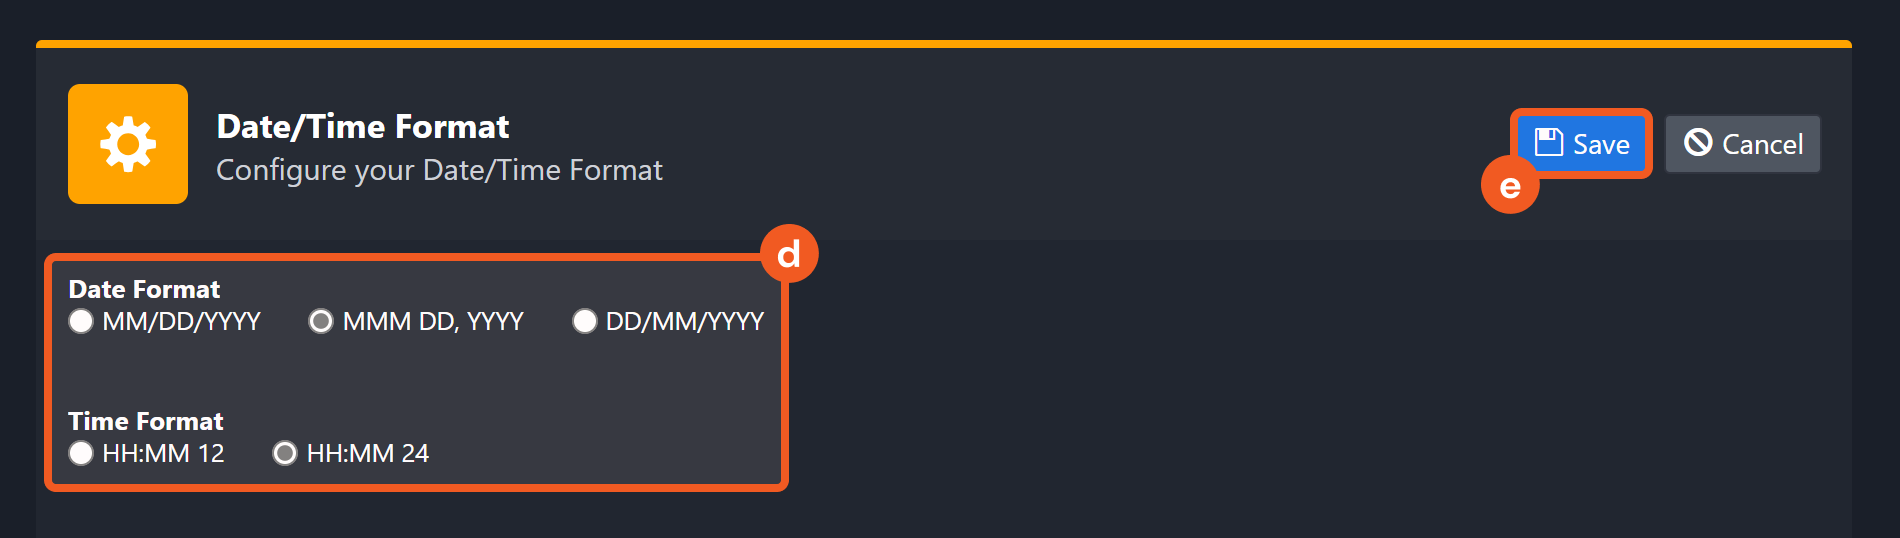
Fetch Event
Ingests XSIAM incidents or alerts into the D3 vSOC platform as events. For the Incident event type, incidents are sorted by modification time in descending order. For the Alert event type, alerts are sorted by detection time in descending order.
Input
Input Parameter | Required/Optional | Description | Example |
Event Type | Optional | The type of event to ingest. Available options are Incident and Alert. | Alert |
Start Time | Optional | The start time of the time range for fetching events, in UTC.
By default, the value is 24 hours before End Time. | 01/15/2024 04:00 PM |
End Time | Optional | The end time of the time range for fetching events, in UTC.
By default, the value is the current time. | 01/15/2024 05:00 PM |
Number of Event(s) Fetched | Optional | The maximum number of events to return. Valid values are integers between 1 and 100. By default, all events matching the search criteria will be returned. | 10 |
Alert Sources | Optional | Filter alerts by alert sources. By default, alerts from all sources will be returned. This parameter applies to both Incident and Alert event types. |
JSON
|
Severities | Optional | Filters alerts by severity. Available severities are critical, high, medium, and low. By default, alerts of all severities will be returned. This parameter applies only to the Alert event type. |
JSON
|
Status | Optional | Filters incidents by their status. Available status options are resolved_duplicate, resolved_other, new, resolved_security_testing, resolved_known_issue, resolved_auto, resolved_threat_handled, resolved_true_positive, under_investigation, and resolved_false_positive. By default, incidents in all statuses will be returned. This parameter applies only to the Incident event type. | New |
Description | Optional | Filters incidents by full or partial incident description. This parameter applies only to the Incident event type. | Test description |
Get Extra Incident Data | Optional | Whether to ingest additional incident data, including alerts and key artifacts. If set to True, a maximum of 1,000 related alerts will be returned per incident. By default, the value is False. This parameter applies only to the Incident event type. | True |
Output
To view the sample output data for all commands, refer to this article.
Fetch Event Field Mapping
See Field Mappings.
The Cortex XSIAM system integration includes pre-configured field mappings for the default event source.
The Default Event Source is the default system-provided set of field mappings applied when the fetch event command is executed. It includes a Main Event JSON Path, which is the JSONPath expression that points to the base array of event objects. The source field path continues from this array to locate the required data.
The Main Event JSON Path can be viewed by clicking on the Edit Event Source button.
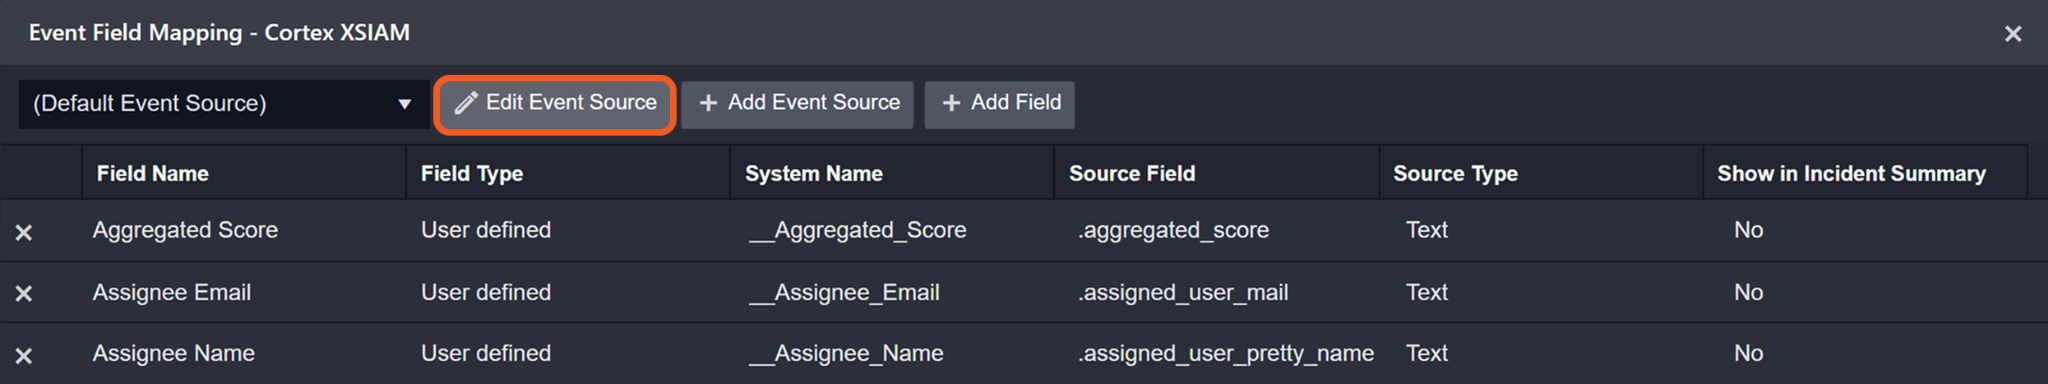
Main Event JSON Path: $.reply.Events
The reply.Events array contains the event objects. Within each event object, the key aggregated_score denotes the Aggregated Score field. As such, the full JSONPath expression to extract the Aggregated Score is $.reply.Events.aggregated_score .Event Mapping for Alerts
.png?inst-v=a9107af0-b04c-4e31-bb5a-938372783868)
The D3 system configures the field mappings which are specific to the Alert-related events. If a source field in the field mapping is not found, the corresponding field mapping will be ignored. Because the EventType field in the raw data for Alert events consistently has the value Alert, these events can be identified by the Search String: {$.EventType}=Alert. Click Edit Event Source to view the Search String.
The pre-configured field mappings are detailed below:
Field Name | Source Field |
Default | |
Assignee Email | .assigned_user_mail |
Assignee Name | .assigned_user_pretty_name |
Domain | .network_artifacts.data[*].network_domain |
External Hostname | .alerts.data[*].action_external_hostname |
External ID | .alerts.data[*].external_id |
Local IPv6 | .alerts.data[*].action_local_ip_v6 |
Modification Time | .modification_time |
Network Country | .network_artifacts.data[*].network_country |
Notes | .notes |
Related Alert Count | .alert_count |
Remote IP | .network_artifacts.data[*].network_remote_ip |
Aggregated Score | .aggregated_score |
Host IP | .alerts.data[*].host_ip |
Incident Domain | .incident_domain |
Remote IPv6 | .alerts.data[*].action_remote_ip_v6 |
Remote port | .network_artifacts.data[*].network_remote_port |
Resolve Comment | .resolve_comment |
Document ID | .incident_id |
Local IP | .alerts.data[*].action_local_ip |
Device MAC address | .alerts.data[*].mac |
Event name | .incident_name |
File Hash MD5 | .alerts.data[*].action_file_md5 |
File Hash SHA256 | .file_artifacts.data[*].file_sha256 |
Filename | .file_artifacts.data[*].file_name |
Filepath | .alerts.data[*].action_file_path |
Hostname | .hosts |
Start Time | .creation_time |
Description | .description |
Action taken | .alerts.data[*].action_pretty |
Process command line | .alerts.data[*].action_process_image_command_lie |
Process Hash SHA256 | .alerts.data[*].action_process_image_sha256 |
Process Name | .alerts.data[*].action_process_image_name |
Registry key name | .alerts.data[*].action_registry_key_name |
Registry value name | .alerts.data[*].action_registry_value_name |
Severity | .severity |
Sub Event | .alerts.data |
Tactics | .mitre_tactics_ids_and_names |
Tag | .tags |
Techniques | .mitre_techniques_ids_and_names |
Source | .incident_sources |
Status | .status |
URL | .alerts.data[*].malicious_urls |
Username | .users |
Event Mapping for Alerts (Search String: {$.EventType} = Alert) The search string format is {$.<field>}=<field value>. If the value of the EventType key is Alert in the event object under raw data, then the Alert-related events will use the field mapping below. | |
Username | .user_name |
Status | .resolution_status |
Techniques | .mitre_technique_id_and_name |
URL | .malicious_urls |
Tactics | .mitre_tactic_id_and_name |
Tag | .tags |
Severity | .severity |
Source | .source |
Registry key name | .action_registry_key_name |
Registry value name | action_registry_value_name |
Process Hash SHA256 | .action_process_image_sha256 |
Process Name | .action_process_image_name |
Action taken | .action_pretty |
Operating system | .agent_os_type |
Process command line | .action_process_image_command_line |
Start Time | .detection_timestamp |
Description | .description |
Filepath | .action_file_path |
Hostname | .host_name |
File Hash SHA256 | .action_file_sha256 |
Filename | .action_file_name |
File Hash MD5 | .action_file_md5 |
Event name | .name |
Original event ID | .event_id |
Event Type | .alert_type |
Device MAC address | .mac |
Local IP | .action_local_ip |
Local IPv6 | .action_local_ip_v6 |
Document ID | .alert_id |
Incident ID | .case_id |
Alert Domain | .alert_domain |
Remote IP | .action_remote_ip |
Remote IPv6 | .action_remote_ip_v6 |
External ID | .external_id |
Host IP | .host_ip |
Event Timestamps | .event_timestamp |
External Hostname | .action_external_hostname |
Error Handling
If the Return Data displays Failed, an Error tab will appear in the Test Result window.
The error tab contains the details responded from D3 SOAR or third-party API calls, including Failure Indicator, Status Code, and Message. This can help locate the root cause of a command failure.
Parts in Error | Description | Example |
Failure Indicator | Indicates the command failure that happened at a specific input and/or API call. | Fetch Event failed. |
Status Code | The response code issued by the third-party API server or the D3 SOAR system that can be used to locate the corresponding error category. For example, if the returned status code is 401, the selected connection is unauthorized to run the command. The user or system support would need to check the permission setting in the Cortex XSIAM portal. Refer to the HTTP Status Code Registry for details. | Status Code: 403. |
Message | The raw data or captured key error message from the integration API server about the API request failure. | Message: You must have a valid Support account to call this API. |
Error Sample Data Fetch Event failed. Status Code: 403. Message: You must have a valid Support account to call this API. |
Isolate Endpoints
Isolates the specified endpoints.
READER NOTE
Endpoint IDs and Incident ID are required parameters to run this command.
Run the Search Endpoints command to obtain the Endpoint IDs. Endpoint IDs can be found in the raw data at the path $.reply.endpoints[*].endpoint_id.
Run the Fetch Event command ("Incident" event type) to obtain the Incident ID. Incident IDs can be found in the raw data at the path $.reply.Events[*].incident_id.
Input
Input Parameter | Required/Optional | Description | Example |
Endpoint IDs | Required | The IDs of the endpoints to be isolated. Endpoint IDs can be obtained via the Fetch Event or Search Endpoints commands. |
JSON
|
Incident ID | Required | The ID of the incident. When provided, the Isolate Endpoints action appears in the Cortex XDR Incident View Timeline tab. Incident ID can be obtained using the Fetch Event command with the "Incident" event type. | 637 |
Output
To view the sample output data for all commands, refer to this article.
Error Handling
If the Return Data displays Failed, an Error tab will appear in the Test Result window.
The error tab contains the details responded from D3 SOAR or third-party API calls, including Failure Indicator, Status Code, and Message. This can help locate the root cause of a command failure.
Parts in Error | Description | Example |
Failure Indicator | Indicates the command failure that happened at a specific input and/or API call. | Update Incidents failed. |
Status Code | The response code issued by the third-party API server or the D3 SOAR system that can be used to locate the corresponding error category. For example, if the returned status code is 401, the selected connection is unauthorized to run the command. The user or system support would need to check the permission setting in the Cortex XSIAM portal. Refer to the HTTP Status Code Registry for details. | Status Code: 403. |
Message | The raw data or captured key error message from the integration API server about the API request failure. | Message: You must have a valid Support account to call this API. |
Error Sample Data Isolate Endpoints failed. Status Code: 403. Message: You must have a valid Support account to call this API. |
Search Endpoints
Searches for endpoints using the specified filters.
Input
Input Parameter | Required/Optional | Description | Example |
Host Names | Optional | Filters endpoints by host names. |
JSON
|
IP Addresses | Optional | Filters endpoints by IP addresses. |
JSON
|
Platform | Optional | Filters endpoints by operating system platform. The options are:
By default, endpoints of all platforms are returned. | Windows |
Status | Optional | Filters endpoints by status. The options are:
By default, endpoints of all statuses are returned. | Connected |
Output
To view the sample output data for all commands, refer to this article.
Error Handling
If the Return Data displays Failed, an Error tab will appear in the Test Result window.
The error tab contains the details responded from D3 SOAR or third-party API calls, including Failure Indicator, Status Code, and Message. This can help locate the root cause of a command failure.
Parts in Error | Description | Example |
Failure Indicator | Indicates the command failure that happened at a specific input and/or API call. | Update Incidents failed. |
Status Code | The response code issued by the third-party API server or the D3 SOAR system that can be used to locate the corresponding error category. For example, if the returned status code is 401, the selected connection is unauthorized to run the command. The user or system support would need to check the permission setting in the Cortex XSIAM portal. Refer to the HTTP Status Code Registry for details. | Status Code: 403. |
Message | The raw data or captured key error message from the integration API server about the API request failure. | Message: You must have a valid Support account to call this API. |
Error Sample Data Search Endpoints failed. Status Code: 403. Message: You must have a valid Support account to call this API. |
Update Incidents
Updates one or more fields of the specified incidents.
READER NOTE
Incident IDs is a required parameter to run this command.
Run the Fetch Event command to obtain the Incident IDs. Incident IDs can be found in the raw data at the path $.reply.Events[*].incident_id.
Input
Input Parameter | Required/Optional | Description | Example |
Incident IDs | Required | The IDs of the incidents to update. Incident IDs can be obtained using the Fetch Event command with the Incident event type. |
JSON
|
Assignee Email | Optional | The email address of the updated incident assignee. To unassign incidents, input "none". Cortex XSIAM validates the email address to ensure the assignee exists within the same Cortex XSIAM tenant. | user1@example.com |
Assignee Full Name | Optional | The full name of the updated incident assignee. To supply a new name of the incident assignee, you must also supply a value for the Assignee Email parameter. | USER-1 |
Manual Severity | Optional | An administrator-defined severity for incidents. Select "None" to remove a manually set severity. | High |
Status | Optional | The updated status of incidents. | Resolved-False Positive |
Resolve Comment | Optional | The descriptive comment explaining the incident change. This can be set only for resolved incidents. | This is a false positive incident. |
Comment | Optional | Adds a comment to the incidents. | Test Comment 20250108-a |
Custom Fields | Optional | The option to include custom incident fields. The names of custom fields are standardized in lowercase with no white spaces. For example, Single Select is included as singleselect. |
JSON
|
Output
To view the sample output data for all commands, refer to this article.
Error Handling
If the Return Data displays Partially Successful or Failed, an Error tab will appear in the Test Result window.
The error tab contains the details responded from D3 SOAR or third-party API calls, including Failure Indicator, Status Code, and Message. This can help locate the root cause of a command failure.
Parts in Error | Description | Example |
Failure Indicator | Indicates the command failure that happened at a specific input and/or API call. | Update Incidents failed. |
Status Code | The response code issued by the third-party API server or the D3 SOAR system that can be used to locate the corresponding error category. For example, if the returned status code is 401, the selected connection is unauthorized to run the command. The user or system support would need to check the permission setting in the Cortex XSIAM portal. Refer to the HTTP Status Code Registry for details. | Status Code: 403. |
Message | The raw data or captured key error message from the integration API server about the API request failure. | Message: You must have a valid Support account to call this API. |
Error Sample Data Update Incidents failed. Status Code: 403. Message: You must have a valid Support account to call this API. |
Test Connection
Allows users to perform a health check on an integration connection. Users can schedule a periodic health check by selecting Connection Health Check when editing an integration connection.
Input
N/A
Output
Output Type | Description | Return Data Type |
Return Data | Indicates one of the possible command execution states: Successful or Failed. The Failed state can be triggered by any of the following errors:
More details about an error can be viewed in the Error tab. | String |
Error Handling
If the Return Data displays Failed, an Error tab will appear in the Test Result window.
The error tab contains the details responded from D3 SOAR or third-party API calls, including Failure Indicator, Status Code, and Message. This can help locate the root cause of a command failure.
Parts in Error | Description | Example |
Failure Indicator | Indicates the command failure that happened at a specific input and/or API call. | Test Connection failed. Failed to check the connector. |
Status Code | The response code issued by the third-party API server or the D3 SOAR system that can be used to locate the corresponding error category. For example, if the returned status code is 401, the selected connection is unauthorized to run the command. The user or system support would need to check the permission setting in the Cortex XSIAM portal. Refer to the HTTP Status Code Registry for details. | Status Code: 401. |
Message | The raw data or captured key error message from the integration API server about the API request failure. | Message: Unauthorized. |
Error Sample Data Test Connection failed. Failed to check the connector. Status Code: 401. Message: Unauthorized. |