
Cortex XDR
LAST UPDATED: NOVEMBER 10, 2025
Overview
Palo Alto Networks Cortex XDR Platform allows users to ingest alerts and to leverage alert stitching and investigation capabilities. The APIs allow the user to manage incidents in a ticketing or automation system of your choice by reviewing and editing the incident's details, status, and assignee.
D3's integration with the Palo Alto Networks Cortex XDR's latest REST API provides the ability to ingest incidents, update incidents, and data enhancement operation for incidents.
D3 SOAR is providing REST operations to function with Cortex XDR.
Cortex XDR is available for use in:
Connection
To connect to Cortex XDR from D3 SOAR, please follow this part to collect the required information below:
Parameter | Description | Example |
Server URL | The server URL of the Cortex XDR API instance. | https://api-{fqdn} |
API Key | The API key to authenticate the API connection. | ******** |
API Key ID | The API key ID to authenticate the API connection. | 1 |
Version | The version of the API to use for the connection. | v1 |
READER NOTE
Fully Qualified Domain Name (FQDN)
Each Cortex tenant is assigned a unique host and domain name combination known as the Fully Qualified Domain Name (FQDN). When generating the API Key and Key ID, a FQDN is assigned. For more information, refer to Get Started with Cortex XDR APIs.
Permission Requirements
Each endpoint in the Cortex XDR API requires a certain permission scope. The following are the required scopes for commands in this integration:
Required License
One of these licenses is required to execute commands:
Cortex XDR Prevent
Cortex XDR Pro per Endpoint
Cortex XDR Pro per TB
Required Scopes
The Instance Administrator permission scope is also required to execute the following commands:
Add IOCs
Delete IOCs
Get IOCs
Update IOCs
READER NOTE
As Cortex XDR is using role-based access control (RBAC), the API access keys are generated based on a specific user account and the application. Therefore, the command permissions are inherited from the user account’s role. Users need to configure their user profile from the Cortex XDR console for each command in this integration.
Some features are license-dependent. Accordingly, users may not see a specific feature if the feature is not supported by the license type of their user account or if they do not have access based on their assigned role.
When creating custom roles, refer to Access Management for required permissions
For Cortex XDR predefined User roles and permissions, refer to Predefined User Roles for Cortex XDR.
Configuring Cortex XDR to Work with D3 SOAR
Log into Cortex XDR.
Once logged in, click the
 icon and navigate to Configurations > Integrations > API Keys.
Click + New Key to create a new API key.
In the API key creation window, select the "Advanced" security level. It is recommended to uncheck the "Enable Expiration Date" option to create an unlimited API key. Choose the appropriate level of access for this API key based on the desired roles. Click Generate to generate the API key.
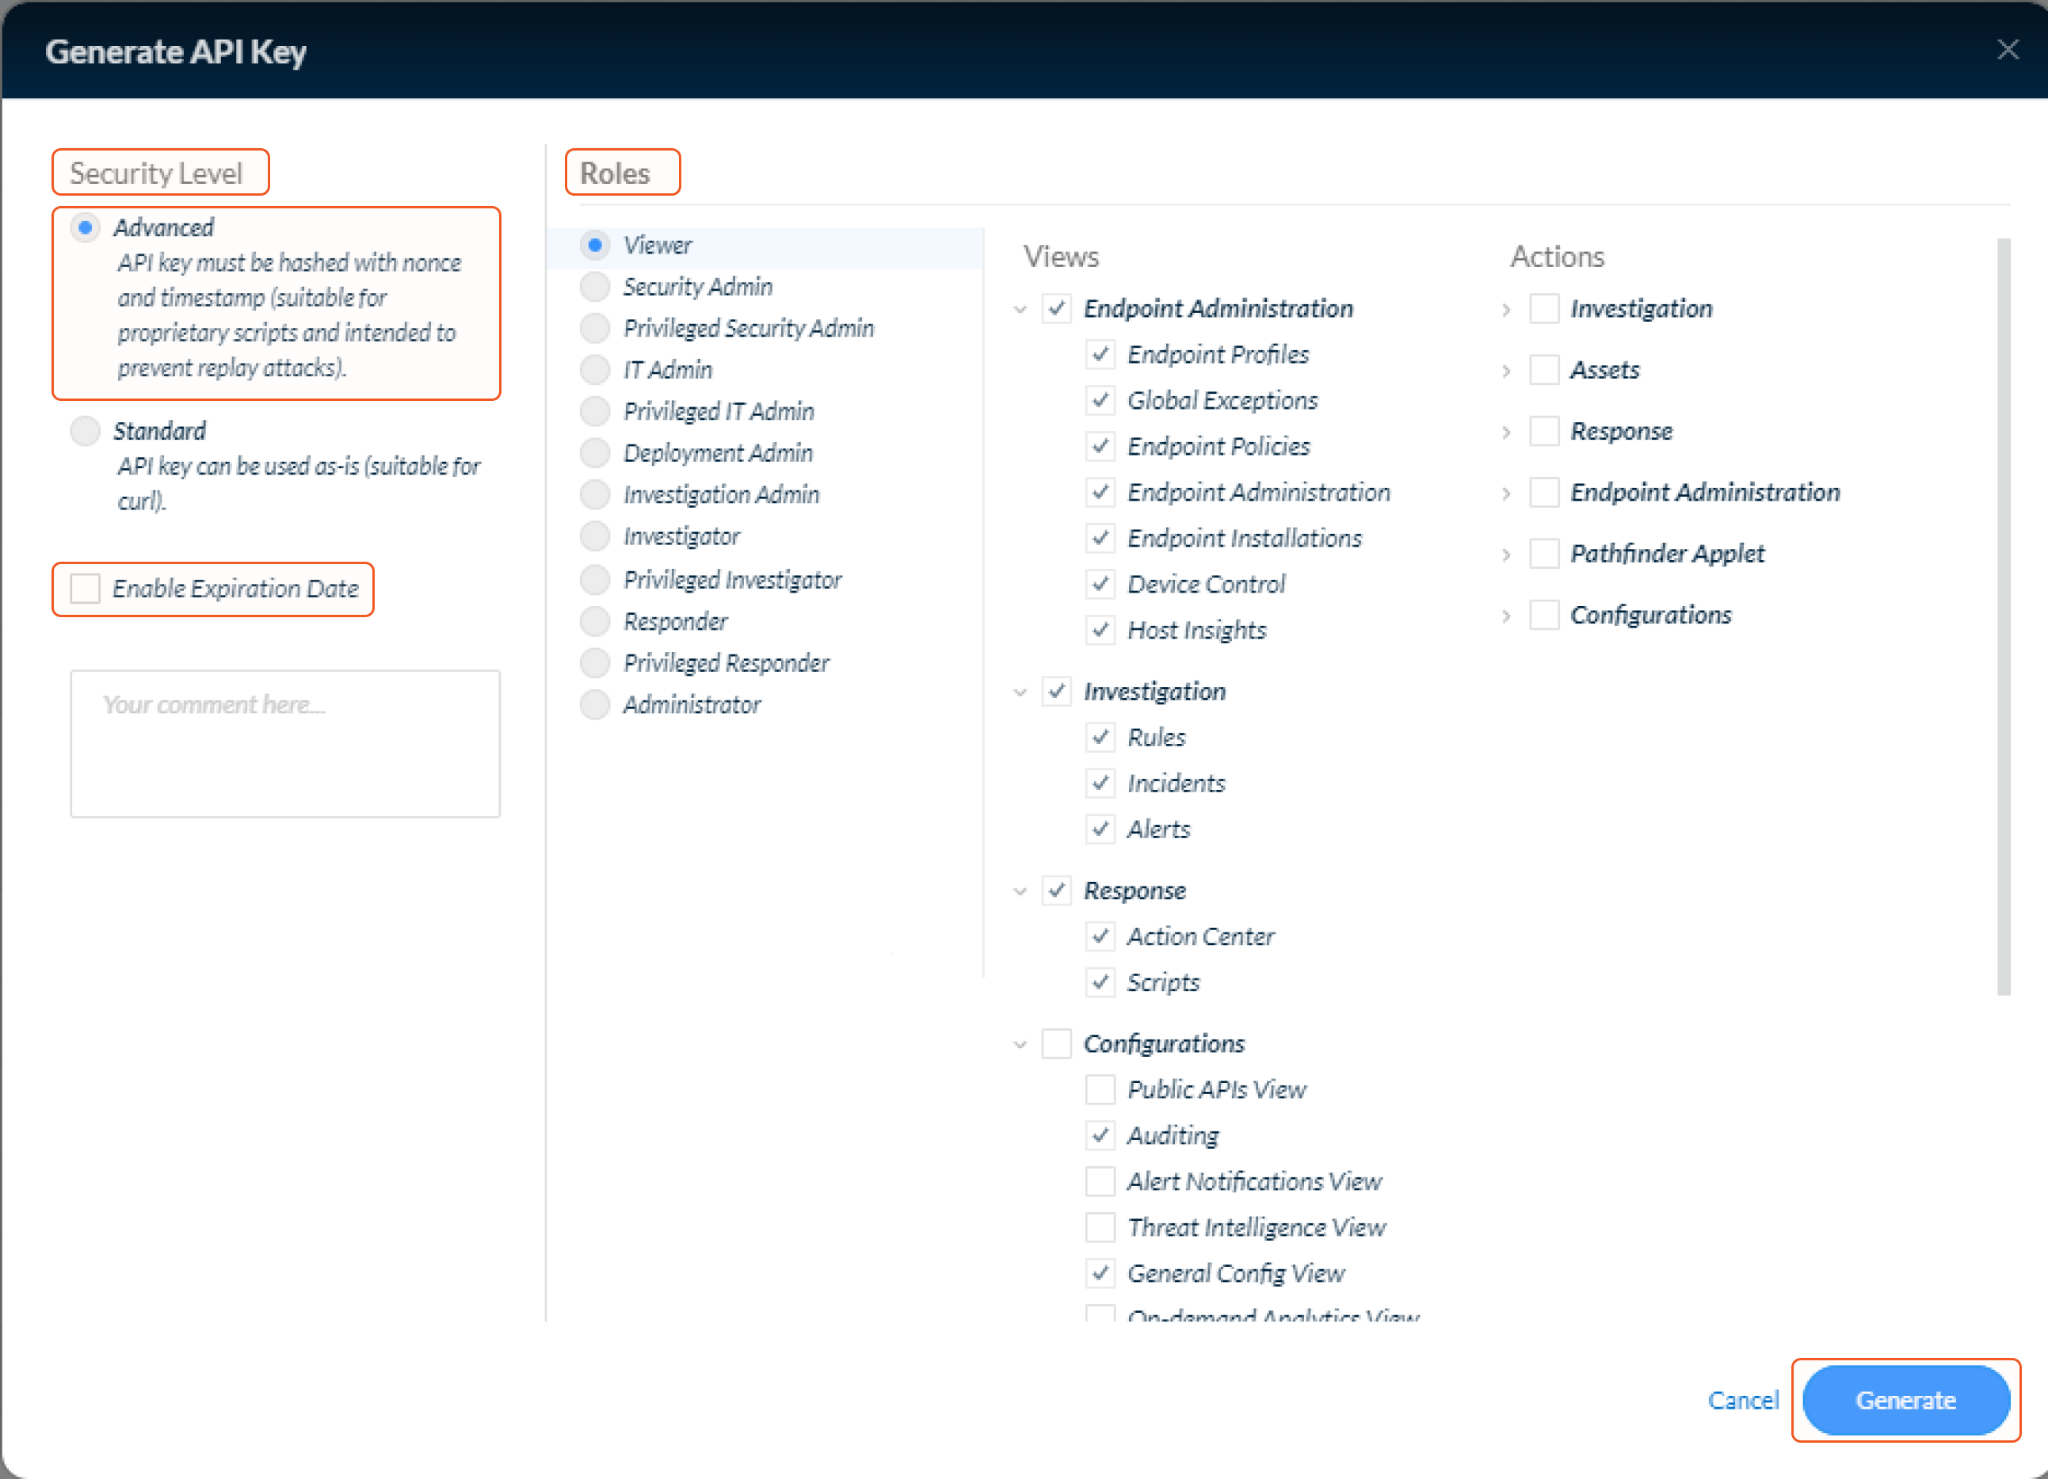
Copy the generated API key and store it in a secure location. Click Done to complete the process. The API key will not be visible again after this step. This unique API key will be used as the API Key in the integration's connector.
In the API Keys table, locate the ID field and take note of the ID number. This ID will be used as the API Key ID in the integration's connector.
Right-click your API key and select View Examples.
Copy the domain part of the CURL example, which will serve as the Server URL in the integration's connector. The format should be: https://api-{fqdn}.
Configuring D3 SOAR to Work with Cortex XDR
Log in to D3 SOAR.
Find the Cortex XDR integration.
.png?inst-v=a9107af0-b04c-4e31-bb5a-938372783868)
Navigate to Configuration on the top header menu.
Click on the Integration icon on the left sidebar.
Type Cortex XDR in the search box to find the integration, then click it to select it.
Click + Connection, on the right side of the Connections section. A new connection window will appear.
Configure the following fields to create a connection to Cortex XDR.
.png?inst-v=a9107af0-b04c-4e31-bb5a-938372783868)
Connection Name: The desired name for the connection.
Site: The site on which to use the integration connection. Use the drop-down menu to select the site. The Share to Internal Sites option enables all internal sites to use the connection. Selecting a specific site will only enable that site to use the connection.
Recipient site for events from connections Shared to Internal Sites: This field is displayed when Share to Internal Sites is selected for the Site field, allowing selection of the internal site for deploying the integration connection.
Agent Name (Optional): The proxy agent required to build the connection. Use the dropdown menu to select the proxy agent from a list of previously configured proxy agents.
Description (Optional): The description for the connection.
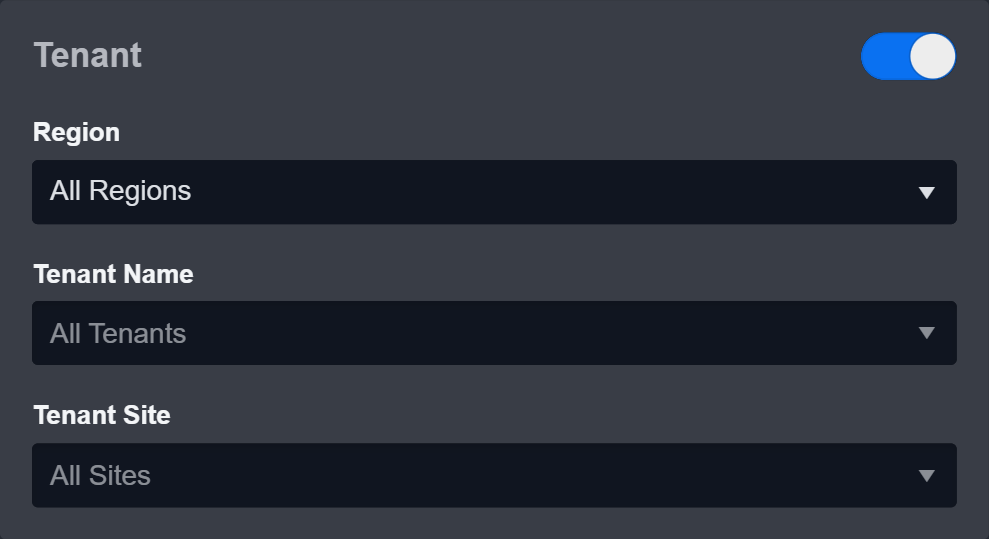
Tenant (Optional): When configuring the connection from a master tenant site, users can choose the specific tenant sites with which to share the connection. Once this setting is enabled, users can filter and select the desired tenant sites from the dropdowns to share the connection.
Configure User Permissions: Defines which users have access to the connection.
Active: The checkbox that enables the connection to be used when selected.
System: This section contains the parameters defined specifically for the integration. These parameters must be configured to create the integration connection.
.png?inst-v=a9107af0-b04c-4e31-bb5a-938372783868)
1. Input the Server URL.
2. Input the API Key. See step 4 of Configuring Cortex XDR to work with D3 SOAR.
3. Input the API Key ID. See step 6 of Configuring Cortex XDR to work with D3 SOAR.
4. Input the API Version. Default version is v1.
Enable Password Vault: An optional feature that allows users to take the stored credentials from their own password vault. Refer to the password vault connection guide if needed.
Connection Health Check: Periodically checks the connection status by scheduling the Test Connection command at the specified interval (in minutes). Available only for active connections, this feature also allows configuring email notifications for failed attempts.
Test the connection.
Click on the Test Connection button to verify credentials and connectivity. A success alert displays Passed with a green checkmark. If the connection fails, review the parameters and retry.
Click OK to close the alert window.
Click Add to create and add the configured connection.
Commands
Cortex XDR includes the following executable commands for users to set up schedules or create playbook workflows. With the Test Command, users can execute these commands independently for playbook troubleshooting.
Integration API Note
For more information about the Cortex XDR API, refer to the Cortex XDR API reference.
READER NOTE
Certain permissions are required for each command. Refer to the Permission Requirements and Configuring Cortex XDR to Work with D3 SOAR for details.
Note for Time-related parameters
The input format of time-related parameters may vary based on user account settings, which may cause the sample data in commands to differ from what is displayed. To adjust the time format, follow these steps:
Navigate to Configuration > Application Settings. Select Date/Time Format.
-20241017-192013.png?inst-v=a9107af0-b04c-4e31-bb5a-938372783868)
Choose the desired date and time format, then click on the Save button.
-20241017-192025.png?inst-v=a9107af0-b04c-4e31-bb5a-938372783868)
The selected time format will now be visible when configuring Date/Time command input parameters.
Add IOCs
Adds one or more new indicators to the current tenant's IOC list. This command requires Cortex XDR version 4.2 or later with the appropriate license.
Input
Input Parameter | Required/Optional | Description | Example |
Indicators | Required | The indicators to add. |
JSON
|
Indicator Type | Required | The type of indicators to add. Available options are:
| Filename |
Severity | Optional | The severity to assign to the indicators. Available options are:
| Info |
Expiration Date | Optional | The expiration date and time (in UTC) for the indicators. | 2026-01-01 12:00 AM |
Enable Default Expiration | Optional | The option to enable the default expiration date for indicators when set to True. By default, the value is False. | No |
Comment | Optional | The comment associated with the indicators. | Test |
Reputation | Optional | The reputation to assign to the indicators. Available options are:
| Good |
Reliability | Optional | The reliability grade to assign to the indicators. Available options are:
| A |
Output
To view the sample output data for all commands, refer to this article.
Error Handling
If the Return Data displays Partially Successful or Failed, an Error tab will appear in the Test Result window.
The error tab contains the details responded from D3 SOAR or third-party API calls, including Failure Indicator, Status Code, and Message. This can help locate the root cause of a command failure.
Parts in Error | Description | Example |
Failure Indicator | Indicates the command failure that happened at a specific input and/or API call. | Add IOCs failed. |
Status Code | The response code issued by the third-party API server or the D3 SOAR system that can be used to locate the corresponding error category. For example, if the returned status code is 401, the selected connection is unauthorized to run the command. The user or system support would need to check the permission setting in the Cortex XDR portal. Refer to the HTTP Status Code Registry for details. | Status Code: 403. |
Message | The raw data or captured key error message from the integration API server about the API request failure. | Message: Forbidden. |
Error Sample Data Add IOCs failed. Status Code: 403. Message: Forbidden. |
Cancel Scan Hosts
Cancels scans for the specified endpoints. A scan can be aborted only if the endpoints are in Pending or In Progress status.
READER NOTE
Host Names is an optional parameter to run this command.
Run the Search Hosts command to obtain the Host Names. Host Names can be found in the raw data at the path $.reply.endpoints[*].endpoint_name.
Input
Input Parameter | Required/Optional | Description | Example |
Host Names | Optional | The names of the endpoints for which to cancel scanning. Endpoint names can be obtained using the Search Hosts command. |
JSON
|
Output
To view the sample output data for all commands, refer to this article.
Error Handling
If the Return Data displays Failed, an Error tab will appear in the Test Result window.
The error tab contains the details responded from D3 SOAR or third-party API calls, including Failure Indicator, Status Code, and Message. This can help locate the root cause of a command failure.
Parts in Error | Description | Example |
Failure Indicator | Indicates the command failure that happened at a specific input and/or API call. | Cancel Scan Hosts failed. |
Status Code | The response code issued by the third-party API server or the D3 SOAR system that can be used to locate the corresponding error category. For example, if the returned status code is 401, the selected connection is unauthorized to run the command. The user or system support would need to check the permission setting in the Cortex XDR portal. Refer to the HTTP Status Code Registry for details. | Status Code: 400. |
Message | The raw data or captured key error message from the integration API server about the API request failure. | Message: Bad request. |
Error Sample Data Cancel Scan Hosts failed. Status Code: 400. Message: Bad request. |
Create Indicator
Uploads IOCs as JSON objects retrieved from external threat intelligence sources.
Input
Input Parameter | Required/Optional | Description | Example |
Indicator Type | Required | The type of indicator. Available options are:
| IP |
Indicator | Required | The indicator to insert into Cortex XDR. | ***.***.***.*** |
Severity | Required | The severity of the indicator. Available options are:
| High |
Reputation | Optional | The reputation of the indicator. Available options are:
| Suspicious |
Reliability | Optional | The reliability rating of the indicator. Valid values are A to F. A is the most reliable; F is the least. | C |
Expiration Date | Optional | The expiration date of the indicator. | 13/07/2023 14:00 |
Comment | Optional | The comment associated with the indicator. | Test comment |
Vendors | Optional | A list of vendors with vendor name, reliability, and reputation. |
JSON
|
Output
To view the sample output data for all commands, refer to this article.
Error Handling
If the Return Data displays Failed, an Error tab will appear in the Test Result window.
The error tab contains the details responded from D3 SOAR or third-party API calls, including Failure Indicator, Status Code, and Message. This can help locate the root cause of a command failure.
Parts in Error | Description | Example |
Failure Indicator | Indicates the command failure that happened at a specific input and/or API call. | Create Indicator failed. |
Status Code | The response code issued by the third-party API server or the D3 SOAR system that can be used to locate the corresponding error category. For example, if the returned status code is 401, the selected connection is unauthorized to run the command. The user or system support would need to check the permission setting in the Cortex XDR portal. Refer to the HTTP Status Code Registry for details. | Status Code: 400. |
Message | The raw data or captured key error message from the integration API server about the API request failure. | Message: Bad request. |
Error Sample Data Create Indicator failed. Status Code: 400. Message: Bad request. |
Delete IOCs
Deletes indicators (IOCs) that match the specified filters. All filter conditions are combined using AND logic. This command requires Cortex XDR version 4.2 or later with the appropriate license.
READER NOTE
Indicators is an optional parameter to run this command.
Run the Get IOCs command to obtain the Indicators. Indicators can be found in the raw data at $.objects[*].indicator.
Input
Input Parameter | Required/Optional | Description | Example |
Indicators | Optional | The indicator values to match for deletion. Indicator values can be obtained using the Get IOCs command. |
JSON
|
Indicator Type | Optional | Filters indicators by type for deletion. Available options are:
| Hash |
Severity | Optional | Filters indicators by severity for deletion. Available options are:
| Info |
Reputation | Optional | Filters indicators by reputation for deletion. Available options are:
| Good |
Reliability | Optional | Filters indicators by reliability grade for deletion. Available options are:
| A |
Output
To view the sample output data for all commands, refer to this article.
Error Handling
If the Return Data displays Partially Successful or Failed, an Error tab will appear in the Test Result window.
The error tab contains the details responded from D3 SOAR or third-party API calls, including Failure Indicator, Status Code, and Message. This can help locate the root cause of a command failure.
Parts in Error | Description | Example |
Failure Indicator | Indicates the command failure that happened at a specific input and/or API call. | Delete IOCs failed. |
Status Code | The response code issued by the third-party API server or the D3 SOAR system that can be used to locate the corresponding error category. For example, if the returned status code is 401, the selected connection is unauthorized to run the command. The user or system support would need to check the permission setting in the Cortex XDR portal. Refer to the HTTP Status Code Registry for details. | Status Code: 403. |
Message | The raw data or captured key error message from the integration API server about the API request failure. | Message: Forbidden. |
Error Sample Data Delete IOCs failed. Status Code: 403. Message: Forbidden. |
Fetch Incident
Retrieves incidents from Cortex XDR based on the specified criteria.
READER NOTE
Instead of using tolerance scope, it is recommended to check the Initiate the buffer time of the Data Reacquire for [x] minutes after completing the event fetch checkbox when setting up a new Data Ingestion schedule
Navigate to Configuration > Data Ingestion, then select the Incident Intake tab.
.png?inst-v=a9107af0-b04c-4e31-bb5a-938372783868)
Add a New Schedule Data Source for the Cortex XDR Integration and check the Initiate the buffer time of the Data Reacquire for [x] minutes after completing the event fetch checkbox. Optionally, adjust the buffer time as necessary.
.png?inst-v=a9107af0-b04c-4e31-bb5a-938372783868)
Input
Input Parameter | Required/Optional | Description | Example |
Start Time | Required | The start time of the time range to filter the retrieved incidents in UTC time. The input start time corresponds to the selected time field (i.e., creation time or modification time). | 2019-12-22 00:00 |
End Time | Optional | The end time of the time range to filter the retrieved incidents in UTC time. The input end time corresponds to the selected time field (i.e., creation time or modification time). | 2019-12-23 00:00 |
Time Field | Required | The time field for the Start Time and End Time parameters. The available time fields are Creation Time and Modification Time. | Creation Time |
Number of Incident(s) Fetched | Optional | The maximum number of incidents to return. When the input has no value or is not a positive number, the default value of 20 will be used. The maximum value is 100. | 1 |
Offset | Optional | The number of items to skip before starting to collect the result set. When the input has no value or is not a positive number, the default value of 0 will be used. | 0 |
Order By | Optional | The time field (i.e. Creation Time or Modification Time) to order the returned results. The default setting is Creation Time. | Creation Time |
Direction | Optional | The sorting order (i.e., Ascending or Descending) of the returned results. The default setting is Descending. | Descending |
Other Filters | Optional | The array of conditions to filter the returned incidents. Each condition is defined as object within the array, consisting of the keys "field", "operator" and "value". The available filter fields are incident_id_list, description, alert_sources, status and starred. Please note that time-related fields are not supported for the "field" key. Instead, use the Start Time, End Time and Time Field parameters to define the desired time range. For more details about the input syntax for each key, refer to Get Incidents "filters" field from Palo Alto's documentation. When this parameter is defined, all other input parameters will be ignored. |
JSON
|
Tolerance Scope | Optional | A time window (in minutes) that extends the time range for fetching events by subtracting from the specified start time. Tolerance scope helps prevent data loss by accounting for API response delays caused by temporary server-side data unavailability—arising from processing and synchronization—from the vendor. With the tolerance scope applied, events will be fetched within the range of (Start Time - Tolerance Scope) to End Time. By default, the tolerance scope is set to 0. | 5 |
Allow Retrieve Extra Data | Optional | Whether to return extra incident data. By default, the value is False. Retrieving extra incident data is limited to 10 API requests per minute. | False |
Output
To view the sample output data for all commands, refer to this article.
Incident Field Mapping
For this integration, the default incident fields in D3 SOAR contain built-in source fields.
Event and Incident Intake Field Mapping
See Field Mappings.
Incident field mapping is required.
Incident Main JSON Path: $.reply.incidents
The pre-configured field mappings are detailed below:
Field Name | Source Field |
Title | .incident_name |
Description | .description |
Severity | User to define, default is “Low” |
Incident Type * | User to define, default is the first Incident form in D3 SOAR system |
Incident Creator | User to define |
Incident Owner | User to define |
Incident Playbook | User to define |
Due In Date | User to define |
Unique Key | .incident_id |
Tactics | .mitre_tactics_ids_and_names |
Techniques | .mitre_techniques_ids_and_names |
Event Field Mapping
The Cortex XDR system integration includes pre-configured field mappings for the default event source.
The Default Event Source is the default system-provided set of field mappings applied when the fetch event command is executed. It includes a Main Event JSON Path, which is the JSONPath expression that points to the base array of event objects. The source field path continues from this array to locate the required data.
The Main Event JSON Path can be viewed by clicking on the Edit Event Source button.
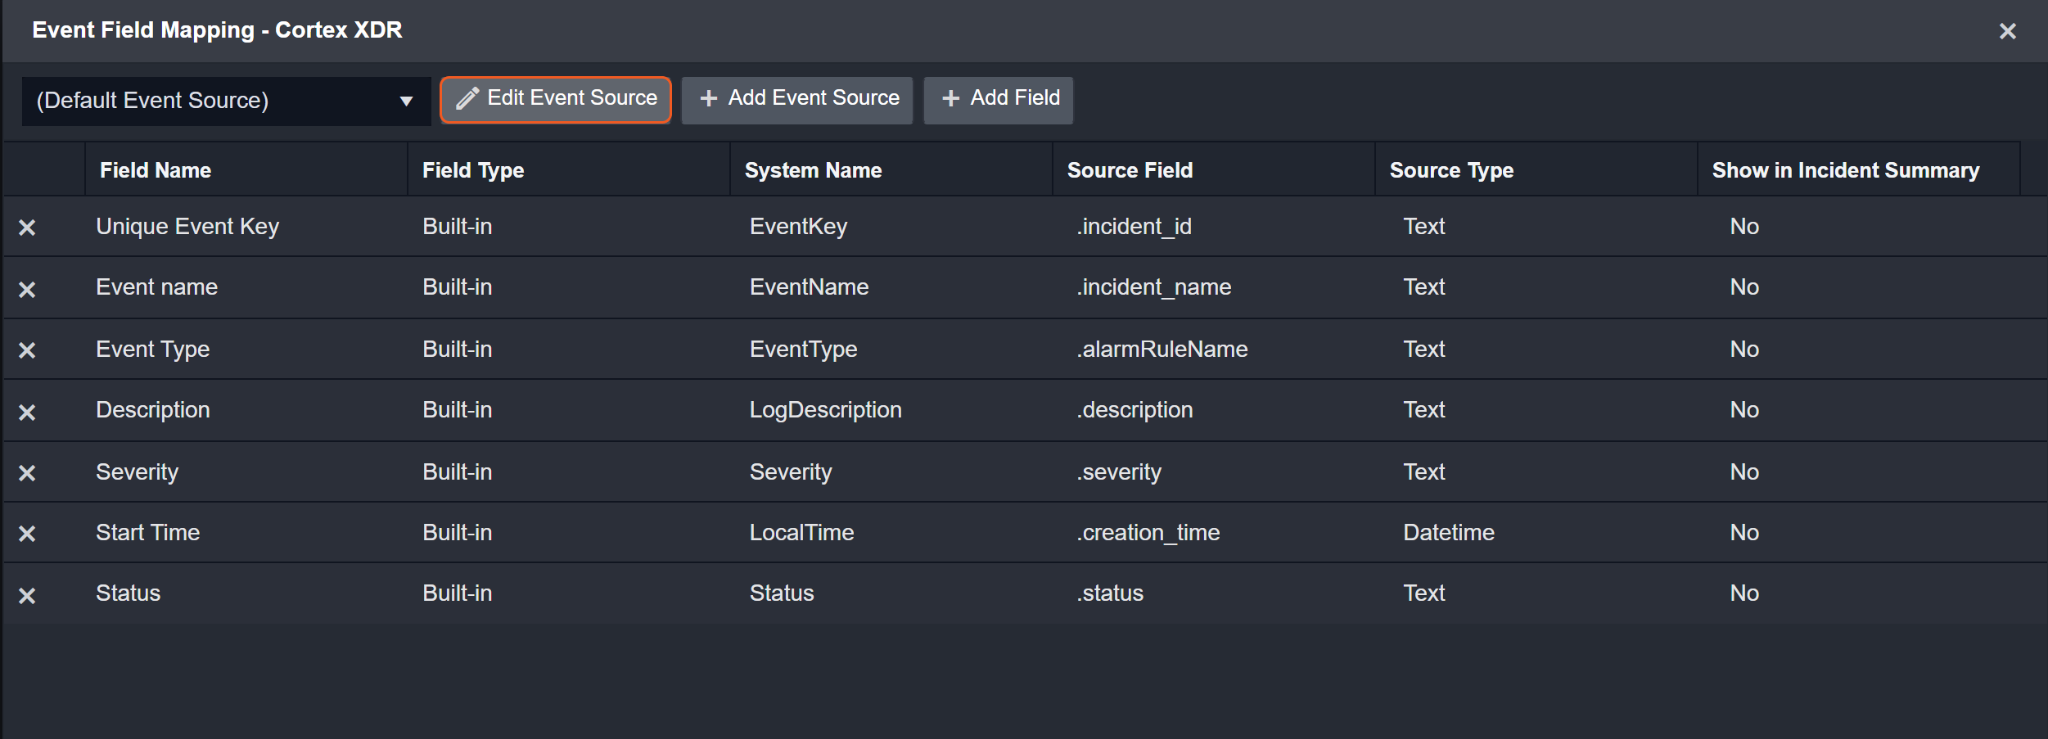
Main Event JSON Path: $
The root array contains the event objects. Within each object, the key incident_id denotes the Unique Key field. As such, the full JSONPath expression to extract the Unique Key is $.incident_id.Alert Event Source for Incident
The D3 system configures the field mappings which are specific to the incident alert-related events. If a source field in the field mapping is not found, the corresponding field mapping will be ignored. Because the eventType field in the raw data for Incident Alerts consistently has the value IncidentAlerts, these events can be identified by the Search String: {$.eventType}=IncidentAlerts. Click Edit Event Source to view the Search String.
.png?inst-v=a9107af0-b04c-4e31-bb5a-938372783868)
The pre-configured event field mappings are detailed below:
Field Name | Source Field |
Default Event Source (Main Event JSON Path: $) | |
Unique Key | .incident_id |
Title | .incident_name |
Event Type | .alarmRuleName |
Description | .description |
Severity | .severity |
Start Time | .creation_time |
Status | .status |
Tactics | .mitre_tactics_ids_and_names |
Techniques | .mitre_techniques_ids_and_names |
Alert Event Source for Incident (Search String: {$.eventType}=IncidentAlerts) The search string format is {$.eventType}=IncidentAlerts. If the value of the eventType key is IncidentAlerts in the event object under raw data, then the incident alert-related events will use the field mapping below. | |
Document ID | .alert_id |
Start Time | .detection_timestamp |
Source | .source |
Description | .description |
Severity | .severity |
Tag | .tags |
Device | .host_name |
Device IP address | .host_ip |
Event name | .name |
Alert type | .alert_type |
Techniques | .mitre_technique_id_and_name |
Tactics | .mitre_tactic_id_and_name |
Agent version | .agent_version |
Agent Device Domain | .agent_device_domain |
Agent FQDN | .agent_fqdn |
Agent OS | .agent_os_type |
Agent MAC | .mac |
Actor Process Instance Id | .actor_process_instance_id |
URL | .malicious_urls |
Event category | .category |
Action | .action |
Endpoint ID | .endpoint_id |
Alert Event ID | .event_id |
Actor Process Image Path | .actor_process_image_path |
Actor Process Image Name | .actor_process_image_name |
Actor Process Command Line | .actor_process_command_line |
Actor Process Image SHA256 | .actor_process_image_sha256 |
Actor Process Image MD5 | .actor_process_image_md5 |
Actor Process Causality ID | .actor_process_causality_id |
Actor Process OS PID | .actor_process_os_pid |
Actor Thread ID | .actor_thread_thread_id |
Action Local IP | .action_local_ip |
Action Local Port | .action_local_port |
Action Remote IP | .action_remote_ip |
Action_Remote_Port | .action_remote_port |
External ID | .external_id |
Rule ID | .matching_service_rule_id |
Case ID | .case_id |
Error Handling
If the Return Data is Failed, an Error tab will appear in the Test Result window.
The error tab contains the details responded from D3 SOAR or third-party API calls, including Failure Indicator, Status Code, and Message. This can help locate the root cause of a command failure.
Parts in Error | Description | Example |
Failure Indicator | Indicates the command failure that happened at a specific input and/or API call. | Fetch Incident failed. |
Status Code | The response code issued by the third-party API server or the D3 SOAR system that can be used to locate the corresponding error category. For example, if the returned status code is 401, the selected connection is unauthorized to run the command. The user or system support would need to check the permission setting in the Cortex XDR portal. Refer to the HTTP Status Code Registry for details. | Status Code: 400. |
Message | The raw data or captured key error message from the integration API server about the API request failure. | Message: Invalid Filter. |
Error Sample Data Fetch Incident failed. Status Code: 400. Message: Invalid Filter. |
Get Action Status
Retrieves the status of requested actions by their Action IDs.
Input
Input Parameter | Required/Optional | Description | Example |
Action IDs | Required | The IDs of the requested actions whose statuses are to be retrieved. |
JSON
|
Output
To view the sample output data for all commands, refer to this article.
Error Handling
If the Return Data displays Partially Successful or Failed, an Error tab will appear in the Test Result window.
The error tab contains the details responded from D3 SOAR or third-party API calls, including Failure Indicator, Status Code, and Message. This can help locate the root cause of a command failure.
Parts in Error | Description | Example |
Failure Indicator | Indicates the command failure that happened at a specific input and/or API call. | Get Action Status failed. |
Status Code | The response code issued by the third-party API server or the D3 SOAR system that can be used to locate the corresponding error category. For example, if the returned status code is 401, the selected connection is unauthorized to run the command. The user or system support would need to check the permission setting in the Cortex XDR portal. Refer to the HTTP Status Code Registry for details. | Status Code: 403. |
Message | The raw data or captured key error message from the integration API server about the API request failure. | Message: Bad request. |
Error Sample Data Get Action Status failed. Status Code: 403. Message: Bad request. |
Get Incident Details
Retrieves additional information on the specified incidents, including alerts and key artifacts.
READER NOTE
Incident IDs is a required parameter to run this command.
Run the Fetch Incident command with the desired filters to obtain the Incident IDs. Incident IDs can be found in the raw data at the path $.reply.incidents[*].incident_id.
Input
Input Parameter | Required/Optional | Description | Example |
Incident IDs | Required | The IDs of the incidents for which to retrieve details. Incident IDs can be obtained using the Fetch Incident command with the desired filters. |
JSON
|
Alerts Limit | Optional | The maximum number of related alerts from each incident to retrieve. By default, the value is set to 1000. | 3 |
Output
To view the sample output data for all commands, refer to this article.
Error Handling
If the Return Data is Partially Successful or Failed, an Error tab will appear in the Test Result window.
The error tab contains the details responded from D3 SOAR or third-party API calls, including Failure Indicator, Status Code, and Message. This can help locate the root cause of a command failure.
Parts in Error | Description | Example |
Failure Indicator | Indicates the command failure that happened at a specific input and/or API call. | Get Incident Details failed. |
Status Code | The response code issued by the third-party API server or the D3 SOAR system that can be used to locate the corresponding error category. For example, if the returned status code is 401, the selected connection is unauthorized to run the command. The user or system support would need to check the permission setting in the Cortex XDR portal. Refer to the HTTP Status Code Registry for details. | Status Code: 404. |
Message | The raw data or captured key error message from the integration API server about the API request failure. | Message: Incident IDs Not Found. |
Error Sample Data Get Incident Details failed. Status Code: 404. Message: Incident IDs Not Found. |
Get IOCs
Retrieves a list of indicators (IOCs) that match the specified filters. All filter conditions are combined using AND logic. This command requires Cortex XDR version 4.2 or later with the appropriate license.
Input
Input Parameter | Required/Optional | Description | Example |
Indicators | Optional | Filters the results by the specified indicators. Only IOCs matching these indicators will be retrieved. |
JSON
|
Indicator Type | Optional | Filters the results by the specified indicator type. Available options are:
Only IOCs matching the indicator type will be retrieved. | Hash |
Severity | Optional | Filters the results by the specified indicator severity. Available options are:
Only IOCs matching the indicator severity will be retrieved. | Info |
Reputation | Optional | Filters the results by the specified indicator reputation. Available options are:
Only IOCs matching the indicator reputation will be retrieved. | Good |
Reliability | Optional | Filters the results by the specified indicator reliability grade. Available options are:
Only IOCs matching the indicator reliability grade will be retrieved. | A |
Offset | Optional | The integer that sets the starting offset in the query result set. The API returns indicators in a zero-based list. Indicators with indexes less than this value are excluded. By default, the value is 0. | 10 |
Number of IOCs to Return | Optional | The integer that sets the ending offset in the result set. The API excludes indicators with indexes greater than this value. By default, the value is unbounded, and all indicators through the end of the list will be returned. | 10 |
Output
To view the sample output data for all commands, refer to this article.
Error Handling
If the Return Data displays Failed, an Error tab will appear in the Test Result window.
The error tab contains the details responded from D3 SOAR or third-party API calls, including Failure Indicator, Status Code, and Message. This can help locate the root cause of a command failure.
Parts in Error | Description | Example |
Failure Indicator | Indicates the command failure that happened at a specific input and/or API call. | Get IOCs failed. |
Status Code | The response code issued by the third-party API server or the D3 SOAR system that can be used to locate the corresponding error category. For example, if the returned status code is 401, the selected connection is unauthorized to run the command. The user or system support would need to check the permission setting in the Cortex XDR portal. Refer to the HTTP Status Code Registry for details. | Status Code: 403. |
Message | The raw data or captured key error message from the integration API server about the API request failure. | Message: Forbidden. |
Error Sample Data Get IOCs failed. Status Code: 403. Message: Forbidden. |
Get Script Result Files
Retrieves files collected from a specific endpoint during a script execution.
READER NOTE
Endpoint ID is a required parameter to run this command.
Run the Search Hosts command to obtain the Endpoint ID. Endpoint IDs can be found in the returned raw data at the path $.reply.endpoints[*].endpoint_id.
Input
Input Parameter | Required/Optional | Description | Example |
Action ID | Required | The ID of the script execution action for which to retrieve results. Action ID can be obtained from the Cortex XDR console under Response > Action Center > Action ID field. | ***** |
Endpoint ID | Required | The ID of the endpoint on which the script was executed. Endpoint ID can be obtained using the Search Hosts command. | ***** |
Output
To view the sample output data for all commands, refer to this article.
Error Handling
If the Return Data displays Failed, an Error tab will appear in the Test Result window.
The error tab contains the details responded from D3 SOAR or third-party API calls, including Failure Indicator, Status Code, and Message. This can help locate the root cause of a command failure.
Parts in Error | Description | Example |
Failure Indicator | Indicates the command failure that happened at a specific input and/or API call. | Get Script Results failed. |
Status Code | The response code issued by the third-party API server or the D3 SOAR system that can be used to locate the corresponding error category. For example, if the returned status code is 401, the selected connection is unauthorized to run the command. The user or system support would need to check the permission setting in the Cortex XDR portal. Refer to the HTTP Status Code Registry for details. | Status Code: 403. |
Message | The raw data or captured key error message from the integration API server about the API request failure. | Message: Bad request. |
Error Sample Data Get Script Results failed. Status Code: 403. Message: Bad request. |
Get XQL Query Quota
Retrieves the amount of query quota available and used for this tenant, including the number of daily running queries, the number of active queries, and the number of queries run concurrently today on this tenant.
Input
N/A
Output
To view the sample output data for all commands, refer to this article.
Error Handling
If the Return Data displays Failed, an Error tab will appear in the Test Result window.
The error tab contains the details responded from D3 SOAR or third-party API calls, including Failure Indicator, Status Code, and Message. This can help locate the root cause of a command failure.
Parts in Error | Description | Example |
Failure Indicator | Indicates the command failure that happened at a specific input and/or API call. | Get XQL Query Quota failed. |
Status Code | The response code issued by the third-party API server or the D3 SOAR system that can be used to locate the corresponding error category. For example, if the returned status code is 401, the selected connection is unauthorized to run the command. The user or system support would need to check the permission setting in the Cortex XDR portal. Refer to the HTTP Status Code Registry for details. | Status Code: 403. |
Message | The raw data or captured key error message from the integration API server about the API request failure. | Message: Bad request. |
Error Sample Data Get XQL Query Quota failed. Status Code: 403. Message: Bad request. |
Get XQL Query Results
Retrieves the results of an executed XQL query. The maximum result set size is 1,000.
READER NOTE
Query IDs is a required parameter to run this command.
Run the Start XQL Query command to obtain the Query IDs. Query IDs can be found in the raw data at the path $.results[*].reply.query_id.
Input
Input Parameter | Required/Optional | Description | Example |
Query IDs | Required | The IDs of the executed XQL queries for which to retrieve results. Query IDs can be obtained using the Start XQL Query command. |
JSON
|
Output
To view the sample output data for all commands, refer to this article.
Error Handling
If the Return Data displays Failed, an Error tab will appear in the Test Result window.
The error tab contains the details responded from D3 SOAR or third-party API calls, including Failure Indicator, Status Code, and Message. This can help locate the root cause of a command failure.
Parts in Error | Description | Example |
Failure Indicator | Indicates the command failure that happened at a specific input and/or API call. | Get XQL Query Results failed. |
Status Code | The response code issued by the third-party API server or the D3 SOAR system that can be used to locate the corresponding error category. For example, if the returned status code is 401, the selected connection is unauthorized to run the command. The user or system support would need to check the permission setting in the Cortex XDR portal. Refer to the HTTP Status Code Registry for details. | Status Code: 403. |
Message | The raw data or captured key error message from the integration API server about the API request failure. | Message: Bad request. |
Error Sample Data Get XQL Query Results failed. Status Code: 403. Message: Bad request. |
Get XQL Query Results Stream
Retrieves XQL query results with more than 1000 results.
READER NOTE
Stream ID is a required parameter to run this command.
Run the Get XQL Query Results command to obtain the Stream ID.
Input
Input Parameter | Required/Optional | Description | Example |
Stream ID | Required | The unique stream ID generated in the response to the Get XQL Query Results command. | ***** |
Is Gzip Compressed | Optional | Whether the response should be compressed and gzipped. | False |
Output
To view the sample output data for all commands, refer to this article.
Error Handling
If the Return Data displays Failed, an Error tab will appear in the Test Result window.
The error tab contains the details responded from D3 SOAR or third-party API calls, including Failure Indicator, Status Code, and Message. This can help locate the root cause of a command failure.
Parts in Error | Description | Example |
Failure Indicator | Indicates the command failure that happened at a specific input and/or API call. | Get XQL Query Results Stream failed. |
Status Code | The response code issued by the third-party API server or the D3 SOAR system that can be used to locate the corresponding error category. For example, if the returned status code is 401, the selected connection is unauthorized to run the command. The user or system support would need to check the permission setting in the Cortex XDR portal. Refer to the HTTP Status Code Registry for details. | Status Code: 403. |
Message | The raw data or captured key error message from the integration API server about the API request failure. | Message: Bad request. |
Error Sample Data Get XQL Query Results Stream failed. Status Code: 403. Message: Bad request. |
Isolate Hosts
Isolates the specified endpoints.
READER NOTE
Endpoint IDs is a required parameter to run this command.
Run the Search Hosts command to obtain the Endpoint IDs. Endpoint IDs can be found in the returned raw data at the path $.reply.endpoints[*].endpoint_id.
Input
Input Parameter | Required/Optional | Description | Example |
Endpoint IDs | Required | The IDs of the endpoints to isolate. Endpoint IDs can be obtained using the Search Hosts command. |
JSON
|
Output
To view the sample output data for all commands, refer to this article.
Error Handling
If the Return Data is Failed, an Error tab will appear in the Test Result window.
The error tab contains the details responded from D3 SOAR or third-party API calls, including Failure Indicator, Status Code, and Message. This can help locate the root cause of a command failure.
Parts in Error | Description | Example |
Failure Indicator | Indicates the command failure that happened at a specific input and/or API call. | Isolate Hosts failed. |
Status Code | The response code issued by the third-party API server or the D3 SOAR system that can be used to locate the corresponding error category. For example, if the returned status code is 401, the selected connection is unauthorized to run the command. The user or system support would need to check the permission setting in the Cortex XDR portal. Refer to the HTTP Status Code Registry for details. | Status Code: 404. |
Message | The raw data or captured key error message from the integration API server about the API request failure. | Message: Endpoint IDs Not Found. |
Error Sample Data Isolate Hosts failed. Status Code: 404. Message: Endpoint IDs Not Found. |
Retrieve Files
Retrieves files from the specified endpoints. Users can retrieve up to 20 files across a maximum of 10 endpoints.
READER NOTE
Endpoint IDs is a required parameter to run this command.
Run the Search Hosts command to obtain the Endpoint IDs. Endpoint IDs can be found in the raw data at the path $.reply.endpoints[*].endpoint_id.
Input
Input Parameter | Required/Optional | Description | Example |
Endpoint IDs | Required | The IDs of the endpoints from which to retrieve files. Endpoint IDs can be obtained using the Search Hosts command. |
JSON
|
OS | Required | The operating system of the endpoints associated with the files. Available options are:
| Window |
File Paths | Required | The file paths of the files to retrieve. |
JSON
|
Output
To view the sample output data for all commands, refer to this article.
Error Handling
If the Return Data displays Failed, an Error tab will appear in the Test Result window.
The error tab contains the details responded from D3 SOAR or third-party API calls, including Failure Indicator, Status Code, and Message. This can help locate the root cause of a command failure.
Parts in Error | Description | Example |
Failure Indicator | Indicates the command failure that happened at a specific input and/or API call. | Retrieve Files failed. |
Status Code | The response code issued by the third-party API server or the D3 SOAR system that can be used to locate the corresponding error category. For example, if the returned status code is 401, the selected connection is unauthorized to run the command. The user or system support would need to check the permission setting in the Cortex XDR portal. Refer to the HTTP Status Code Registry for details. | Status Code: 403. |
Message | The raw data or captured key error message from the integration API server about the API request failure. | Message: Bad request. |
Error Sample Data Retrieve Files failed. Status Code: 403. Message: Bad request. |
Retrieve PCAP Packet
Retrieves a list of alert IDs and the associated PCAP triggering packets of PAN NGFW type alerts.
Input
Input Parameter | Required/Optional | Description | Example |
Creation Time | Optional | The start time of the creation time range for which to return alerts. The input time corresponds to the creation time field in UTC. | 2019-12-22 14:15:09 |
Severities | Optional | The severity levels of the alerts to return. |
JSON
|
Alert Sources | Optional | The sources of the alerts to return. | No sample data |
Alert IDs | Optional | The IDs of the alerts to return. | No sample data |
Limit | Optional | The number of alerts to return. | 5 |
Output
To view the sample output data for all commands, refer to this article.
Error Handling
If the Return Data displays Failed, an Error tab will appear in the Test Result window.
The error tab contains the details responded from D3 SOAR or third-party API calls, including Failure Indicator, Status Code, and Message. This can help locate the root cause of a command failure.
Parts in Error | Description | Example |
Failure Indicator | Indicates the command failure that happened at a specific input and/or API call. | Retrieve PCAP Packet failed. |
Status Code | The response code issued by the third-party API server or the D3 SOAR system that can be used to locate the corresponding error category. For example, if the returned status code is 401, the selected connection is unauthorized to run the command. The user or system support would need to check the permission setting in the Cortex XDR portal. Refer to the HTTP Status Code Registry for details. | Status Code: 403. |
Message | The raw data or captured key error message from the integration API server about the API request failure. | Message: Bad request. |
Error Sample Data Retrieve PCAP Packet failed. Status Code: 403. Message: Bad request. |
Run Script
Initiates a new script execution action on specified endpoints using the provided snippet code.
READER NOTE
Endpoint IDs is a required parameter to run this command.
Run the Search Hosts command to obtain the Endpoint IDs. Endpoint IDs can be found in the returned raw data at the path $.reply.endpoints[*].endpoint_id.
Input
Input Parameter | Required/Optional | Description | Example |
Endpoint IDs | Required | The IDs of the endpoints on which to execute the script. Endpoint IDs can be obtained using the Search Hosts command. The script will run concurrently on all specified endpoints. |
JSON
|
Snippet Code | Required | The section of script to initiate on the endpoints. | No sample data |
Output
To view the sample output data for all commands, refer to this article.
Error Handling
If the Return Data displays Failed, an Error tab will appear in the Test Result window.
The error tab contains the details responded from D3 SOAR or third-party API calls, including Failure Indicator, Status Code, and Message. This can help locate the root cause of a command failure.
Parts in Error | Description | Example |
Failure Indicator | Indicates the command failure that happened at a specific input and/or API call. | Run Script failed. |
Status Code | The response code issued by the third-party API server or the D3 SOAR system that can be used to locate the corresponding error category. For example, if the returned status code is 401, the selected connection is unauthorized to run the command. The user or system support would need to check the permission setting in the Cortex XDR portal. Refer to the HTTP Status Code Registry for details. | Status Code: 403. |
Message | The raw data or captured key error message from the integration API server about the API request failure. | Message: Bad request. |
Error Sample Data Run Script failed. Status Code: 403. Message: Bad request. |
Scan Hosts
Runs a scan on the specified endpoints.
READER NOTE
Host Names is a required parameter to run this command.
Run the Search Hosts command to obtain the Host Names. Host Names can be found in the returned raw data at the path $.reply.endpoints[*].endpoint_name.
Input
Input Parameter | Required/Optional | Description | Example |
Host Names | Optional | The names of the endpoints to scan. Endpoint names can be obtained using the Search Hosts command. |
JSON
|
Output
To view the sample output data for all commands, refer to this article.
Error Handling
If the Return Data displays Failed, an Error tab will appear in the Test Result window.
The error tab contains the details responded from D3 SOAR or third-party API calls, including Failure Indicator, Status Code, and Message. This can help locate the root cause of a command failure.
Parts in Error | Description | Example |
Failure Indicator | Indicates the command failure that happened at a specific input and/or API call. | Scan Hosts failed. |
Status Code | The response code issued by the third-party API server or the D3 SOAR system that can be used to locate the corresponding error category. For example, if the returned status code is 401, the selected connection is unauthorized to run the command. The user or system support would need to check the permission setting in the Cortex XDR portal. Refer to the HTTP Status Code Registry for details. | Status Code: 403. |
Message | The raw data or captured key error message from the integration API server about the API request failure. | Message: Bad request. |
Error Sample Data Scan Hosts failed. Status Code: 403. Message: Bad request. |
Search Hosts
Retrieves a list of filtered endpoints. The returned endpoints are sorted by last seen time in descending order. The maximum result set size is 100.
Input
Input Parameter | Required/Optional | Description | Example |
Host Names | Optional | The names of the endpoints to return. |
JSON
|
User Names | Optional | The usernames associated with the endpoints to return. |
JSON
|
Group Names | Optional | The names of the groups to which the endpoints belong. | No sample data |
Host IPs | Optional | The IP addresses of the endpoints to return. | ***.***.***.*** |
Host Status | Optional | The status of the endpoints to return. Available options are:
| Connected |
Platform | Optional | The platform type of the endpoints to return. Available options are:
| Windows |
Isolated | Optional | The isolation status of the endpoints to return. Available options are:
| Isolated |
Last Seen After | Optional | The endpoints last seen at or after this time will be returned. | 2023-06-01 00:00 |
Last Seen Before | Optional | The endpoints last seen at or before this time will be returned. | 2023-06-10 00:00 |
Output
To view the sample output data for all commands, refer to this article.
Error Handling
If the Return Data is Failed, an Error tab will appear in the Test Result window.
The error tab contains the details responded from D3 SOAR or third-party API calls, including Failure Indicator, Status Code, and Message. This can help locate the root cause of a command failure.
Parts in Error | Description | Example |
Failure Indicator | Indicates the command failure that happened at a specific input and/or API call. | Search Hosts failed. |
Status Code | The response code issued by the third-party API server or the D3 SOAR system that can be used to locate the corresponding error category. For example, if the returned status code is 401, the selected connection is unauthorized to run the command. The user or system support would need to check the permission setting in the Cortex XDR portal. Refer to the HTTP Status Code Registry for details. | Status Code: 404. |
Message | The raw data or captured key error message from the integration API server about the API request failure. | Message: Host Names Not Found. |
Error Sample Data Search Hosts failed. Status Code: 404. Message: Host Names Not Found. |
Start XQL Query
Executes an XQL query. For guidance on constructing and executing XQL queries, refer to Running XQL Query APIs.
Input
Input Parameter | Required/Optional | Description | Example |
Start Time | Required | The start time of the query time range (in UTC). | 2019-12-22 14:15:09 |
End Time | Optional | The end time of the query time range (in UTC). | 2019-12-23 14:15:09 |
Query | Required | The XQL query string to execute. |
SQL
|
Output
To view the sample output data for all commands, refer to this article.
Error Handling
If the Return Data displays Failed, an Error tab will appear in the Test Result window.
The error tab contains the details responded from D3 SOAR or third-party API calls, including Failure Indicator, Status Code, and Message. This can help locate the root cause of a command failure.
Parts in Error | Description | Example |
Failure Indicator | Indicates the command failure that happened at a specific input and/or API call. | Start XQL Query failed. |
Status Code | The response code issued by the third-party API server or the D3 SOAR system that can be used to locate the corresponding error category. For example, if the returned status code is 401, the selected connection is unauthorized to run the command. The user or system support would need to check the permission setting in the Cortex XDR portal. Refer to the HTTP Status Code Registry for details. | Status Code: 403. |
Message | The raw data or captured key error message from the integration API server about the API request failure. | Message: Bad request. |
Error Sample Data Start XQL Query failed. Status Code: 403. Message: Bad request. |
Unisolate Hosts
Removes the specified endpoints from isolation.
READER NOTE
Endpoint IDs is a required parameter to run this command.
Run the Search Hosts command to obtain the Endpoint IDs. Endpoint IDs can be found in the returned raw data at the path $.reply.endpoints[*].endpoint_id.
Input
Input Parameter | Required/Optional | Description | Example |
Endpoint IDs | Required | The IDs of the endpoints to remove from isolation. Endpoint IDs can be obtained using the Search Hosts command. |
JSON
|
Output
To view the sample output data for all commands, refer to this article.
Error Handling
If the Return Data is Failed, an Error tab will appear in the Test Result window.
The error tab contains the details responded from D3 SOAR or third-party API calls, including Failure Indicator, Status Code, and Message. This can help locate the root cause of a command failure.
Parts in Error | Description | Example |
Failure Indicator | Indicates the command failure that happened at a specific input and/or API call. | Unisolate Hosts failed. |
Status Code | The response code issued by the third-party API server or the D3 SOAR system that can be used to locate the corresponding error category. For example, if the returned status code is 401, the selected connection is unauthorized to run the command. The user or system support would need to check the permission setting in the Cortex XDR portal. Refer to the HTTP Status Code Registry for details. | Status Code: 404. |
Message | The raw data or captured key error message from the integration API server about the API request failure. | Message: Endpoint IDs Not Found. |
Error Sample Data Unisolate Hosts failed. Status Code: 404. Message: Endpoint IDs Not Found. |
Update Incidents
Updates incidents in Cortex XDR.
READER NOTE
Incident IDs is a required parameter to run this command.
Run the Fetch Incident command with the desired filters to obtain the Incident IDs. Incident IDs can be found in the raw data at the path $.reply.incidents[*].incident_id.
Input
Input Parameter | Required/Optional | Description | Example |
Incident IDs | Required | The IDs of the incidents to update. Incident IDs can be obtained using the Fetch Incident command with the desired filters. |
JSON
|
Assigned User Mail | Optional | The updated email address of the incident's assignee. | ***@*****.*** |
Assigned User Name | Optional | The updated user name of the incident's assignee. This parameter is ignored when the Assigned User Mail parameter is not defined. | Sample Name |
Status | Optional | The updated status of the specified incidents. | Resolved Known Issue |
Severity | Optional | The updated severity level of the specified incidents. Available options are:
| High |
Comment | Optional | The updated comment for the specified incidents. | Comment on the incident |
Update Data | Optional | The array of fields and data to update to the specified incidents. When this parameter is defined, all other input parameters will be ignored. For more details about the input syntax, refer to the "update_data" field's description in Update an Incident from Palo Alto's documentation. |
JSON
|
Output
To view the sample output data for all commands, refer to this article.
Error Handling
If the Return Data is Failed, an Error tab will appear in the Test Result window.
The error tab contains the details responded from D3 SOAR or third-party API calls, including Failure Indicator, Status Code, and Message. This can help locate the root cause of a command failure.
Parts in Error | Description | Example |
Failure Indicator | Indicates the command failure that happened at a specific input and/or API call. | Update Incidents failed. |
Status Code | The response code issued by the third-party API server or the D3 SOAR system that can be used to locate the corresponding error category. For example, if the returned status code is 401, the selected connection is unauthorized to run the command. The user or system support would need to check the permission setting in the Cortex XDR portal. Refer to the HTTP Status Code Registry for details. | Status Code: 404. |
Message | The raw data or captured key error message from the integration API server about the API request failure. | Message: Incident IDs Not Found. |
Error Sample Data Update Incidents failed. Status Code: 404. Message: Incident IDs Not Found. |
Update IOCs
Updates an existing indicator based on the provided rule ID. This command requires Cortex XDR version 4.2 or later with the appropriate license.
Input
Input Parameter | Required/Optional | Description | Example |
Rule ID | Required | The rule ID of the indicator to be updated. Rule ID can be obtained using the Get IOCs command. | 57 |
Indicator | Optional | The updated indicator value. | virus2.exe |
Indicator Type | Optional | The updated indicator type. Available options are:
| Filename |
Severity | Optional | The updated severity. Available options are:
| Info |
Expiration Date | Optional | The updated expiration date and time (in UTC). | 2026-01-01 12:00 AM |
Enable Default Expiration | Optional | The option to enable the default expiration date for indicators when set to True. By default, the value is False. | No |
Comment | Optional | The updated comment. | Test |
Reputation | Optional | The updated reputation. Available options are:
| Good |
Reliability | Optional | The updated reliability grade. Available options are:
| A |
Output
To view the sample output data for all commands, refer to this article.
Error Handling
If the Return Data displays Partially Successful or Failed, an Error tab will appear in the Test Result window.
The error tab contains the details responded from D3 SOAR or third-party API calls, including Failure Indicator, Status Code, and Message. This can help locate the root cause of a command failure.
Parts in Error | Description | Example |
Failure Indicator | Indicates the command failure that happened at a specific input and/or API call. | Update IOCs failed. |
Status Code | The response code issued by the third-party API server or the D3 SOAR system that can be used to locate the corresponding error category. For example, if the returned status code is 401, the selected connection is unauthorized to run the command. The user or system support would need to check the permission setting in the Cortex XDR portal. Refer to the HTTP Status Code Registry for details. | Status Code: 403. |
Message | The raw data or captured key error message from the integration API server about the API request failure. | Message: Forbidden. |
Error Sample Data Update IOCs failed. Status Code: 403. Message: Forbidden. |
Test Connection
Allows users to perform a health check on an integration connection. Users can schedule a periodic health check by selecting Connection Health Check when editing an integration connection.
Input
N/A
Output
Output Type | Description | Return Data Type |
Return Data | Indicates one of the possible command execution states: Successful or Failed. The Failed state can be triggered by any of the following errors:
More details about an error can be viewed in the Error tab. | String |
Error Handling
If the Return Data is Failed, an Error tab will appear in the Test Result window.
The error tab contains the details responded from D3 SOAR or third-party API calls, including Failure Indicator, Status Code, and Message. This can help locate the root cause of a command failure.
Parts in Error | Description | Example |
Failure Indicator | Indicates the command failure that happened at a specific input and/or API call. | Test Connection failed. Failed to check the connector. |
Status Code | The response code issued by the third-party API server or the D3 SOAR system that can be used to locate the corresponding error category. For example, if the returned status code is 401, the selected connection is unauthorized to run the command. The user or system support would need to check the permission setting in the Cortex XDR portal. Refer to the HTTP Status Code Registry for details. | Status Code: 403. |
Message | The raw data or captured key error message from the integration API server about the API request failure. | Message: Max retries exceeded with url: /public_api/v1/incidents/get_incidents. |
Error Sample Data Test Connection failed. Failed to check the connector. Status Code: 403. Message: Max retries exceeded with url: /public_api/v1/incidents/get_incidents. |