
Corelight
LAST UPDATED: AUG 18, 2025
Overview
Corelight is a cybersecurity company that provides network detection and response (NDR) solutions based on the open-source Zeek (formerly Bro) network monitoring framework. Corelight transforms network traffic into rich logs, extracted files, and security insights, making it easier for SOC analysts, threat hunters, and incident responders to detect and investigate threats.
D3 SOAR is providing REST operations to function with Corelight.
Corelight is available for use in:
Known Limitations
The Investigator API enforces the following rate limits:
Per minute: 100 requests
Per hour: 1500 requests
Per day: 36,000 requests
Exceeding these limits returns the 429 Too Many Requests error.
Connection
To connect to Corelight from D3 SOAR, follow this part to collect the required information below:
Parameter | Description | Example |
Server URL | The base server URL for the API. | https://eu.api.investigator.corelight.com |
API Key | The API key used to authenticate the API connection. | Clsk*****22pR |
Configuring Corelight to Work with D3 SOAR
Log into the Corelight Investigator UI using administrator credentials.
Navigate to System Settings > General Settings.
Under API Keys, click New Key.
Enter a name or description for the key.
Verify that read-only permissions are enabled for Detections and Alerts.
Click Create Key, then immediately save the key as it will not be recoverable past this point. Refer to sub-step 2 under step 3i in Configuring D3 SOAR to Work with Corelight.
READER NOTE
Read-only permissions for Detections and Alerts are enabled by default in version 1.0.0.
Only one API key is supported at a time.
Configuring D3 SOAR to Work with Corelight
Log in to D3 SOAR.
Find the Corelight integration.
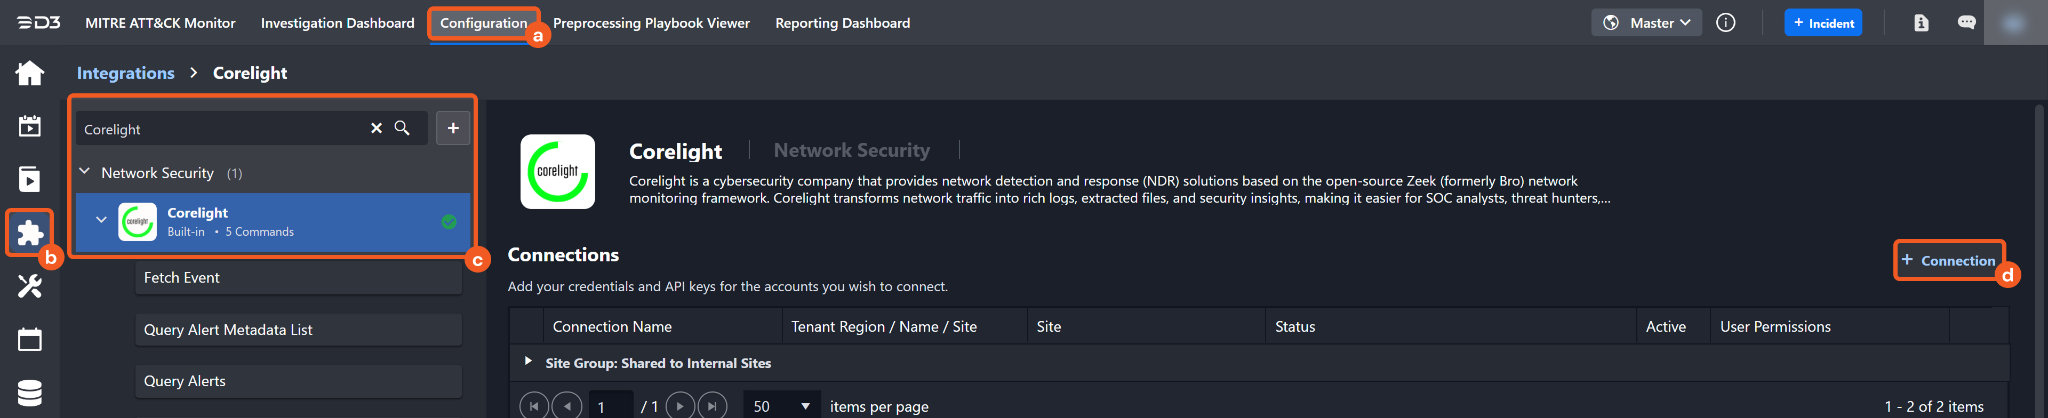
Navigate to Configuration on the top header menu.
Click on the Integration icon on the left sidebar.
Type Corelight in the search box to find the integration, then click it to select it.
Click on the + Connection button on the right side of the Connections section. A new connection window will appear.
Configure the following fields to create a connection to Corelight.
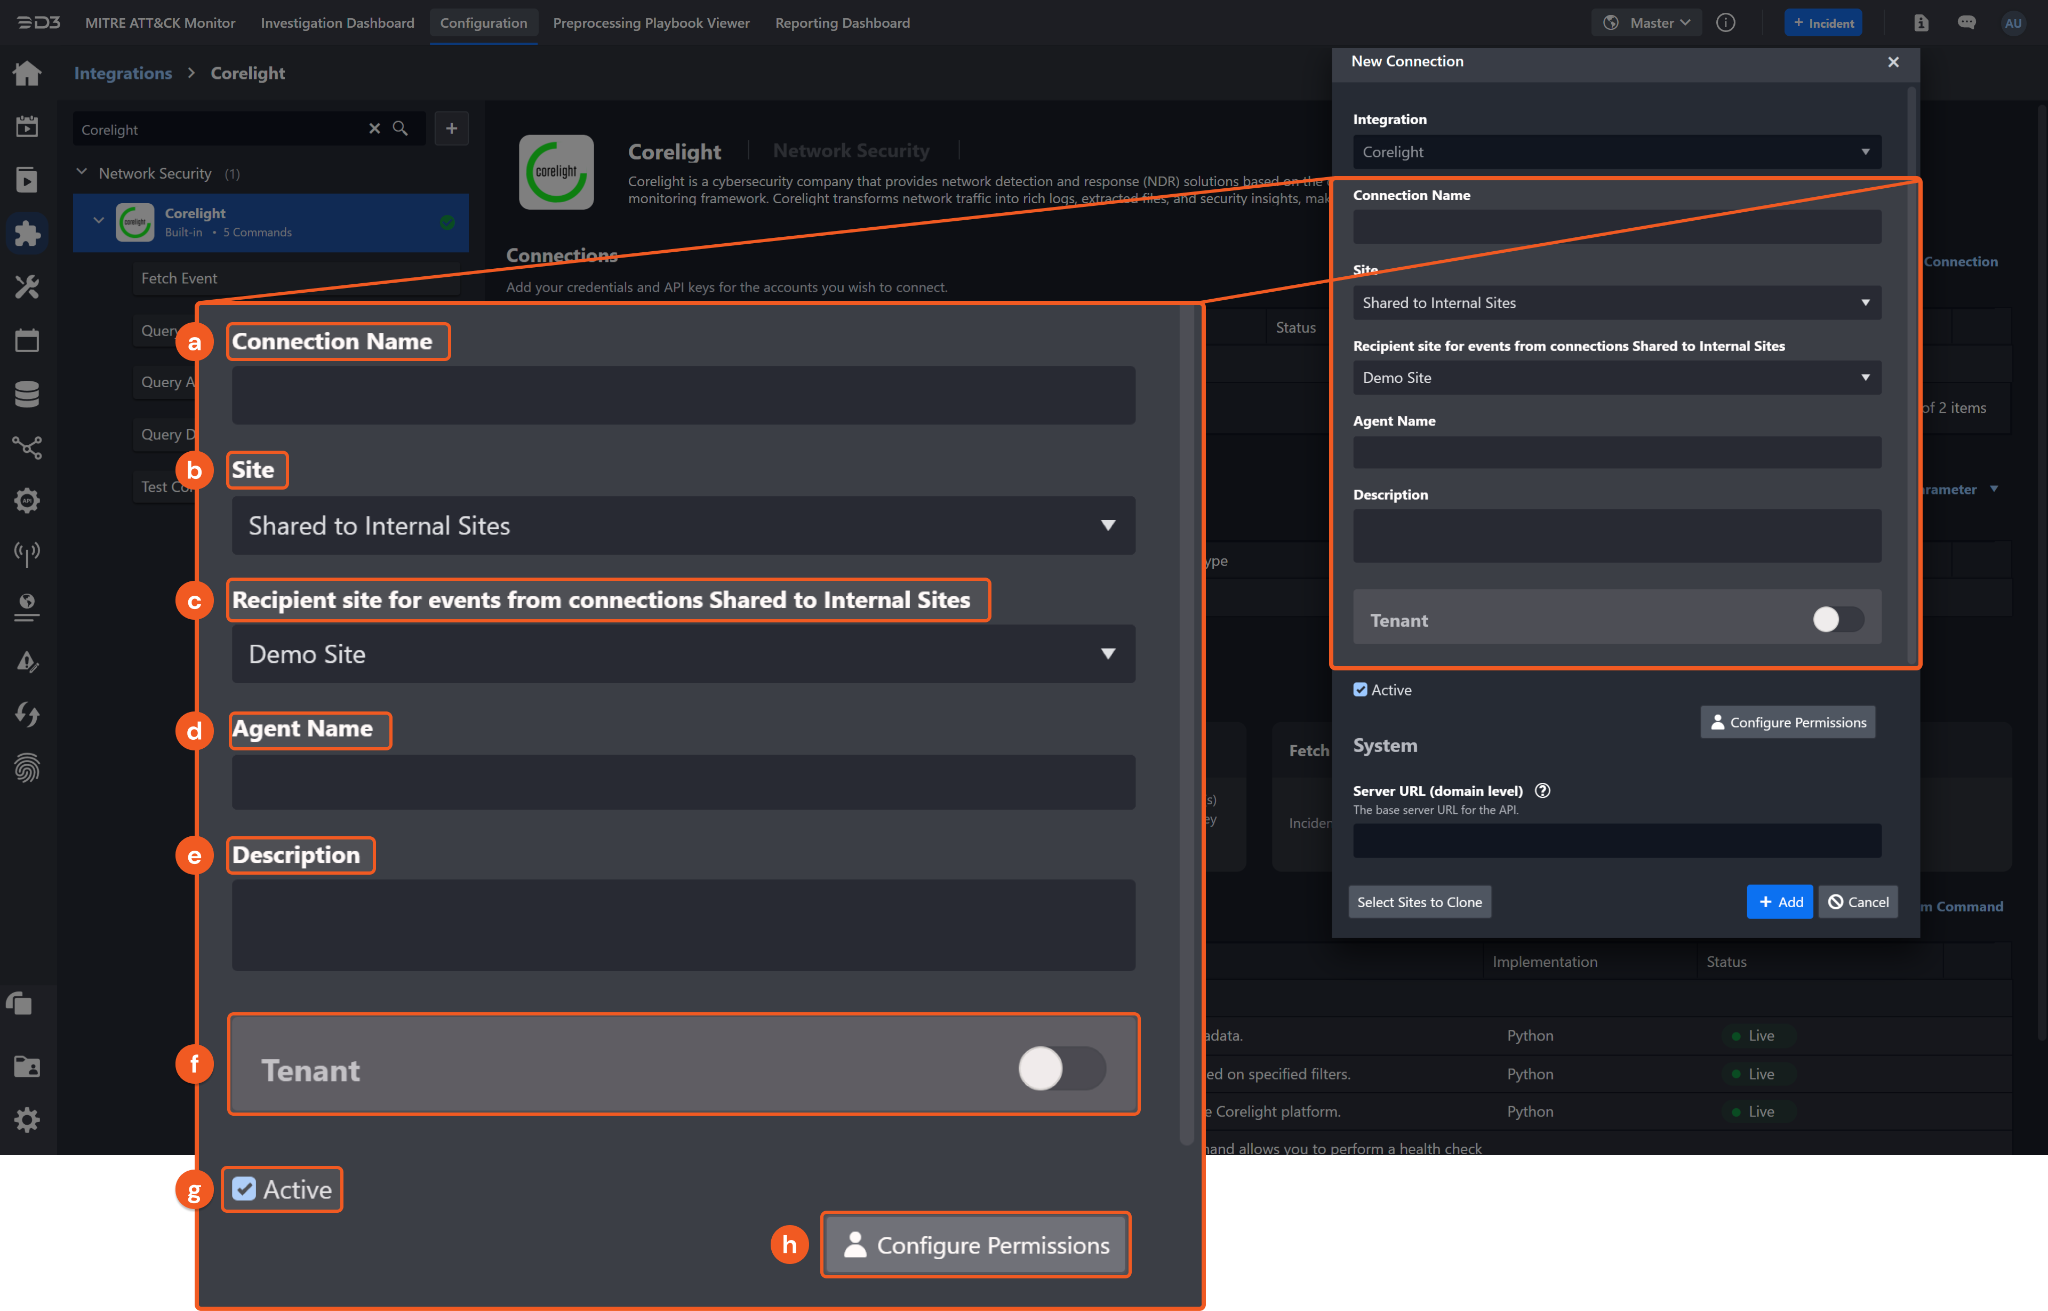
Connection Name: The desired name for the connection.
Site: The site on which to use the integration connection. Use the drop-down menu to select the site. The Share to Internal Sites option enables all internal sites to use the connection. Selecting a specific site will only enable that site to use the connection.
Recipient site for events from connections Shared to Internal Sites: This field is displayed when Share to Internal Sites is selected for the Site field, allowing selection of the internal site for deploying the integration connection.
Agent Name (Optional): The proxy agent required to build the connection. Use the dropdown menu to select the proxy agent from a list of previously configured proxy agents.
Description (Optional): The description for the connection.
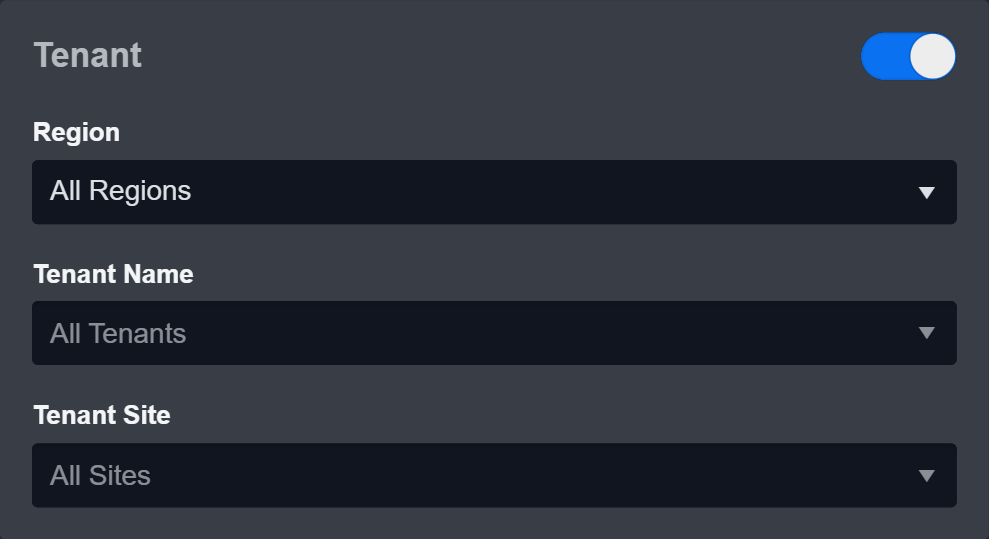
Tenant (Optional): When configuring the connection from a master tenant site, users can choose the specific tenant sites with which to share the connection. Once this setting is enabled, users can filter and select the desired tenant sites from the dropdowns to share the connection.
Active: The checkbox that enables the connection to be used when selected.
Configure User Permissions: Defines which users have access to the connection.
System: This section contains the parameters defined specifically for the integration. These parameters must be configured to create the integration connection.
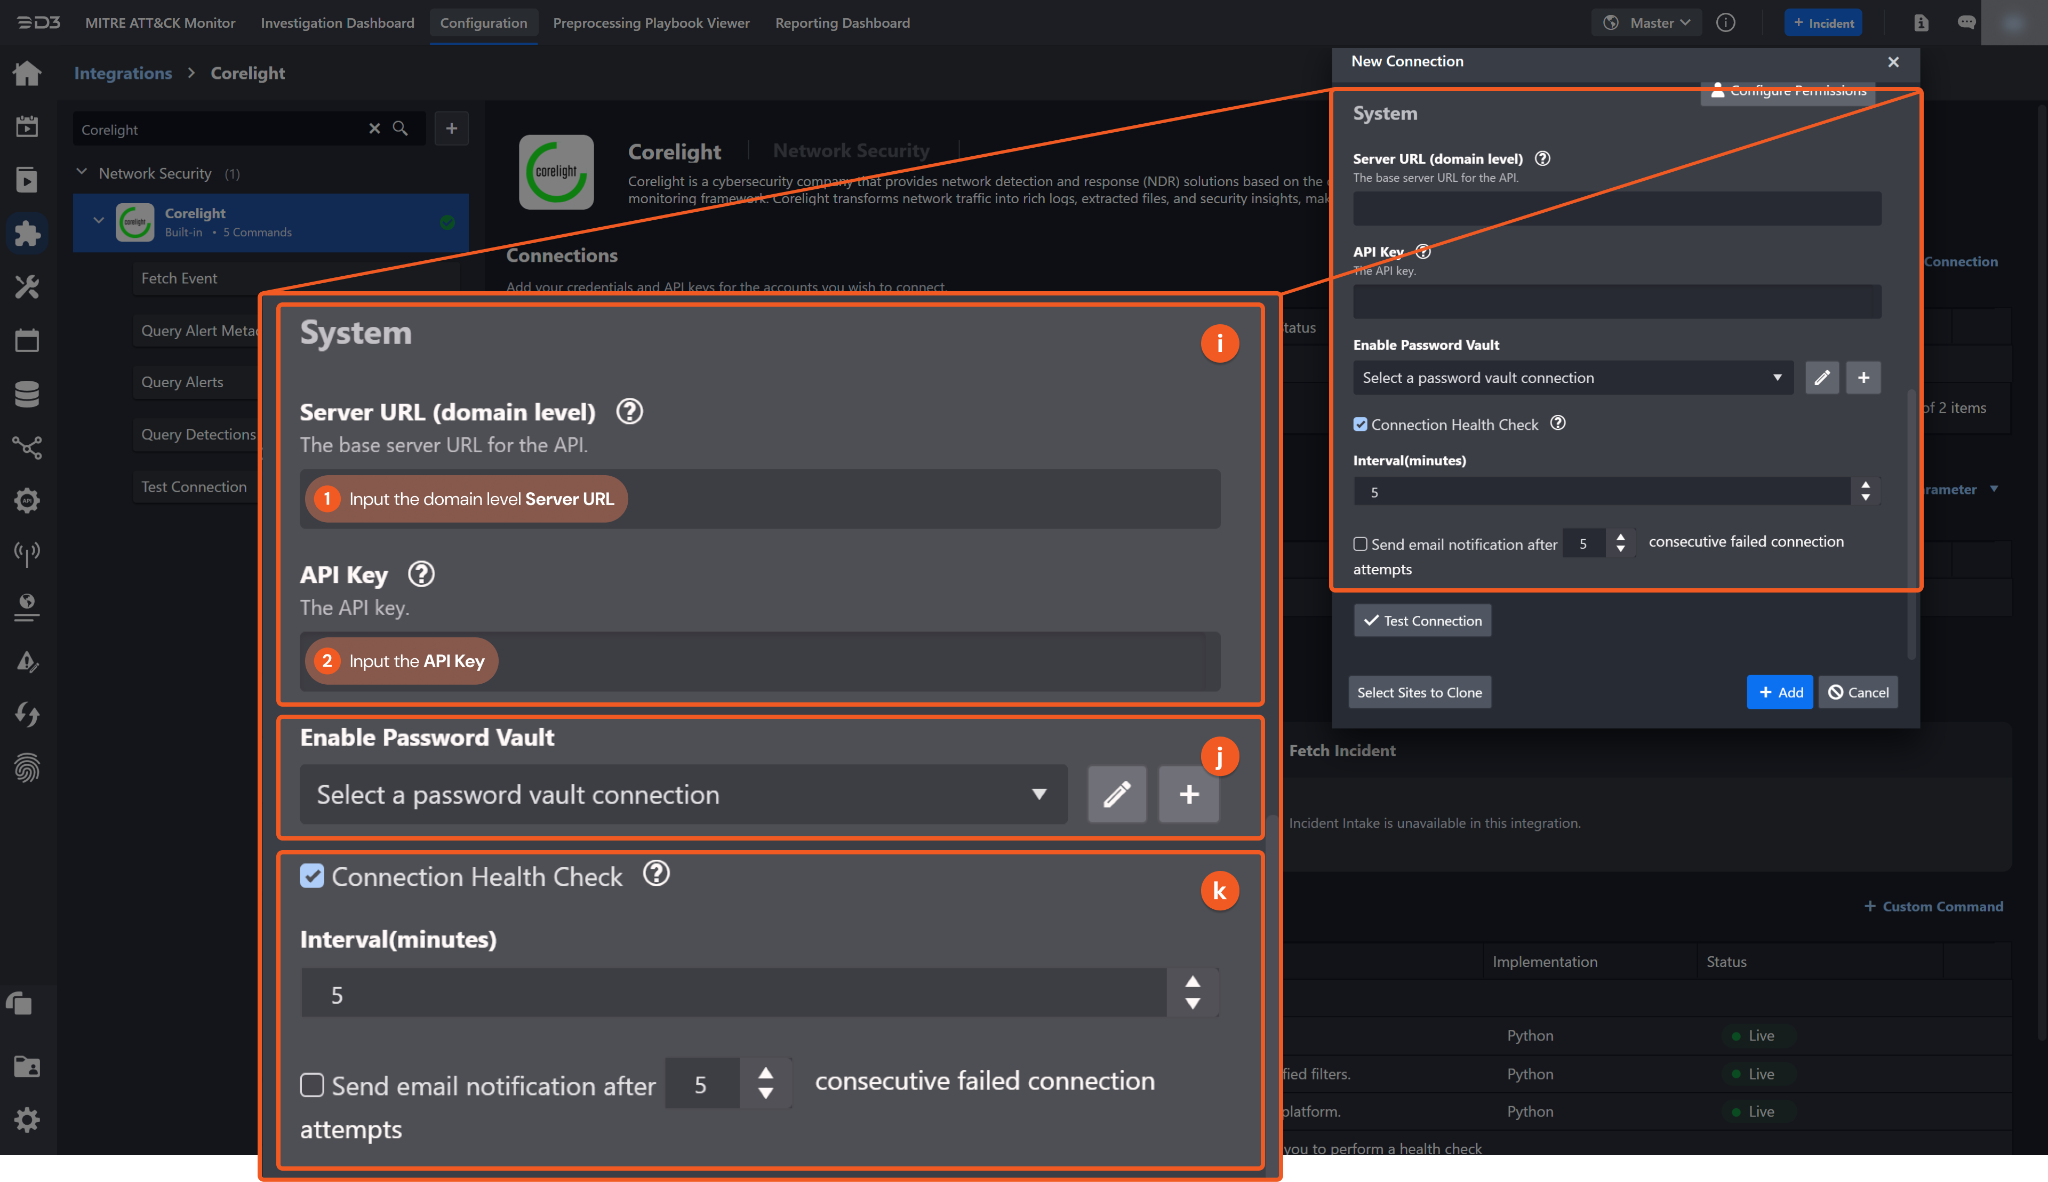
1. Input the Server URL.
2. Copy the API Key from the Corelight platform. Refer to step 6 of Configuring Corelight to Work with D3 SOAR.
Connection Health Check: Periodically checks the connection status by scheduling the Test Connection command at the specified interval (in minutes). Available only for active connections, this feature also allows configuring email notifications for failed attempts.
Enable Password Vault: An optional feature that allows users to take the stored credentials from their own password vault. Refer to the password vault connection guide if needed.
Test the connection.
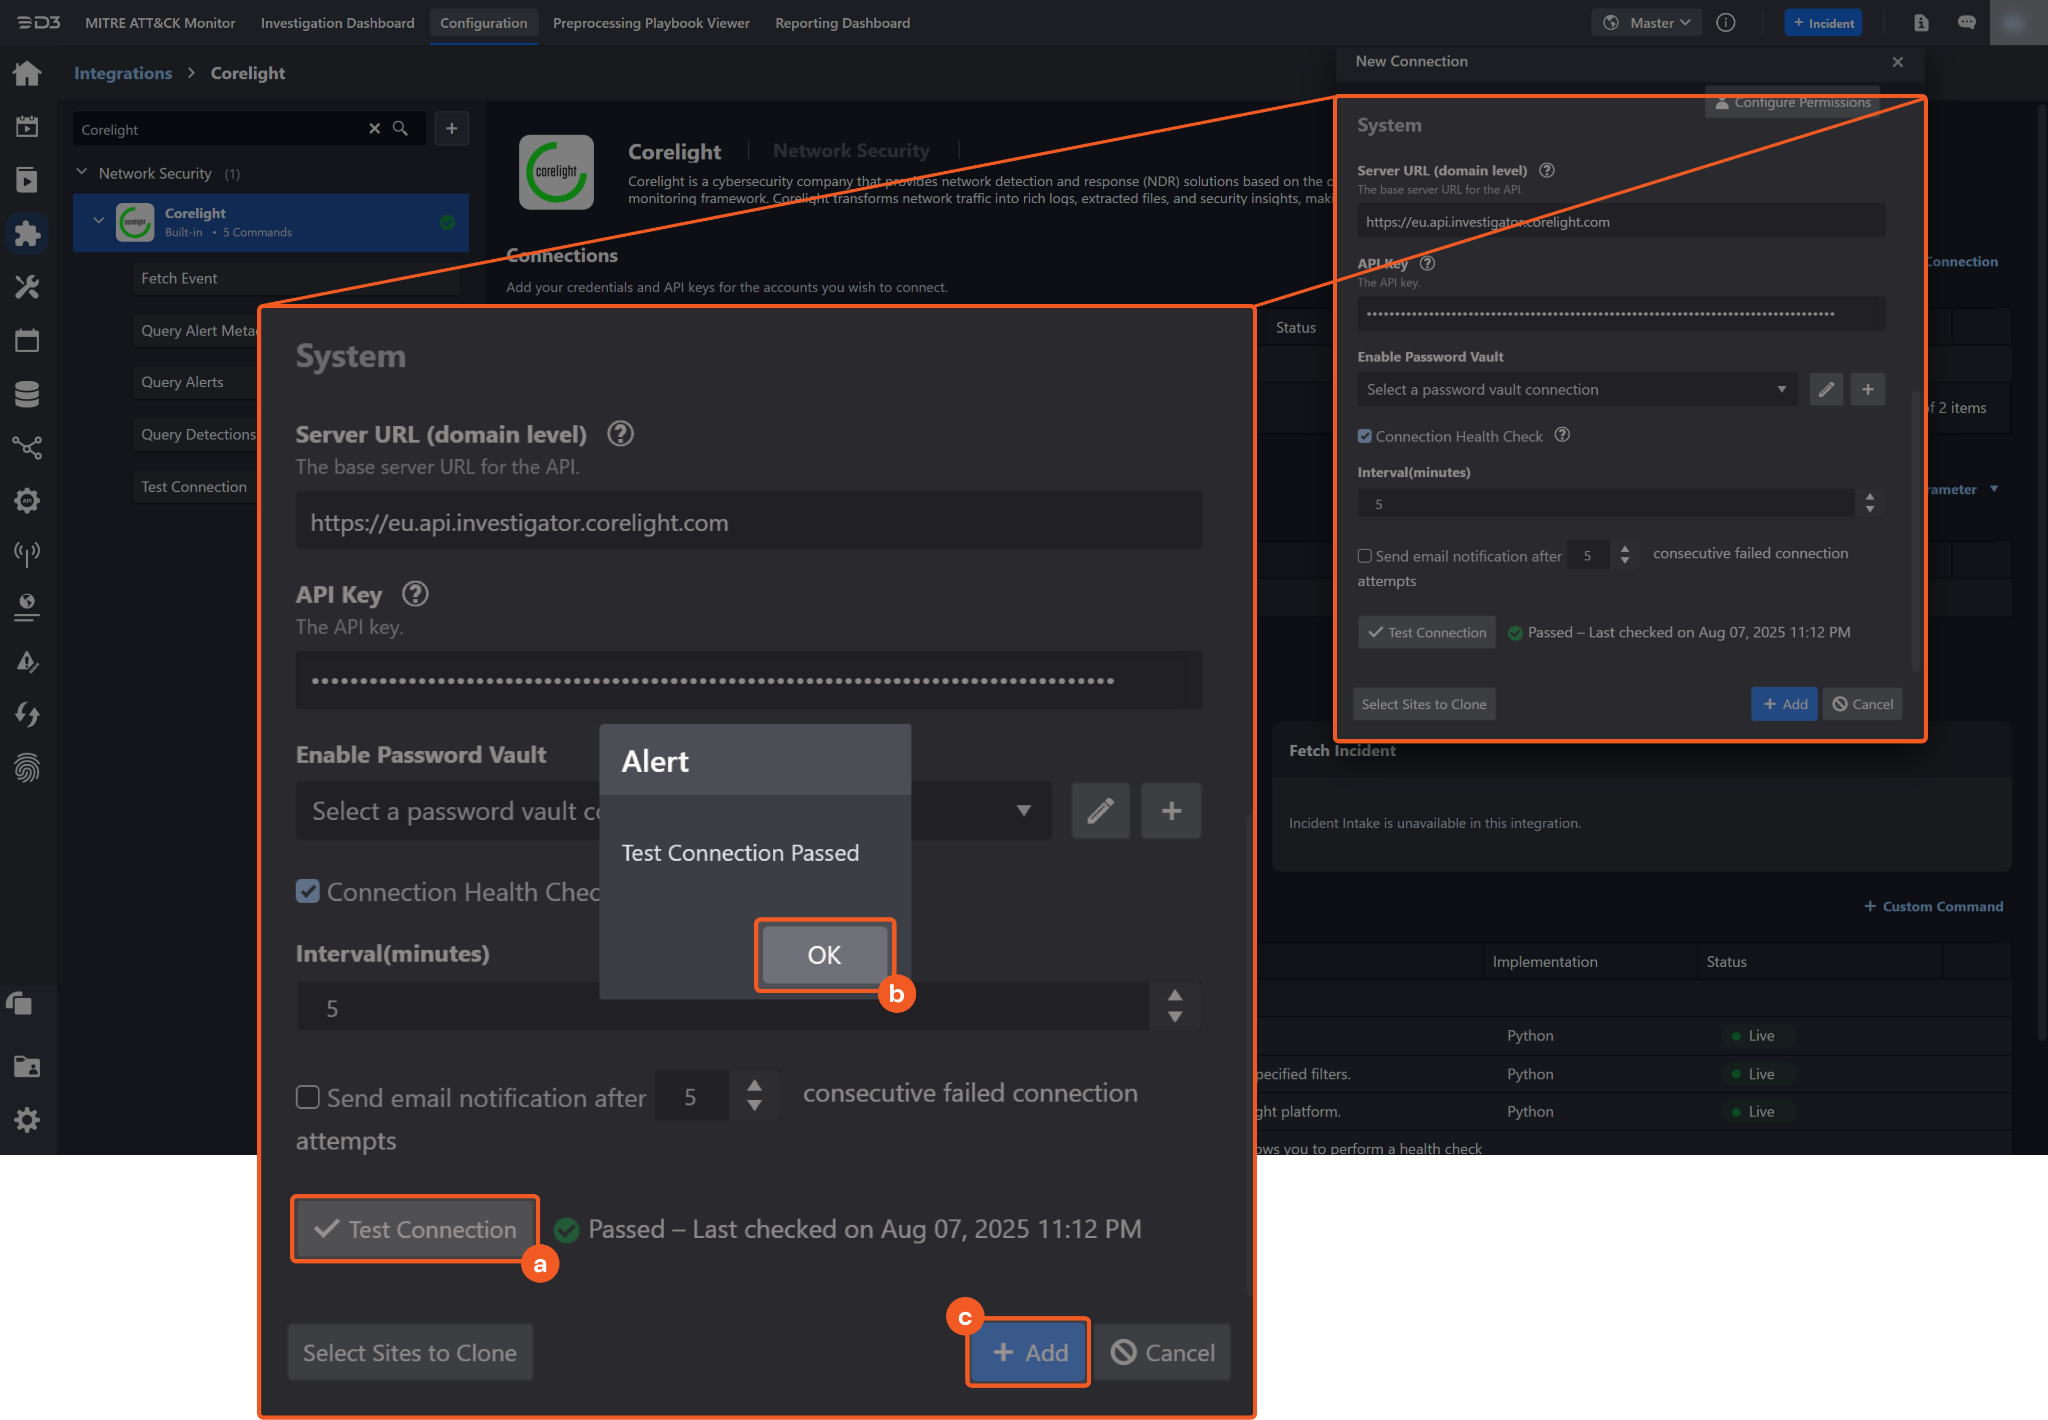
Click on the Test Connection button to verify credentials and connectivity. A success alert displays Passed with a green checkmark. If the connection fails, review the parameters and retry.
Click OK to close the alert window.
Click + Add to create and add the configured connection.
Commands
Corelight includes the following executable commands for users to set up schedules or create playbook workflows. With the Test Command function, users can execute these commands independently for playbook troubleshooting.
Integration API Note
For more information about the Corelight API, refer to the API reference available in the Corelight UI.
Note for Time-related parameters
The input format of time-related parameters may vary based on user account settings, which may cause the sample data in commands to differ from what is displayed. To adjust the time format, follow these steps:
Navigate to Configuration > Application Settings. Select Date/Time Format.
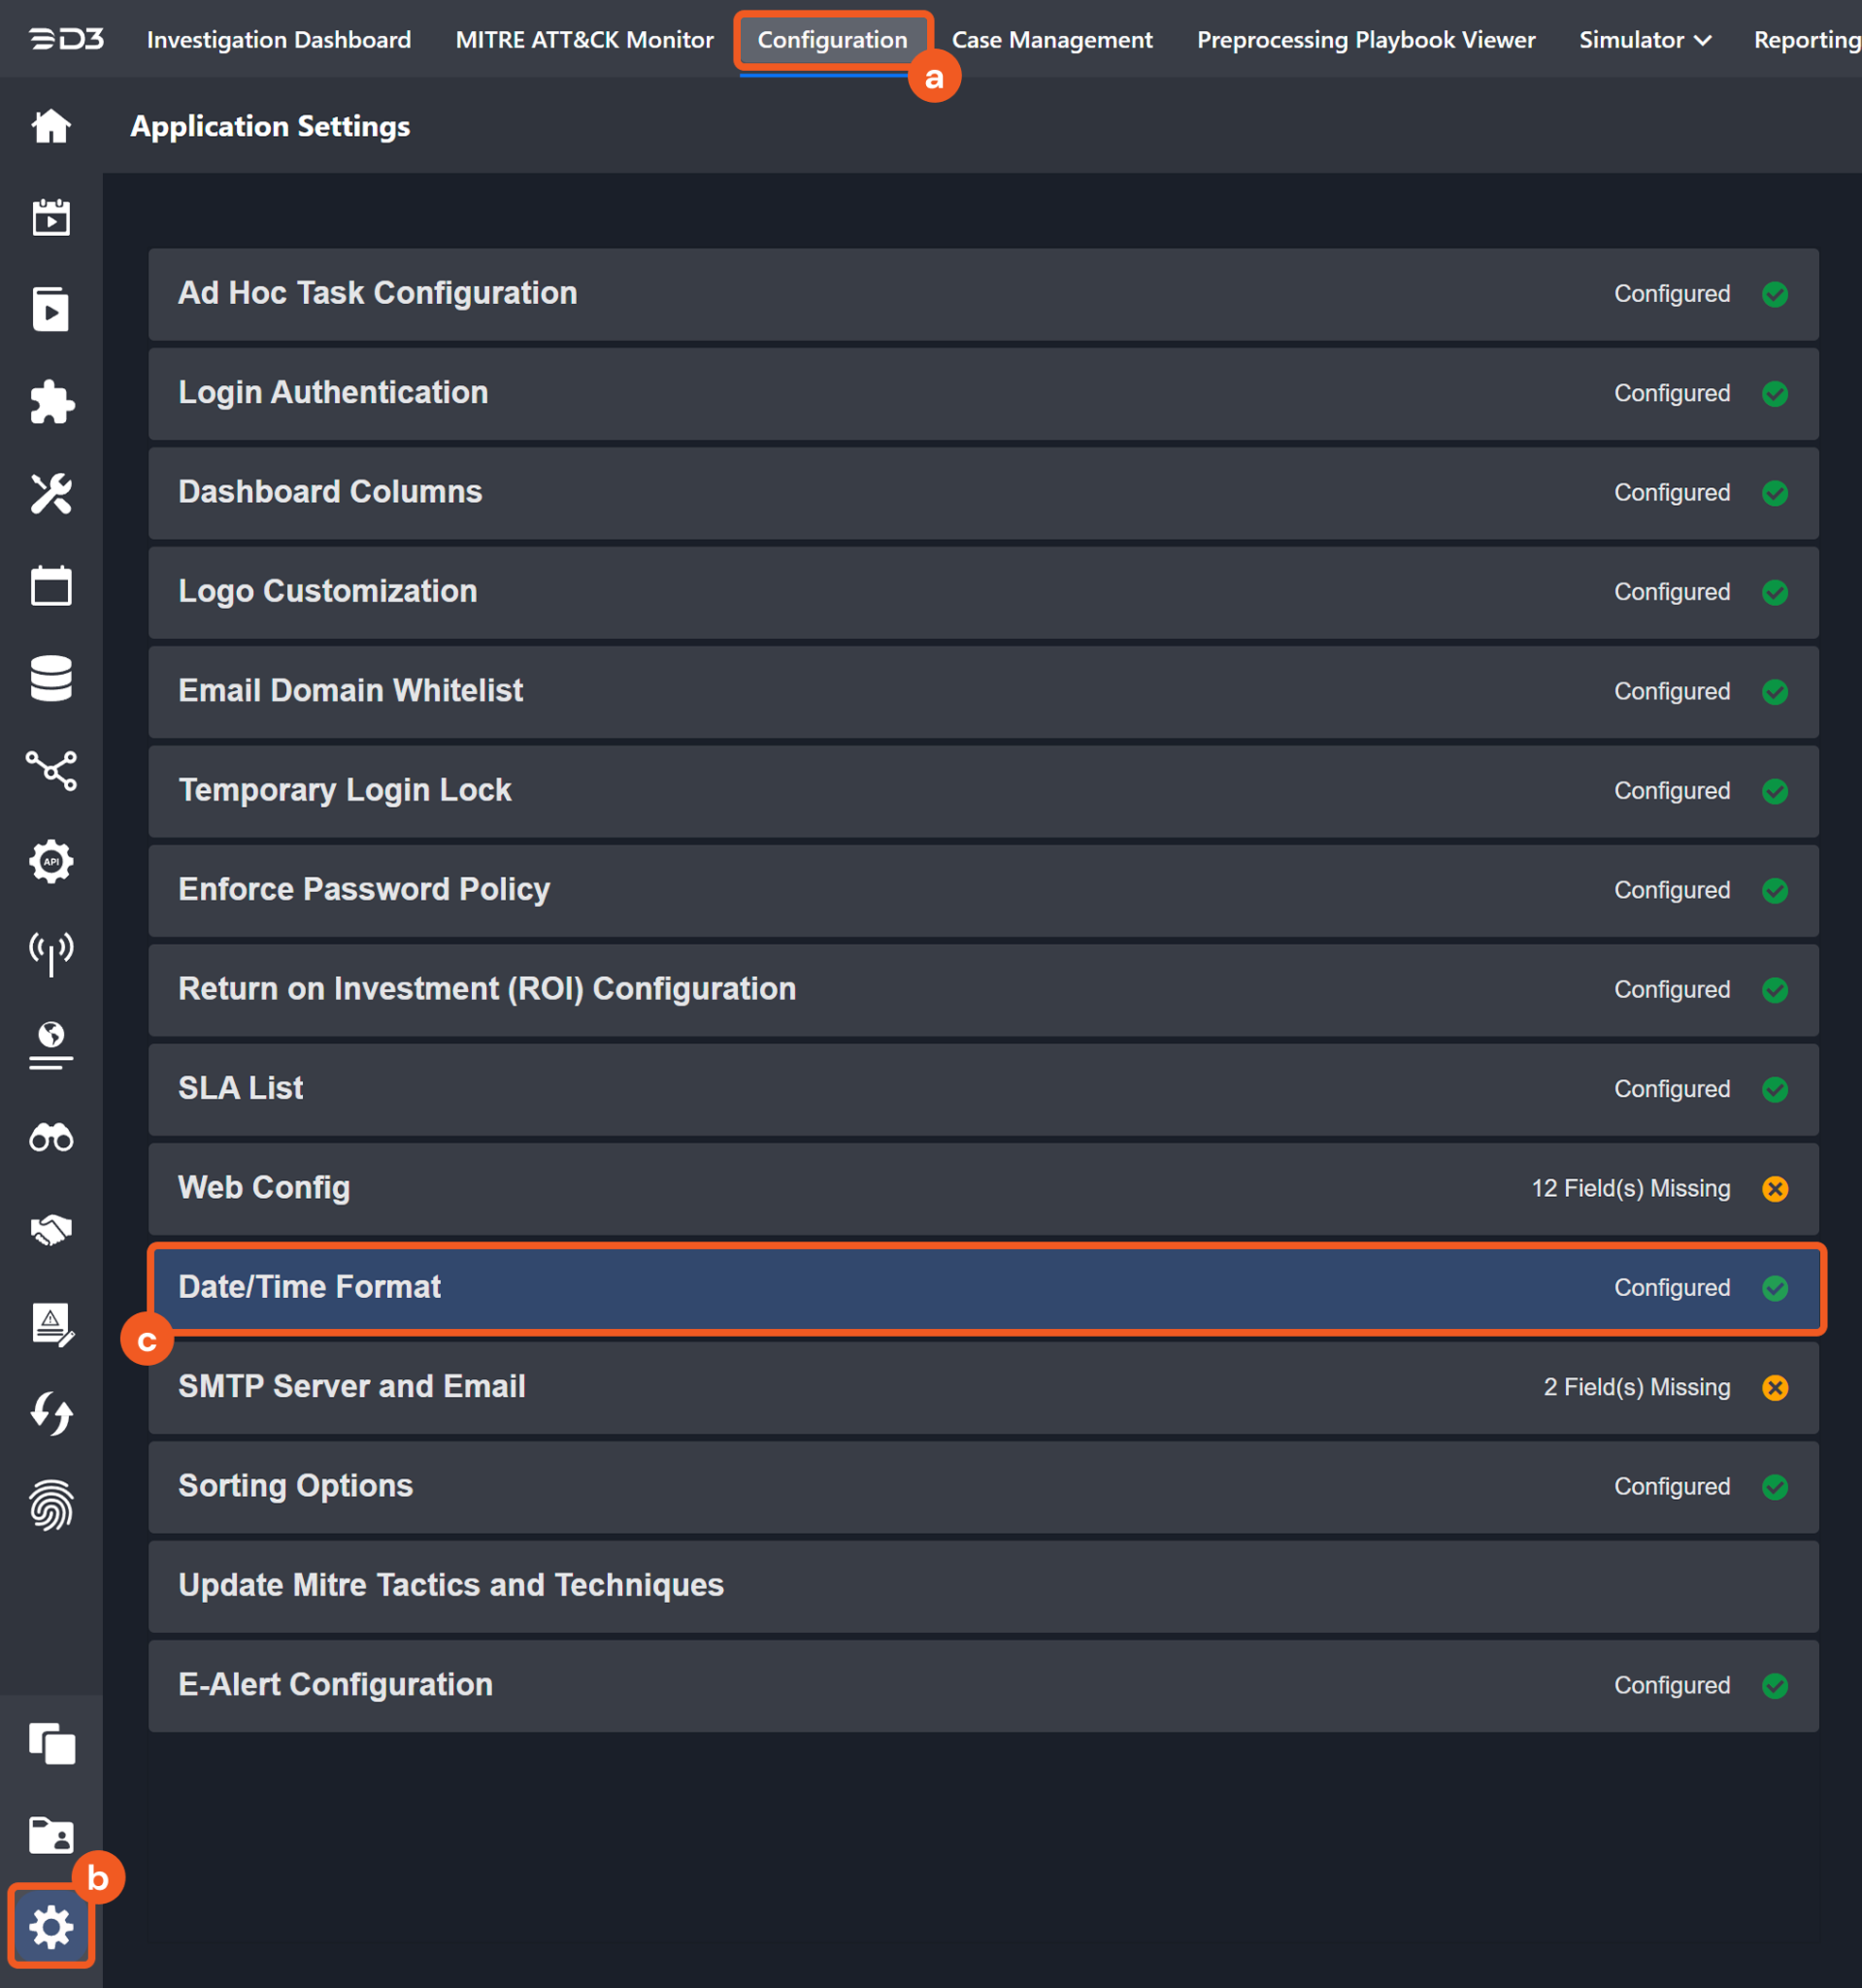
Choose the desired date and time format, then click on the Save button.
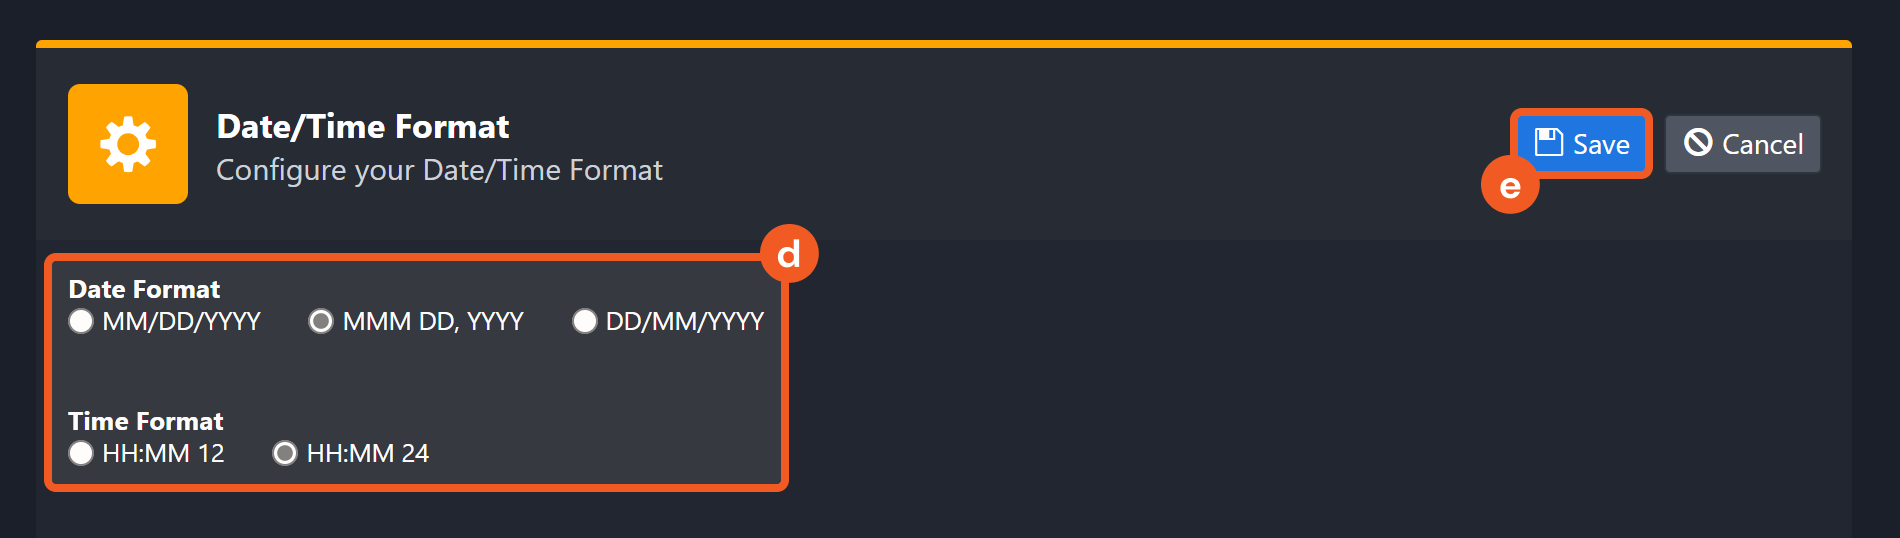
The selected time format will now be visible when configuring Date/Time command input parameters.
Fetch Event
Retrieves events from the Corelight platform based on the specified criteria.
Input
Input Parameter | Required/Optional | Description | Example |
Start Time | Optional | The start time of the range for fetching events in the yyyy-MM-dd HH:mm:ss format (in UTC). By default, the value is 24 hours before the End Time. | 2025-07-01 00:00:00 |
End Time | Optional | The end time of the range for fetching events in the yyyy-MM-dd HH:mm:ss format (in UTC). By default, the value is the current time. | 2025-07-18 00:00:00 |
Number of Event(s) Fetched | Optional | The maximum number of events to return. The maximum input value is 100. If the value is negative, 0, or unspecified, all events matching the filter are returned. The maximum total number of events that can be fetched is 10,000. | 20 |
Event Type | Optional | The type of events to fetch. Available options are:
By default, the value is set to Alerts. | Alerts |
Search Condition | Optional | A JSON object containing the filter criteria used to narrow results. | For Alerts:
JSON
For Detections:
JSON
|
Output
To view the sample output data for all commands, refer to this article.
Fetch Event Field Mapping
Fetch Event commands require event field mapping. Field mapping plays a key role for data normalization within the event pipeline. Field mapping converts the original data fields from the different providers to standardized D3 fields as defined by the D3 Model. Refer to Event and Incident Intake Field Mapping for details.
To add a custom field, click on the + Add Field button. Users can also remove built-in field mappings by clicking x. Note that two underscore characters will automatically prefix the defined Field Name as the System Name for a custom field mapping. Additionally, if an input Field Name contains any spaces, they will automatically be replaced with underscores for the corresponding System Name.
As a system integration, the Corelight integration has some pre-configured field mappings for default field mapping.
Default Event Source
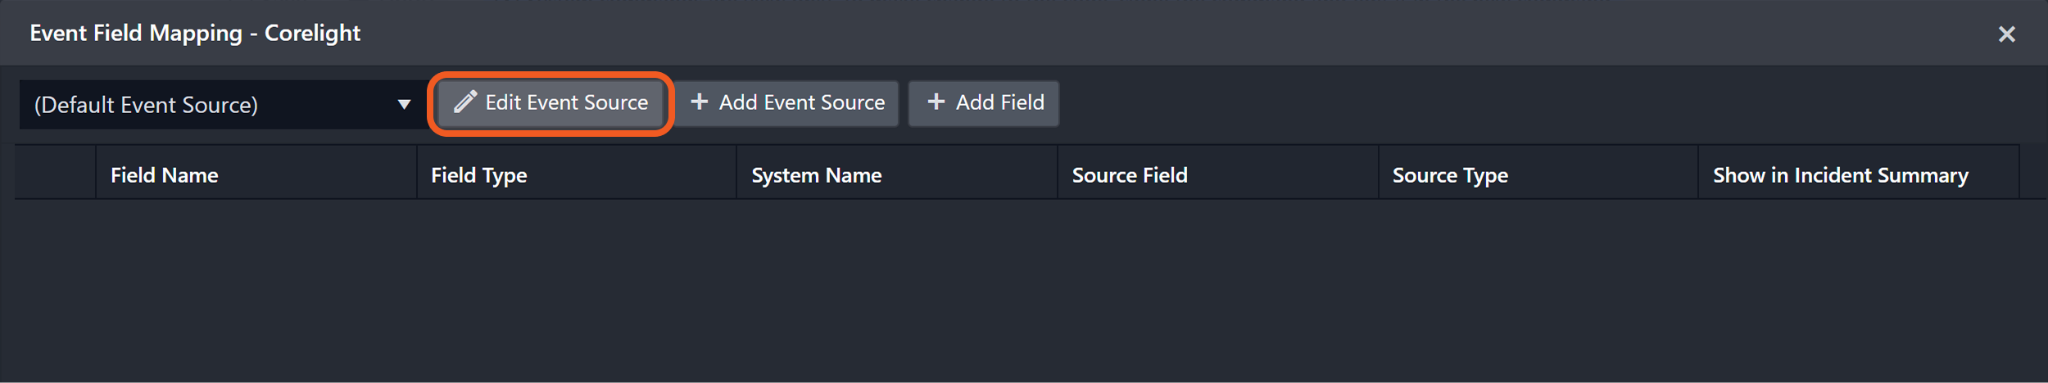
For this integration, no default field mapping is provided. The D3 system configures field mappings only for fields common for Alerts and Detections. The default event source has a "Main Event JSON Path" (i.e. $.data) that is used to extract a batch of events from the response raw data. View the "Main Event JSON Path" by clicking on the Edit Event Source button.
Main Event JSON Path: $.data
The Main Event JSON Path determines the root path where the system starts parsing raw response data into D3 event data. The JSON path begins with $, representing the root element. The path is formed by appending a sequence of child elements to $, each separated by a dot (.). Square brackets with nested quotation marks ([‘...’]) should be used to separate child elements in JSON arrays.
For example, the root node of a JSON Path is data. The child node denoting the Unique Event Key field would be alert_id. Putting it together, the JSON Path expression to extract the Unique Event Key is $.data.alert_id.
Event Source for Alerts
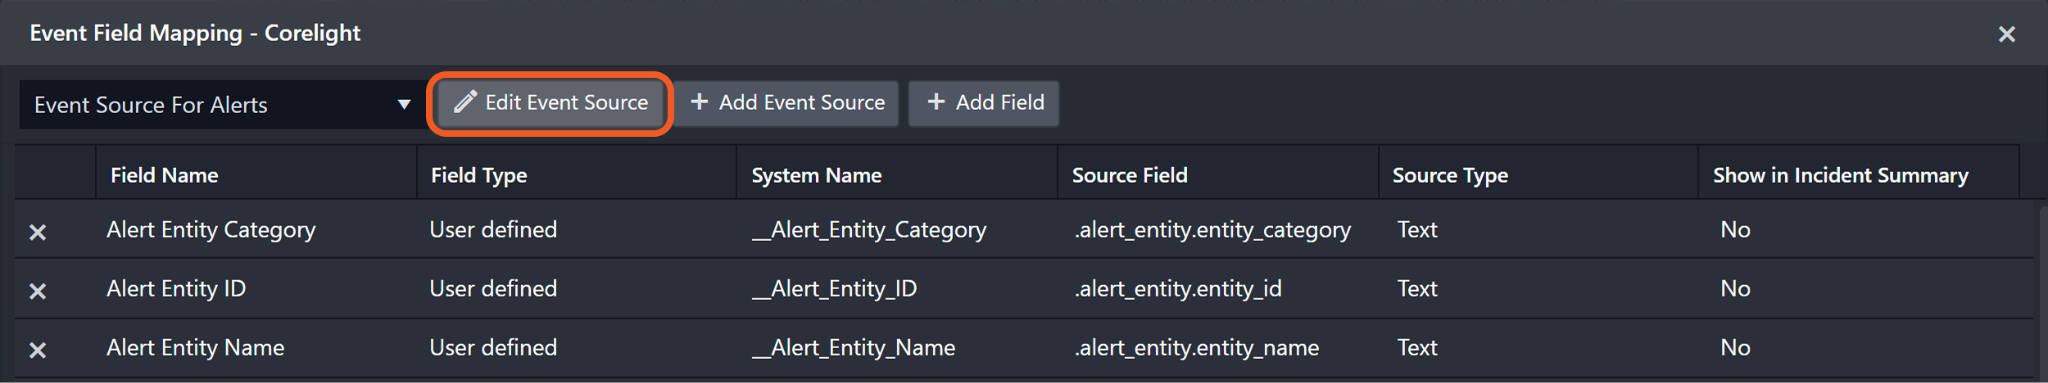
The D3 system configures the field mappings which are specific to the Alert-related events (e.g., False Positive and Alert Timestamp). If a source field in the field mapping is not found, the corresponding field mapping will be ignored. Because the EventType field in the raw data for Alerts consistently has the value Alert, these events can be identified by the Search String: {$.EventType}=Alert. Click Edit Event Source to view the Search String.
Event Source for Detections
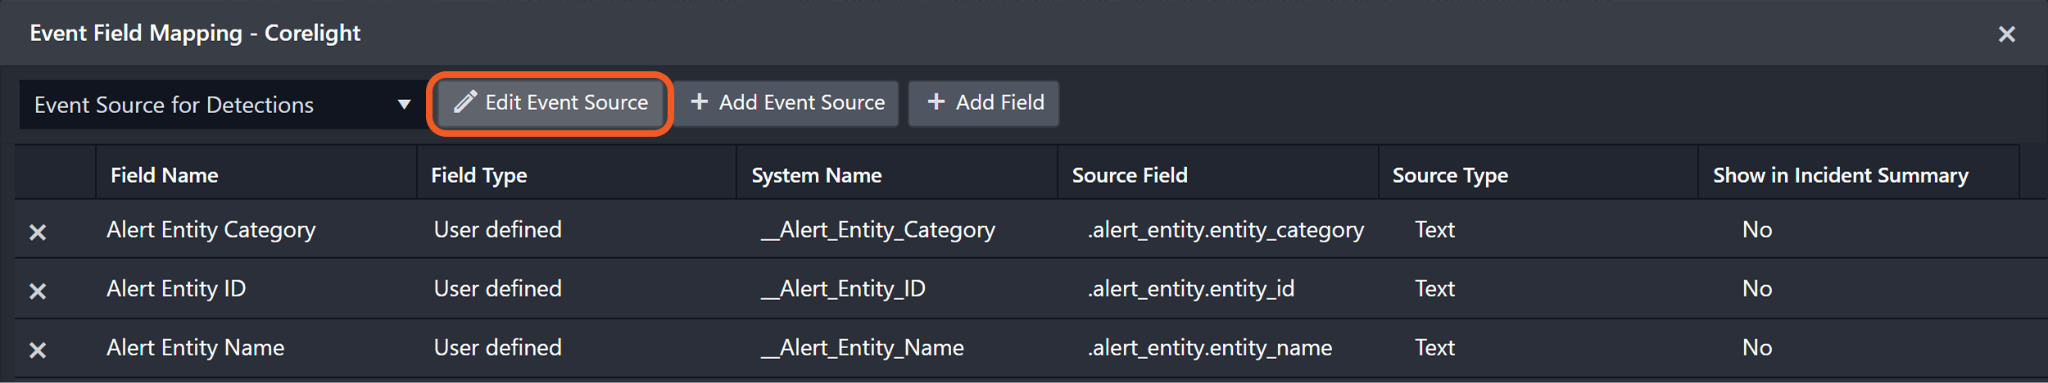
The D3 system configures the field mappings which are specific to the Detection-related events (e.g. Severity and Status). If a source field in the field mapping is not found, the corresponding field mapping will be ignored. Because the EventType field in the raw data for Detections consistently has the value Detection, these events can be identified by the Search String: {$.EventType}=Detection. Click Edit Event Source to view the Search String.
The pre-configured field mappings are detailed below:
Field Name | Source Field |
Event Source For Alerts (Search String: {$.EventType}=Alert) | |
Unique Event Key | .alert_id |
Start Time | .alert_timestamp.observed |
Alert Name | .alert_info.alert_name |
Alert Type | .alert_info.alert_type |
Content ID | .alert_info.content_id |
Alert Timestamp | .alert_timestamp.observed |
Techniques | .mitre_pairs[*][1] |
Tactics | .mitre_pairs[*][0] |
Source vendor name | .source_entities.entity_id |
Source Device | .source_entities.entity_name |
Source type | .source_entities.entity_type |
Destination | .destination_entities.entity_id |
Destination Device | .destination_entities.entity_name |
Destination category | .destination_entities.entity_type |
Event level | .score |
Event Type | .EventType |
Event name | .alert_info.alert_name |
Alert Entity ID | .alert_entity.entity_id |
Alert Entity Name | .alert_entity.entity_name |
Alert Entity Type | .alert_entity.entity_type |
Alert Entity Category | .alert_entity.entity_category |
Threat event ID | .event_ids |
False Positive | .false_positive |
Event Source for Detections (Search String: {$.EventType}=Detection) | |
Unique Event Key | .detection_id |
Severity | .rank.severity |
Status | .detection_status |
Start Time | .created_timestamp |
Tactics | .mitre_pairs[*][0] |
Techniques | .mitre_pairs[*][1] |
Alert Entity ID | .alert_entity.entity_id |
Alert Entity Name | .alert_entity.entity_name |
Alert Entity Type | .alert_entity.entity_type |
Alert Entity Category | .alert_entity.entity_category |
Alert Name | .alert_info.alert_name |
Alert type | .alert_info.alert_type |
Content ID | .alert_info.content_id |
Event Type | .EventType |
Error Handling
If the Return Data displays Failed, an Error tab will appear in the Test Result window.
The error tab contains the details responded from D3 SOAR or third-party API calls, including Failure Indicator, Status Code, and Message. This can help locate the root cause of a command failure.
Parts in Error | Description | Example |
Failure Indicator | Indicates the command failure that happened at a specific input and/or API call. | Fetch Event failed. |
Status Code | The response code issued by the third-party API server or the D3 SOAR system that can be used to locate the corresponding error category. For example, if the returned status code is 401, the selected connection is unauthorized to run the command. The user or system support would need to check the permission setting in the Corelight portal. Refer to the HTTP Status Code Registry for details. | Status Code: 200. |
Message | The raw data or captured key error message from the integration API server about the API request failure. | Message: Variable "$alert_filter" got invalid value { severity: { lte: 10, gte: 2 }, alert_timestamp: { start: [Object] } }; Field "severity" is not defined by type "AlertFilterInput". |
Error Sample Data Fetch Event failed. Status Code: 200. Message: Variable "$alert_filter" got invalid value { severity: { lte: 10, gte: 2 }, alert_timestamp: { start: [Object] } }; Field "severity" is not defined by type "AlertFilterInput". |
Query Alert Metadata List
Retrieves alert metadata records that match the specified filters.
Input
Input Parameter | Required/Optional | Description | Example |
Titles | Optional | The titles used to filter alert metadata. |
CODE
|
Content IDs | Optional | The content IDs used to filter alert metadata. |
JSON
|
Active Status | Optional | The option to return only active alert metadata when set to True. By default, all alert metadata is returned regardless of active status. | True |
Alert Category | Optional | The alert category used to filter alert metadata. Valid values are:
|
JSON
|
Minimum Severity | Optional | The minimum severity used to filter alert metadata. | 2 |
Maximum Severity | Optional | The maximum severity used to filter alert metadata. | 10 |
Limit | Optional | The maximum number of alert metadata records to return. The maximum value is 100. By default, the value is 20. | 5 |
Offset | Optional | The number of items to skip before returning results. By default, the value is 0. If the sum of Offset and Limit exceeds 9999, Offset is automatically adjusted to 9999 minus the Limit value. | 0 |
Sort By | Optional | The field by which the results are sorted. By default, the results are sorted based on the updated_timestamp field. | updated_timestamp |
Direction | Optional | The sort order for the results. Accepted values are:
By default, the value is set to Descending. | Ascending |
Output
To view the sample output data for all commands, refer to this article.
Error Handling
If the Return Data displays Failed, an Error tab will appear in the Test Result window.
The error tab contains the details responded from D3 SOAR or third-party API calls, including Failure Indicator, Status Code, and Message. This can help locate the root cause of a command failure.
Parts in Error | Description | Example |
Failure Indicator | Indicates the command failure that happened at a specific input and/or API call. | Query Alert Metadata List failed. |
Status Code | The response code issued by the third-party API server or the D3 SOAR system that can be used to locate the corresponding error category. For example, if the returned status code is 401, the selected connection is unauthorized to run the command. The user or system support would need to check the permission setting in the Corelight portal. Refer to the HTTP Status Code Registry for details. | Status Code: 400. |
Message | The raw data or captured key error message from the integration API server about the API request failure. | Message: The value for parameter (Active Status) is invalid. |
Error Sample Data Query Alert Metadata List failed. Status Code: 400. Message: The value for parameter (Active Status) is invalid. |
Query Alerts
Retrieves alerts that match the specified filters.
Input
Input Parameter | Required/Optional | Description | Example |
Start Time | Optional | The start time used to filter alerts. | Jul 16, 2025 12:00 AM |
End Time | Optional | The end time used to filter alerts. | Jul 17, 2025 12:00 AM |
Limit | Optional | The maximum number of alerts to return. The maximum value is 100. By default, the value is 20. | 2 |
Offset | Optional | The number of items to skip before returning results. By default, the value is 0. If the sum of Offset and Limit exceeds 9999, Offset is automatically adjusted to 9999 minus the Limit value. | 0 |
Minimum Score | Optional | The minimum score used to filter alerts by score. | 2 |
Maximum Score | Optional | The maximum score used to filter alerts by score. | 8 |
Alert Info Filter | Optional | An array of alert information objects used to filter alerts. Each object can include these fields:
Valid values for alert_type are:
Within a single object, returned alerts must match all specified fields in that object. Across multiple objects in the array, alerts matching any object are returned. |
JSON
|
Alert Entity Filter | Optional | An array of entity filter objects used to filter alerts. Each object can include these fields:
Valid values for entity_type are:
Valid values for entity_category are:
Within a single object, returned alerts must match all specified fields in that object. Across multiple objects in the array, alerts matching any object are returned. |
JSON
|
Sort By | Optional | The field by which the results are sorted. By default, the results are sorted based on the alert_timestamp.start field. | alert_id |
Direction | Optional | The sort order for the results. Accepted values are:
By default, the value is set to Descending. | Ascending |
Output
To view the sample output data for all commands, refer to this article.
Error Handling
If the Return Data displays Failed, an Error tab will appear in the Test Result window.
The error tab contains the details responded from D3 SOAR or third-party API calls, including Failure Indicator, Status Code, and Message. This can help locate the root cause of a command failure.
Parts in Error | Description | Example |
Failure Indicator | Indicates the command failure that happened at a specific input and/or API call. | Query Alerts failed. |
Status Code | The response code issued by the third-party API server or the D3 SOAR system that can be used to locate the corresponding error category. For example, if the returned status code is 401, the selected connection is unauthorized to run the command. The user or system support would need to check the permission setting in the Corelight portal. Refer to the HTTP Status Code Registry for details. | Status Code: 400. |
Message | The raw data or captured key error message from the integration API server about the API request failure. | Message: The value for parameter (Alert Entity Filter) is invalid. |
Error Sample Data Query Alerts failed. Status Code: 400. Message: The value for parameter (Alert Entity Filter) is invalid. |
Query Detections
Retrieves detections from the Corelight platform.
Input
Input Parameter | Required/Optional | Description | Example |
Earliest Start Time | Optional | The earliest start time used to filter detections. | Jul 16, 2025 12:00 AM |
Latest Start Time | Optional | The latest start time used to filter detections. | Jul 17, 2025 12:00 AM |
Limit | Optional | The maximum number of detections to return. The maximum value is 100. By default, the value is 20. | 2 |
Offset | Optional | The number of items to skip before returning results. By default, the value is 0. If the sum of Offset and Limit exceeds 9999, Offset is automatically adjusted to 9999 minus the Limit value. | 0 |
Detection Status | Optional | The detection status used to filter results. Available options are:
| Open |
Minimum Severity | Optional | The minimum severity used to filter detections. | 3 |
Maximum Severity | Optional | The maximum severity used to filter detections. | 8 |
Alert Info Filter | Optional | An array of alert information objects used to filter detections. Each object can include these fields:
Valid values for alert_type are:
|
JSON
|
Sort By | Optional | The field by which the results are sorted. By default, the results are sorted based on the created_timestamp field. | detection_id |
Direction | Optional | The sort order for the results. Accepted values are:
By default, the value is set to Descending. | Ascending |
Output
To view the sample output data for all commands, refer to this article.
Error Handling
If the Return Data displays Failed, an Error tab will appear in the Test Result window.
The error tab contains the details responded from D3 SOAR or third-party API calls, including Failure Indicator, Status Code, and Message. This can help locate the root cause of a command failure.
Parts in Error | Description | Example |
Failure Indicator | Indicates the command failure that happened at a specific input and/or API call. | Query Detections failed. |
Status Code | The response code issued by the third-party API server or the D3 SOAR system that can be used to locate the corresponding error category. For example, if the returned status code is 401, the selected connection is unauthorized to run the command. The user or system support would need to check the permission setting in the Corelight portal. Refer to the HTTP Status Code Registry for details. | Status Code: 400. |
Message | The raw data or captured key error message from the integration API server about the API request failure. | Message: The value for parameter (Alert Info Filter) is invalid. |
Error Sample Data Query Detections failed. Status Code: 400. Message: The value for parameter (Alert Info Filter) is invalid. |
Test Connection
Allows users to perform a health check on an integration connection. Users can schedule a periodic health check by selecting Connection Health Check when editing an integration connection.
Input
N/A
Output
Output Type | Description | Return Data Type |
Return Data | Indicates one of the possible command execution states: Successful or Failed. The Failed state can be triggered by any of the following errors:
More details about an error can be viewed in the Error tab. | String |
Error Handling
If the Return Data displays Failed, an Error tab will appear in the Test Result window.
The error tab contains the details responded from D3 SOAR or third-party API calls, including Failure Indicator, Status Code, and Message. This can help locate the root cause of a command failure.
Parts in Error | Description | Example |
Failure Indicator | Indicates the command failure that happened at a specific input and/or API call. | Test Connection failed. Failed to check the connector. |
Status Code | The response code issued by the third-party API server or the D3 SOAR system that can be used to locate the corresponding error category. For example, if the returned status code is 401, the selected connection is unauthorized to run the command. The user or system support would need to check the permission setting in the Corelight portal. Refer to the HTTP Status Code Registry for details. | Status Code: 401. |
Message | The raw data or captured key error message from the integration API server about the API request failure. | Message: Unauthorized. |
Error Sample Data Test Connection failed. Failed to check the connector. Status Code: 401. Message: Unauthorized. |