
Claroty
LAST UPDATED: JULY 29, 2025
Overview
Claroty Platform provides real-time vulnerability alerts and identification of potential risks to bridge the gap between IT and operational technology teams.
D3 SOAR is providing REST operations to function with Claroty.
Claroty is available for use in:
Connection
To connect to Claroty from D3 SOAR, follow this part to collect the required information below:
Parameter | Description | Example |
Server URL | The URL of the Claroty CTD server. This is the same URL used to access the CTD console. | https://<replace-me>.com |
User Name | The username to authenticate the API connection. | admin |
Password | The password to authenticate the API connection. | ***** |
API Version | The API version to use for the connection. | v2 |
Permission Requirements
Each endpoint in the Claroty API requires a certain permission scope. The following are the minimum required permissions for the commands in this integration:
Command | Required Permissions |
Fetch Incident |
|
Get Alerts by IDs |
|
List Alerts |
|
List Assets |
|
Resolve Alerts |
|
Test Connection |
|
Configuring Claroty to Work with D3 SOAR
The following section outlines the steps to create a new user and assign role-based access controls:
Creating a User
Log in to the Claroty CTD console using administrative credentials.
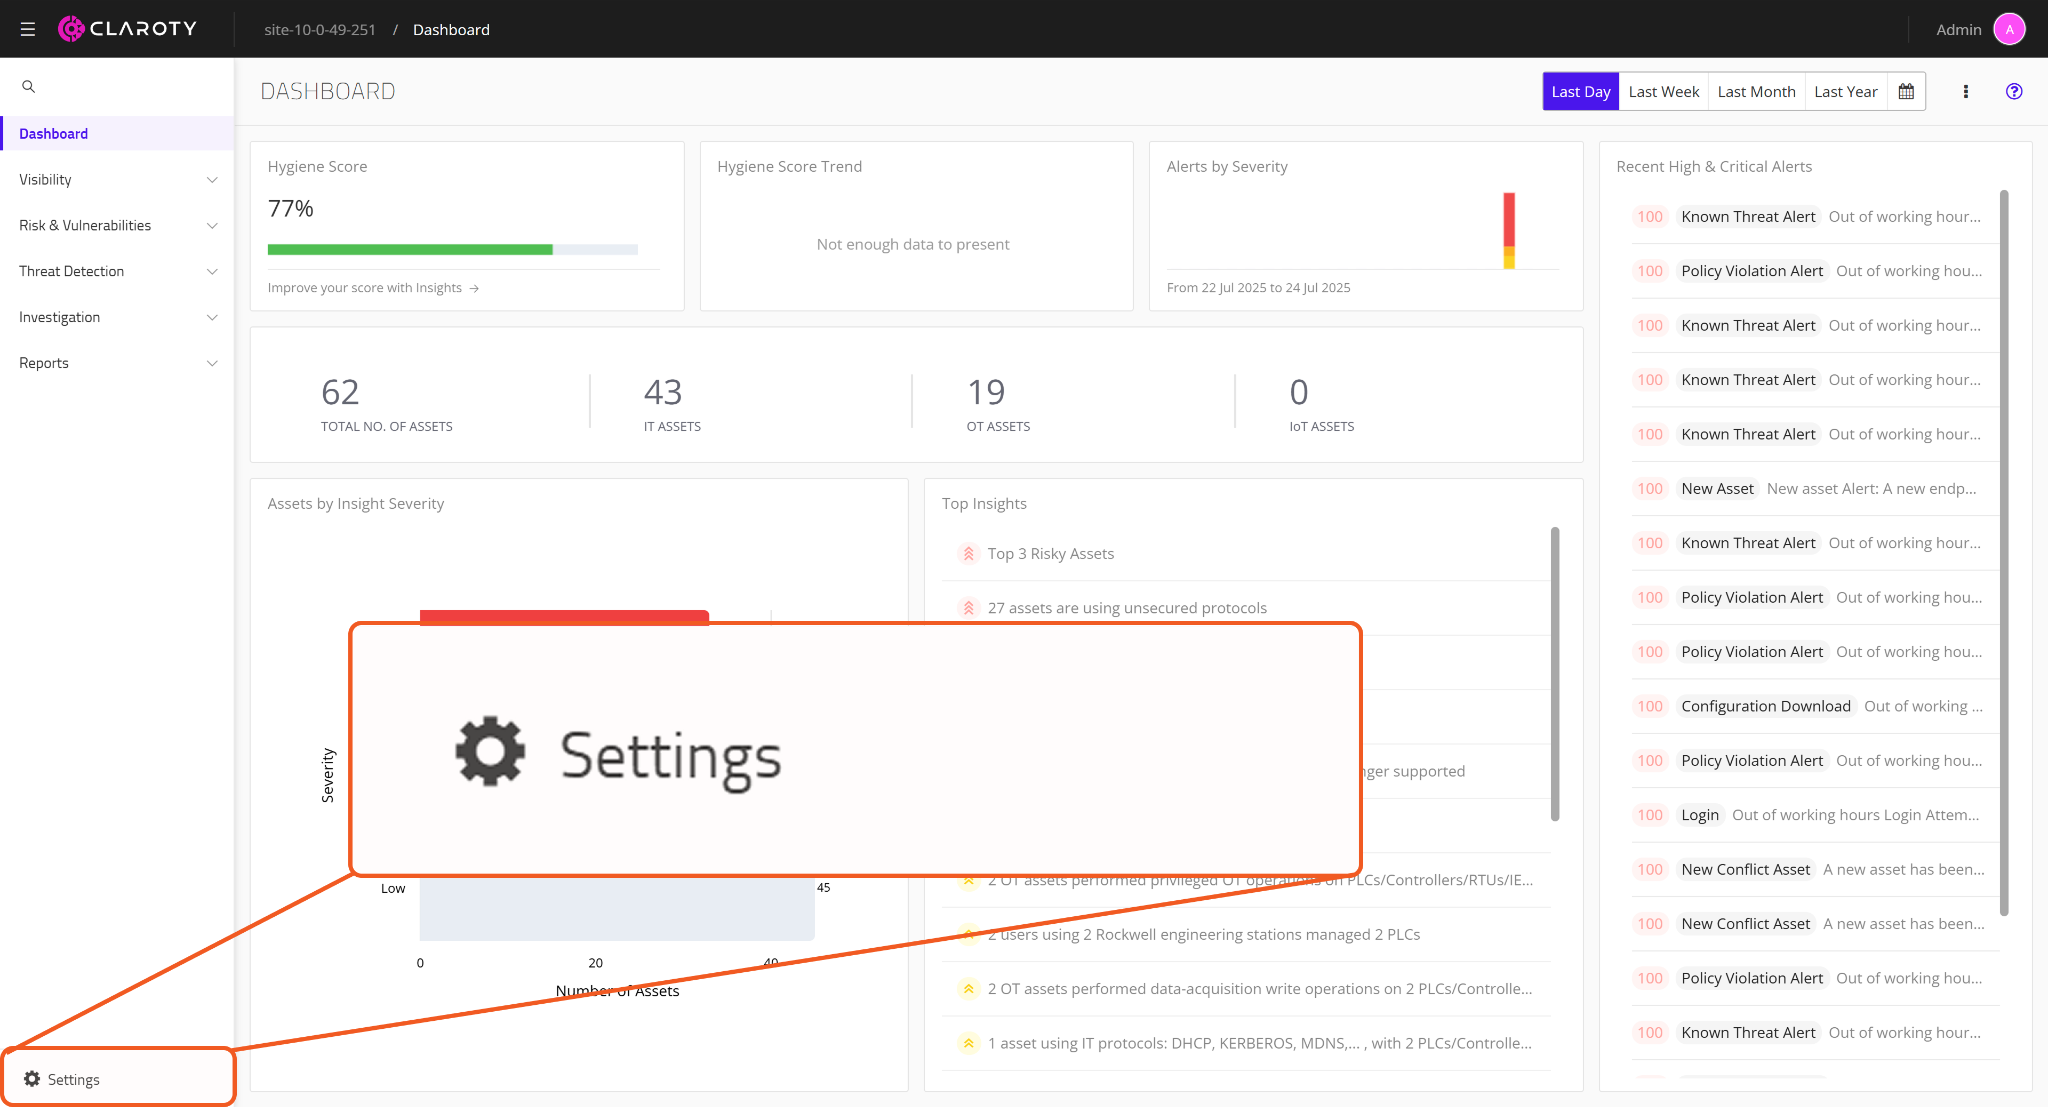
Click the Settings button.
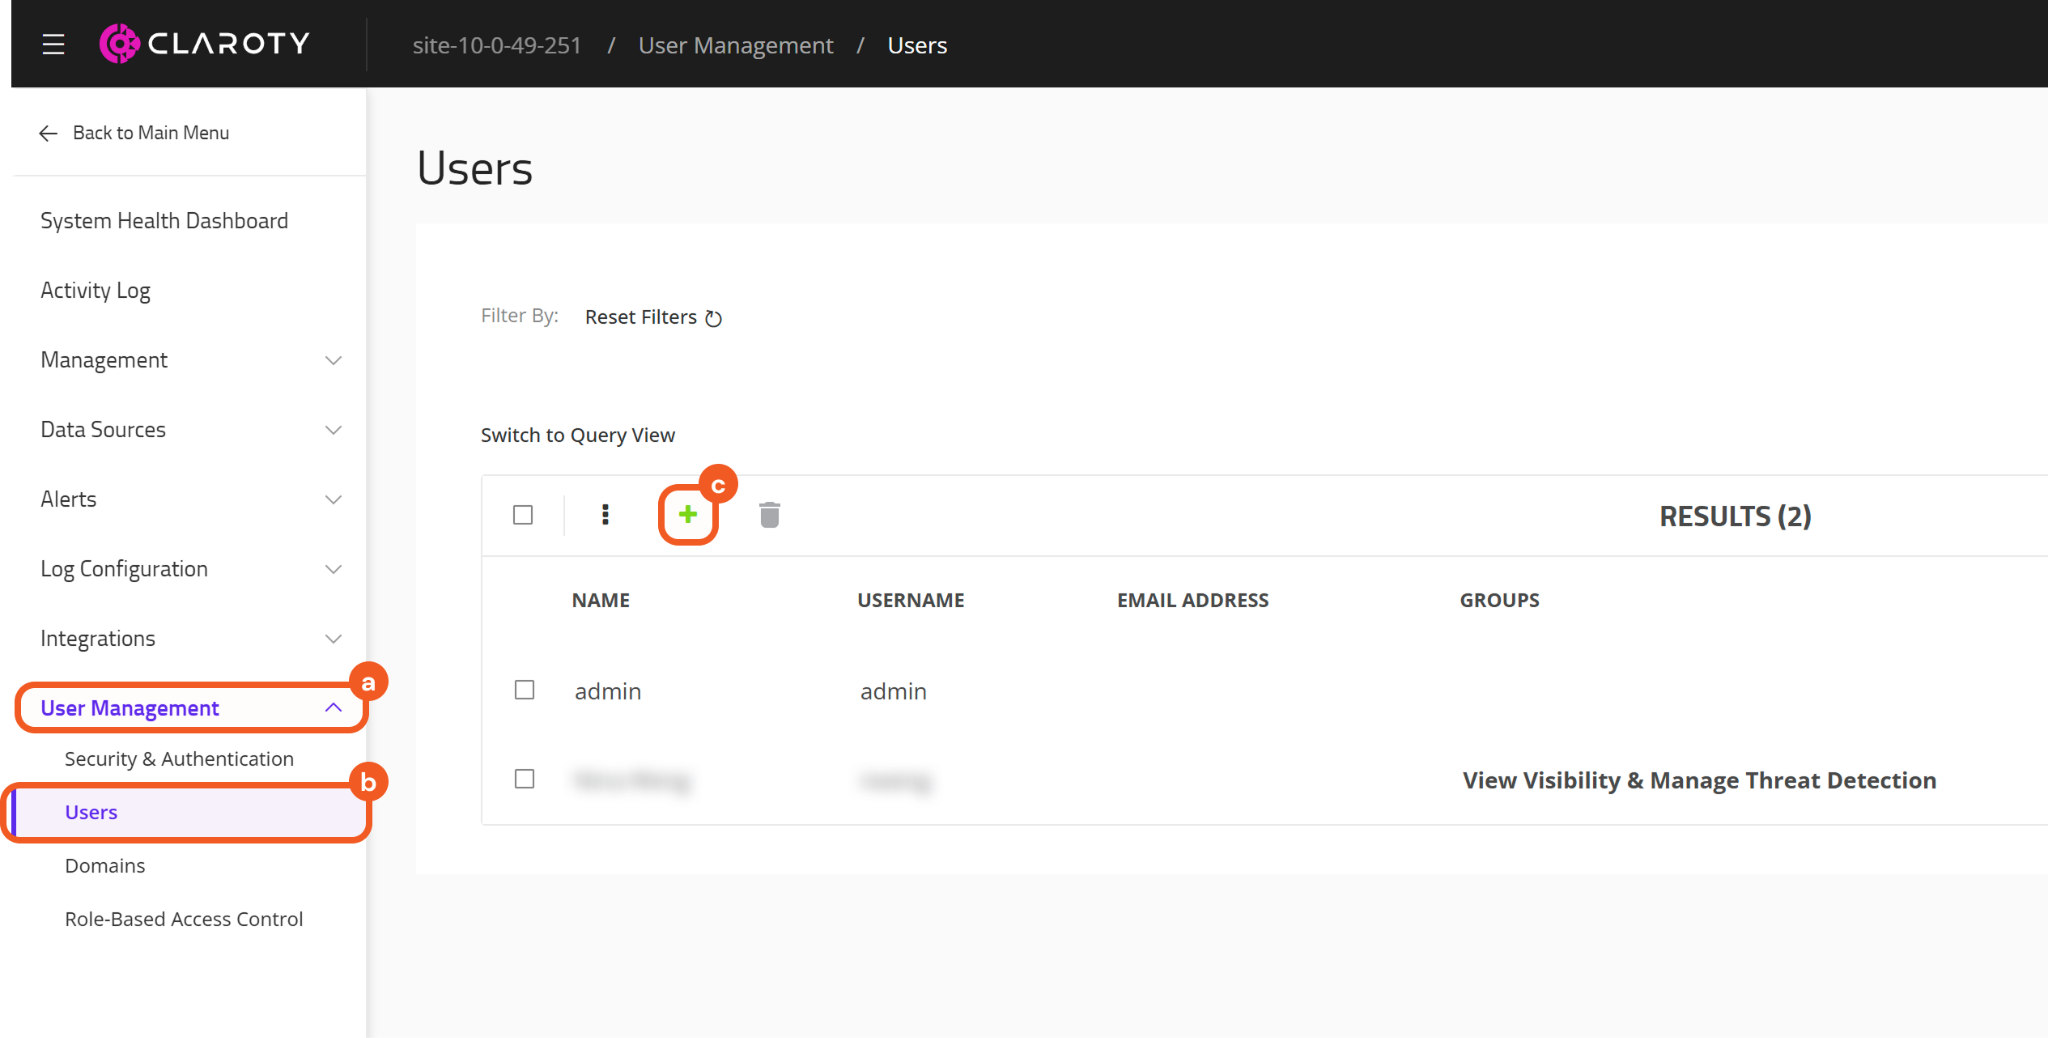
Navigate to User Management > Users, then click the + button.
Configure the new user.
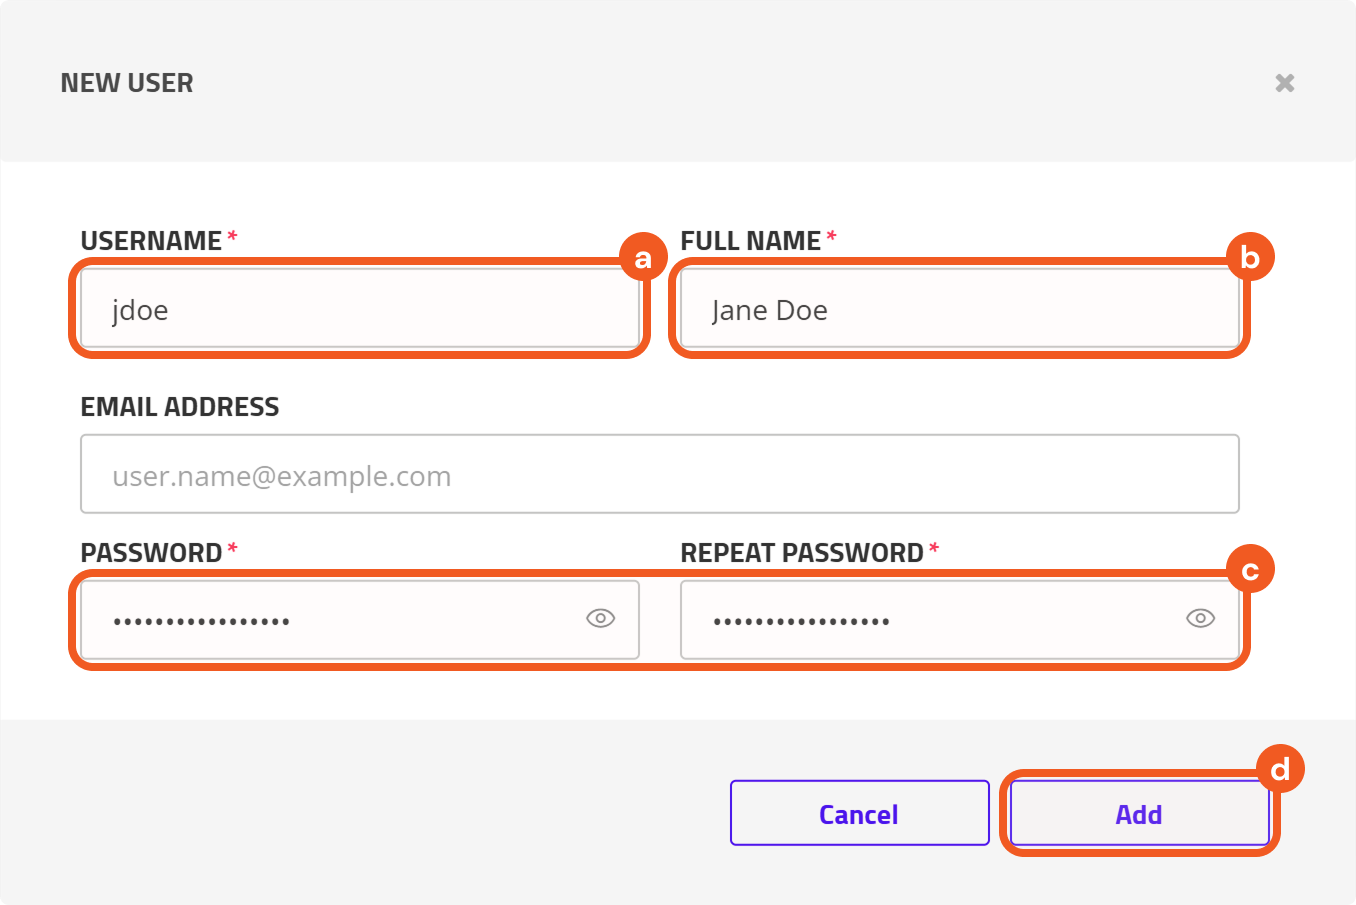
Enter a username.
Enter the user's full name.
Enter and confirm the password
Click the Add button.
Assigning a Role/Group to the Newly Created User
Select the Role-Based Access Control tab, then click the + button.
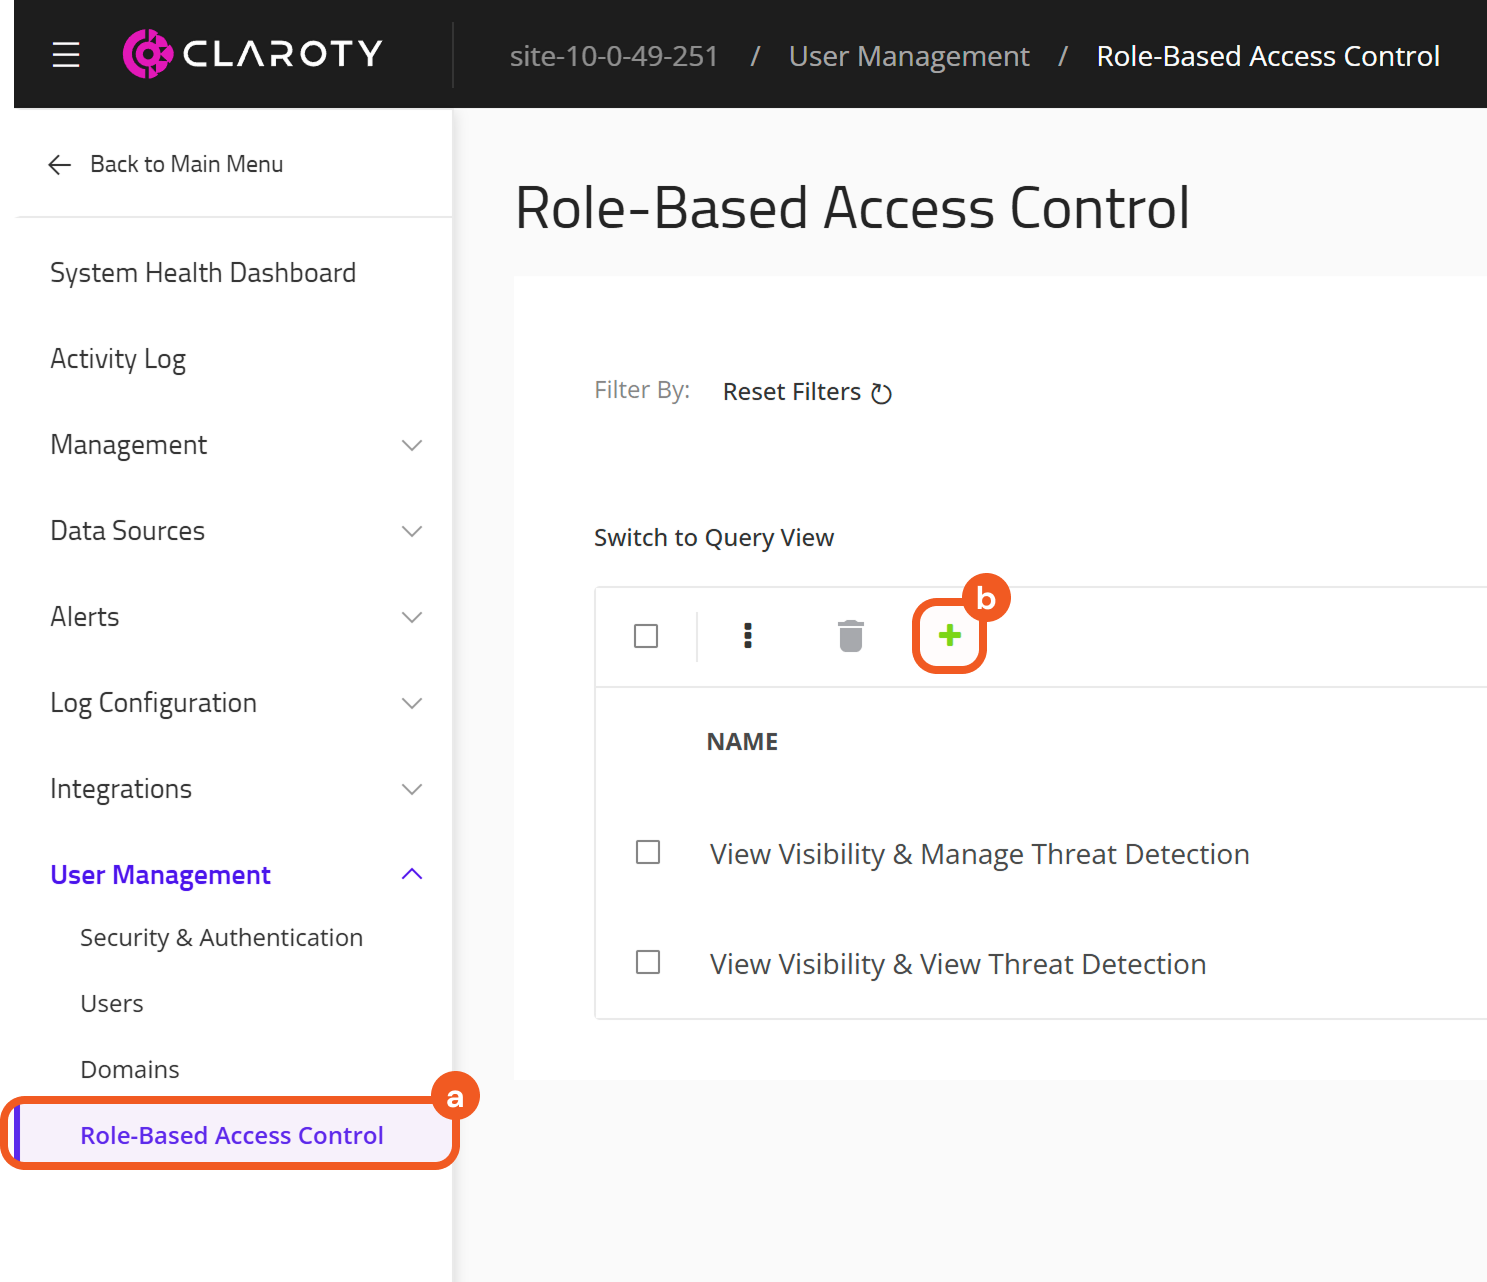
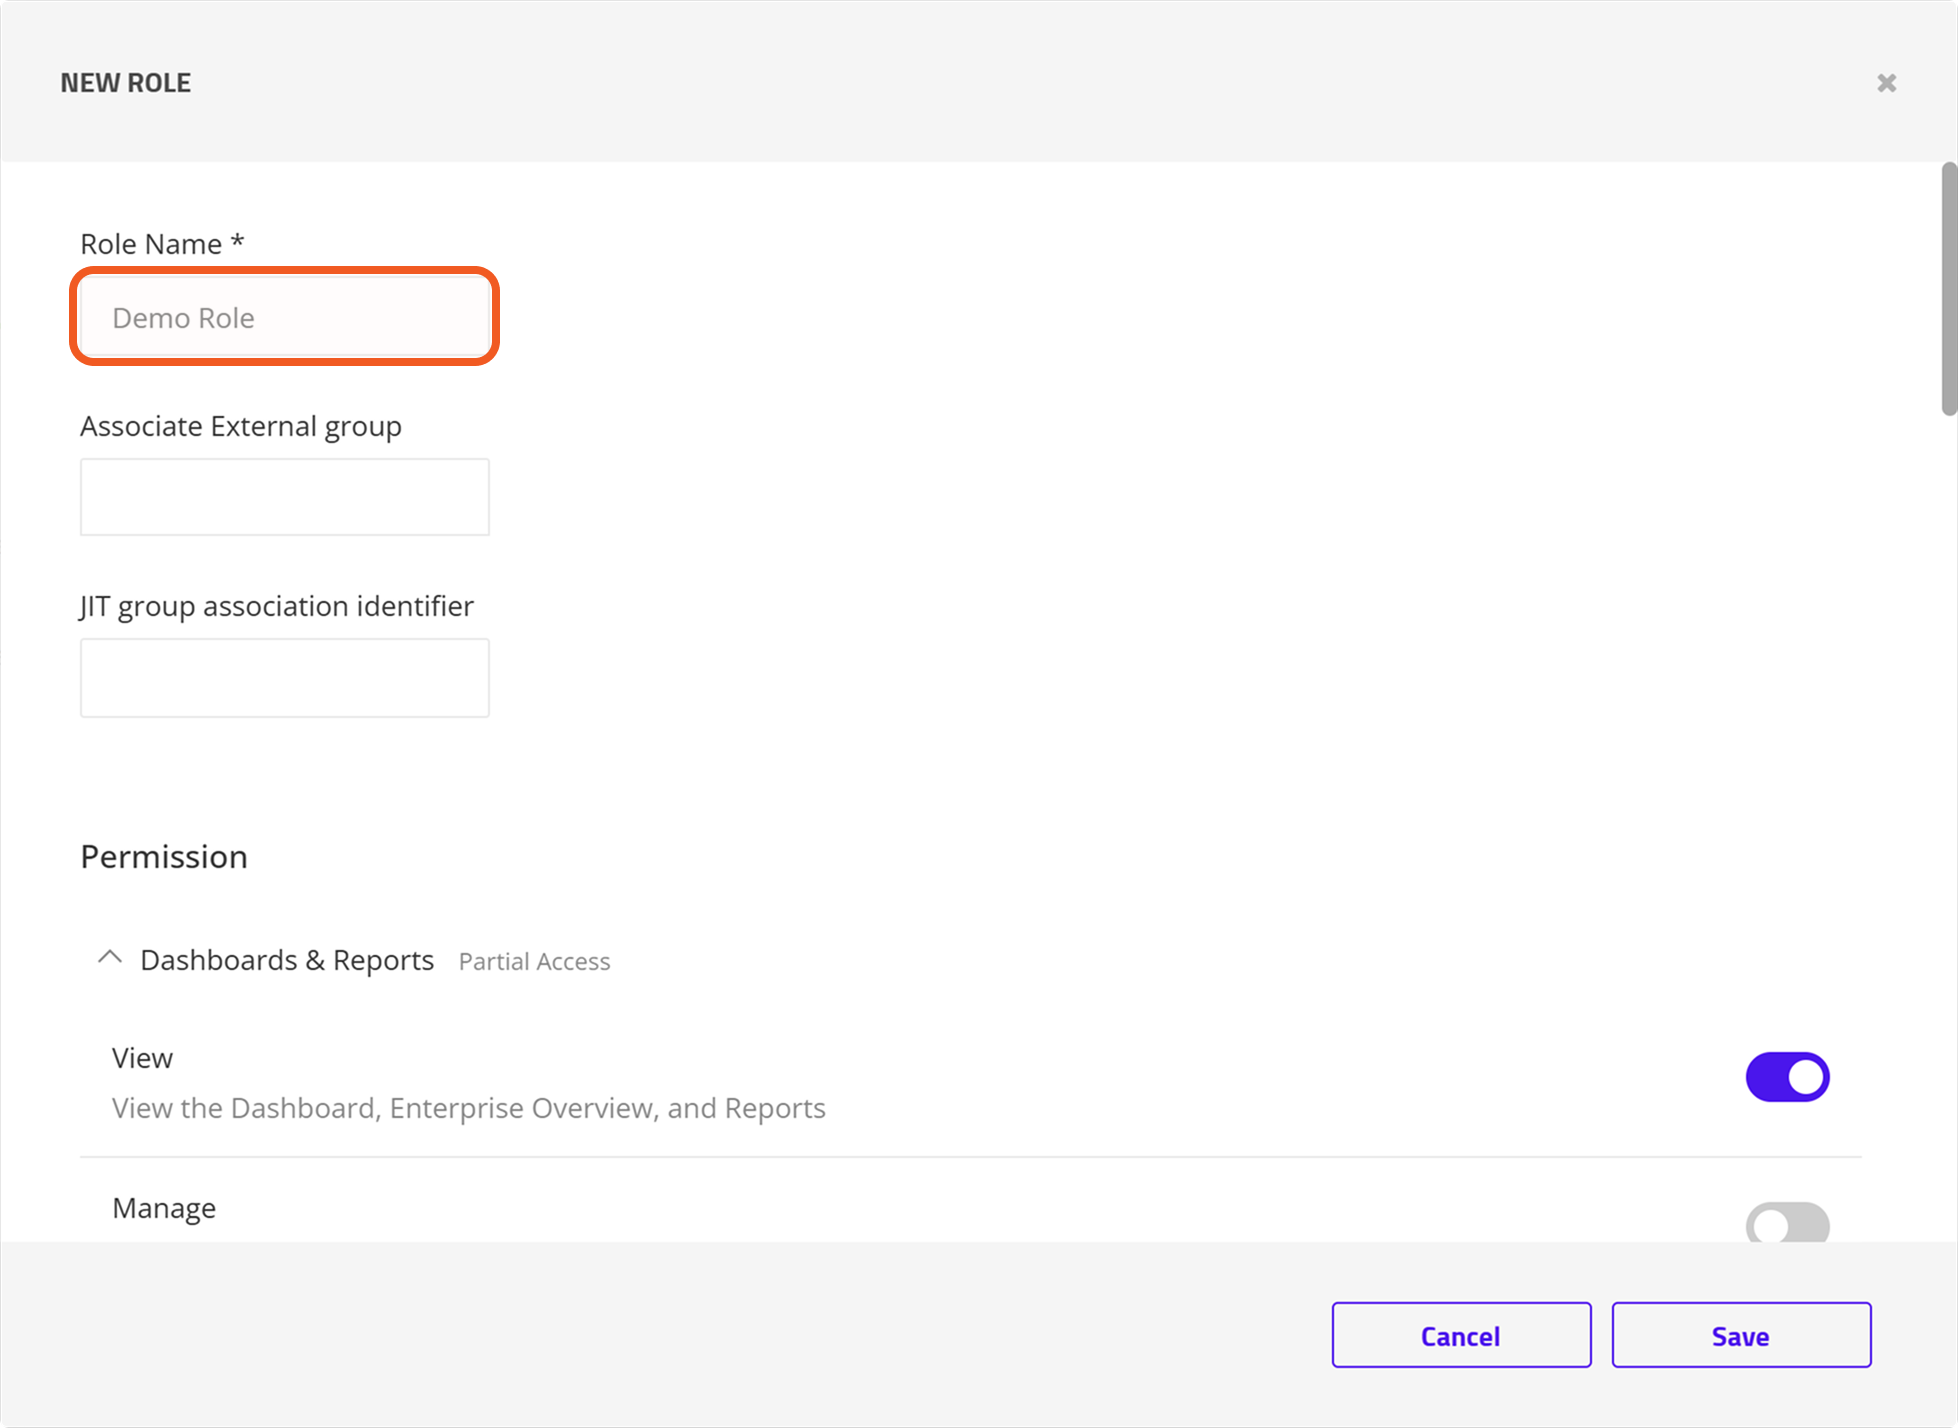
Enter a name for the role.
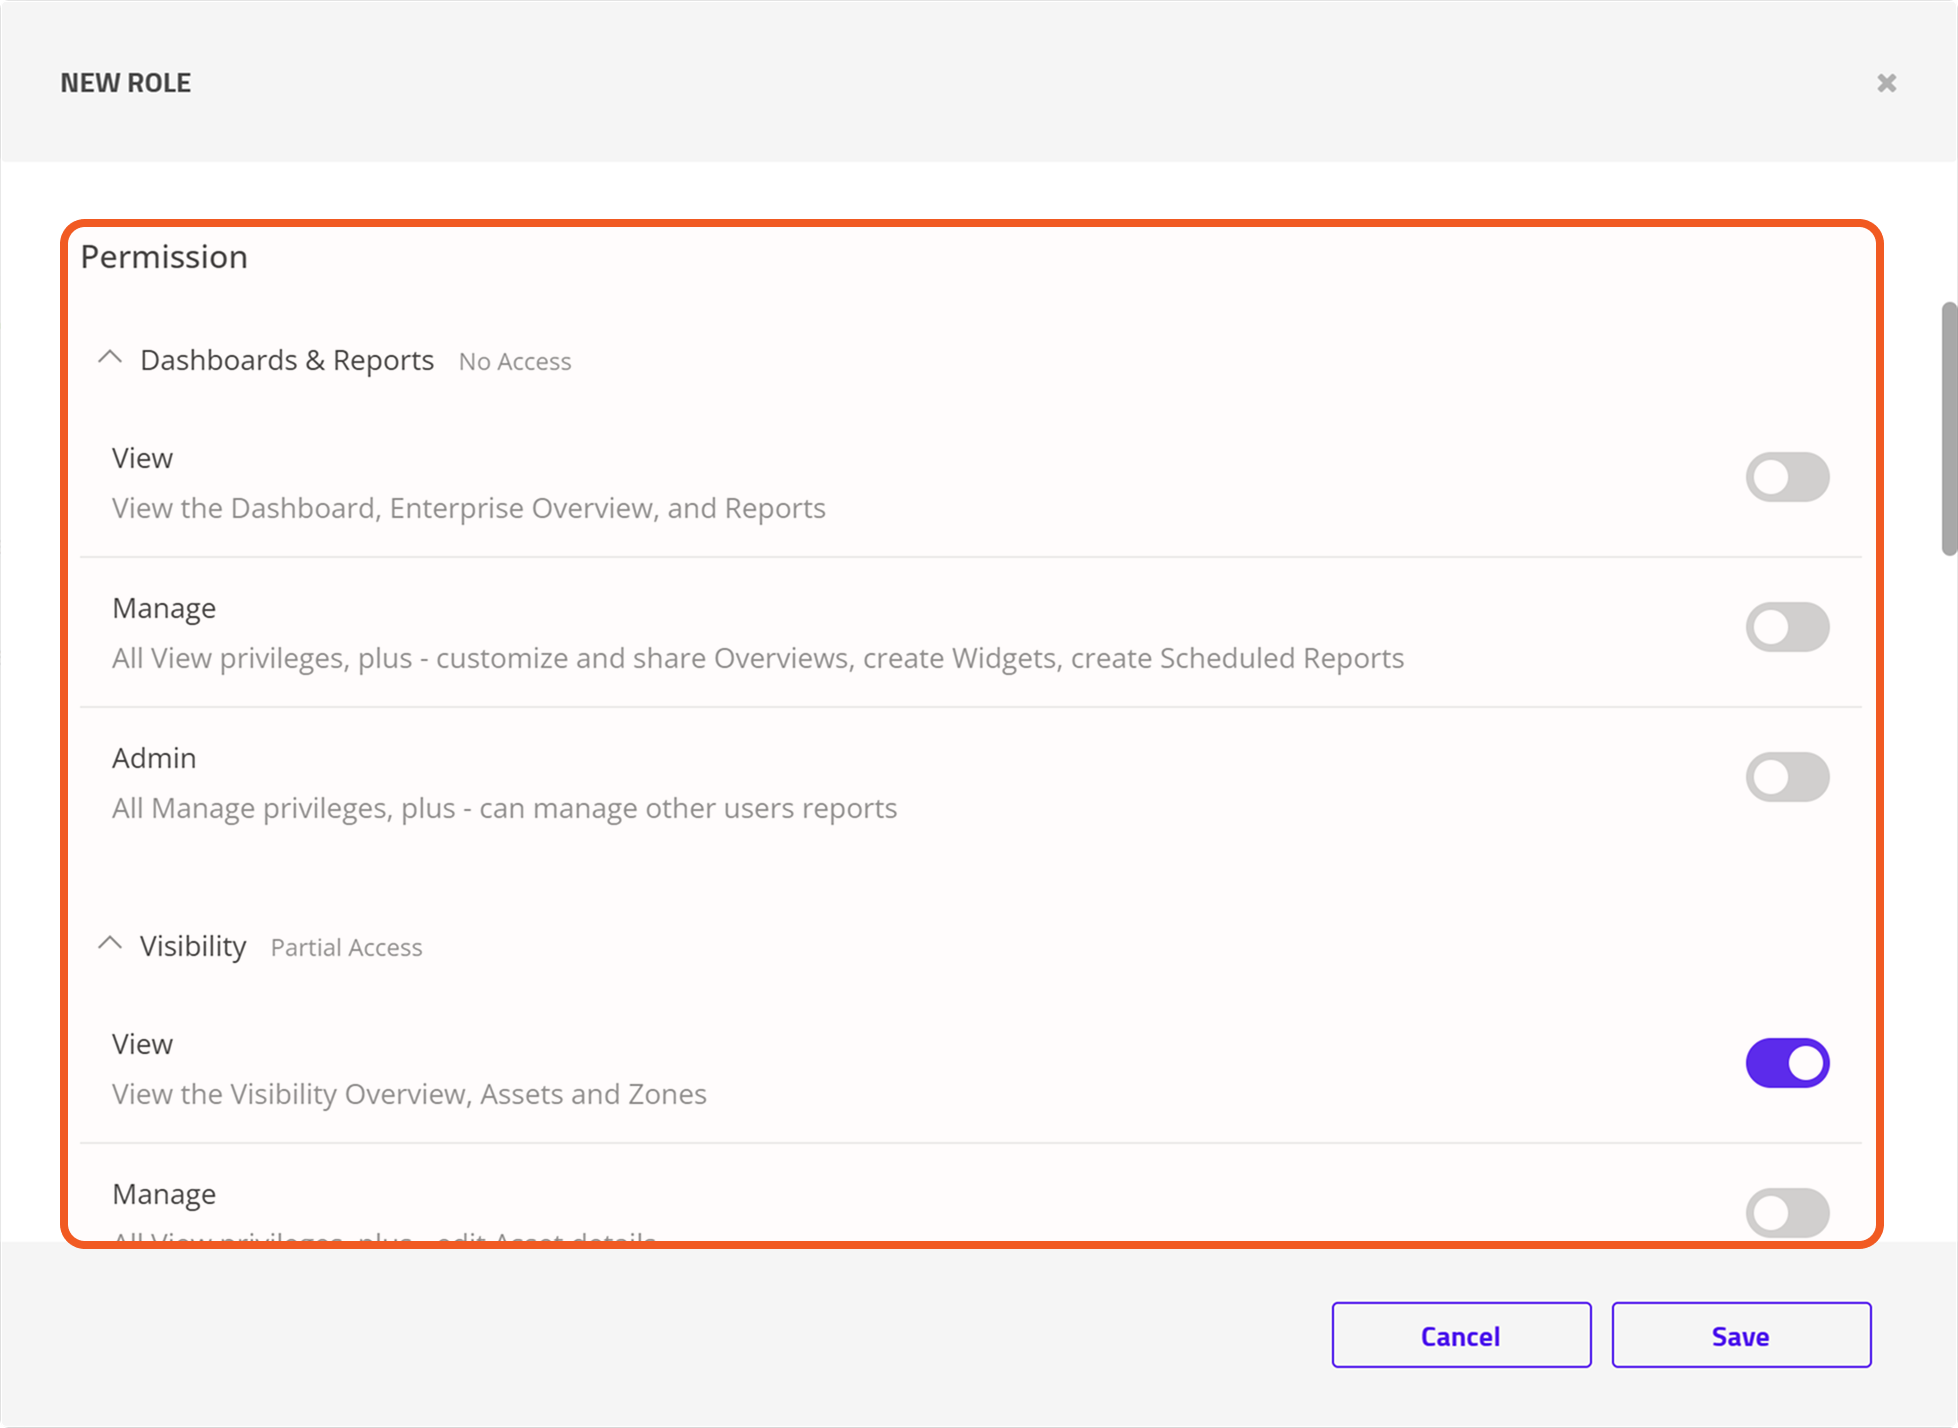
Check the desired permissions.
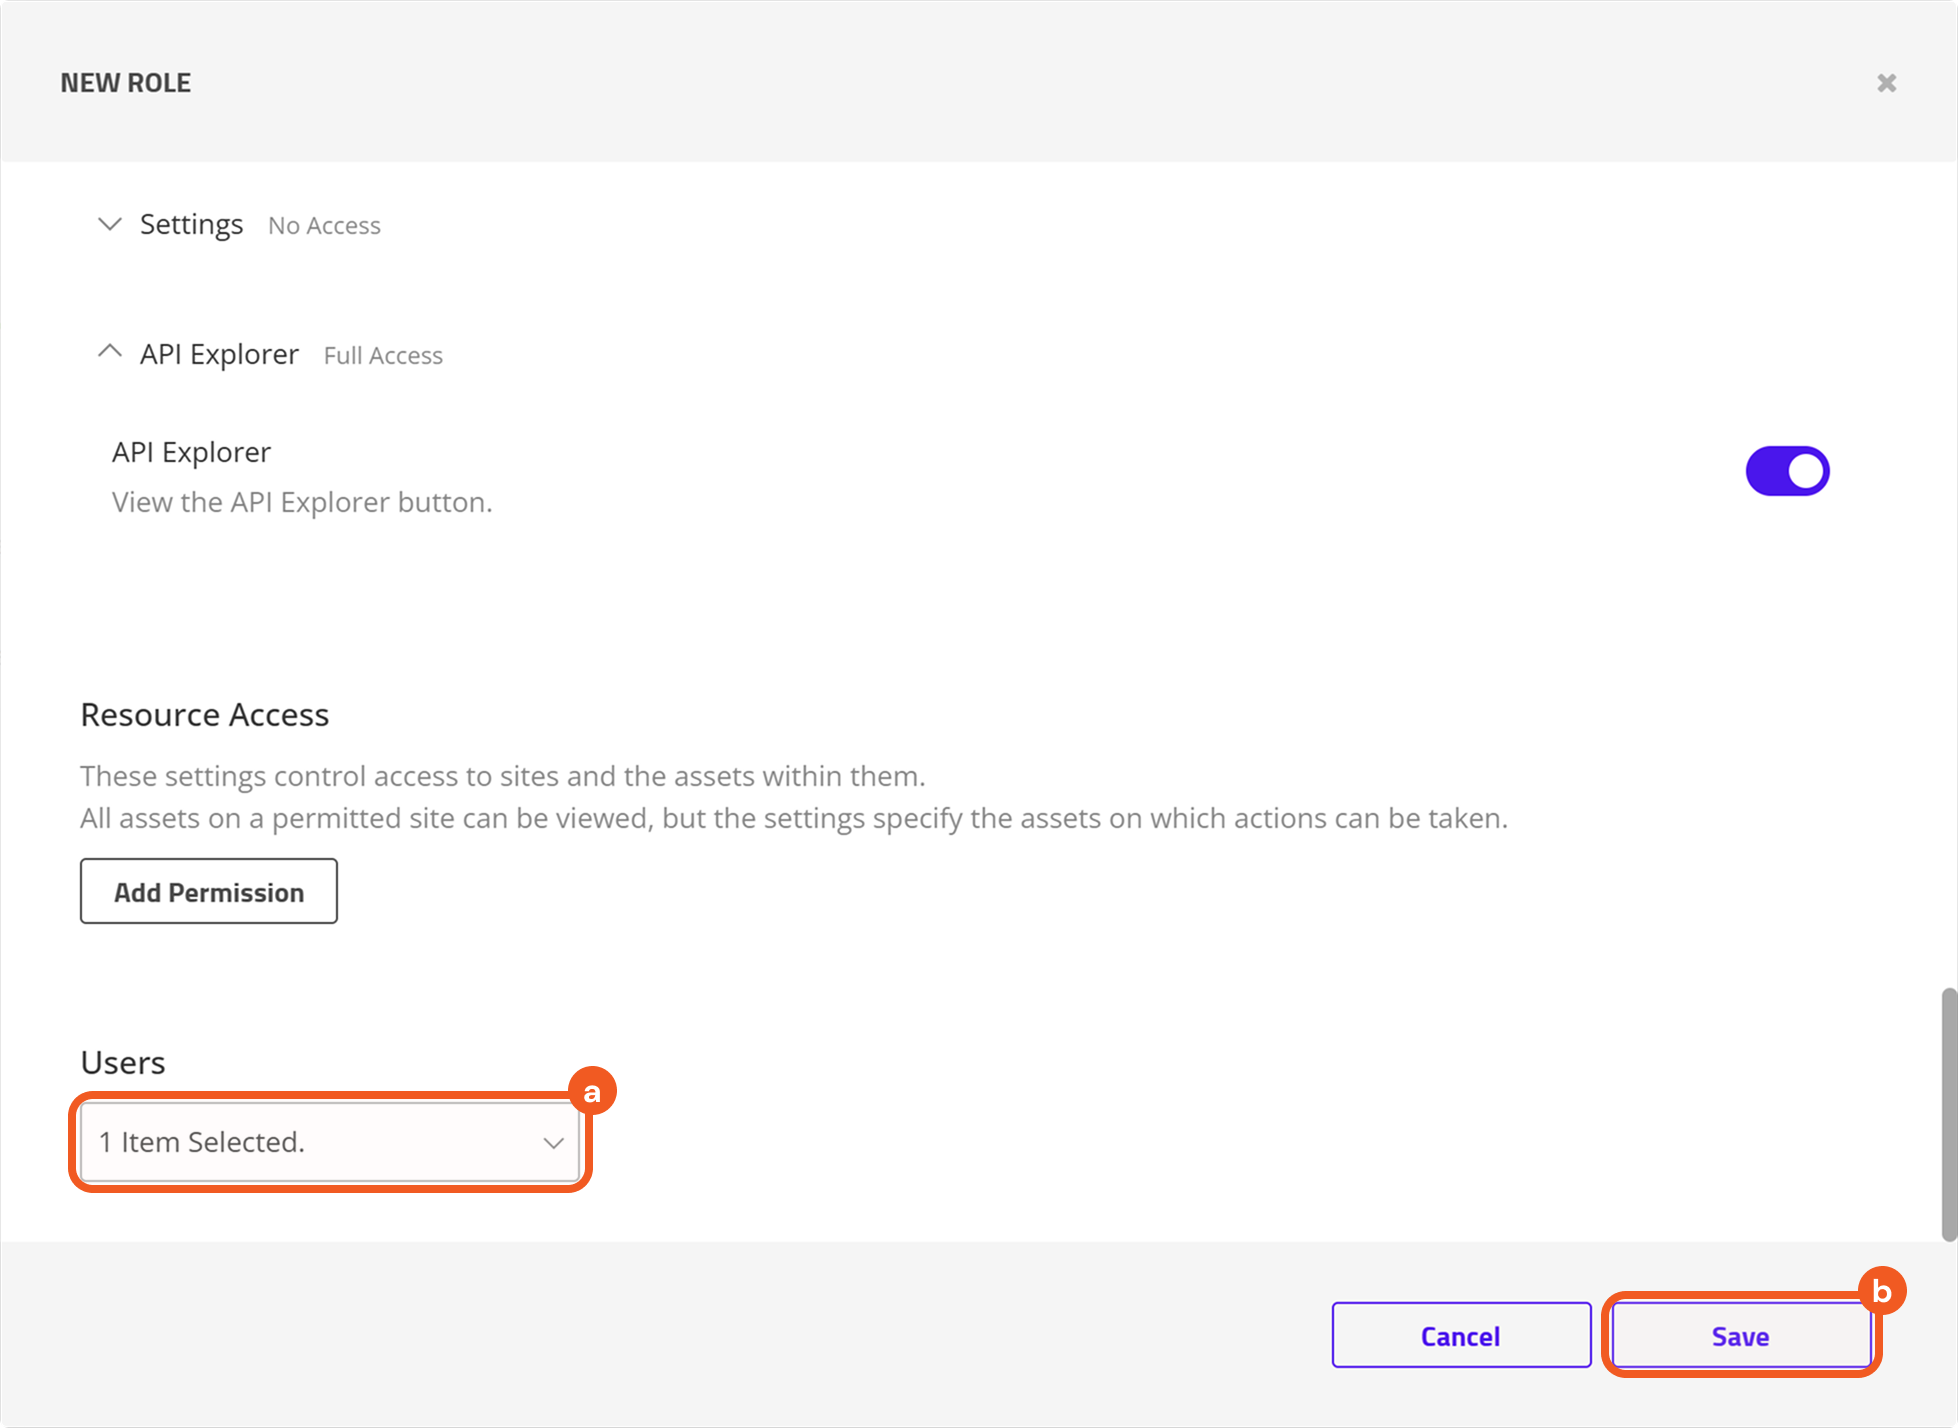
Scroll to the bottom, assign the new user to the role, then click the Save button.
Navigate back to Users to verify that the role/group has been assigned.
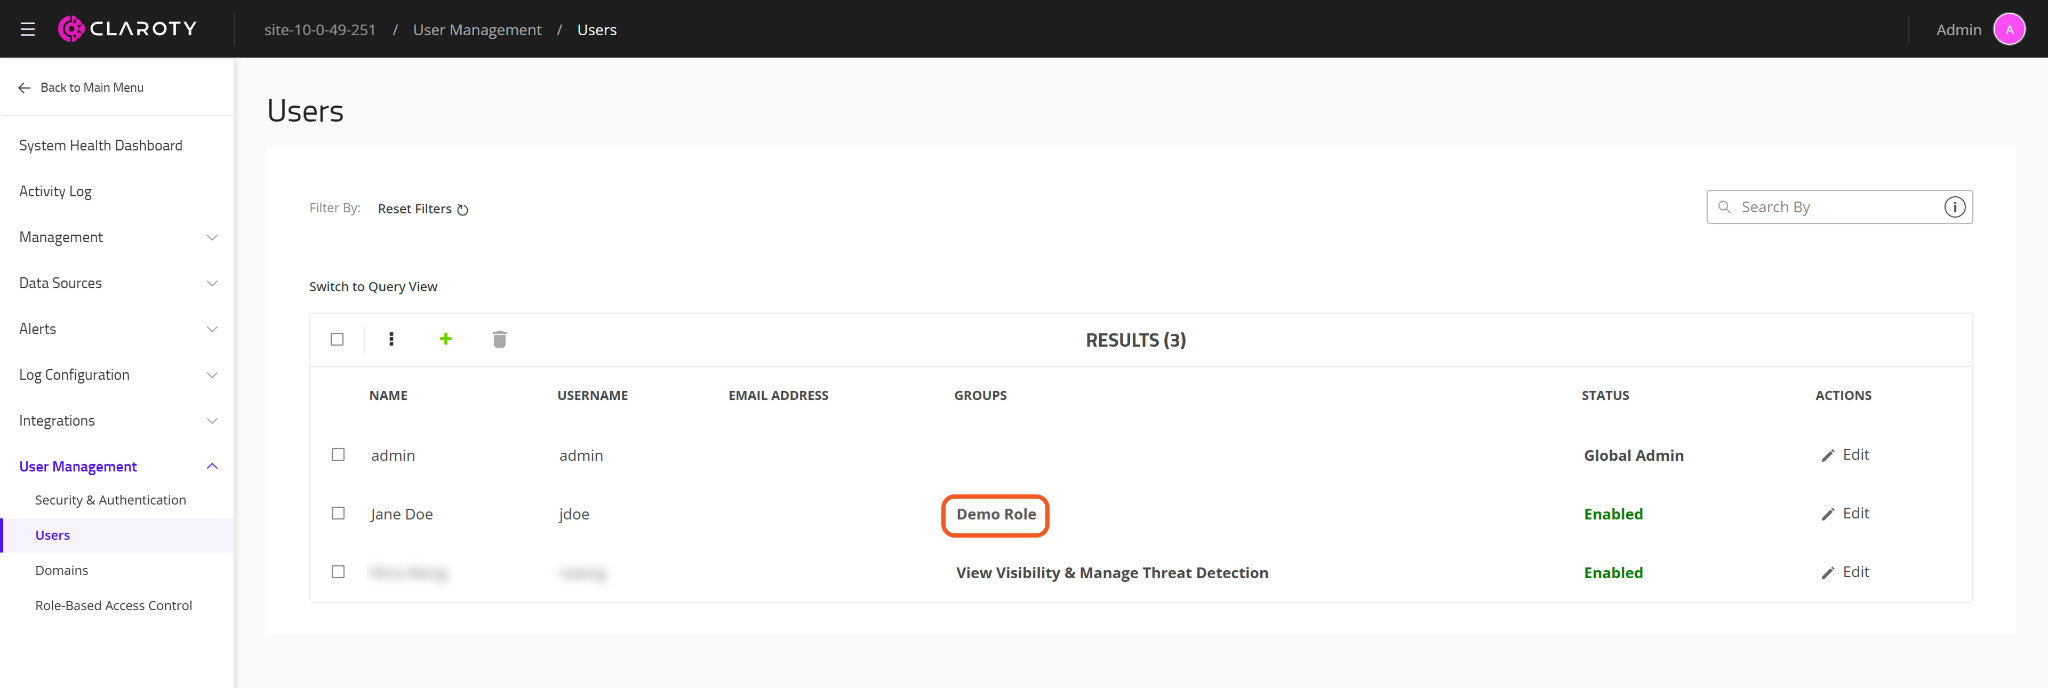
READER NOTE
In Claroty CTD, the terms Role and Group are used interchangeably.
Configuring D3 SOAR to Work with Claroty
Log in to D3 SOAR.
Find the Claroty integration.
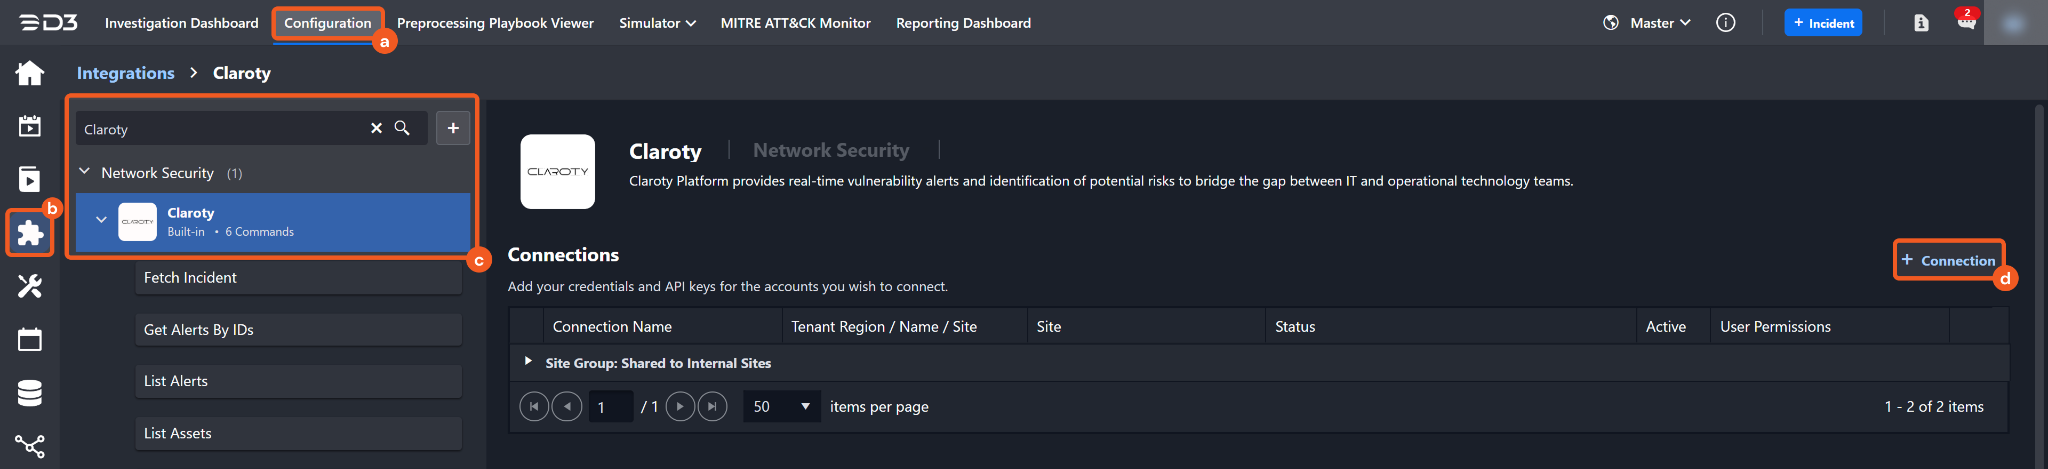
Navigate to Configuration on the top header menu.
Click on the Integration icon on the left sidebar.
Type Claroty in the search box to find the integration, then click it to select it.
Click on the + Connection button on the right side of the Connections section. A new connection window will appear.
Configure the following fields to create a connection to Claroty.
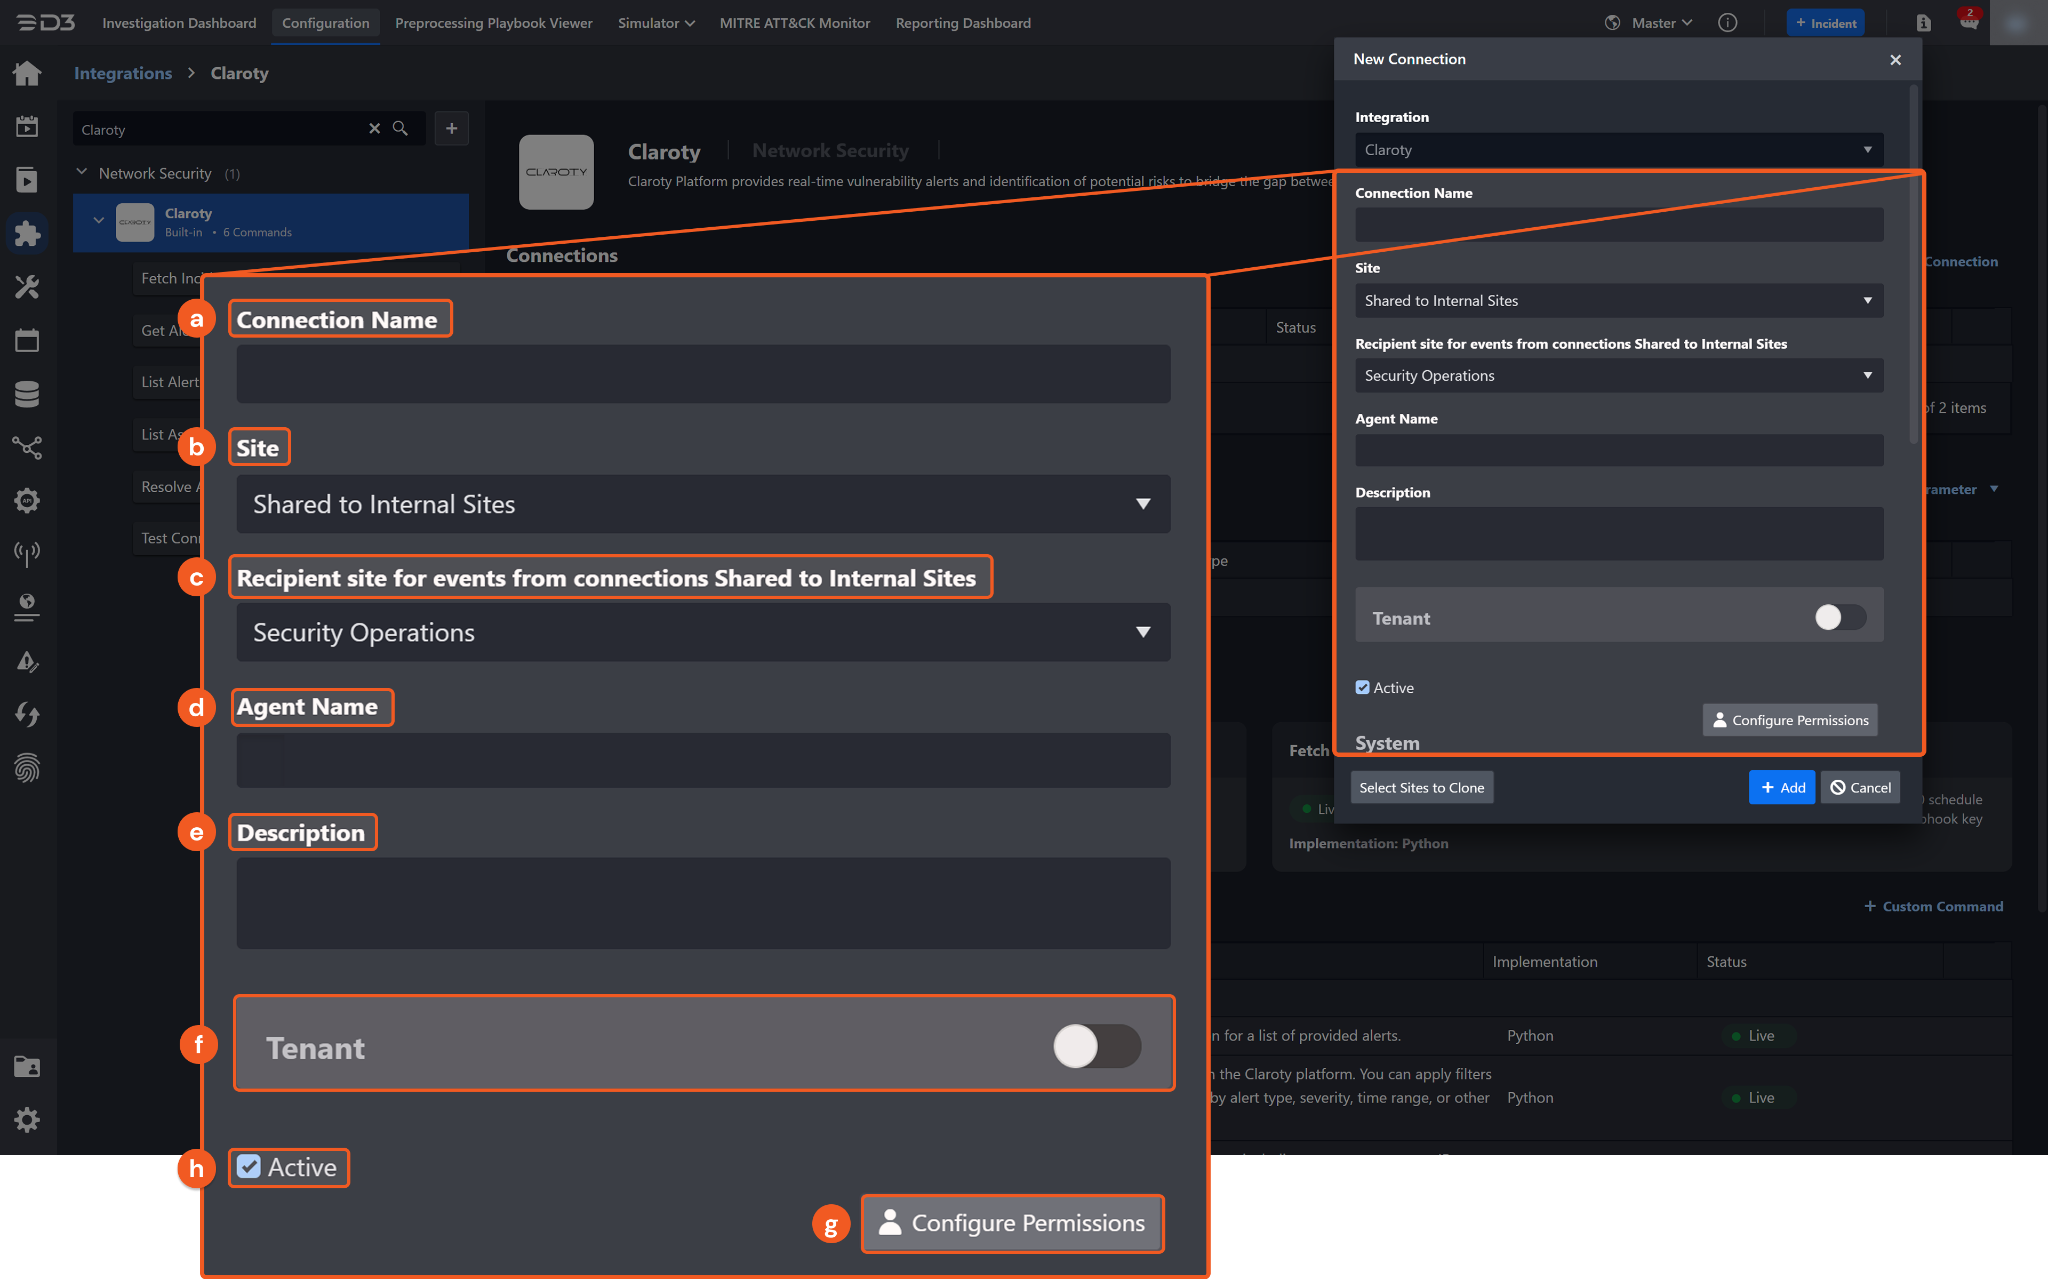
Connection Name: The desired name for the connection.
Site: The site on which to use the integration connection. Use the drop-down menu to select the site. The Share to Internal Sites option enables all internal sites to use the connection. Selecting a specific site will only enable that site to use the connection.
Recipient site for events from connections Shared to Internal Sites: This field is displayed when Share to Internal Sites is selected for the Site field, allowing selection of the internal site for deploying the integration connection.
Agent Name (Optional): The proxy agent required to build the connection. Use the dropdown menu to select the proxy agent from a list of previously configured proxy agents.
Description (Optional): The description for the connection.
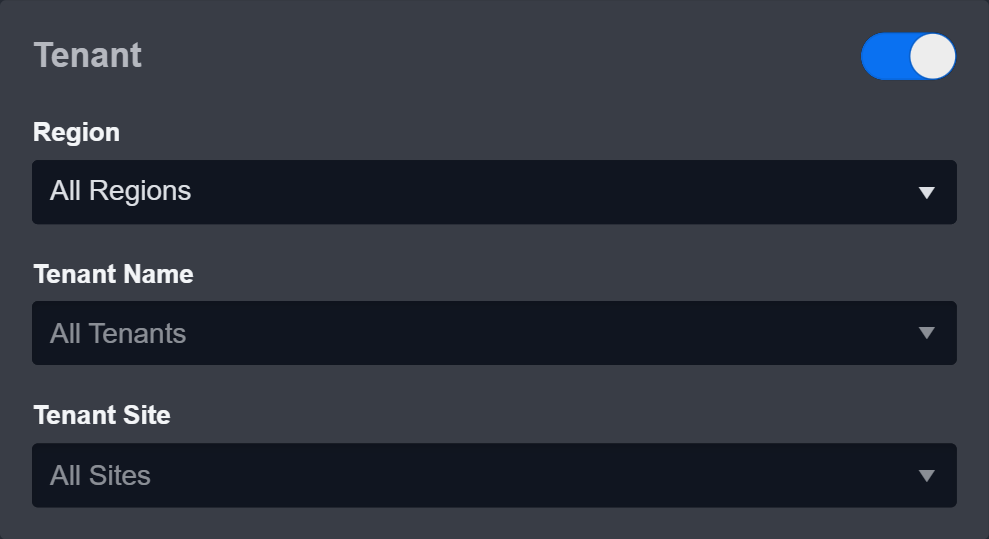
Tenant (Optional): When configuring the connection from a master tenant site, users can choose the specific tenant sites with which to share the connection. Once this setting is enabled, users can filter and select the desired tenant sites from the dropdowns to share the connection.
Active: The checkbox that enables the connection to be used when selected.
Configure User Permissions: Defines which users have access to the connection.
System: This section contains the parameters defined specifically for the integration. These parameters must be configured to create the integration connection.
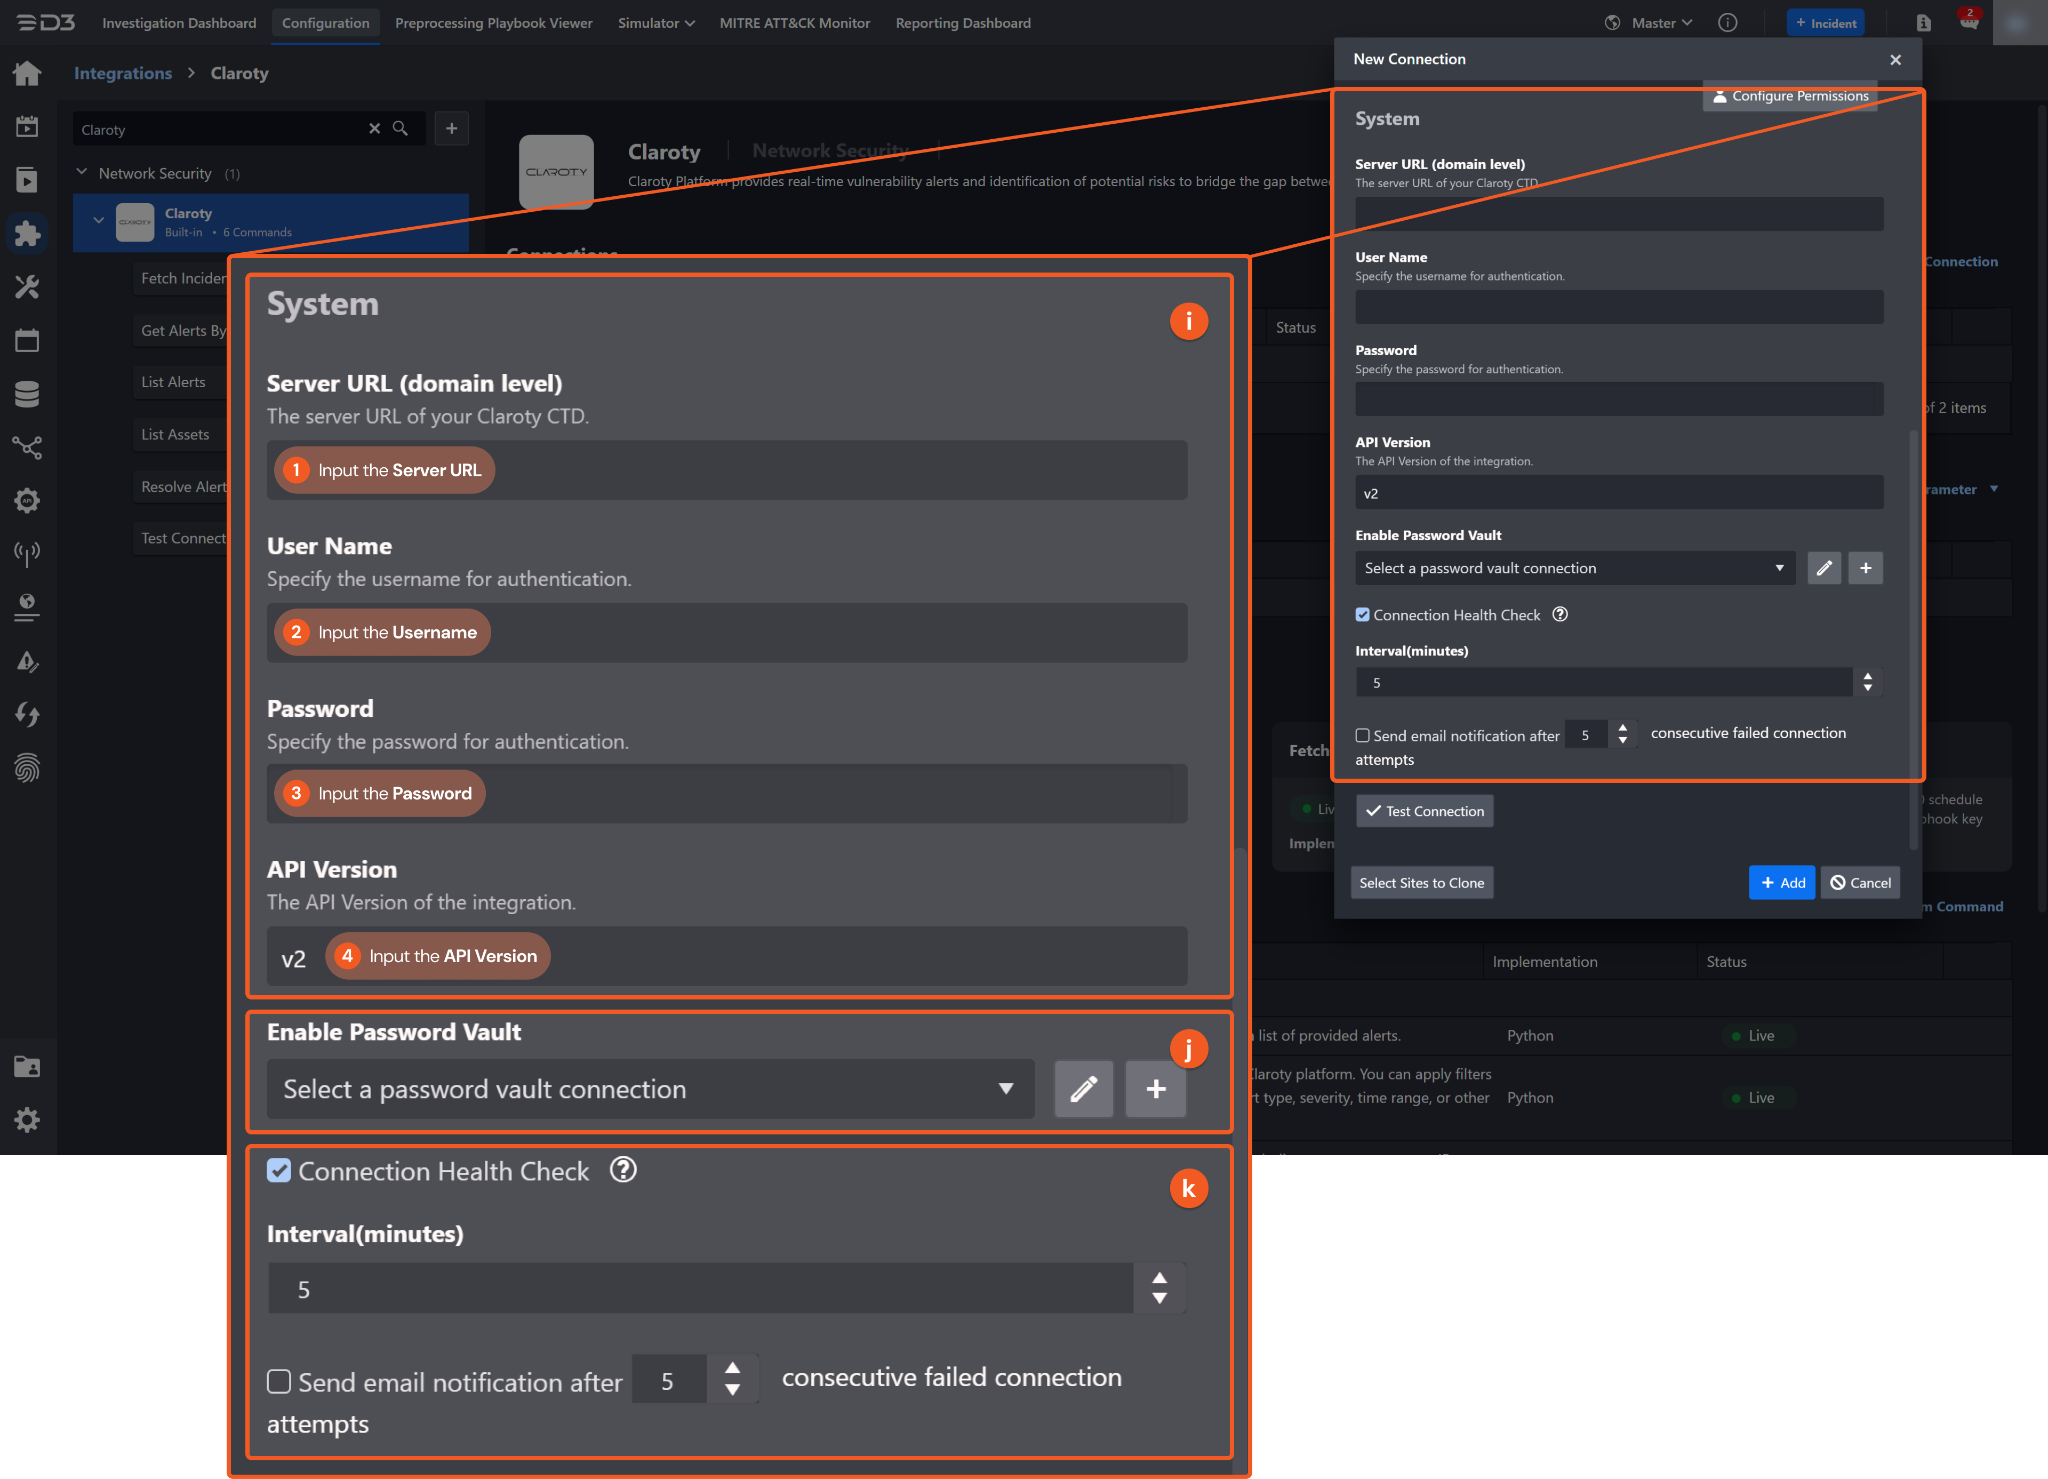
1. Input the Server URL.
2. Input the User Name.
3. Input the Password.
4. Input the API Version. The default value is v2.
Enable Password Vault: An optional feature that allows users to take the stored credentials from their own password vault. Refer to the password vault connection guide if needed.
Connection Health Check: Periodically checks the connection status by scheduling the Test Connection command at the specified interval (in minutes). Available only for active connections, this feature also allows configuring email notifications for failed attempts.
Test the connection.
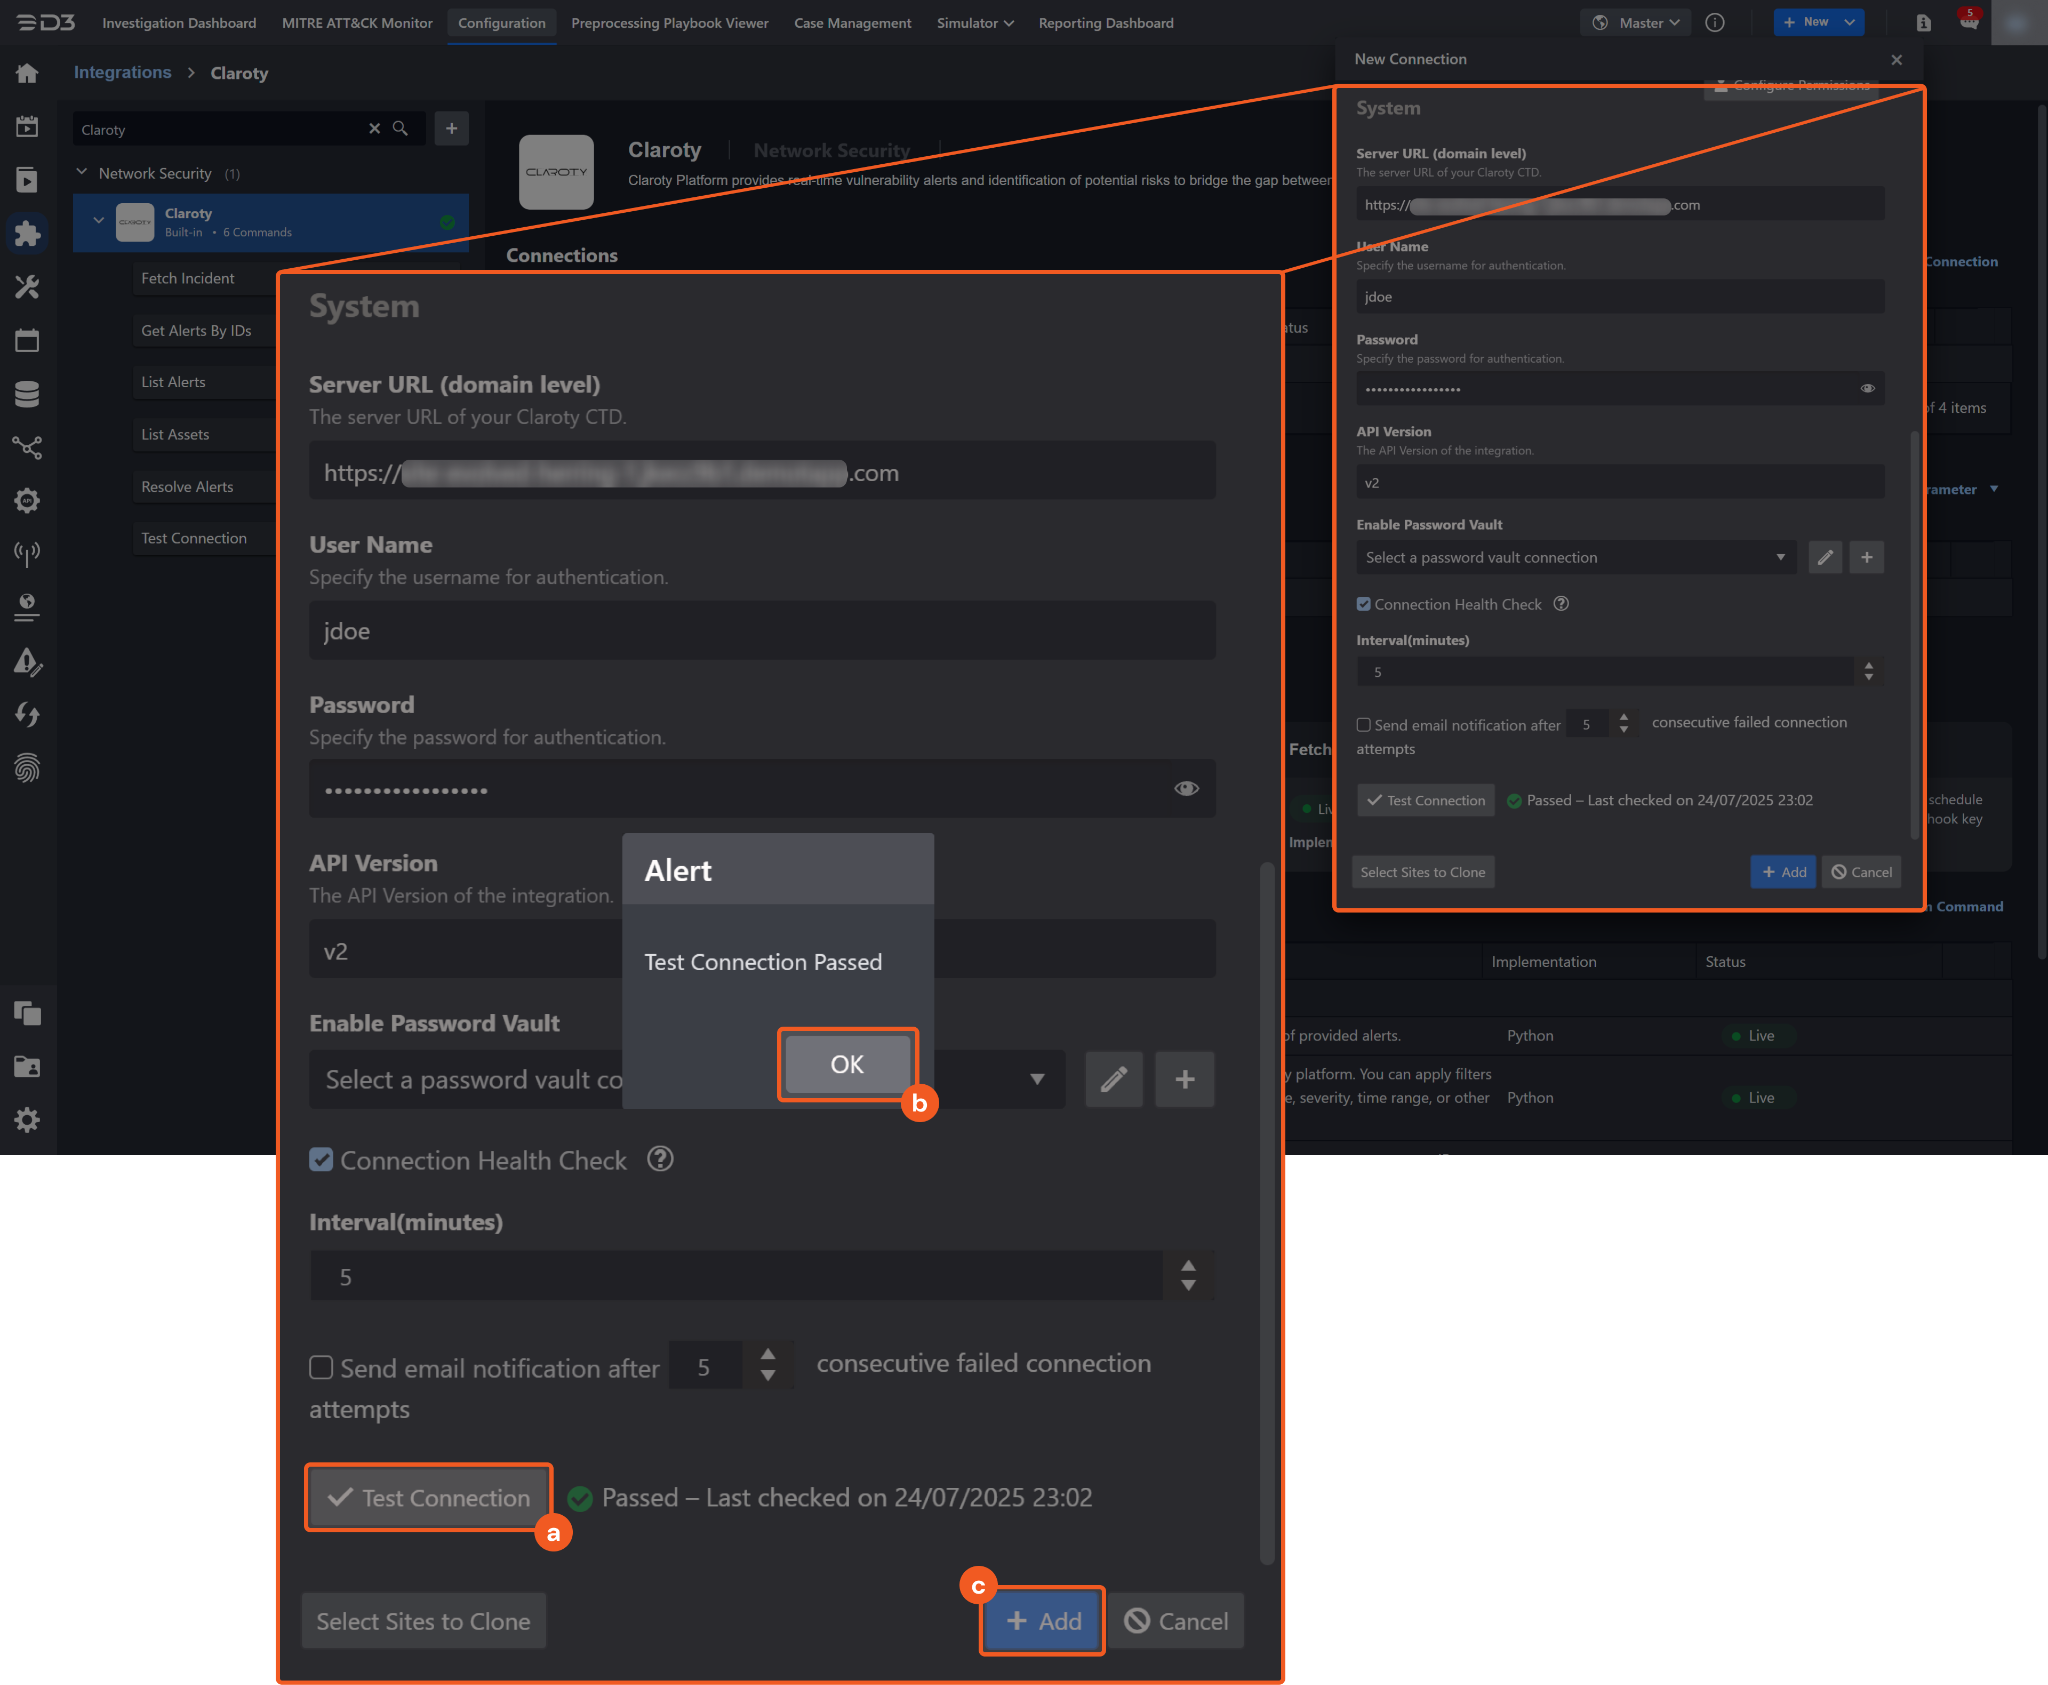
Click on the Test Connection button to verify credentials and connectivity. A success alert displays Passed with a green checkmark. If the connection fails, review the parameters and retry.
Click OK to close the alert window.
Click + Add to create and add the configured connection.
Commands
Claroty includes the following executable commands for users to set up schedules or create playbook workflows. With the Test Command function, users can execute these commands independently for playbook troubleshooting.
Integration API Note
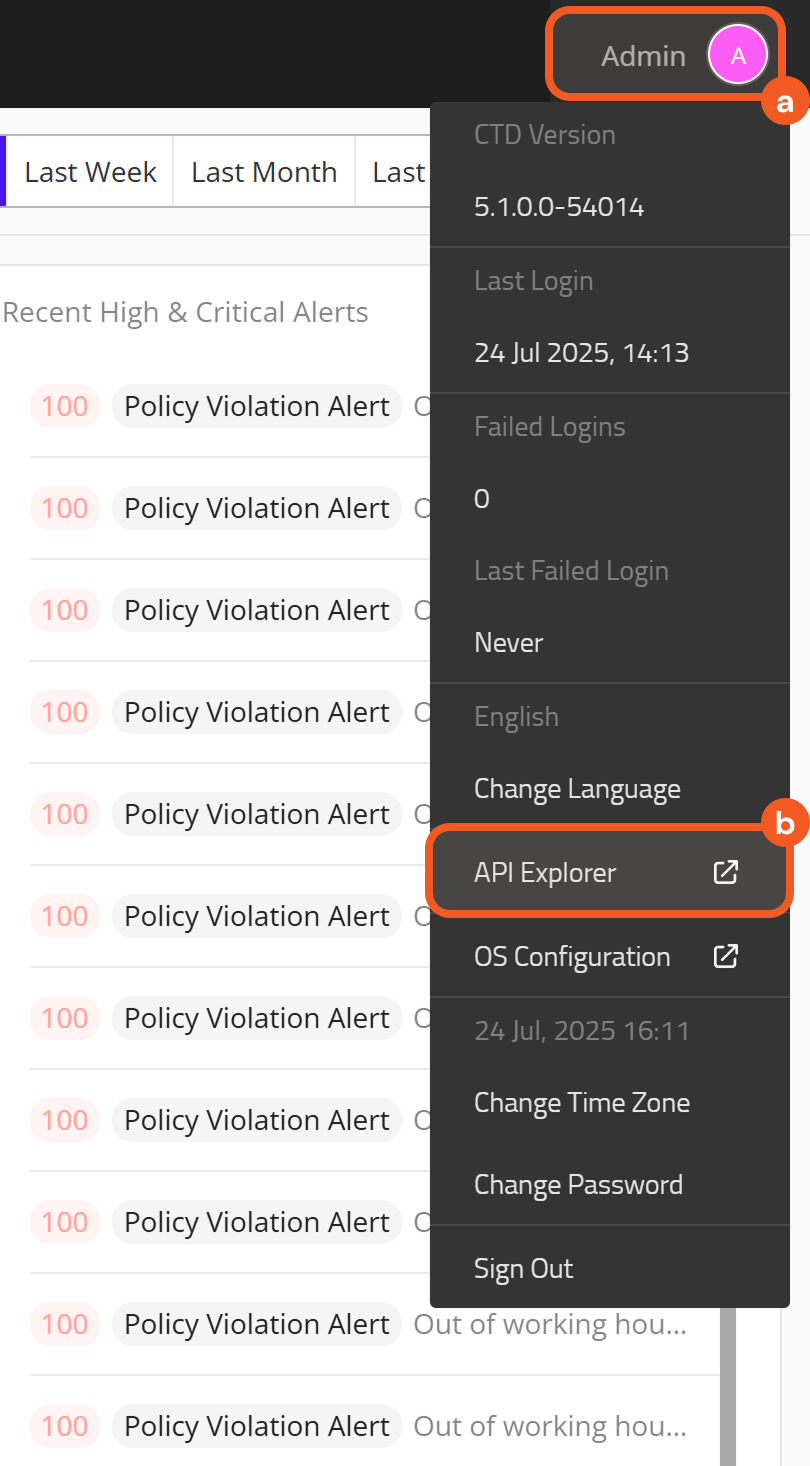
For more information about the Claroty API, refer to the Claroty API reference in the Claroty CTD console. Users with the API Explorer permission can access the API reference in the following steps:
Click the profile icon, then navigate to the API Explorer link.
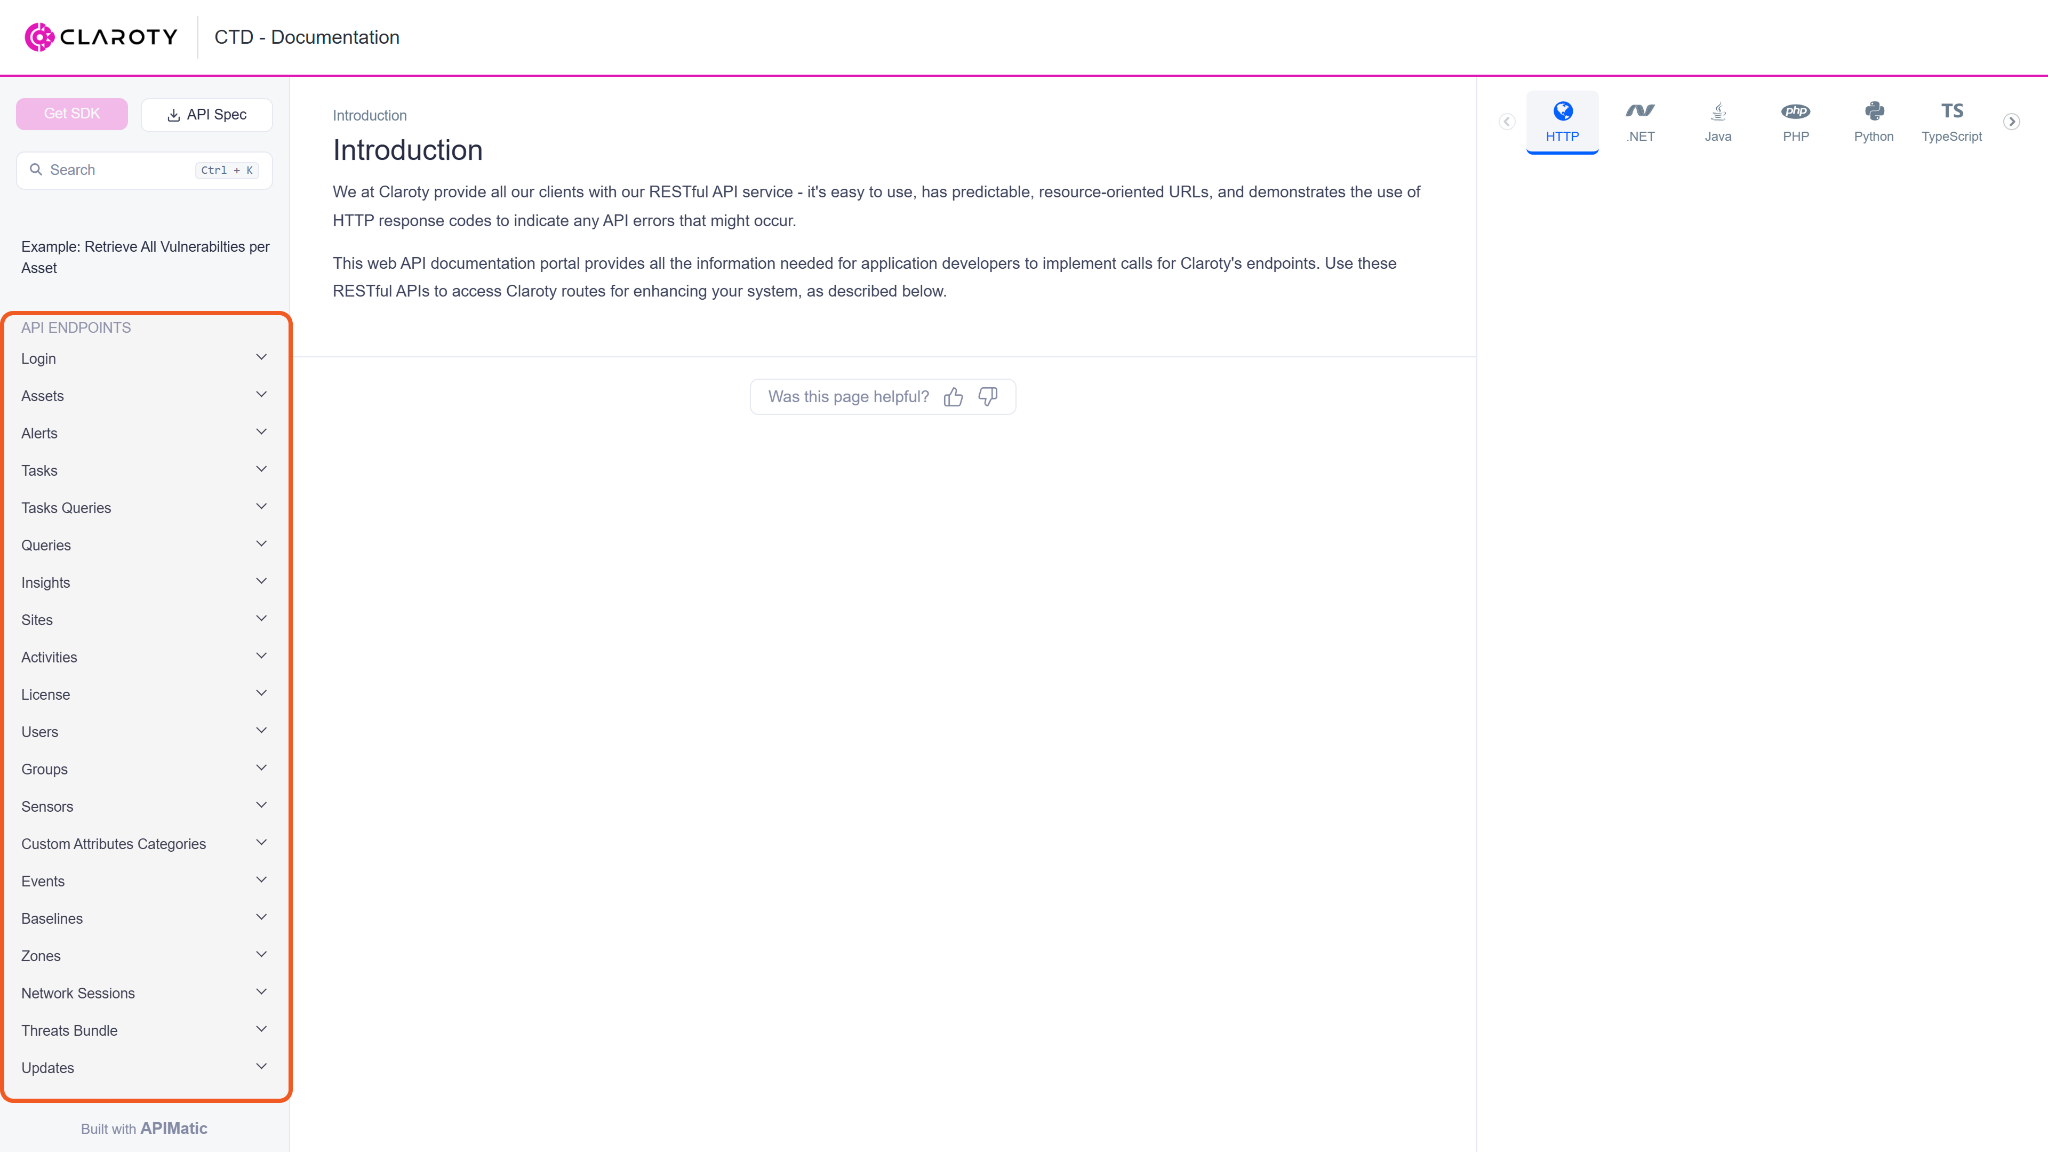
Scroll down to the API ENDPOINTS section in the left-hand panel, then click to expand any endpoint category to view its endpoints and their details.
READER NOTE
Certain permissions are required for each command. Refer to the Permission Requirements and Configuring Claroty to Work with D3 SOAR sections for details.
Note for Time-related parameters
The input format of time-related parameters may vary based on user account settings, which may cause the sample data in commands to differ from what is displayed. To adjust the time format, follow these steps:
Navigate to Configuration > Application Settings. Select Date/Time Format.
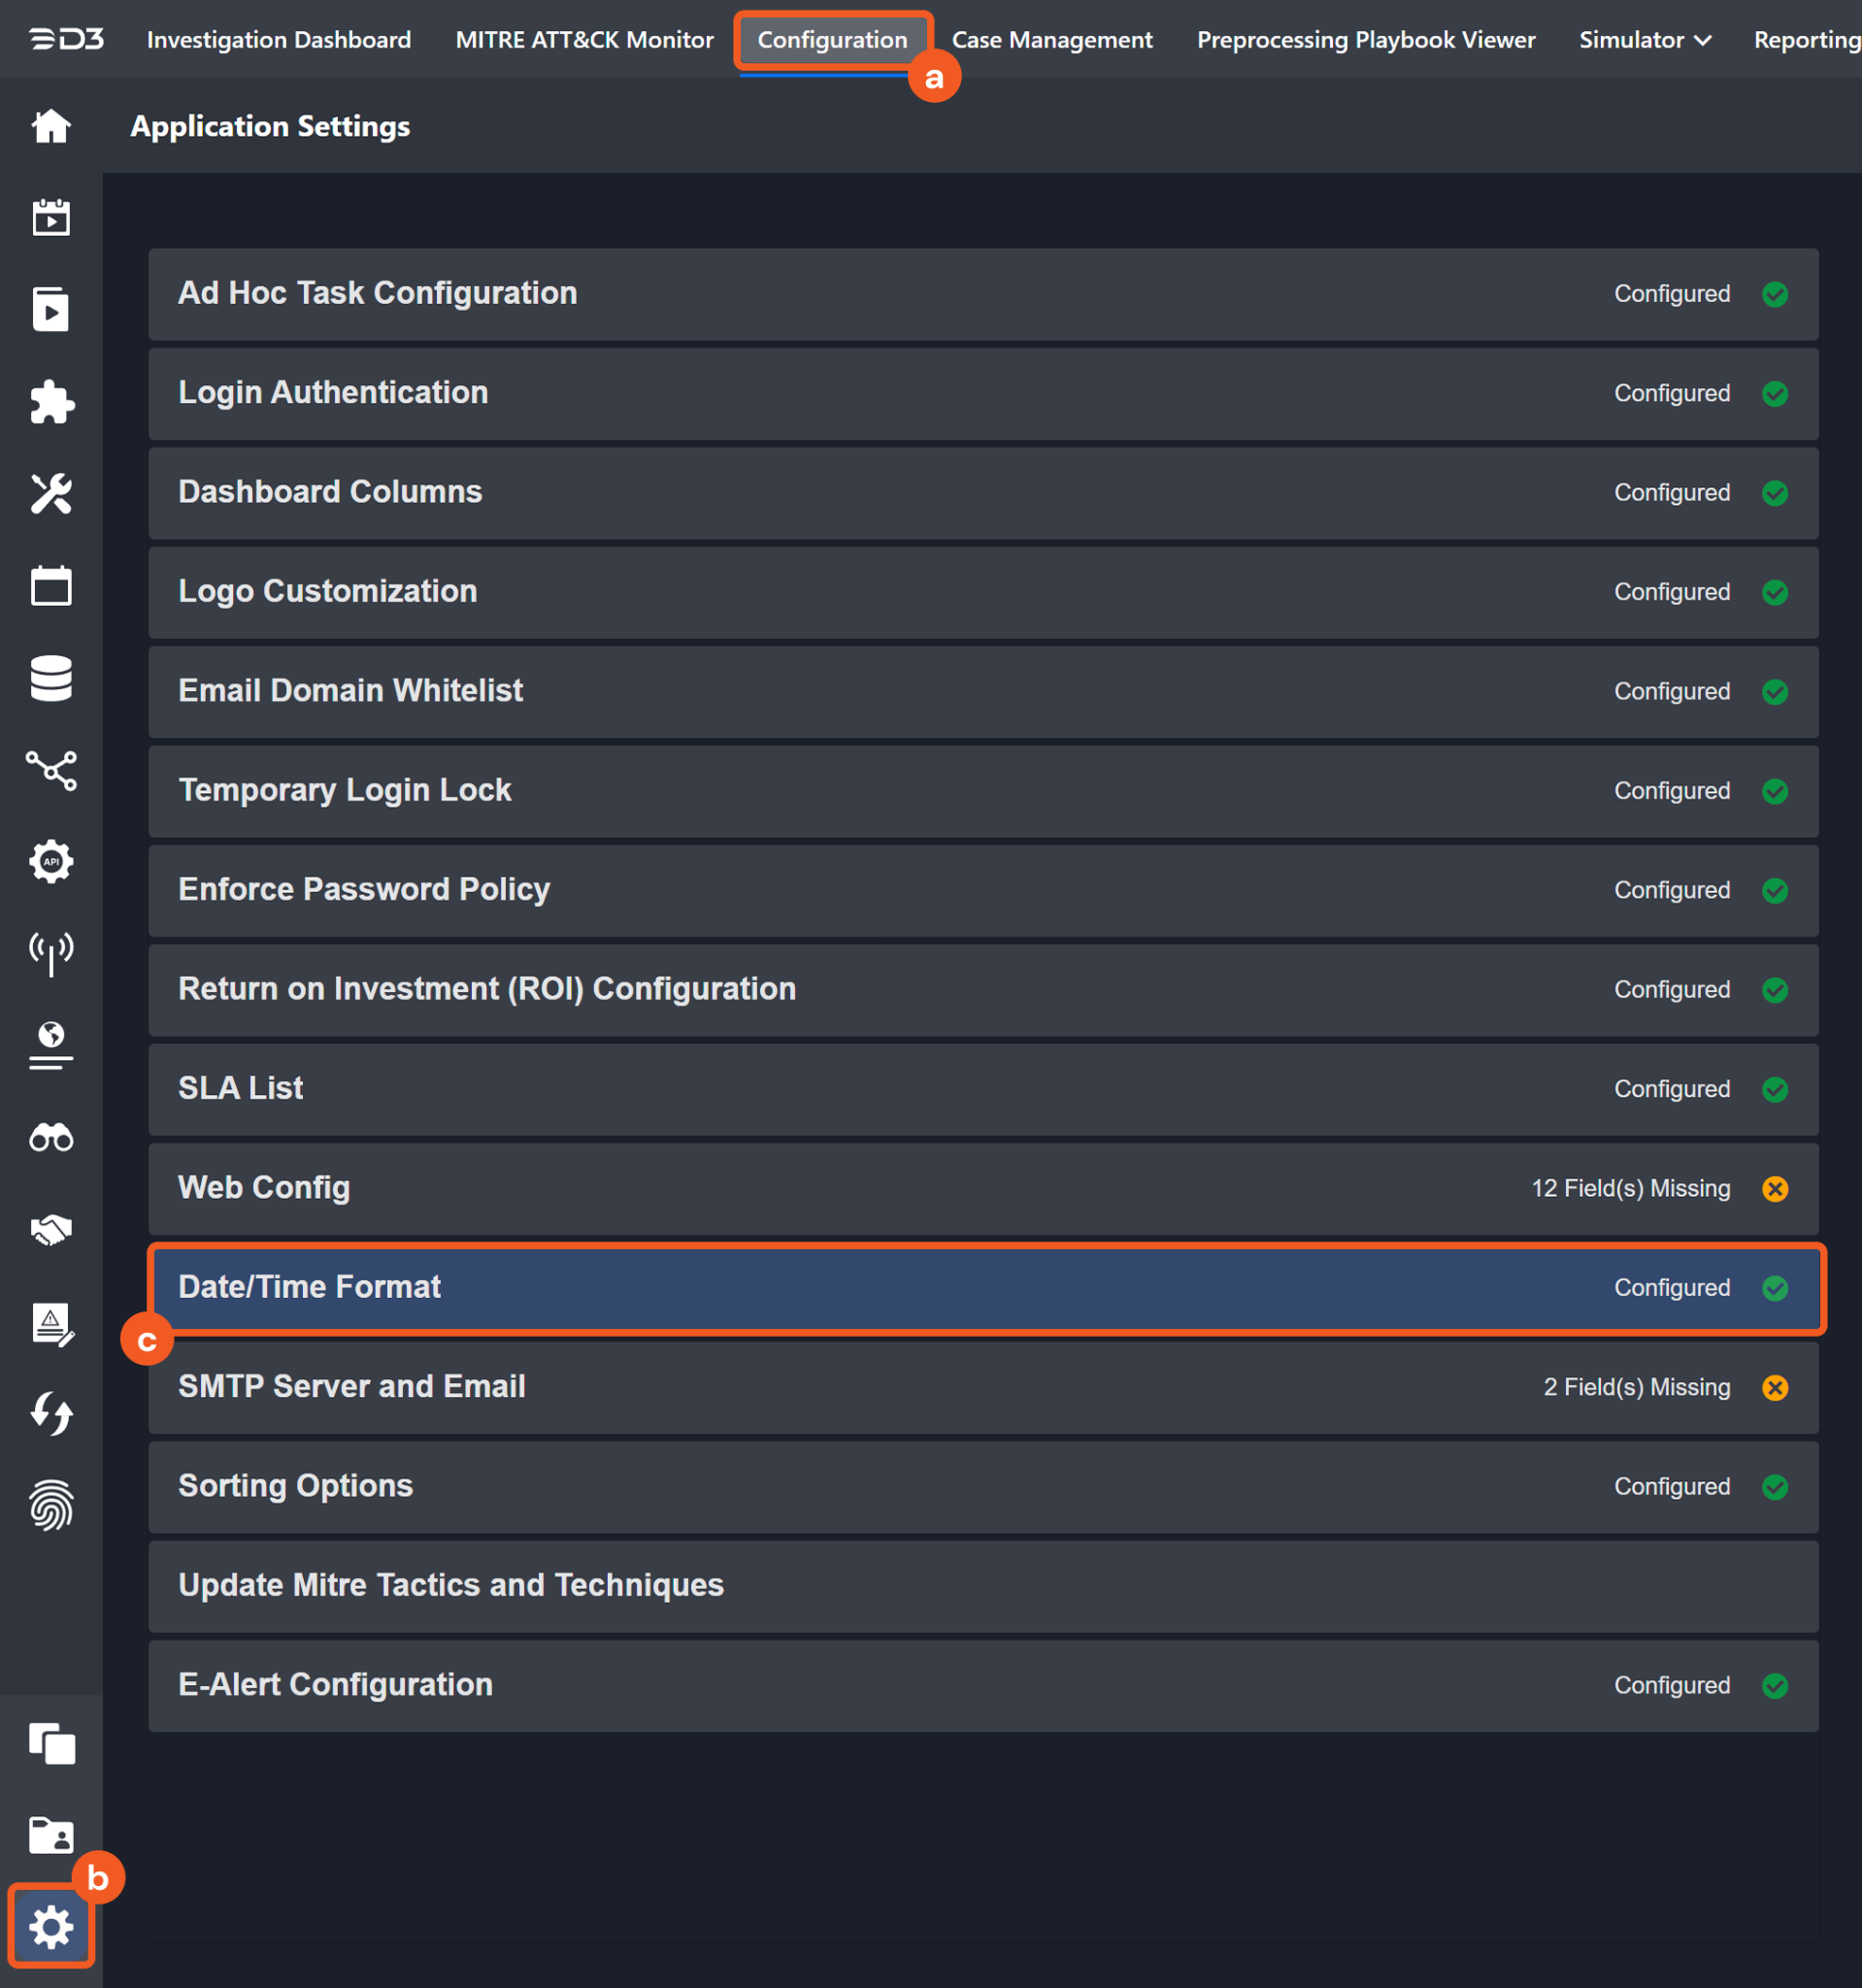
Choose the desired date and time format, then click on the Save button.
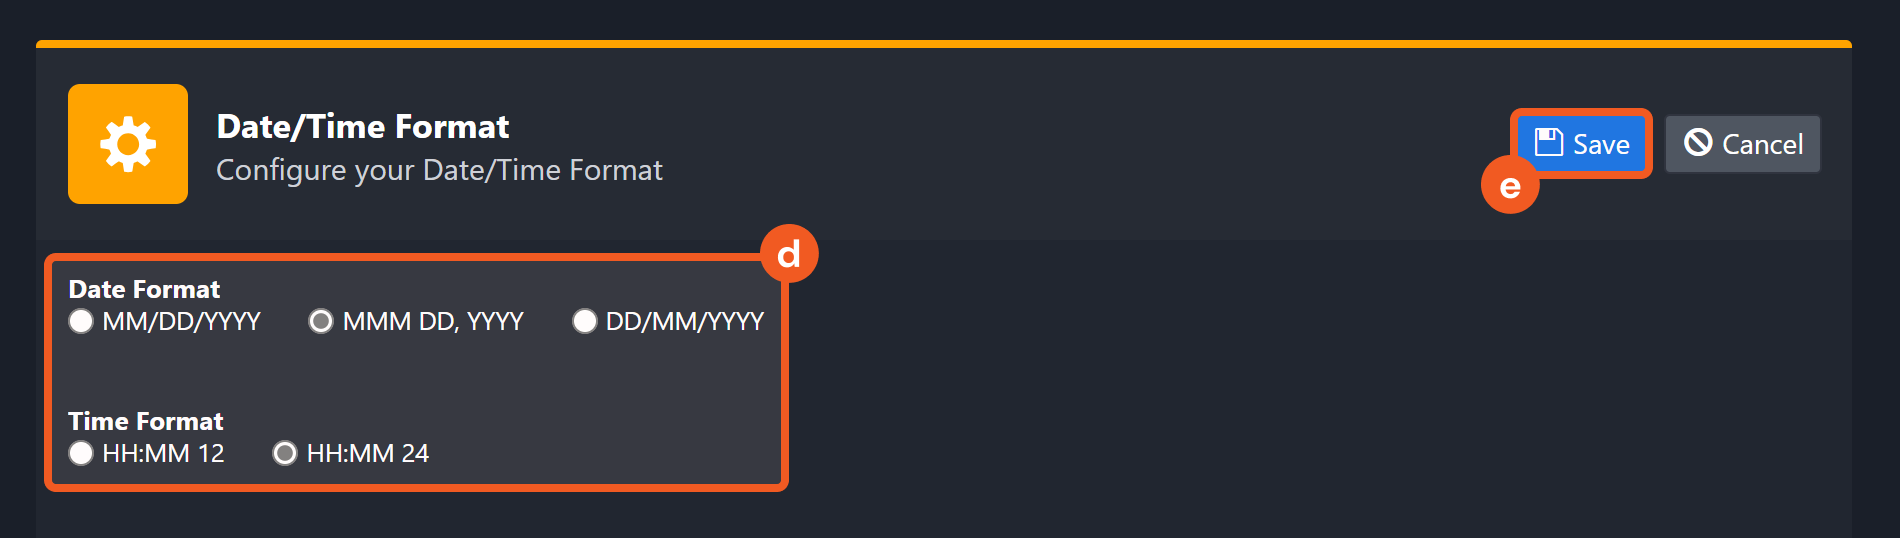
The selected time format will now be visible when configuring Date/Time command input parameters.
Fetch Incident
Retrieves incidents from the Claroty platform based on specified criteria.
Input
Input Parameter | Required/Optional | Description | Example |
Start Time | Optional | The start of the incident time range (in UTC). By default, the value is 24 hours before the current time. | 2025-05-10 01:00 |
End Time | Optional | The end of the incident time range (in UTC). By default, the value is the current time. | 2025-06-11 00:00 |
Top recent incident Number | Optional | The number of most recent incidents to retrieve. | 10 |
Search Condition | Optional | The search condition used to filter incidents. For a complete list of supported query fields, refer to the Get Alerts V2 endpoint in the Claroty API reference. |
JSON
|
Incident Field Mapping
For this integration, the default incident fields in D3 SOAR are fixed with no built-in source fields. Users can specify the source fields as needed.
Event and Incident Intake Field Mapping
Incident and event intake commands require both Event Field and Incident Field Mapping. These field mappings are the default event/incident field mappings for D3 system integrations. Users can edit the provided mappings or create custom mappings as needed. Refer to Event and Incident Intake Field Mapping for details.
Incident Main JSON Path: $.objects
Field Name | Source Field |
Title | User-defined |
Description | User-defined |
Severity | User-defined. |
Incident Category | User-defined. |
Incident Type * | User-defined |
Incident Creator | User-defined |
Incident Owner | User-defined |
Investigation Playbook | User-defined |
Due In Date | User-defined |
Origin ID | User-defined |
Unique Key | User-defined |
Tactics | User-defined |
Techniques | User-defined |
Event Field Mapping
Main Event JSON Path
$
Refer to the table below for Event Field Mapping:
Field Name | Source Field |
Unique Event Key | .id |
Start Time | .timestamp |
Severity | .severity__ |
Description | .description |
Event Type | .type__ |
Status | .resolution__ |
Event Category | .category__ |
Output
To view the sample output data for all commands, refer to this article.
Error Handling
If the Return Data displays Failed, an Error tab will appear in the Test Result window.
The error tab contains the details responded from D3 SOAR or third-party API calls, including Failure Indicator, Status Code, and Message. This can help locate the root cause of a command failure.
Parts in Error | Description | Example |
Failure Indicator | Indicates the command failure that happened at a specific input and/or API call. | Fetch Incident failed. |
Status Code | The response code issued by the third-party API server or the D3 SOAR system that can be used to locate the corresponding error category. For example, if the returned status code is 401, the selected connection is unauthorized to run the command. The user or system support would need to check the permission setting in the Claroty portal. Refer to the HTTP Status Code Registry for details. | Status Code: 400. |
Message | The raw data or captured key error message from the integration API server about the API request failure. | Message: Unknown lookup_type: exact_. |
Error Sample Data Fetch Incident failed. Status Code: 400. Message: Unknown lookup_type: exact_. |
Get Alerts by IDs
Retrieves details for the specified alerts.
READER NOTE
Alert IDs is a required parameter to run this command.
Run the List Alerts command to obtain the Alert IDs. Alert IDs can be found in the raw data at $.objects[*].id.
Input
Input Parameter | Required/Optional | Description | Example |
Alert IDs | Required | The IDs of the alerts for which to retrieve details. Alert IDs can be obtained by the List Alerts command. |
JSON
|
Output
To view the sample output data for all commands, refer to this article.
Error Handling
If the Return Data displays Partially Successful or Failed, an Error tab will appear in the Test Result window.
The error tab contains the details responded from D3 SOAR or third-party API calls, including Failure Indicator, Status Code, and Message. This can help locate the root cause of a command failure.
Parts in Error | Description | Example |
Failure Indicator | Indicates the command failure that happened at a specific input and/or API call. | Get Alerts by IDs failed. |
Status Code | The response code issued by the third-party API server or the D3 SOAR system that can be used to locate the corresponding error category. For example, if the returned status code is 401, the selected connection is unauthorized to run the command. The user or system support would need to check the permission setting in the Claroty portal. Refer to the HTTP Status Code Registry for details. | Status Code: 404. |
Message | The raw data or captured key error message from the integration API server about the API request failure. | Message: No Alert found with id=(1200,). |
Error Sample Data Get Alerts by IDs failed. Status Code: 404. Message: No Alert found with id=(1200,). |
List Alerts
Retrieves a list of alerts from the Claroty platform. Filtering by alert type, severity, time range, and other criteria is supported.
Input
Input Parameter | Required/Optional | Description | Example |
Fields | Optional | The alert fields to include in the response. By default, all fields are returned, which may impact performance. Invalid field names are excluded from the response. |
JSON
|
Limit | Optional | The maximum number of alerts to retrieve. By default, all alerts are returned, up to a limit of 500. | 10 |
Filters | Optional | The query conditions used to filter the returned alert list. |
JSON
|
Output
To view the sample output data for all commands, refer to this article.
Error Handling
If the Return Data displays Failed, an Error tab will appear in the Test Result window.
The error tab contains the details responded from D3 SOAR or third-party API calls, including Failure Indicator, Status Code, and Message. This can help locate the root cause of a command failure.
Parts in Error | Description | Example |
Failure Indicator | Indicates the command failure that happened at a specific input and/or API call. | List Alerts failed. |
Status Code | The response code issued by the third-party API server or the D3 SOAR system that can be used to locate the corresponding error category. For example, if the returned status code is 401, the selected connection is unauthorized to run the command. The user or system support would need to check the permission setting in the Claroty portal. Refer to the HTTP Status Code Registry for details. | Status Code: 400. |
Message | The raw data or captured key error message from the integration API server about the API request failure. | Message: Maximum allowed per_page is 500. |
Error Sample Data List Alerts failed. Status Code: 400. Message: Maximum allowed per_page is 500. |
List Assets
Retrieves asset data from Claroty, including names, types, IP addresses, and other details.
Input
Input Parameter | Required/Optional | Description | Example |
Fields | Optional | The asset fields to include in the response. By default, all fields are returned, which may impact performance. Invalid field names are excluded from the response. |
JSON
|
Limit | Optional | The maximum number of assets to retrieve. By default, all assets are returned, up to a limit of 500. | 10 |
Filters | Optional | The query conditions used to filter the returned asset list. |
JSON
|
Output
To view the sample output data for all commands, refer to this article.
Error Handling
If the Return Data displays Failed, an Error tab will appear in the Test Result window.
The error tab contains the details responded from D3 SOAR or third-party API calls, including Failure Indicator, Status Code, and Message. This can help locate the root cause of a command failure.
Parts in Error | Description | Example |
Failure Indicator | Indicates the command failure that happened at a specific input and/or API call. | List Assets failed. |
Status Code | The response code issued by the third-party API server or the D3 SOAR system that can be used to locate the corresponding error category. For example, if the returned status code is 401, the selected connection is unauthorized to run the command. The user or system support would need to check the permission setting in the Claroty portal. Refer to the HTTP Status Code Registry for details. | Status Code: 400. |
Message | The raw data or captured key error message from the integration API server about the API request failure. | Message: Unknown lookup_type: exact_. |
Error Sample Data List Assets failed. Status Code: 400. Message: Unknown lookup_type: exact_. |
Resolve Alerts
Marks selected alerts as resolved in the Claroty platform.
READER NOTE
Selected Alerts is a required parameter to run this command.
Run the List Alerts command to obtain the Selected Alerts. Selected Alerts must be a string and formatted as <AlertID>-<SiteID>.
Alert ID can be found in the raw data at $.objects[*].id.
Site ID can be found in the raw data at $.objects[*].site_id.
Input
Input Parameter | Required/Optional | Description | Example |
Selected Alerts | Optional | The alerts to mark as resolved. Each value must be a string and formatted as <AlertID>-<SiteID> (e.g., "8-1"). Alert ID and Site ID can be obtained using the List Alerts command. |
JSON
|
Filters | Optional | The filter conditions used to identify alerts for resolution. |
JSON
|
Resolve Comment | Optional | An optional comment to include when resolving the alerts. | Resolve alert(s) |
Output
To view the sample output data for all commands, refer to this article.
Error Handling
If the Return Data displays Failed, an Error tab will appear in the Test Result window.
The error tab contains the details responded from D3 SOAR or third-party API calls, including Failure Indicator, Status Code, and Message. This can help locate the root cause of a command failure.
Parts in Error | Description | Example |
Failure Indicator | Indicates the command failure that happened at a specific input and/or API call. | Resolve Alerts failed. |
Status Code | The response code issued by the third-party API server or the D3 SOAR system that can be used to locate the corresponding error category. For example, if the returned status code is 401, the selected connection is unauthorized to run the command. The user or system support would need to check the permission setting in the Claroty portal. Refer to the HTTP Status Code Registry for details. | Status Code: 400. |
Message | The raw data or captured key error message from the integration API server about the API request failure. | Message: Failed in ResolveAlerts function. Original Error: SelectedAlerts must be a list of strings in the format '<AlertID>-<SiteID>', e.g., ['123-1', '456-2'].. |
Error Sample Data Resolve Alerts failed. Status Code: 400. Message: Failed in ResolveAlerts function. Original Error: SelectedAlerts must be a list of strings in the format '<AlertID>-<SiteID>', e.g., ['123-1', '456-2'].. |
Test Connection
Allows users to perform a health check on an integration connection. Users can schedule a periodic health check by selecting Connection Health Check when editing an integration connection.
Input
N/A
Output
Output Type | Description | Return Data Type |
Return Data | Indicates one of the possible command execution states: Successful or Failed. The Failed state can be triggered by any of the following errors:
More details about an error can be viewed in the Error tab. | String |
Error Handling
If the Return Data displays Failed, an Error tab will appear in the Test Result window.
The error tab contains the details responded from D3 SOAR or third-party API calls, including Failure Indicator, Status Code, and Message. This can help locate the root cause of a command failure.
Parts in Error | Description | Example |
Failure Indicator | Indicates the command failure that happened at a specific input and/or API call. | Test Connection failed. Failed to check the connector. |
Status Code | The response code issued by the third-party API server or the D3 SOAR system that can be used to locate the corresponding error category. For example, if the returned status code is 401, the selected connection is unauthorized to run the command. The user or system support would need to check the permission setting in the Claroty portal. Refer to the HTTP Status Code Registry for details. | Status Code: 403. |
Message | The raw data or captured key error message from the integration API server about the API request failure. | Message: Permission denied, Cannot access the url. |
Error Sample Data Test Connection failed. Failed to check the connector. Status Code: 403. Message: Permission denied, Cannot access the url. |