
Checkpoint Avanan
LAST UPDATED: SEPTEMBER 18, 2025
Overview
Avanan is an Enterprise Solution for Cloud Email and Collaboration Security. Avanan uses advanced AI to protect cloud email and collaboration suites from cyber attacks.
D3's integration with Avanan's latest REST API to automate the technical and business use cases. D3 provided the ability not only to ingest the security events and take action on them but also provides the ability to list/create/update/delete the exceptions.
D3 SOAR is providing REST operations to function with Checkpoint Avanan.
Checkpoint Avanan is available for use in:
Known Limitations
An API rate limit is applied to restrict the number of requests. To learn about the rate limit restrictions for Checkpoint Avanan, see API Call Restrictions | Mimecast.
A limit can be applied to the number of licensed users for a tenant. To learn more about license managing, see License Management - Restricting License Usage.
Connection
To connect to Checkpoint Avanan from D3 SOAR, please follow this part to collect the required information below:
Parameter | Description | Example |
Region | The Server region for the integration. | USA |
Application ID | The Application ID to authenticate the API connection. | myapp29 |
Secret Key | The secret key to authenticate the API connection. | 2xxxxxxF-5D9C-4xx0-9xxB-63xxxxF5xxxx8 |
API Version | The version of the API to use for the connection. | v1.0 |
Configuring Checkpoint Avanan to Work with D3 SOAR
An Application ID and Secret Key are required to establish the connection to D3 SOAR. These can be obtained by reaching out to Avanan's support team at the following link, and are provided upon signup at https://www.avanan.com/#supportModal.
See https://www.avanan.com/msp-docs/settings-user-management for information on user management.
Configuring D3 SOAR to Work with Checkpoint Avanan
Log in to D3 SOAR.
Find the Checkpoint Avanan integration.
.png?inst-v=a9107af0-b04c-4e31-bb5a-938372783868)
Navigate to Configuration on the top header menu.
Click on the Integration icon on the left sidebar.
Type Checkpoint Avanan in the search box to find the integration, then click it to select it.
Click + Connection, on the right side of the Connections section. A new connection window will appear.
Configure the following fields to create a connection to Checkpoint Avanan.
.png?inst-v=a9107af0-b04c-4e31-bb5a-938372783868)
Connection Name: The desired name for the connection.
Site: The site on which to use the integration connection. Use the drop-down menu to select the site. The Share to Internal Sites option enables all internal sites to use the connection. Selecting a specific site will only enable that site to use the connection.
Recipient site for events from connections Shared to Internal Sites: This field is displayed when Share to Internal Sites is selected for the Site field, allowing selection of the internal site for deploying the integration connection.
Agent Name (Optional): The proxy agent required to build the connection. Use the dropdown menu to select the proxy agent from a list of previously configured proxy agents.
Description (Optional): The description for the connection.
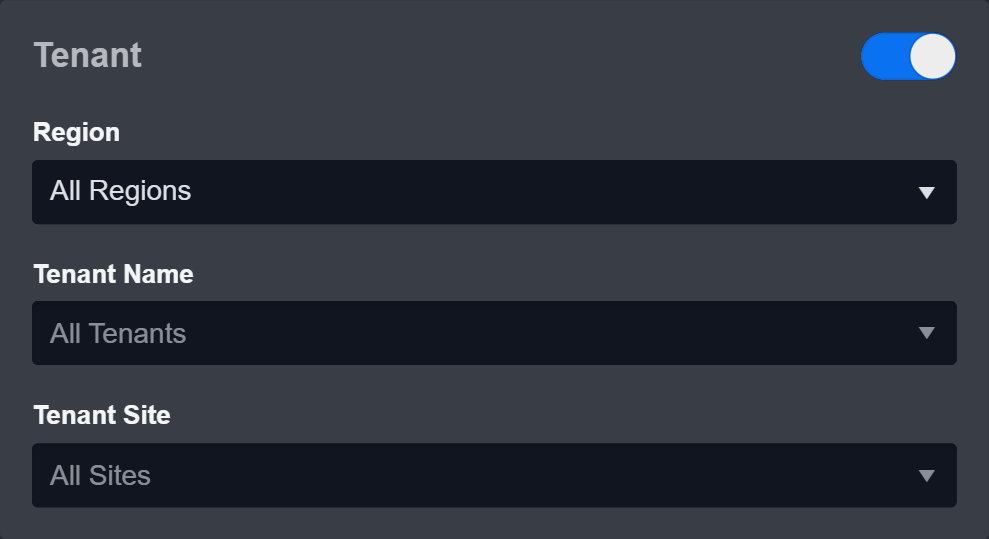
Tenant (Optional): When configuring the connection from a master tenant site, users can choose the specific tenant sites with which to share the connection. Once this setting is enabled, users can filter and select the desired tenant sites from the dropdowns to share the connection.
Configure User Permissions: Defines which users have access to the connection.
Active: The checkbox that enables the connection to be used when selected.
System: This section contains the parameters defined specifically for the integration. These parameters must be configured to create the integration connection.
.png?inst-v=a9107af0-b04c-4e31-bb5a-938372783868)
1. Select your Region.
2. Copy the Application ID from the Checkpoint Avanan platform. Refer to Configuring Checkpoint Avanan to Work with D3 SOAR.
3. Copy the Secret Key from the Checkpoint Avanan platform. Refer to Configuring Checkpoint Avanan to Work with D3 SOAR.
4. Input the API Version. The default value is v1.0.Connection Health Check: Periodically checks the connection status by scheduling the Test Connection command at the specified interval (in minutes). Available only for active connections, this feature also allows configuring email notifications for failed attempts.
Enable Password Vault: An optional feature that allows users to take the stored credentials from their own password vault. Refer to the password vault connection guide if needed.
Test the connection.
.png?inst-v=a9107af0-b04c-4e31-bb5a-938372783868)
Click on the Test Connection button to verify credentials and connectivity. A success alert displays Passed with a green checkmark. If the connection fails, review the parameters and retry.
Click OK to close the alert window.
Click + Add to create and add the configured connection.
Commands
Checkpoint Avanan includes the following executable commands for users to set up schedules or create playbook workflows. With the Test Command, users can execute these commands independently for playbook troubleshooting.
Integration API Note
For more information about the Checkpoint Avanan API, refer to the Checkpoint Avanan API reference.
Note for Time-related parameters
The input format of time-related parameters may vary based on user account settings, which may cause the sample data in commands to differ from what is displayed. To adjust the time format, follow these steps:
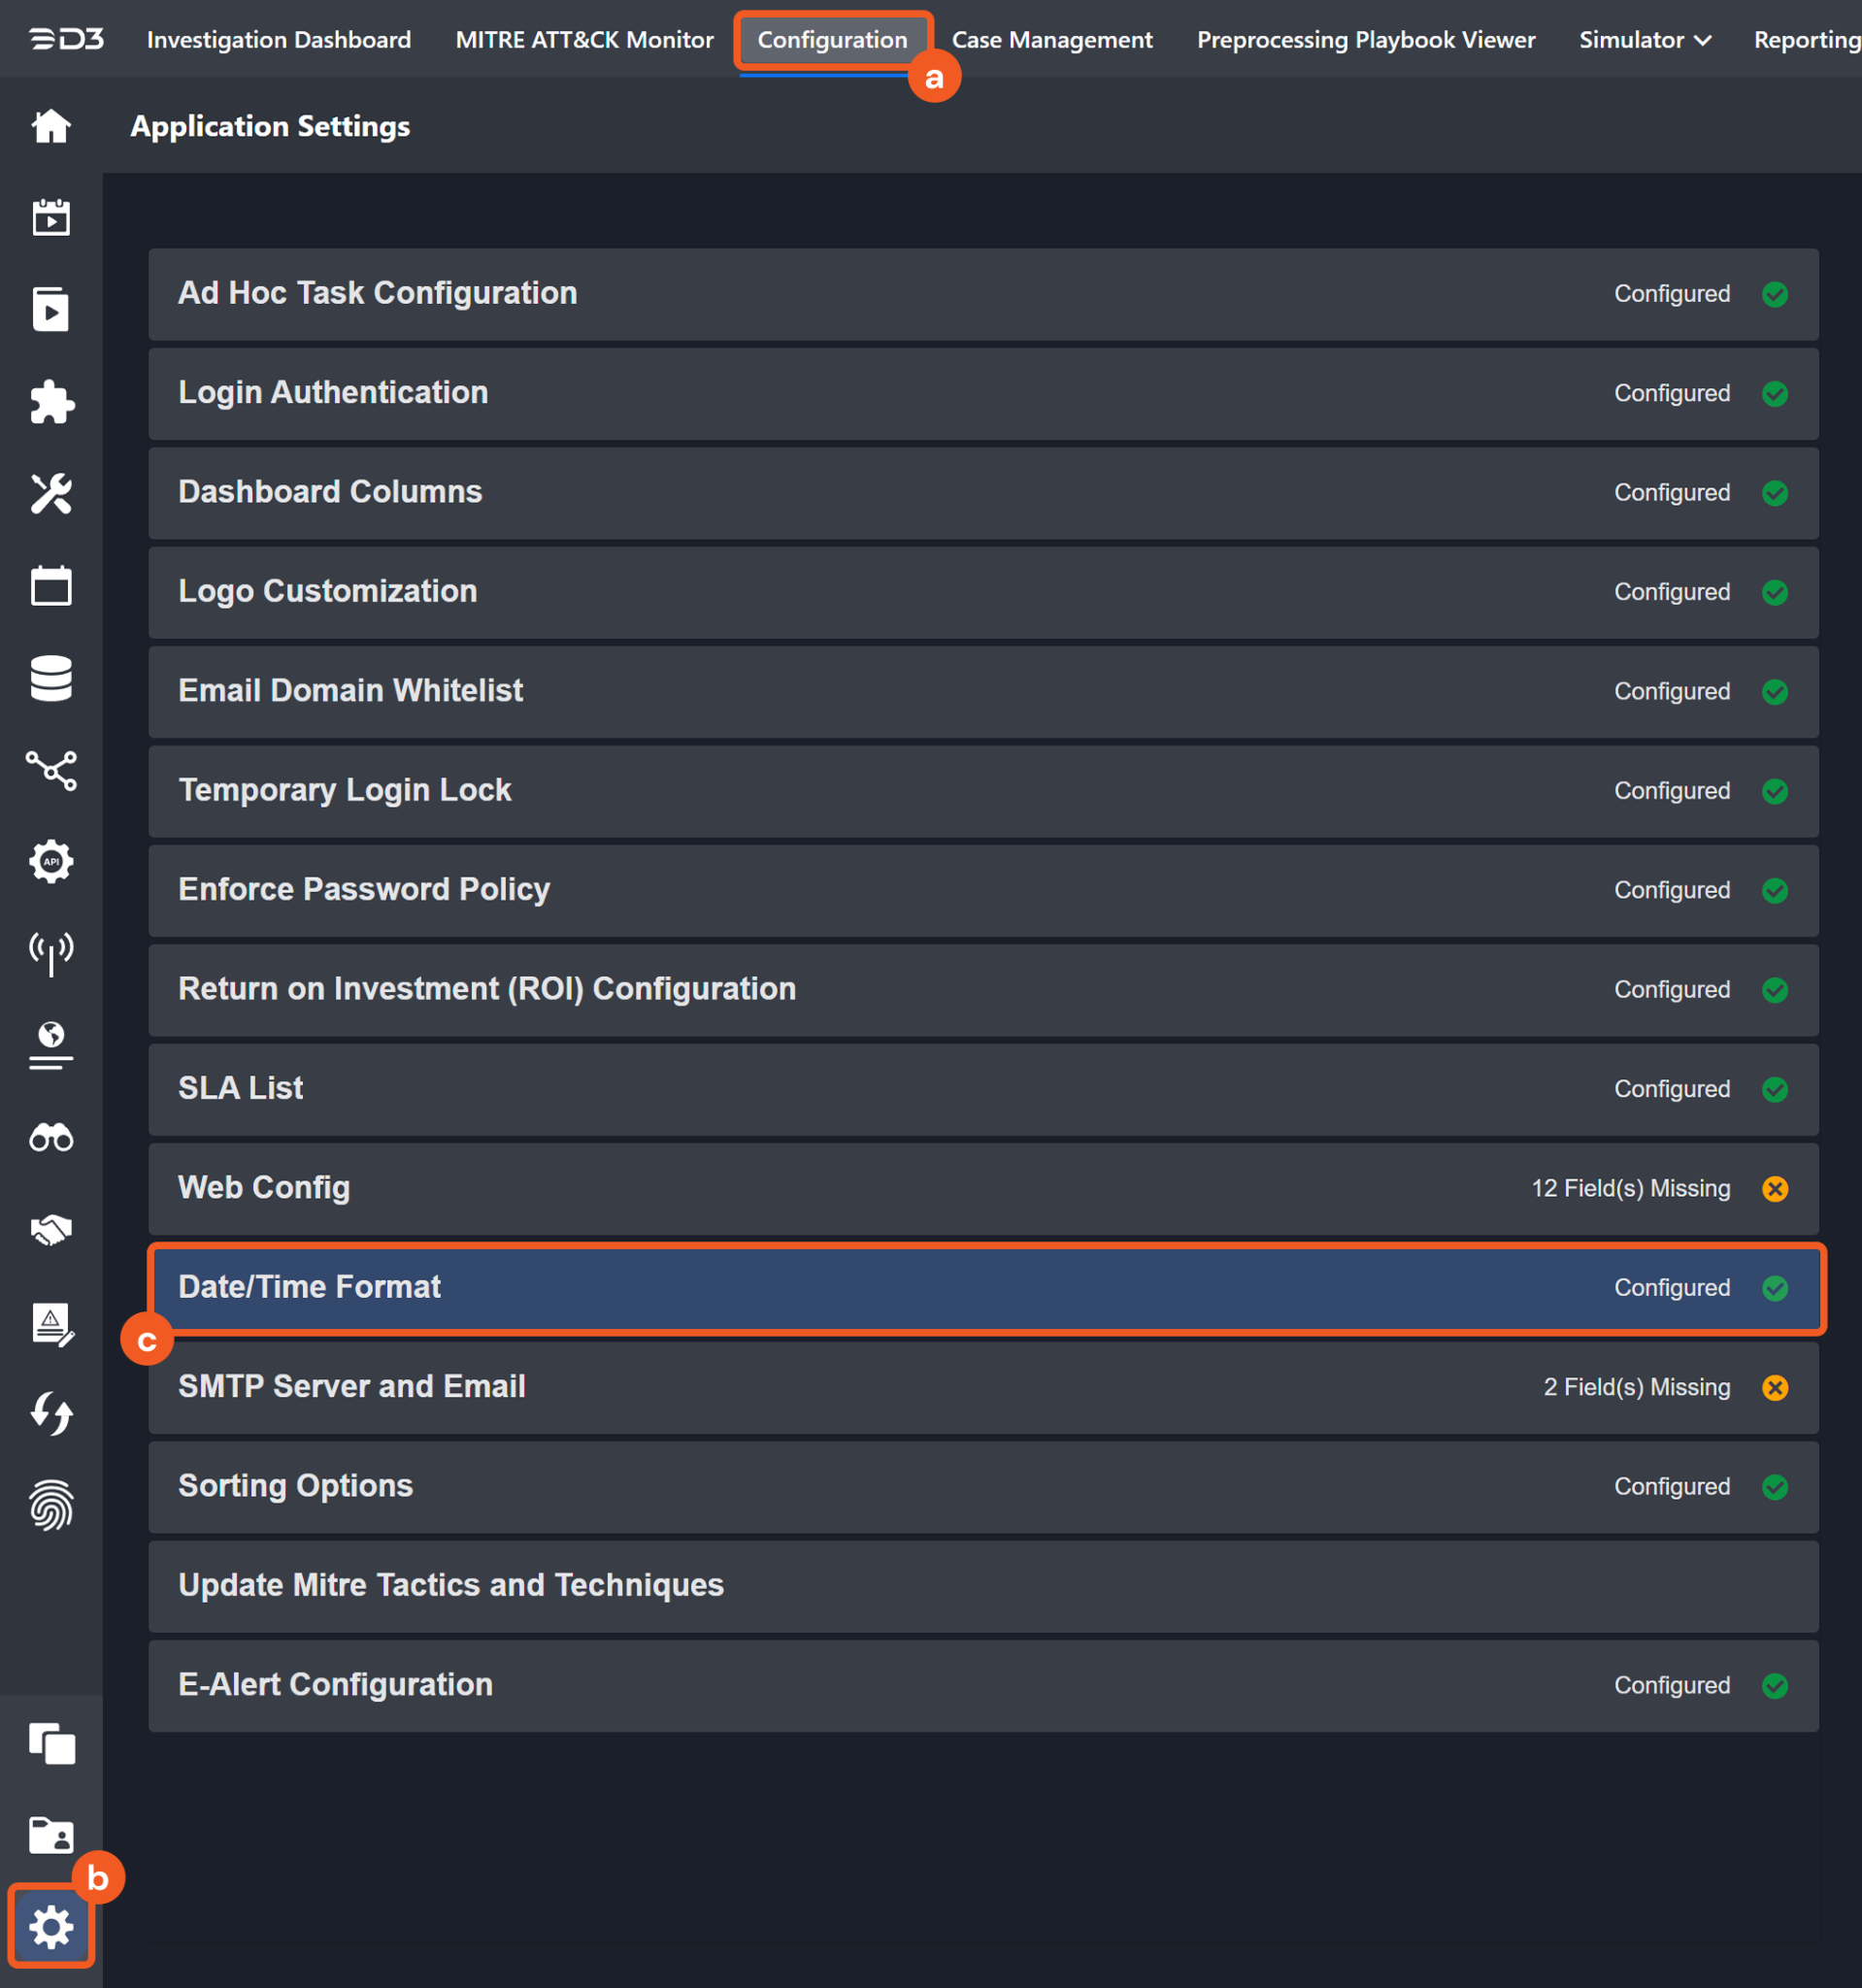
Navigate to Configuration > Application Settings. Select Date/Time Format.
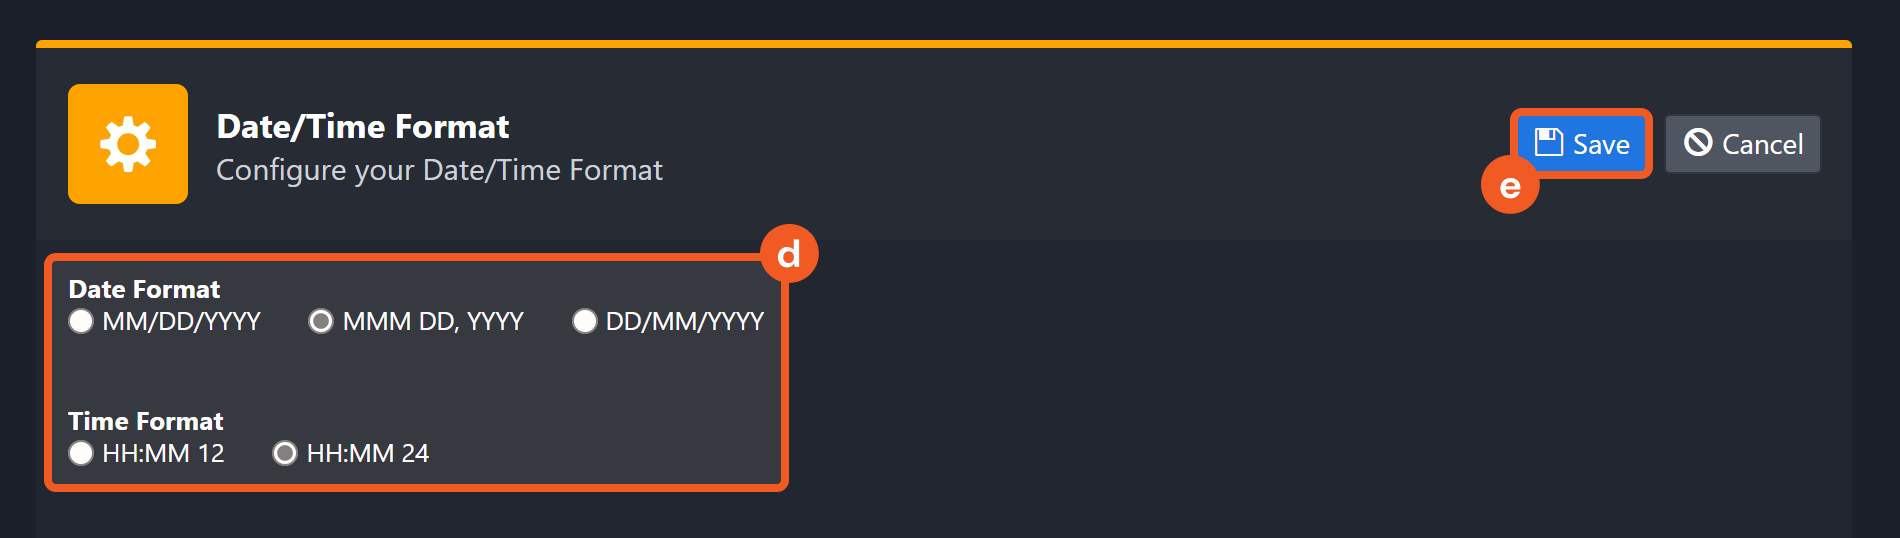
Choose the desired date and time format, then click on the Save button.
The selected time format will now be visible when configuring Date/Time command input parameters.
Create Exception
Creates an exception.
READER NOTE
When creating a Whitelist exception, Sender Email, Sender Name, Recipient, Sender Domain and Subject are required parameters.
Input
Input Parameter | Required/Optional | Description | Example |
Exception Type | Required | The type of Exception to be created. | Black List |
Attachment MD5 Hash | Optional | The MD5 hash value of the attachment. | *** |
Sender Email | Optional | The email address of the sender. | test@example.com |
Sender Name | Optional | The name of the sender. | user3a |
Recipient | Optional | The email address of the recipient. | test@example.com |
Sender Client IP | Optional | The client IP address of the sender. | 10.0.0.123 |
Sender Domain | Optional | The domain name of the sender. | example.com |
Sender IP | Optional | The IP address of the sender. | 199.199.199.195 |
Link Domains | Optional | The linked domain names. | phishing.com |
Subject | Optional | The subject for the exception. | testSubject |
Comment | Optional | The comment for the exception. | testBlackList |
Action Needed | Optional | The action to be taken. The available options are Spam and Phishing. Please note, this parameter is valid only when the Exception Type is Black List. Available options are Spam and Phishing. | Spam |
Subject Matching | Optional | The Subject matching type. The available options are Contains or Match. | Contains |
Link Domain Matching | Optional | The Link Domain matching type. The available options are Contains or Match. | Contains |
Sender Name Matching | Optional | The Sender Name matching type. The available options are Contains or Match. | Contains |
Sender Domain Matching | Optional | The Sender Domain matching type. The available options are Contains, Match or Ends With. | Ends With |
Recipient Matching | Optional | The Recipient Email address matching type. The available options are Contains or Match. | Contains |
Output
To view the sample output data for all commands, refer to this article.
Error Handling
If the Return Data is Failed, an Error tab will appear in the Test Result window.
The error tab contains the details responded from D3 SOAR or third-party API calls, including Failure Indicator, Status Code, and Message. This can help locate the root cause of a command failure.
Parts in Error | Description | Example |
Failure Indicator | Indicates the command failure that happened at a specific input and/or API call. | Create Exception failed. |
Status Code | The response code issued by the third-party API server or the D3 SOAR system that can be used to locate the corresponding error category. For example, if the returned status code is 401, the selected connection is unauthorized to run the command. The user or system support would need to check the permission setting in the Checkpoint Avanan portal. Refer to the HTTP Status Code Registry for details. | Status Code: 403. |
Message | The raw data or captured key error message from the integration API server about the API request failure. | Message: Forbidden. |
Error Sample Data Create Exception failed. Status Code: 403. Message: Forbidden. |
Delete Exceptions
Deletes specified exceptions. The exceptions to be deleted must be of the same exception type, White List or Black List.
READER NOTE
Exception Entity ID is a required parameter to run this command.
Run the List Exceptions command to obtain Exception Entity ID. Exception Entity IDs can be found in the returned raw data at the path $.responseData[*].entityId.
Input
Input Parameter | Required/Optional | Description | Example |
Exception Type | Required | The type of the Exception to be deleted. The available options are White List and Black List. | Black List |
Exception Entity IDs | Required | The IDs of the Exceptions to be deleted. Exception IDs can be obtained using the List Exceptions command. |
JSON
|
Output
To view the sample output data for all commands, refer to this article.
Error Handling
If the Return Data is Partially Successful or Failed, an Error tab will appear in the Test Result window.
The error tab contains the details responded from D3 SOAR or third-party API calls, including Failure Indicator, Status Code, and Message. This can help locate the root cause of a command failure.
Parts in Error | Description | Example |
Failure Indicator | Indicates the command failure that happened at a specific input and/or API call. | Delete Exceptions failed. |
Status Code | The response code issued by the third-party API server or the D3 SOAR system that can be used to locate the corresponding error category. For example, if the returned status code is 401, the selected connection is unauthorized to run the command. The user or system support would need to check the permission setting in the Checkpoint Avanan portal. Refer to the HTTP Status Code Registry for details. | Status Code: 403. |
Message | The raw data or captured key error message from the integration API server about the API request failure. | Message: Forbidden. |
Error Sample Data Delete Exceptions failed. Status Code: 403. Message: Forbidden. |
Fetch Event
Returns Events from the platform based on specified criteria.
READER NOTE
Scopes and Event IDs are optional parameters to run this command.
Run the List Scopes command to obtain Scopes. Scopes can be found from the returned raw data at the path $.responseData[*].
You should already have the Event IDs on hand if you want to input this parameter. If you don't, Event IDs can be obtained by running the Fetch Event command and leaving this parameter empty. Event IDs can be found from the returned raw data at the path $.responseData[*].eventId.
Input
Input Parameter | Required/Optional | Description | Example |
Start Time | Required | The start time of the time range to filter the events in UTC time. | 2022-12-01 00:00 |
End Time | Optional | The end time of the time range to filter the events in UTC time. | 2022-12-02 00:00 |
Number of Event(s) Fetched | Optional | The maximum number of events to return. When the value is 0, a negative number, or not specified, the command will return all events in the given time range. Note: If the Number of Event(s) Fetched entered is too large, it might affect system performance when returning a large number of events. Please set a suitable value to limit the maximum number of events to return. | 50 |
Scopes | Optional | The list of scopes that will be used to retrieve the results. Scopes can be obtained by running the List Scopes command. |
JSON
|
Event IDs | Optional | The list of event IDs that will be used to retrieve the results. |
JSON
|
Event Types | Optional | The list of event types that will be used to filter the results. The available types are "phishing", "malware", "suspicious malware", "dlp", "anomaly", "shadow_it", "malicious_url_click", "malicious_url", "alert". |
JSON
|
Event States | Optional | The list of event states that will be used to filter the results. The available states are new, detected, pending, remediated, dismissed and exception. |
JSON
|
Severities | Optional | The list of severities that will be used to filter the results. The available severities are lowest, low, medium, high and critical. |
JSON
|
Required SaaS | Optional | The list of required SaaS names that will be used to filter the results. The available values are office365_emails, office365_onedrive, office365_sharepoint, sharefile, slack, ms_teams and google_mail. |
JSON
|
Confidence Indicator | Optional | The confidence indicator to filter the results. For example "malicious". | malicious |
Description | Optional | The string in the event description to filter the results. | test@example.com |
Tolerance Scope (Minutes) | Optional | The tolerance scope in minutes for the query to retrieve events between start and end time to avoid data loss. The event will be fetched between {Start Time - Tolerance Scope, End Time}. | 10 |
Output
To view the sample output data for all commands, refer to this article.
Fetch Event Field Mapping
See Field Mappings.
The Checkpoint Avanan system integration includes pre-configured field mappings for the default event source.
The Default Event Source is the default system-provided set of field mappings applied when the fetch event command is executed. It includes a Main Event JSON Path, which is the JSONPath expression that points to the base array of event objects. The source field path continues from this array to locate the required data.
The Main Event JSON Path can be viewed by clicking on the Edit Main JSON Path button.
.png?inst-v=a9107af0-b04c-4e31-bb5a-938372783868)
Main Event JSON Path: $.responseData
The responseData array contains the event objects. Within each object, the key eventId denotes the Unique Event Key field. As such, the full JSONPath expression to extract the Unique Event Key is $.responseData.eventId.
The pre-configured field mappings are detailed below:
Field Name | Source Field |
Unique Event Key | .eventId |
Event Type | .type |
Severity | .severity |
Event State | .state |
Description | .description |
Start Time | .eventCreated |
Entity ID | .entityId |
Customer ID | .customerId |
SaaS Name | .saas |
Confidence Indicator | .confidenceIndicator |
Message ID | .entityDetails.entityPayload.internetMessageId |
Email subject | .entityDetails.entityPayload.subject |
Received Time | .entityDetails.entityPayload.received |
Recipient | .entityDetails.entityPayload.recipients |
Sender | .entityDetails.entityPayload.fromEmail |
toRecipients | .entityDetails.entityPayload.to |
CcRecipients | .entityDetails.entityPayload.cc |
BccRecipients | .entityDetails.entityPayload.bcc |
Reply To Email | .entityDetails.entityPayload.replyToEmail |
Is Quarantined | .entityDetails.entityPayload.isQuarantined |
File Hash MD5 | .entityDetails.entityPayload.attachments[*].MD5 |
Filename | .entityDetails.entityPayload.attachments[*].name |
Filesize | .entityDetails.entityPayload.attachments[*].size |
Email Links | .entityDetails.entityPayload.emailLinks |
Avanan Ap Scan Verdict | .entityDetails.entitySecurityResult.combinedVerdict.ap |
DLP Verdict | .entityDetails.entitySecurityResult.combinedVerdict.dlp |
Clicktime Protection Verdict | .entityDetails.entitySecurityResult.combinedVerdict.clicktimeProtection |
Shadow It Emails Scan Verdict | .entityDetails.entitySecurityResult.combinedVerdict.shadowIt |
Checkpoint AV Scan Verdict | .entityDetails.entitySecurityResult.combinedVerdict.av |
SPF Result | .entityDetails.entityPayload.SpfResult |
Spam Verdict | .entityDetails.entityPayload.saasSpamVerdict |
Mode | .entityDetails.entityPayload.mode |
Error Handling
If the Return Data is Failed, an Error tab will appear in the Test Result window.
The error tab contains the details responded from D3 SOAR or third-party API calls, including Failure Indicator, Status Code, and Message. This can help locate the root cause of a command failure.
Parts in Error | Description | Example |
Failure Indicator | Indicates the command failure that happened at a specific input and/or API call. | Fetch Event failed. |
Status Code | The response code issued by the third-party API server or the D3 SOAR system that can be used to locate the corresponding error category. For example, if the returned status code is 401, the selected connection is unauthorized to run the command. The user or system support would need to check the permission setting in the Checkpoint Avanan portal. Refer to the HTTP Status Code Registry for details. | Status Code: 422. |
Message | The raw data or captured key error message from the integration API server about the API request failure. | Message: value is not a valid enumeration member; permitted: 'phishing', 'malware', 'suspicious malware', 'dlp', 'anomaly', 'shadow_it', 'malicious_url_click', 'malicious_url', 'alert'. |
Error Sample Data Fetch Event failed. Status Code: 422. Message: value is not a valid enumeration member; permitted: 'phishing', 'malware', 'suspicious malware', 'dlp', 'anomaly', 'shadow_it', 'malicious_url_click', 'malicious_url', 'alert' |
Get Event Details
Retrieves the details of the specified security event(s) by Event ID(s).
READER NOTE
The parameter Event IDs is required to run this command.
You should already have your desired Event IDs on hand to run this command. If you don’t, you can use the Fetch Event command with defined filters to retrieve the desired Event IDs. The Event IDs can be found in the raw data at the path $.responseData[*].eventId.
Input
Input Parameter | Required/Optional | Description | Example |
Event IDs | Required | The Avanan internal request ID(s) of the security event(s) to retrieve. |
JSON
|
Output
To view the sample output data for all commands, refer to this article.
Error Handling
If the Return Data is Partially Successful or Failed, an Error tab will appear in the Test Result window.
The error tab contains the details responded from D3 SOAR or third-party API calls, including Failure Indicator, Status Code, and Message. This can help locate the root cause of a command failure.
Parts in Error | Description | Example |
Failure Indicator | Indicates the command failure that happened at a specific input and/or API call. | Get Event Details failed. |
Status Code | The response code issued by the third-party API server or the D3 SOAR system that can be used to locate the corresponding error category. For example, if the returned status code is 401, the selected connection is unauthorized to run the command. The user or system support would need to check the permission setting in the Checkpoint Avanan portal. Refer to the HTTP Status Code Registry for details. | Status Code: 404. |
Message | The raw data or captured key error message from the integration API server about the API request failure. | Message: failed to get details of the event. |
Error Sample Data Get Event Details failed. Status Code: 404. Message: failed to get details of the event. |
List Exceptions
Retrieves all existing exceptions.
READER NOTE
Scope is an optional parameter to run this command.
Run the List Scopes command to obtain Scopes. Scopes can be found from the returned raw data at the path $.responseData[*].
Input
Input Parameter | Required/Optional | Description | Example |
Exception Type | Required | The Exception Type to retrieve. The available options are White List and Black List. | Black List |
Scope | Optional | The scope in which to retrieve exceptions. Scope can be obtained using the List Scopes command. | mt-prod-3:d3securityapi |
Output
To view the sample output data for all commands, refer to this article.
Error Handling
If the Return Data is Failed, an Error tab will appear in the Test Result window.
The error tab contains the details responded from D3 SOAR or third-party API calls, including Failure Indicator, Status Code, and Message. This can help locate the root cause of a command failure.
Parts in Error | Description | Example |
Failure Indicator | Indicates the command failure that happened at a specific input and/or API call. | List Exceptions failed. |
Status Code | The response code issued by the third-party API server or the D3 SOAR system that can be used to locate the corresponding error category. For example, if the returned status code is 401, the selected connection is unauthorized to run the command. The user or system support would need to check the permission setting in the Checkpoint Avanan portal. Refer to the HTTP Status Code Registry for details. | Status Code: 403. |
Message | The raw data or captured key error message from the integration API server about the API request failure. | Message: Request scope[xxxx] is not authorized, authorized scopes: ['xxxx']. |
Error Sample Data List Exceptions failed. Status Code: 403. Message: Request scope[xxxx] is not authorized, authorized scopes: ['xxxx']. |
List Scopes
Retrieves the list of supported scopes.
Input
N/A
Output
To view the sample output data for all commands, refer to this article.
Error Handling
If the Return Data is Failed, an Error tab will appear in the Test Result window.
The error tab contains the details responded from D3 SOAR or third-party API calls, including Failure Indicator, Status Code, and Message. This can help locate the root cause of a command failure.
Parts in Error | Description | Example |
Failure Indicator | Indicates the command failure that happened at a specific input and/or API call. | List Scopes failed. |
Status Code | The response code issued by the third-party API server or the D3 SOAR system that can be used to locate the corresponding error category. For example, if the returned status code is 401, the selected connection is unauthorized to run the command. The user or system support would need to check the permission setting in the Checkpoint Avanan portal. Refer to the HTTP Status Code Registry for details. | Status Code: 403. |
Message | The raw data or captured key error message from the integration API server about the API request failure. | Message: Forbidden. |
Error Sample Data List Scopes failed. Status Code: 403. Message: Forbidden. |
Take Action On Events
Performs a single action on a specific security event or multiple events.
READER NOTE
The parameter Event IDs is required to run this command.
You should already have your desired Event IDs on hand to run this command. If you don’t, you can use the Fetch Event command with defined filters to retrieve the desired Event IDs. The Event IDs can be found in the raw data at the path $.responseData[*].eventId.
Scope is an optional parameter to run this command.
Run the List Scopes command to obtain Scopes. Scopes can be found from the returned raw data at the path $.responseData[*].
Input
Input Parameter | Required/Optional | Description | Example |
Scope | Optional | The scope to take action. Scopes can be obtained using the List Scopes command. | mt-prod-3:d3securityapi |
Event IDs | Required | The ID(s) of the security event(s) that the single action applies to. Event IDs can be obtained using the Fetch Event command. |
JSON
|
Event Action Name | Required | The name of the action to take. The available actions are Quarantine and Restore. | Restore |
Event Action Parameter | Optional | Optional string with all action parameters. | test |
Output
To view the sample output data for all commands, refer to this article.
Error Handling
If the Return Data is Failed, an Error tab will appear in the Test Result window.
The error tab contains the details responded from D3 SOAR or third-party API calls, including Failure Indicator, Status Code, and Message. This can help locate the root cause of a command failure.
Parts in Error | Description | Example |
Failure Indicator | Indicates the command failure that happened at a specific input and/or API call. | Take Action On Events failed. |
Status Code | The response code issued by the third-party API server or the D3 SOAR system that can be used to locate the corresponding error category. For example, if the returned status code is 401, the selected connection is unauthorized to run the command. The user or system support would need to check the permission setting in the Checkpoint Avanan portal. Refer to the HTTP Status Code Registry for details. | Status Code: 403. |
Message | The raw data or captured key error message from the integration API server about the API request failure. | Message: Request scope[xxxx] is not authorized, authorized scopes: ['xxxx']. |
Error Sample Data Take Action On Events failed. Status Code: 403. Message: Request scope[xxxx] is not authorized, authorized scopes: ['xxxx']. |
Update Exception
Modifies an exception.
READER NOTE
Exception Entity ID is a required parameter to run this command.
Run the List Exceptions command to obtain Exception Entity ID. Exception Entity IDs can be found in the returned raw data at the path $.responseData[*].entityId.
Input
Input Parameter | Required/Optional | Description | Example |
Exception Type | Required | The type of the Exception to be updated. The available options are White List and Black List. | Black List |
Exception Entity ID | Required | The ID(s) of the Exception(s) to be updated. Exception IDs can be obtained using the List Exceptions command. | ***** |
Attachment MD5 Hash | Optional | The MD5 hash value of the attachment. | ***** |
Sender Email | Optional | The email address of the sender. | test@example.com |
Sender Name | Optional | The name of the sender. | user3abc |
Recipient | Optional | The email address of the recipient. | test@example.com |
Sender Client IP | Optional | The client IP address of the sender. | 10.0.0.0 |
Sender Domain | Optional | The domain name of the sender. | example.com |
Sender IP | Optional | The IP address of the sender. | 200.200.200.200 |
Link Domains | Optional | The linked domain names. | phishing.com |
Subject | Optional | The subject for the exception. | testSubject |
Comment | Optional | The comment for the exception. | testUpdateBlacklist |
Action Needed | Optional | The action to be taken. The available options are Spam and Phishing. Please note, this parameter is valid only when the Exception Type is Black List. | Phishing |
Subject Matching | Optional | The Subject matching type.The available options are Contains or Match. | Contains |
Link Domain Matching | Optional | The Link Domain matching type. The available options are Contains or Match. | Contains |
Sender Name Matching | Optional | The Sender Name matching type. The available options are Contains or Match. | Contains |
Sender Domain Matching | Optional | The Sender Domain matching type. The available options are Contains, Match or Ends With. | Ends With |
Recipient Matching | Optional | The Recipient Email address matching type. The available options are Contains or Match. | Contains |
Output
To view the sample output data for all commands, refer to this article.
Error Handling
If the Return Data is Partially Successful or Failed, an Error tab will appear in the Test Result window.
The error tab contains the details responded from D3 SOAR or third-party API calls, including Failure Indicator, Status Code, and Message. This can help locate the root cause of a command failure.
Parts in Error | Description | Example |
Failure Indicator | Indicates the command failure that happened at a specific input and/or API call. | Update Exception failed. |
Status Code | The response code issued by the third-party API server or the D3 SOAR system that can be used to locate the corresponding error category. For example, if the returned status code is 401, the selected connection is unauthorized to run the command. The user or system support would need to check the permission setting in the Checkpoint Avanan portal. Refer to the HTTP Status Code Registry for details. | Status Code: 403. |
Message | The raw data or captured key error message from the integration API server about the API request failure. | Message: Forbidden. |
Error Sample Data Update Exception failed. Status Code: 403. Message: Forbidden. |
Test Connection
Allows you to perform a health check on an integration connection. You can schedule a periodic health check by selecting Connection Health Check when editing an integration connection.
Input
N/A
Output
Output Type | Description | Return Data Type |
Return Data | Indicates one of the possible command execution states: Successful or Failed. The Failed state can be triggered by any of the following errors:
More details about an error can be viewed in the Error tab. | String |
Error Handling
If the Return Data is Failed, an Error tab will appear in the Test Result window.
The error tab contains the details responded from D3 SOAR or third-party API calls, including Failure Indicator, Status Code, and Message. This can help locate the root cause of a command failure.
Parts in Error | Description | Example |
Failure Indicator | Indicates the command failure that happened at a specific input and/or API call. | Test Connection failed. Failed to check the connector. |
Status Code | The response code issued by the third-party API server or the D3 SOAR system that can be used to locate the corresponding error category. For example, if the returned status code is 401, the selected connection is unauthorized to run the command. The user or system support would need to check the permission setting in the Checkpoint Avanan portal. Refer to the HTTP Status Code Registry for details. | Status Code: 403. |
Message | The raw data or captured key error message from the integration API server about the API request failure. | Message: Forbidden. |
Error Sample Data Test Connection failed. Failed to check the connector. Status Code: 403. Message: Forbidden. |