
AbuseIPDB
LAST UPDATED: SEPTEMBER 18, 2025
Overview
AbuseIPDB is a project that helps combat hackers, spammers, and online abuse by providing a central repository for reporting and identifying IP addresses linked to malicious activity.
D3 SOAR is providing REST operations to function with AbuseIPDB.
AbuseIPDB is available for use in:
Known Limitations
The API rate limit is based on the account subscription. Users can navigate to User Accounts > Plans on the AbuseIPDB UI to check or change the account plan.
Refer to AbuseIPDB API for detailed information.
Connection
To connect to AbuseIPDB from D3 SOAR, follow this part to collect the required information below:
Parameter | Description | Example |
Server URL | The URL of the AbuseIPDB server. | https://api.abuseipdb.com |
API Key | The API key used for authentication. | ***** |
API Version | The API version. | v2 |
Configuring AbuseIPDB to Work with D3 SOAR
Log into AbuseIPDB with the E-Mail Address and Password.
On the User Account page, select the API tab, then click the Create Key button.
Copy and save the API Key. Refer to Step 3J, sub-step 2 in Configuring D3 SOAR to Work with AbuseIPDB.
Configuring D3 SOAR to Work with AbuseIPDB
Log in to D3 SOAR.
Find the AbuseIPDB integration.
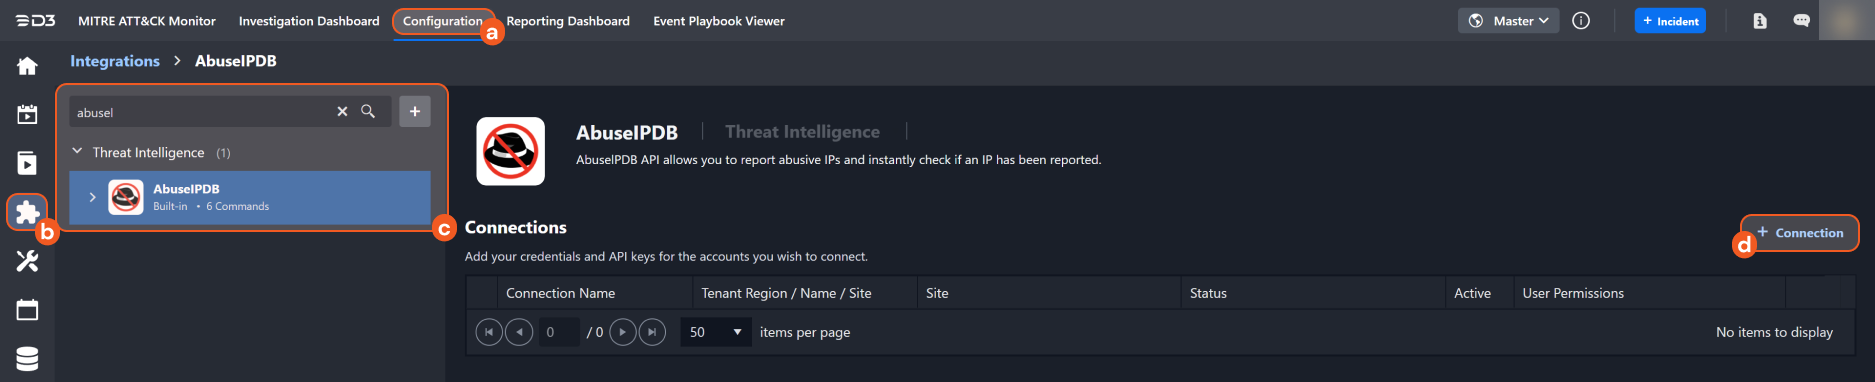
Navigate to Configuration on the top header menu.
Click on the Integration icon on the left sidebar.
Type AbuseIPDB in the search box to find the integration, then click it to select it.
Click + Connection, on the right side of the Connections section. A new connection window will appear.
Configure the following fields to create a connection to AbuseIPDB.
.png?inst-v=a9107af0-b04c-4e31-bb5a-938372783868)
Connection Name: The desired name for the connection.
Site: The site on which to use the integration connection. Use the drop-down menu to select the site. The Share to Internal Sites option enables all internal sites to use the connection. Selecting a specific site will only enable that site to use the connection.
Recipient site for events from connections Shared to Internal Sites: This field is displayed when Share to Internal Sites is selected for the Site field, allowing selection of the internal site for deploying the integration connection.
Agent Name (Optional): The proxy agent required to build the connection. Use the dropdown menu to select the proxy agent from a list of previously configured proxy agents.
Description (Optional): The description for the connection.
Tenant (Optional): When configuring the connection from a master tenant site, users can choose the specific tenant sites with which to share the connection. Once this setting is enabled, users can filter and select the desired tenant sites from the dropdowns to share the connection.
Configure User Permissions: Defines which users have access to the connection.
Active: The checkbox that enables the connection to be used when selected.
System Reputation Check: Selecting one or more reputation checkboxes will run the corresponding check reputation commands under this integration connection to enrich the corresponding artifacts with reputation details.
For example, an integration connection named "ConnectionA" is configured with the "Sandbox" site. All URL artifacts from the "Sandbox" site will undergo a reputation check using the Check URL Reputation command from that integration. The return data output from this command will then be used to update the risk level of artifacts, which may affect the risk level of incoming events.
System: This section contains the parameters defined specifically for the integration. These parameters must be configured to create the integration connection.
.png?inst-v=a9107af0-b04c-4e31-bb5a-938372783868)
1. Input the Server URL. The default value is https://api.abuseipdb.com.
2. Input the API Key copied from the AbuseIPDB platform. Refer to Step 3 of Configuring AbuseIPDB to Work with D3 SOAR for more details.
3. Input the API Version. The default value is v2.Enable Password Vault: An optional feature that allows users to take the stored credentials from their own password vault. Refer to the password vault connection guide if needed.
Connection Health Check: Periodically checks the connection status by scheduling the Test Connection command at the specified interval (in minutes). Available only for active connections, this feature also allows configuring email notifications for failed attempts.
Test the connection.
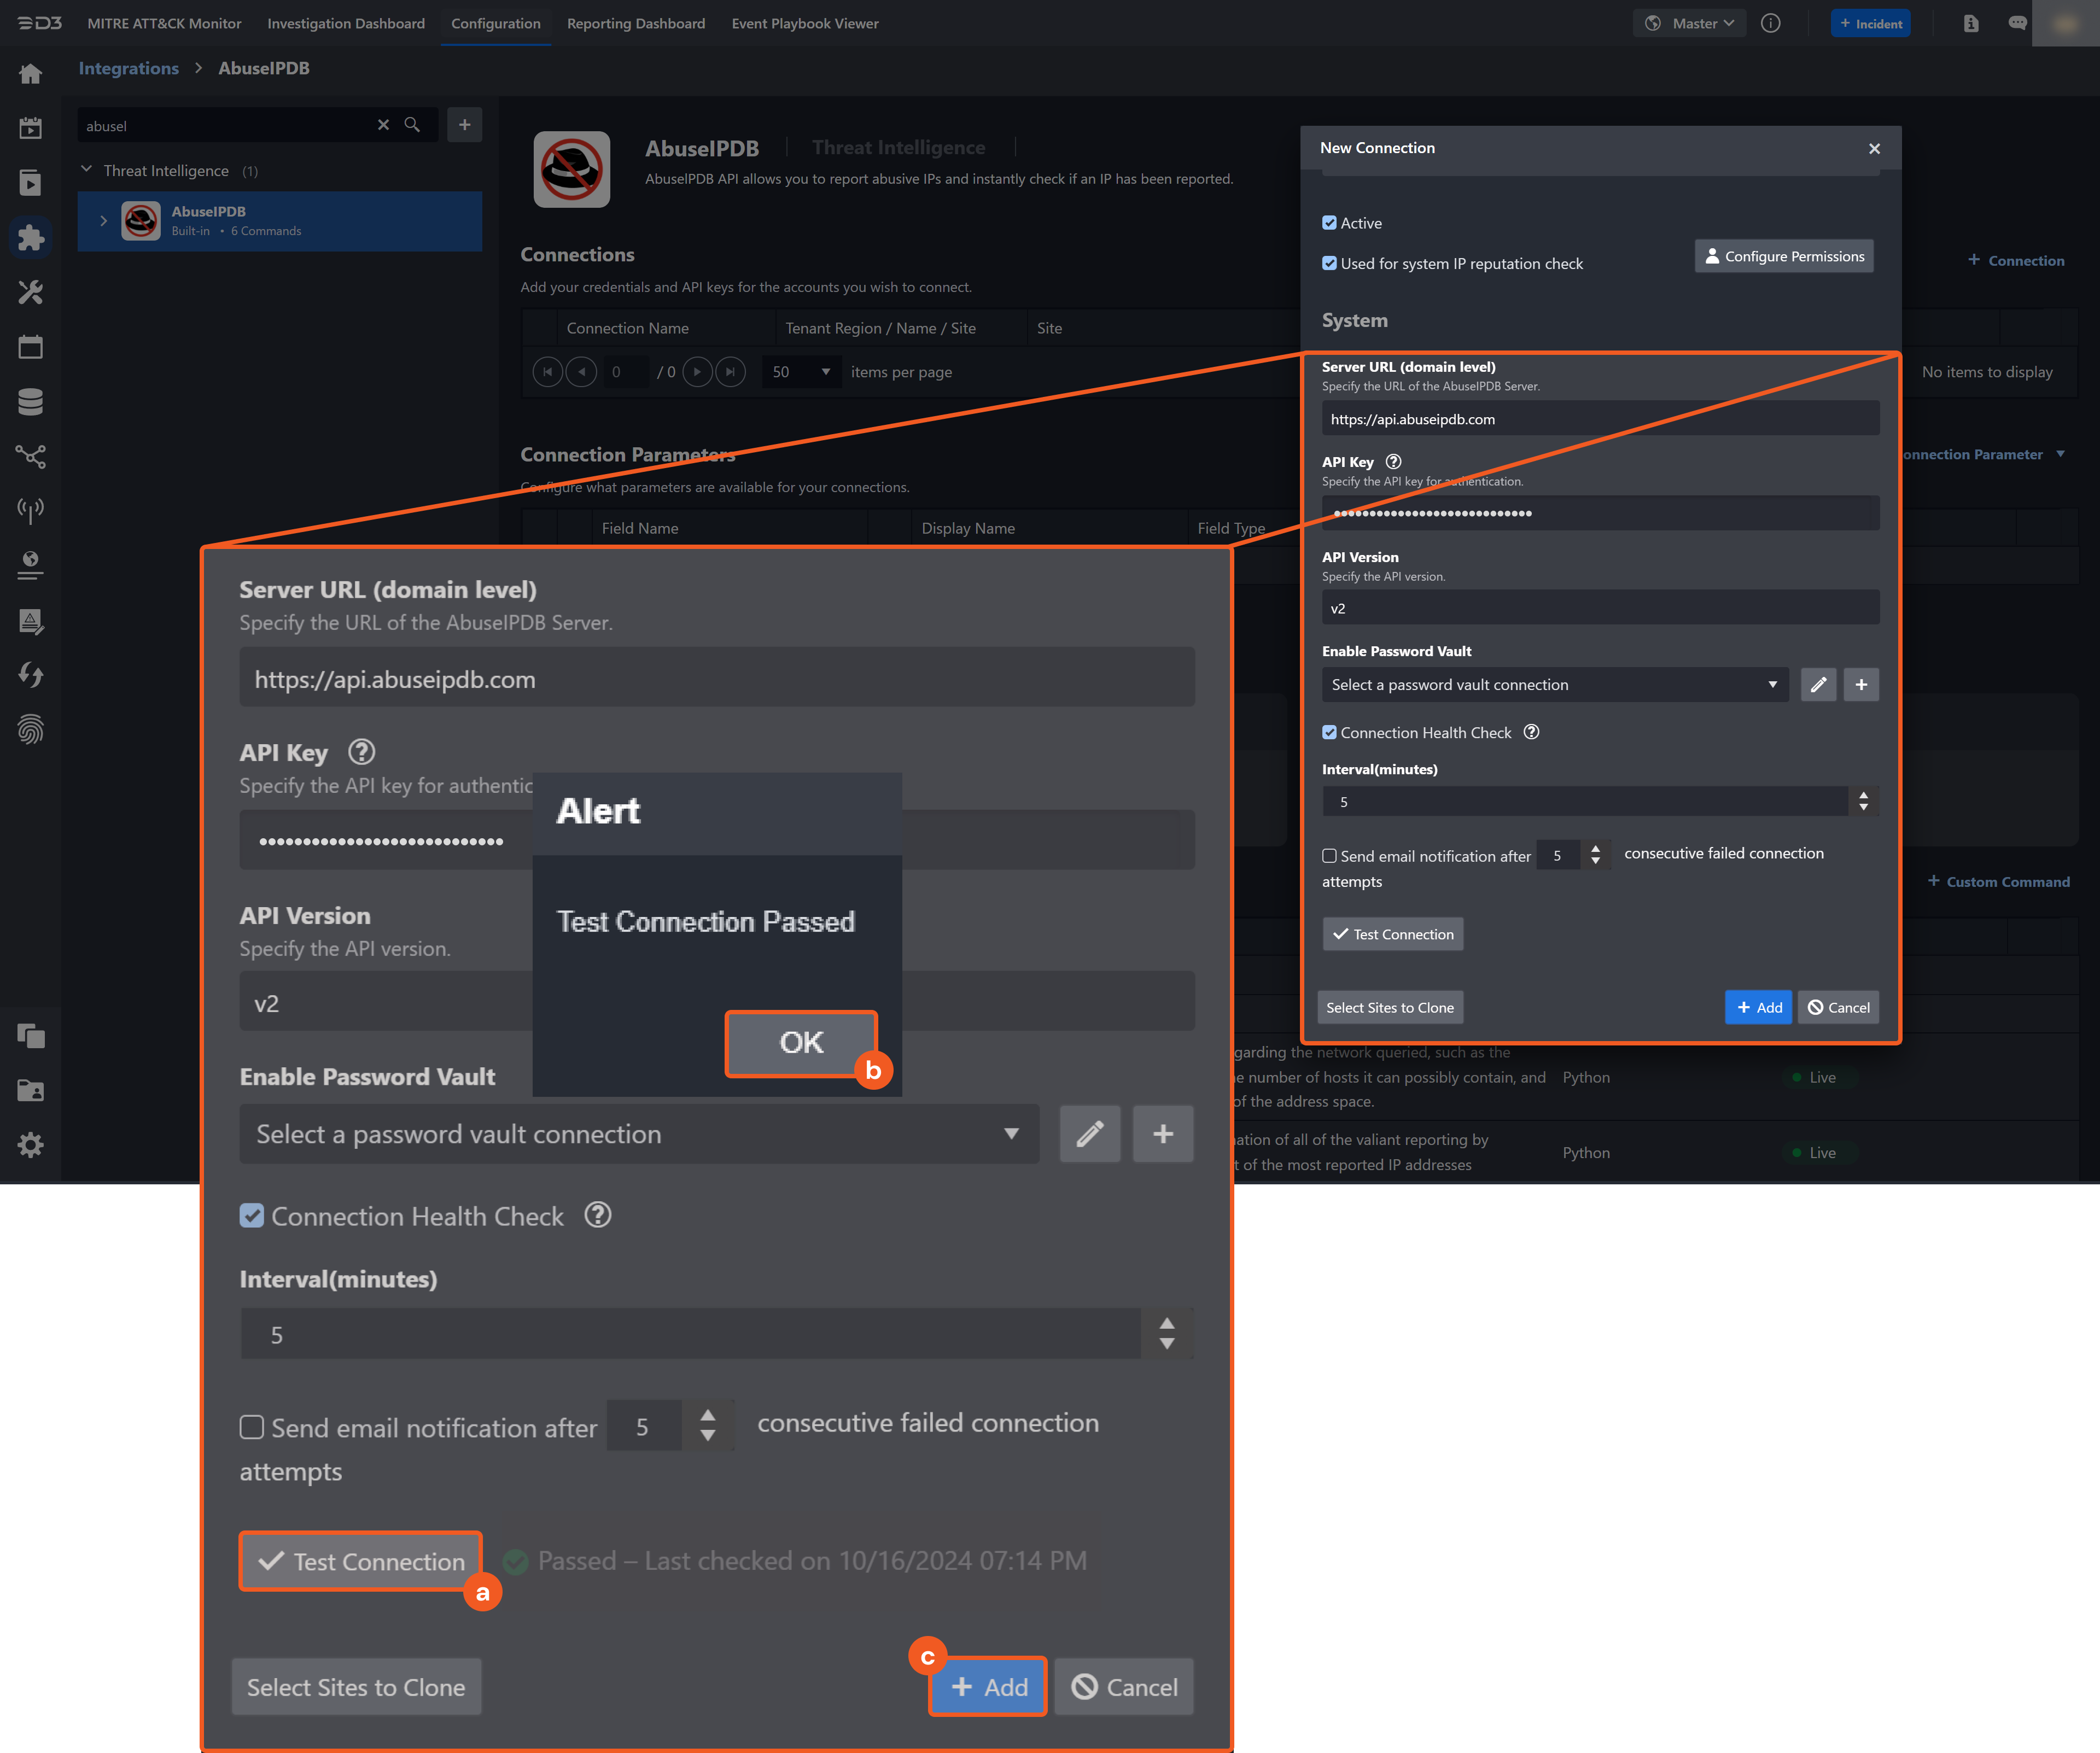
Click on the Test Connection button to verify credentials and connectivity. A success alert displays Passed with a green checkmark. If the connection fails, review the parameters and retry.
Click OK to close the alert window.
Click + Add to create and add the configured connection.
Commands
AbuseIPDB includes the following executable commands for users to set up schedules or create playbook workflows. With the Test Command function, users can execute these commands independently for playbook troubleshooting.
Integration API Note
For more information about the AbuseIPDB API, refer to the AbuseIPDB API reference.
Check IP Reputation
Checks the reputation of specified IP addresses
Input
Input Parameter | Required/Optional | Description | Example |
IP List | Required | The list of valid IPv4 or IPv6 addresses to evaluate for reputation. |
JSON
|
Output
To view the sample output data for all commands, refer to this article.
D3-defined Risk Levels and Risk Names
The table below lists the possible output risk levels and their corresponding risk names:
Risk Levels | Risk Names |
1 | High |
2 | Medium |
3 | Low |
4 | Default |
5 | ZeroRisk |
Error Handling
If your command fails to execute, an Error tab will appear in the Test Result window.
The error tab contains the details responded from D3 SOAR or third-party API calls, including Failure Indicator, Status Code, and Message. This can help you locate the root cause of a command failure.
Parts in Error | Description | Example |
Failure Indicator | Indicates the command failure that happened at a specific input and/or API call. | Check IP Reputation failed. |
Status Code | The response code issued by the third-party API server or the D3 SOAR system that can be used to locate the corresponding error category. For example, if the returned status code is 401, the selected connection is unauthorized to run the command. The user or system support would need to check the permission setting in the AbuseIPDB portal. Refer to the HTTP Status Code Registry for details. | Status Code: 422. |
Message | The raw data or captured key error message from the integration API server about the API request failure. | Message: The ip address must be a valid IPv4 or IPv6 address (e.g. 8.8.8.8 or 2001:4860:4860::8888). |
Error Sample Data Check IP Reputation failed. Status Code: 422. Message: The ip address must be a valid IPv4 or IPv6 address (e.g. 8.8.8.8 or 2001:4860:4860::8888). |
Check CIDR Block
Inspects details on the specified network. The details include the netmask of the subnet, the number of hosts the subnet can contain, and the assigned description of the address space.
Input
Input Parameter | Required/Optional | Description | Example |
Network List | Required | The list of IPv4 or IPv6 subnets in CIDR notation to inspect. |
JSON
|
Max age in days | Optional | The number of days used to limit the age of reports included in the query. By default, the value is 30. | 5 |
Output
To view the sample output data for all commands, refer to this article.
Error Handling
If the Return Data is Partially Successful or Failed, an Error tab will appear in the Test Result window.
The error tab contains the details responded from D3 SOAR or third-party API calls, including Failure Indicator, Status Code, and Message. This can help you locate the root cause of a command failure.
Parts in Error | Description | Example |
Failure Indicator | Indicates the command failure that happened at a specific input and/or API call. | Check CIDR Block failed. |
Status Code | The response code issued by the third-party API server or the D3 SOAR system that can be used to locate the corresponding error category. For example, if the returned status code is 401, the selected connection is unauthorized to run the command. The user or system support would need to check the permission setting in the AbuseIPDB portal. Refer to the HTTP Status Code Registry for details. | Status Code: 422. |
Message | The raw data or captured key error message from the integration API server about the API request failure. | Message: Invalid CIDR format. |
Error Sample Data Check CIDR Block failed. Status Code: 422. Message: Invalid CIDR format. |
Get Black List
Retrieves a list of the most frequently reported IP addresses, based on AbuseIPDB user-submitted reports.
Input
Input Parameter | Required/Optional | Description | Example |
Limit | Optional | The number of IP addresses to return. Valid range is 1 to 10,000. | 5 |
Output
To view the sample output data for all commands, refer to this article.
Error Handling
If the Return Data is Failed, an Error tab will appear in the Test Result window.
The error tab contains the details responded from D3 SOAR or third-party API calls, including Failure Indicator, Status Code, and Message. This can help you locate the root cause of a command failure.
Parts in Error | Description | Example |
Failure Indicator | Indicates the command failure that happened at a specific input and/or API call. | Get Black List failed. |
Status Code | The response code issued by the third-party API server or the D3 SOAR system that can be used to locate the corresponding error category. For example, if the returned status code is 401, the selected connection is unauthorized to run the command. The user or system support would need to check the permission setting in the AbuseIPDB portal. Refer to the HTTP Status Code Registry for details. | Status Code: 401. |
Message | The raw data or captured key error message from the integration API server about the API request failure. | Message: Unauthorized. |
Error Sample Data Get Black List failed. Status Code: 401. Message: Unauthorized. |
Get Categories
Returns a list of category names.
Input
N/A
Output
To view the sample output data for all commands, refer to this article.
Error Handling
If the Return Data is Failed, an Error tab will appear in the Test Result window.
The error tab contains the details responded from D3 SOAR or third-party API calls, including Failure Indicator, Status Code, and Message. This can help you locate the root cause of a command failure.
Parts in Error | Description | Example |
Failure Indicator | Indicates the command failure that happened at a specific input and/or API call. | Get Categories failed. |
Status Code | The response code issued by the third-party API server or the D3 SOAR system that can be used to locate the corresponding error category. For example, if the returned status code is 401, the selected connection is unauthorized to run the command. The user or system support would need to check the permission setting in the AbuseIPDB portal. Refer to the HTTP Status Code Registry for details. | Status Code: 401. |
Message | The raw data or captured key error message from the integration API server about the API request failure. | Message: Unauthorized. |
Error Sample Data Get Categories failed. Status Code: 401. Message: Unauthorized. |
Report IP
Submits one or more IP addresses for reporting.
Input
Input Parameter | Required/Optional | Description | Example |
IP List | Required | The list of valid IPv4 or IPv6 addresses to report. |
JSON
|
Category Name List | Required | The list of abuse category names associated with the report. Include at least one. Use commas to separate multiple entries. |
JSON
|
Output
To view the sample output data for all commands, refer to this article.
Error Handling
If the Return Data is Partially Successful or Failed, an Error tab will appear in the Test Result window.
The error tab contains the details responded from D3 SOAR or third-party API calls, including Failure Indicator, Status Code, and Message. This can help you locate the root cause of a command failure.
Parts in Error | Description | Example |
Failure Indicator | Indicates the command failure that happened at a specific input and/or API call. | Report IP failed. |
Status Code | The response code issued by the third-party API server or the D3 SOAR system that can be used to locate the corresponding error category. For example, if the returned status code is 401, the selected connection is unauthorized to run the command. The user or system support would need to check the permission setting in the AbuseIPDB portal. Refer to the HTTP Status Code Registry for details. | Status Code: 401. |
Message | The raw data or captured key error message from the integration API server about the API request failure. | Message: Invalid categories found: 111. |
Error Sample Data Report IP failed. Status Code: 401. Message: Invalid categories found: 111. |
Test Connection
Allows users to perform a health check on an integration connection. Users can schedule a periodic health check by selecting Connection Health Check when editing an integration connection.
Input
N/A
Output
Output Type | Description | Return Data Type |
Return Data | Indicates one of the possible command execution states: Successful or Failed. The Failed state can be triggered by any of the following errors:
More details about an error can be viewed in the Error tab. | String |
Error Handling
If the Return Data is Failed, an Error tab will appear in the Test Result window.
The error tab contains the details responded from D3 SOAR or third-party API calls, including Failure Indicator, Status Code, and Message. This can help you locate the root cause of a command failure.
Parts in Error | Description | Example |
Failure Indicator | Indicates the command failure that happened at a specific input and/or API call. | Test Connection failed. Failed to check the connector. |
Status Code | The response code issued by the third-party API server or the D3 SOAR system that can be used to locate the corresponding error category. For example, if the returned status code is 401, the selected connection is unauthorized to run the command. The user or system support would need to check the permission setting in the AbuseIPDB portal. Refer to the HTTP Status Code Registry for details. | Status Code: 401. |
Message | The raw data or captured key error message from the integration API server about the API request failure. | Message: Unauthorized. |
Error Sample Data Test Connection failed. Failed to check the connector. Status Code: 401. Message: Unauthorized. |