Last Updated: October 26, 2026
Overview
Investigation playbooks run on incidents. As the page puts it: "Configure Investigation Playbooks to streamline incident handling and automate response effectively." You build them in D3's codeless playbook editor from tasks such as Command, Conditional, Data Formatter, Interaction and Stage.
Investigation playbooks are under Configuration > Investigation Playbooks.
The Investigation Playbooks Page
-
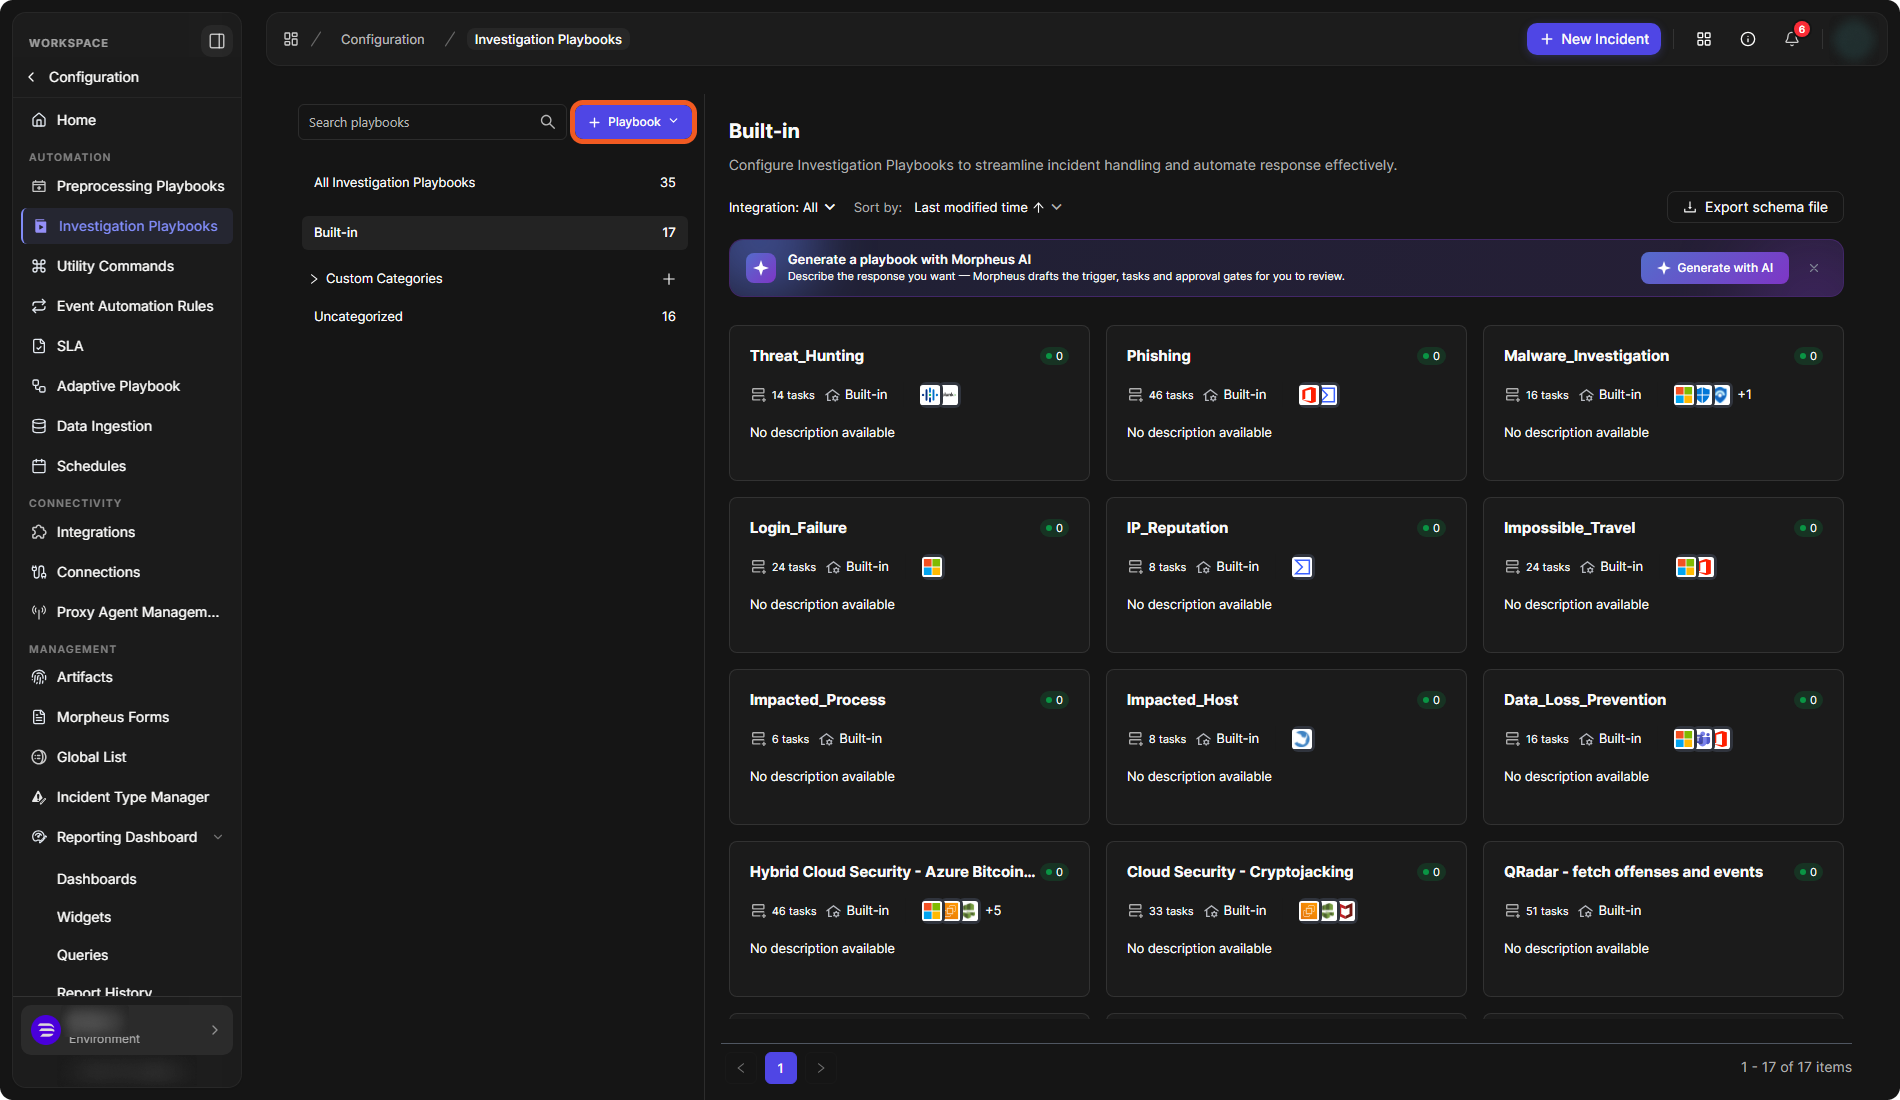
Search playbooks finds a playbook by name.
-
+ Playbook creates a playbook (see below).
-
The list on the left groups the playbooks: All Investigation Playbooks, Built-in, Custom Categories (the + button adds a category) and Uncategorized, each with its count.
-
Integration filters the playbooks by integration, and Sort by orders them (for example by Last modified time).
-
Export schema file is at the top right of the list.
-
The Generate a playbook with Morpheus AI banner ("Describe the response you want — Morpheus drafts the trigger, tasks and approval gates for you to review") and its Generate with AI button create a playbook from a description.
The Investigation Playbooks page
Playbook Cards
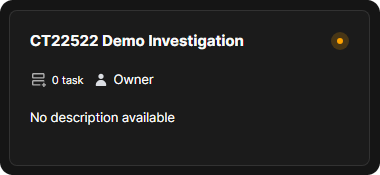
Each playbook is a card with its name, its number of tasks, your access to it (for example Owner, Viewer or Editor (Playbook), or Built-in for a built-in playbook), the icons of the integrations it uses, and its description. Select a card to open the playbook in the editor.
A playbook card
Creating an Investigation Playbook
You can generate an investigation playbook with AI, or build it yourself from a blank playbook.
Generating with AI
Morpheus, D3's AI assistant, can draft an investigation playbook for you. Describe the response you want, or let Morpheus infer it from an incident, and it composes the trigger, tasks and approval gates for you to review.
-
Select + Playbook, then Generate with AI ("Describe it — Morpheus composes the steps"). The Generate with AI button on the Generate a playbook with Morpheus AI banner opens the same window.
-
Choose how Morpheus starts:
-
Infer from context: Morpheus infers the playbook from the trigger data you choose ("Set the scope and I'll infer the playbook").
-
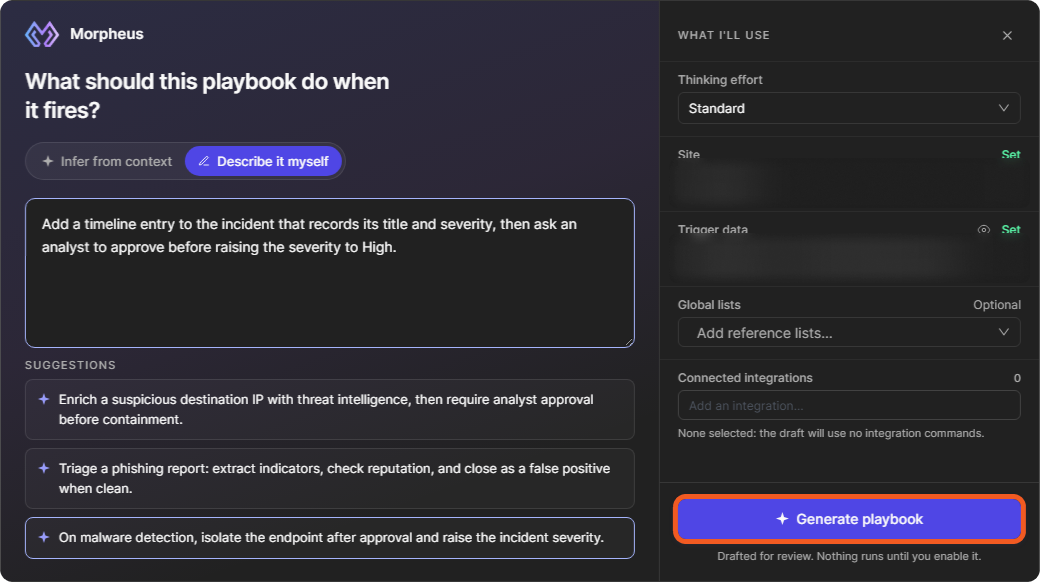
Describe it myself: type what the playbook should do when it fires. The window also lists SUGGESTIONS to start from.
-
-
Under WHAT I'LL USE, choose the Site (required) and the Trigger data (required): an incident from that site; search for it by number. Optionally, set the Thinking effort (Standard or Deep), add Global lists as reference lists, and add Connected integrations. With no integration selected, the draft uses no integration commands.
-
Select Generate playbook.
Generating an investigation playbook
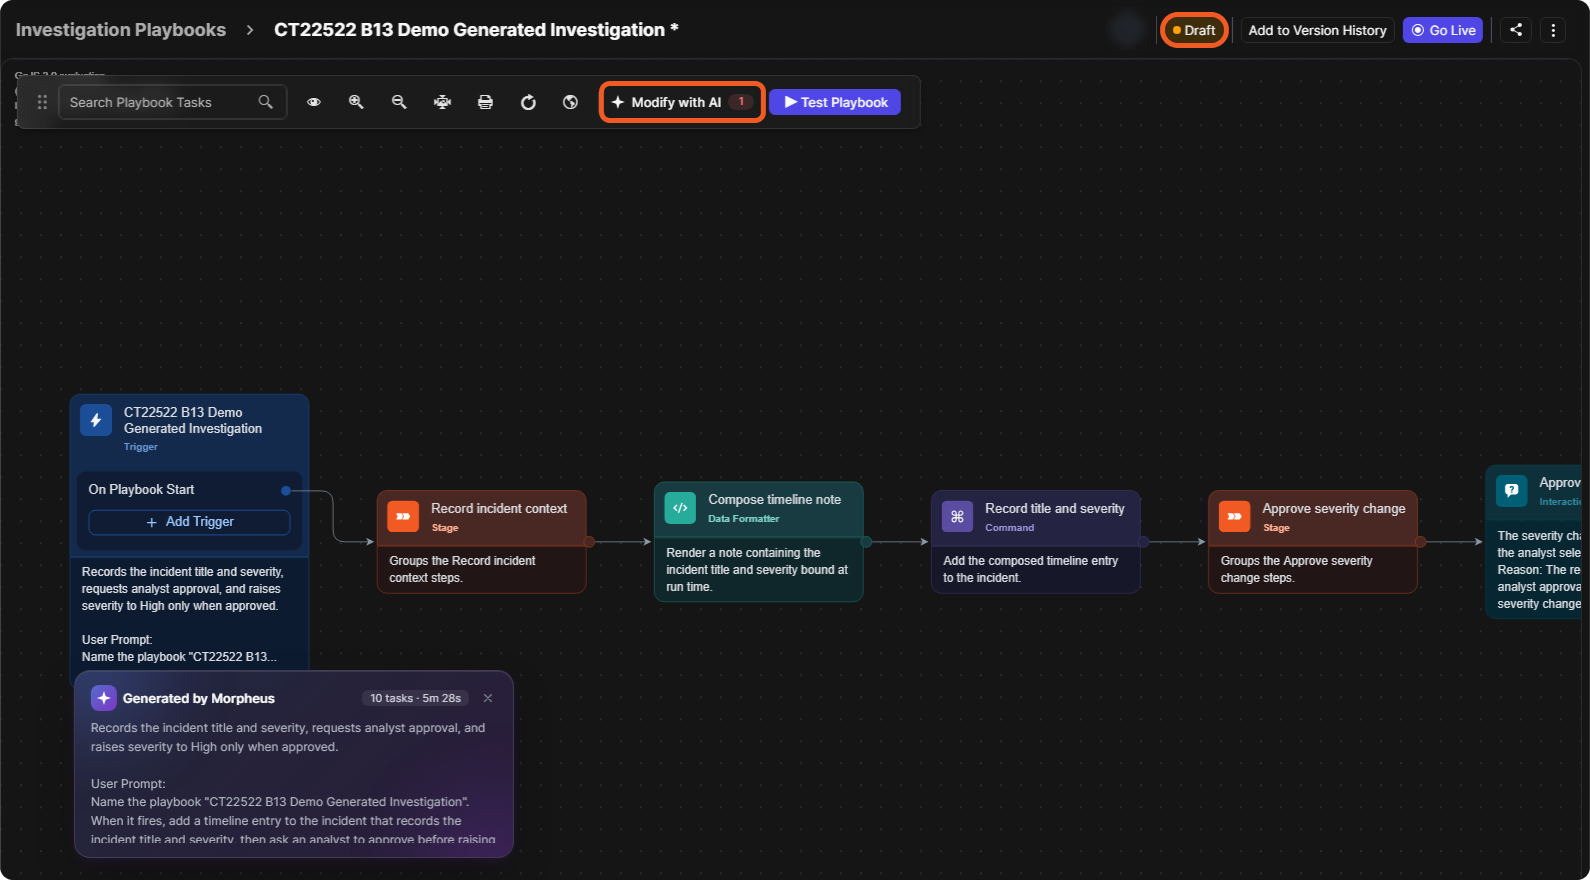
The Generating playbook window shows each step Morpheus works through and the time elapsed. It notes that this usually takes 10–20 minutes, and Cancel stops it. When it finishes, the playbook opens in the editor as a Draft. A Generated by Morpheus note sums up what the playbook does, with its number of tasks and your prompt.
A generated playbook
REVIEW BEFORE USE
Morpheus never runs actions on its own, and nothing runs until you enable the playbook. Check every task and test the playbook before you select Go Live. To change the draft, select Modify with AI in the toolbar: Morpheus can review the whole playbook and propose changes that you approve one by one, or you can describe the change yourself. You can also edit the tasks by hand.
Building It Manually
To build the playbook yourself instead, start from a blank playbook:
-
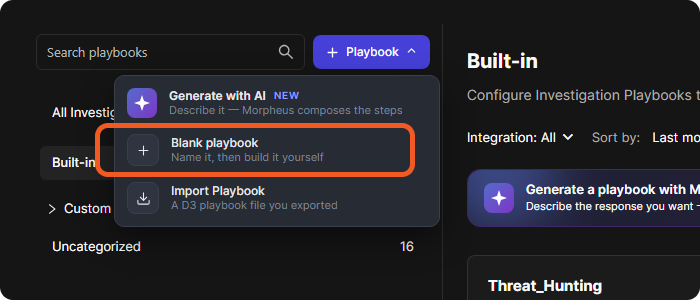
Select + Playbook. The menu offers Generate with AI (NEW), Blank playbook ("Name it, then build it yourself") and Import Playbook ("A D3 playbook file you exported").
The + Playbook menu
-
Choose Blank playbook.
-
In the New Playbook window, enter the Playbook Name, choose the Playbook Folder and select OK.
The New Playbook window
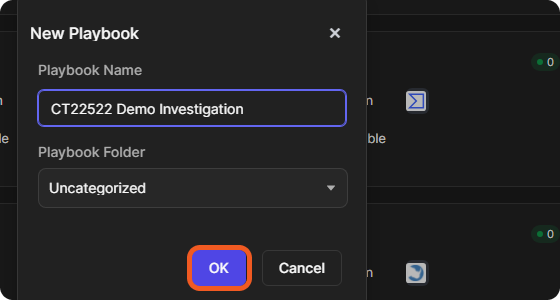
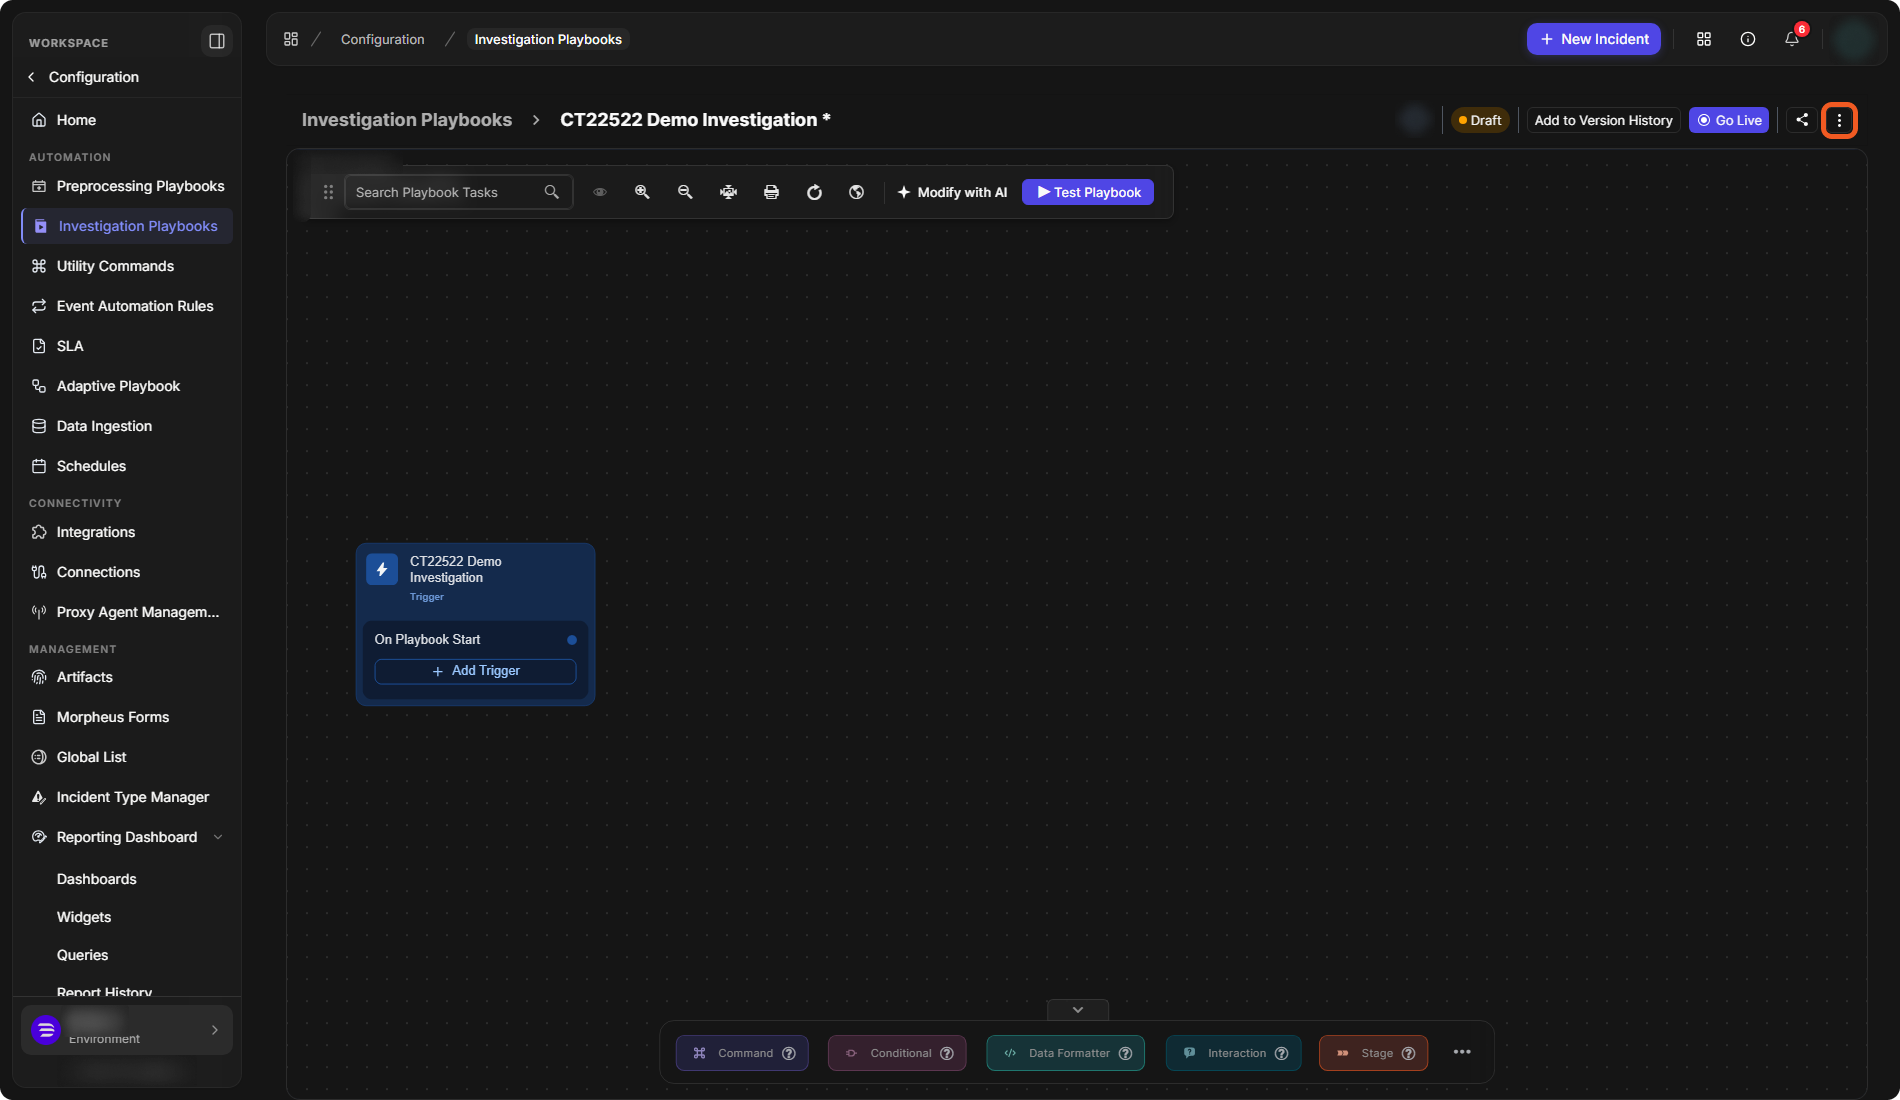
The playbook opens in the editor as a Draft, with one trigger task named after the playbook and its On Playbook Start trigger.
The Playbook Editor
A new investigation playbook in the editor
Header and Actions
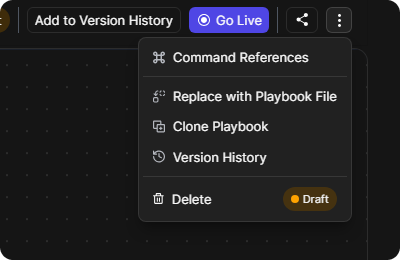
The header shows the playbook's name, an avatar for each user on the playbook, its status (Draft), Add to Version History and Go Live. The More button (⋮) opens Command References, Replace with Playbook File, Clone Playbook, Version History and Delete.
The More menu
Version History opens the Version History panel on the right.
Toolbar
The toolbar above the canvas has Search Playbook Tasks, the view buttons (Show Overview, Zoom In, Zoom Out, Zoom to Fit, Export, Refresh), Show Local Shared Data, Modify with AI and Test Playbook.
Triggers
Every task chain starts from a trigger. A new investigation playbook starts with On Playbook Start; Add Trigger adds another. For the triggers and when each runs, see Investigation Playbook Triggers.
Adding Tasks
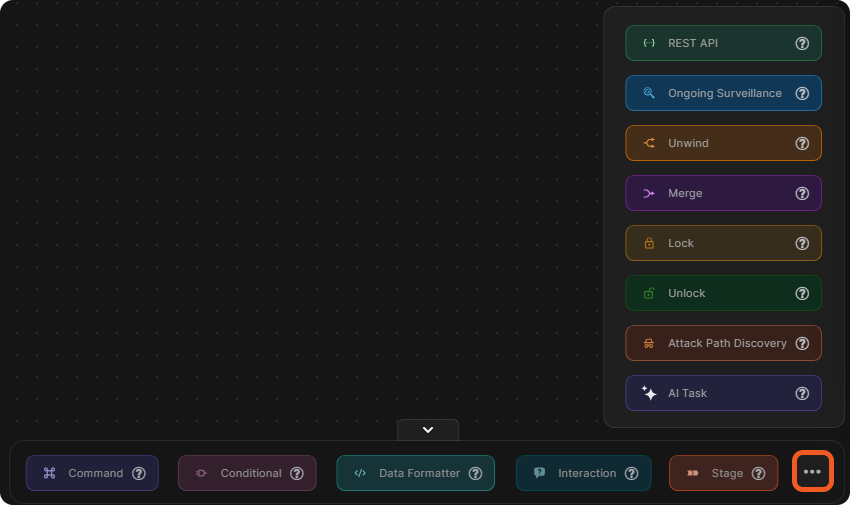
Drag a task from the task bar at the bottom of the canvas and drop it into the editor. The bar shows Command, Conditional, Data Formatter, Interaction and Stage; the ⋯ button adds REST API, Ongoing Surveillance, Unwind, Merge, Lock, Unlock, Attack Path Discovery and AI Task. Connect each task chain to a trigger.
More task types
For each task type and its settings, see Playbook Tasks. For sequencing, branching and loops, see Playbook Control Flow.
Task Options
Select a task to open its settings on the right. Besides its own inputs, a task has a Task Name and these options: Active, Stop on Error, Auto Run and Required, Assigned To, Due Time (Whole Numbers Only), Run Mode (for example Wait for Any, Run Always) and Description. The check mark button at the top of the settings applies them, and the delete button removes the task. For what each option does, see Playbook Tasks.
Task Statuses
During a test run, each task shows its status on the canvas. In a test where every task ran, each task showed a green check mark. For the full list of task statuses, see Playbook Tasks.
Local Shared Data
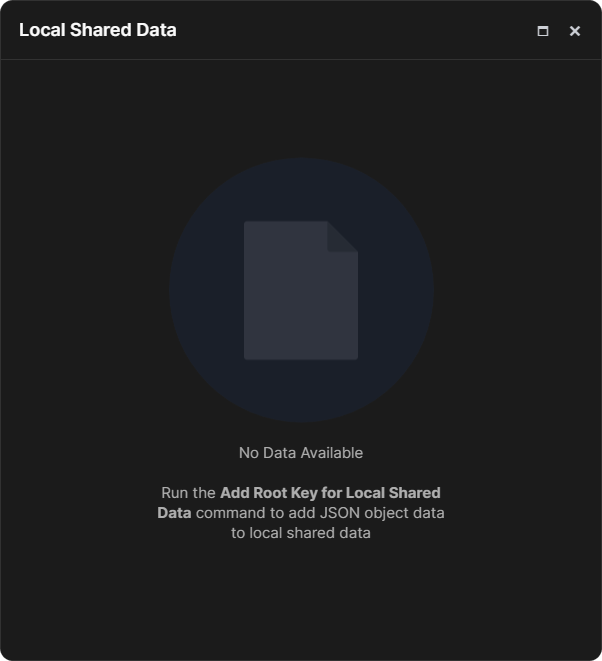
Show Local Shared Data opens the Local Shared Data window, which shows the JSON data stored for this playbook. When it is empty, it says to run the Add Root Key for Local Shared Data command to add JSON object data.
The Local Shared Data window
Testing an Investigation Playbook
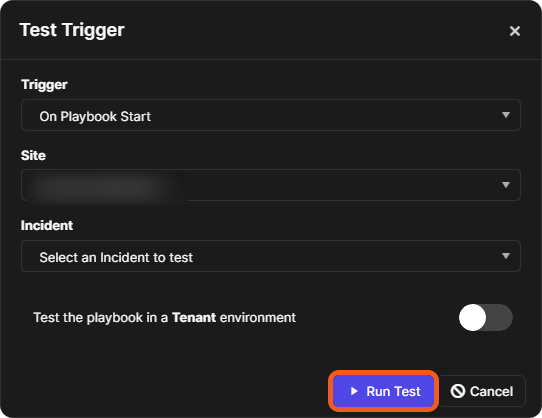
Select Test Playbook. In the Test Trigger window, choose the Trigger (for example On Playbook Start), the Site and the Incident to test with. Test the playbook in a Tenant environment switches the test to a tenant. Select Run Test, or Cancel.
The Test Trigger window
For testing in detail and re-running task nodes, see Playbook Testing and Task Node Re-runs.
Deleting an Investigation Playbook
-
Open the playbook and select More (⋮) > Delete.
-
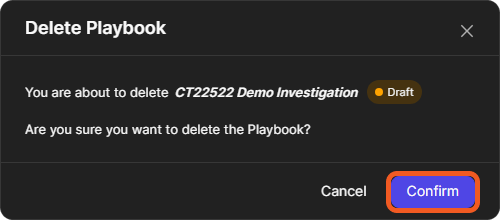
In the Delete Playbook window, select Confirm.
The Delete Playbook window